
Public Service Commission Non-advertised appointments by employment equity designated group: 2020-2021 update
Table of Contents
Background
The Public Service Commission’s (PSC) New Direction in Staffing (NDS) came into effect on April 1, 2016. It was intended to simplify and streamline staffing across the public service and provide a greater ability for organizations to customize staffing based on organizational needs.
As part of the NDS, the Appointment Delegation and Accountability Instrument – which sets out the terms and conditions for delegation of hiring authorities – requires deputy heads to “establish direction, through policy, planning or other means, on the use of advertised and non-advertised appointment processes.”
A common direction across organizations for using non-advertised processes is to support Employment Equity objectives.
This analysis was first conducted using 2018-2019 data. This report provides an update as of 2020-2021 and sheds more light on the trends following the implementation of the NDS.
Analysis
Non-advertised appointments over time
The number of non-advertised appointments per fiscal year increased since the implementation of the NDS. It increased from 9,038 in 2016-2017, to 22,967 in our last report in 2018-2019, and then to 31,881 in 2020-2021.
The proportion of appointments that were non-advertised began increasing after the NDS implementation: from 29.7% of all appointments in 2016-2017 to 45.9% in 2018-2019 and to 60.0% in 2020-2021. This indicates that the share of non-advertised appointments doubled since the implementation of the NDS (see Figure 1 and Table 1).
Figure 1: Proportion of non-advertised appointments among all appointments, PSEA Organisations, FY 2013-2014 to 2020-2021 (see Table 1)
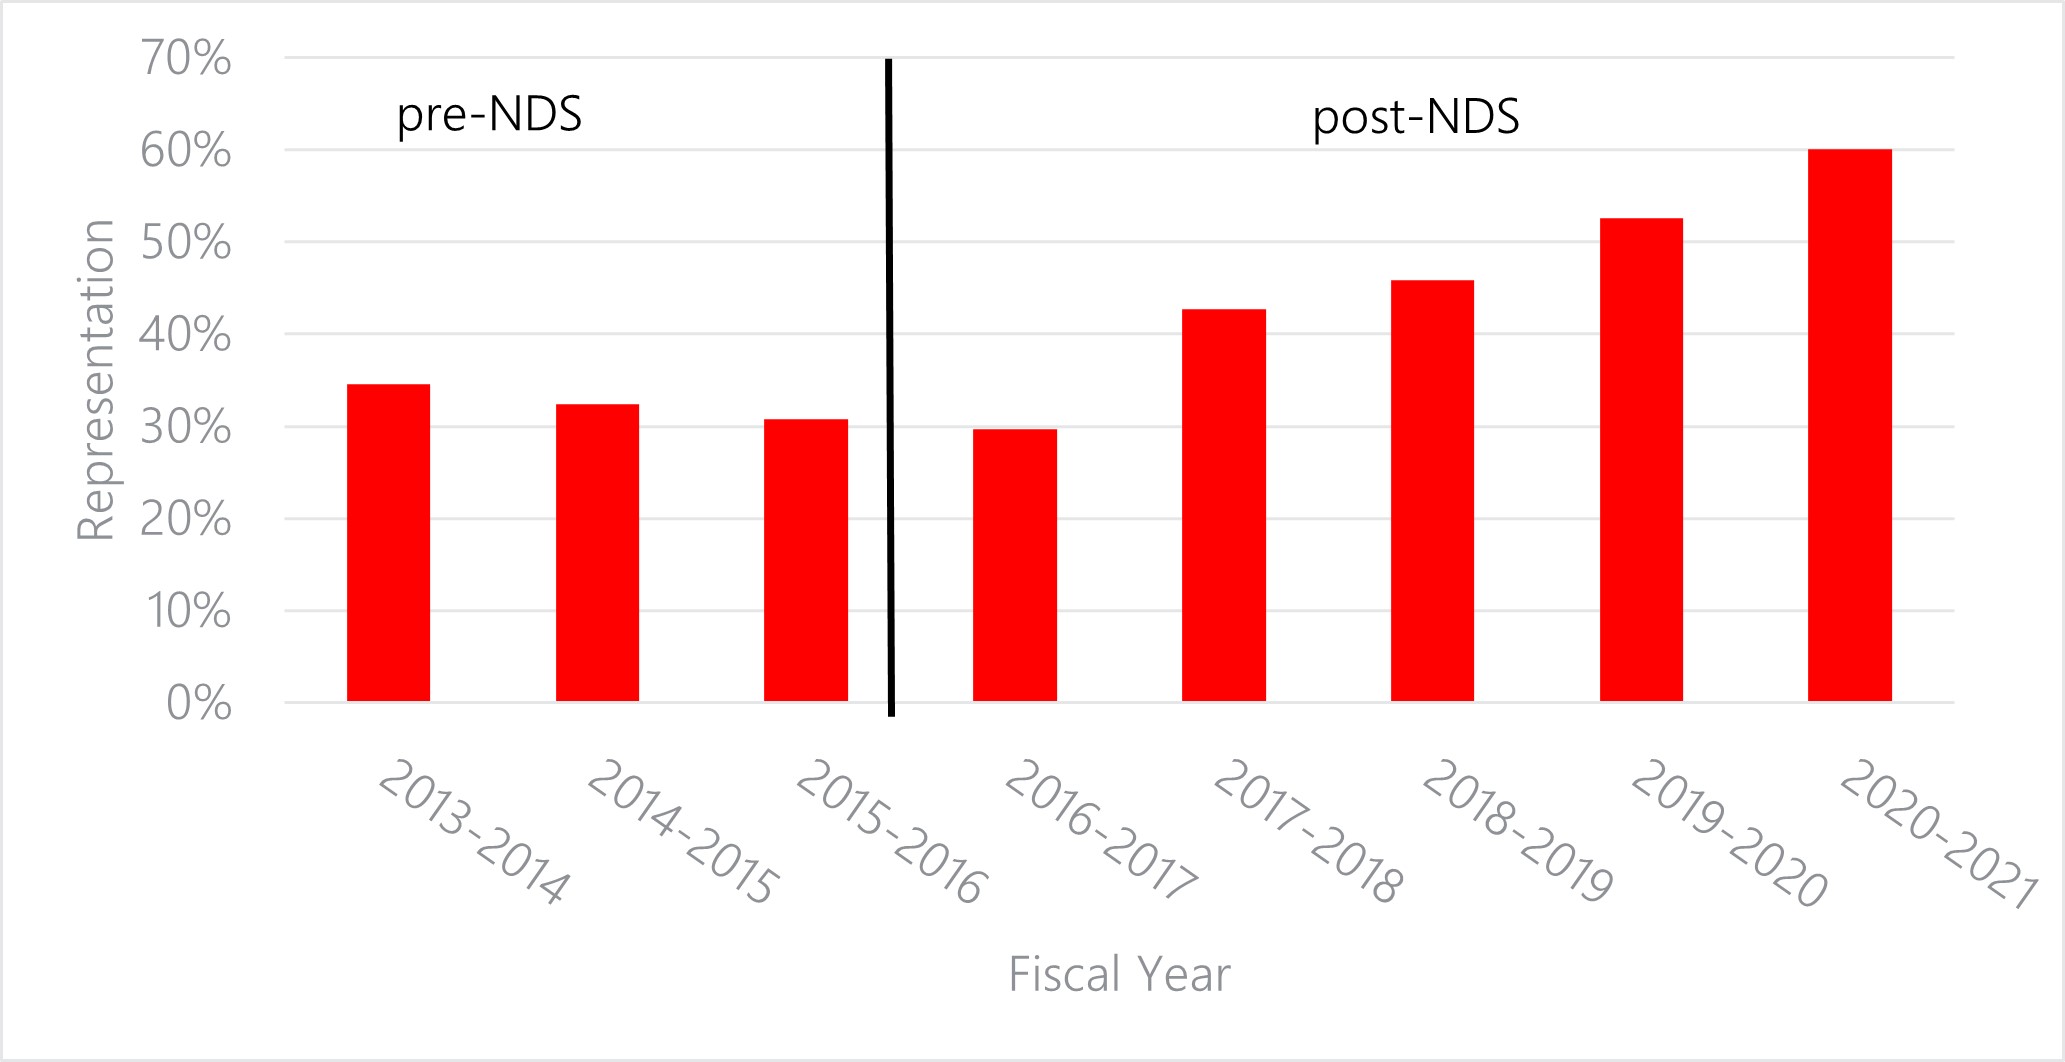
Text version
| Appointment type | 2013-2014 | 2014-2015 | 2015-2016 | 2016-2017 | 2017-2018 | 2018-2019 | 2019-2020 | 2020-2021 |
|---|---|---|---|---|---|---|---|---|
| Advertised Appointments | 12,408 (65.4%) |
16,660 (67.6%) |
18,291 (69.2%) |
21,393 (70.3%) |
24,146 (57.3%) |
27,061 (54.1%) |
25,491 (47.4%) |
21,218 (40.0%) |
| Non-advertised Appointments | 6,555 (34.6%) |
7,978 (32.4%) |
8,142 (30.8%) |
9,038 (29.7%) |
17,971 (42.7%) |
22,967 (45.9%) |
28,336 (52.6%) |
31,881 (60.0%) |
| Total | 18,963 | 24,638 | 26,433 | 30,431 | 42,117 | 50,028 | 53,827 | 53,099 |
Employment Equity representation in non-advertised appointments
To determine whether the increase in non-advertised appointments impacted employment equity designated groups (hereafter employment equity groups) members, we analyzed the representation of each employment equity group in non-advertised appointments, and we also compared non-advertised representation with the workforce availability (WFA)Footnote 1 for each Employment Equity (EE) group.
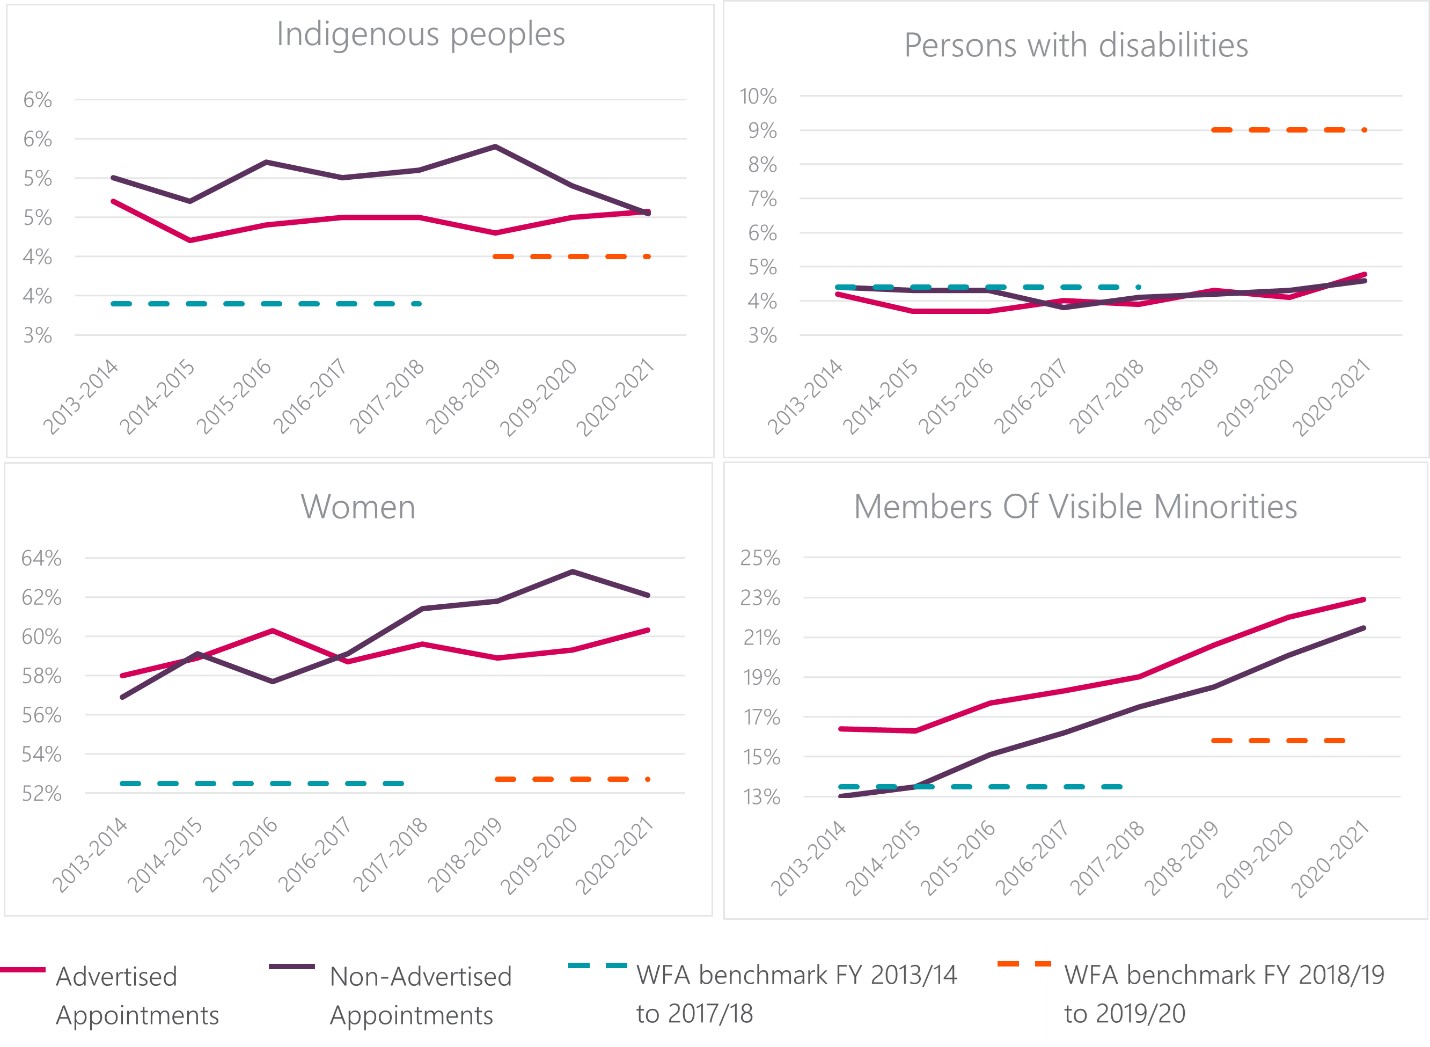
Figure 2 below shows the representation of employment equity groups in advertised and non-advertised appointments from 2013-2014 to 2020-2021. A general observation from this figure is that the increase in non-advertised appointments since 2016-2017 had no adverse effect on the appointment share for employment equity group members. This share either remained stable (Indigenous Peoples, Persons with Disabilities) or increased over time (Visible Minorities, Women). The following subsections examine each EE group individually with a closer look at the corresponding WFA levels.
Figure 2: Representation of employment equity groups in advertised and non-advertised appointments compared to the corresponding workforce availability, PSEA Organisations, FY 2013-2014 to 2020-2021 (see Tables 2-5)
Persons with disabilities
The representation of persons with disabilities in both advertised and non-advertised appointments remained relatively stable over the 2013-2014 to 2020-2021 period but is trending up slightly since 2016-2017. From 2013-2014 to 2017-2018, the representation of persons with disabilities in non-advertised appointments almost always fell below their WFA. In 2018-19, there was a methodological change in calculating the WFA for persons with disabilities, which increased from 4.4% to 9.0%. As a result, the representation of PWDs in non-advertised appointments remains below the WFA since 2018-2019. The gap between the representation in non-advertised appointments (4.6%) and the WFA (9.0%) was 4.4% in 2020-2021 (see Figure 2 and Table 2).
Women
From 2013-2014 to 2020-2021, the representation of women increased for both advertised and non-advertised appointments. The data presented in Figure 2 also illustrates that women had a higher representation than the corresponding WFA for both types of appointments for all years reported. For advertised appointments, women’s representation increased from 58.0% in 2013-2014, to 58.9% in 2018-2019, and then to 60.3% in 2020-2021 (see Table 3). Women’s representation in non-advertised appointments increased from 56.9%, to 61.8%, and 62.1% for the same periods (see Table 3).
Indigenous peoples
The representation of Indigenous peoples in both advertised and non-advertised appointments fluctuated slightly between 2013-2014 and 2020-2021 but has continuously been higher than the WFA (even after the increase in the Indigenous peoples’ WFA from 3.4% to 4% in 2018-2019). Indigenous peoples’ representation in advertised appointments fluctuated from 4.7% in 2013-2014, to 4.3% in 2018-2019, and then to 4.6% in 2020-2021 (see Table 4). Representation in non-advertised appointments fluctuated more during these periods starting with 5.0% in 2013-2014, to 5.4% in 2018-2019, and then to 4.5% in 2020-2021 (see Table 4).
Visible minorities (and subgroups)
The representation of visible minorities in non-advertised appointments has continuously increased from 2013-2014 to 2020-2021. This representation increased from 12.5% in 2013-2014, to 21.0% in 2020-2021. Except for 2013-2014, when the representation in non-advertised was 0.5 percentage point lower than the WFA, all other advertised and non-advertised representations reported in Table 5 were equal to or greater than the corresponding WFA. Even since the WFA for Visible Minorities increased from 13.0% to 15.3% in 2018-2019, the non-advertised representation of visible minority members remained over their WFA.
The representation of members of visible minorities in non-advertised appointments is systematically lower than its representation in advertised appointments since 2013-2014. The slightly larger increase in representation for members of visible minorities in non-advertised appointments has continued reducing the gap with visible minorities’ representation in advertised appointments (see Table 5). This gap decreased from 3.4 percentage points in 2013-2014 to 1.4 percentage points in 2020-2021.
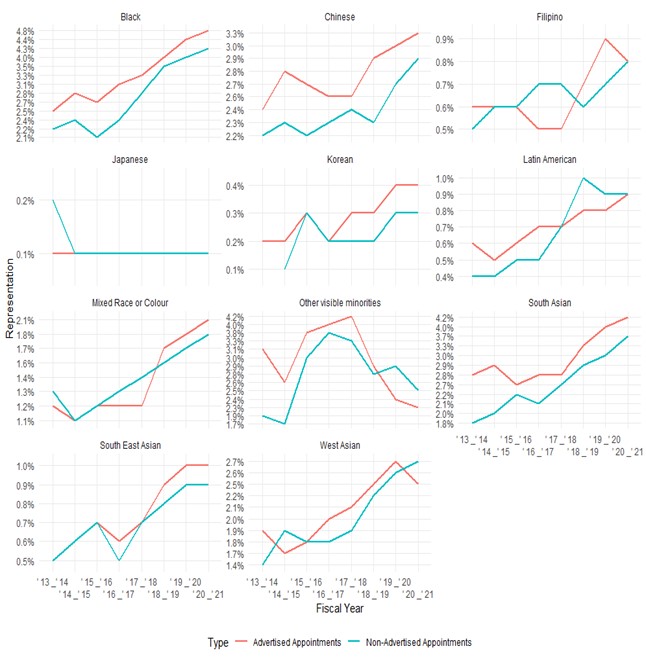
PSC’s data on advertised and non-advertised appointments allows for an analysis of representation shares for subgroups of visible minorities (as presented in Figure 3 and Table 6). Below are key observations from these results:
- The increase in non-advertised representation for members of visible minorities is occurring for most subgroups, except for members identified as Japanese for which the share remained consistent, and members of “other visible minorities” for which the representation in non-advertised appointments has been slightly decreasing since 2016-2017 (see Figure 3 and Table 6).
- The representation of Black public servants in both advertised and non-advertised appointments has increased steadily. The gap between advertised and non-advertised representations remained stable since the NDS (see Table 6):
- The representation of Black public servants in advertised appointments increased from 3.1% in 2016-2017, to 4.0% in 2018-2019, and then to 4.8% in 2020-2021.
- Their representation in non-advertised appointments increased from 2.4% in 2016-2017, to 3.5% in 2018-2019, and then to 4.3% in 2020-2021.
- Following this trend is the representation of South Asians, Chinese, mixed race public servants in both advertised and non-advertised appointments.
- For Latin Americans, West Asians and members of other visible minorities, the change in representation in non-advertised appointments since 2013-2014 contributed to closing an existing gap with the representation in advertised appointments (see Figure 3 below).
Figure 3: Representation of members of visible minorities by subgroup in non-advertised appointments, PSEA Organisations, FY 2013-2014 to 2020-2021Footnote 2 (see Table 6)
Conclusion
This updated report adds two years of data since the first report in 2018-2019. The general trends observed in 2018-2019 since the implementation of the NDS persisted in 2020-2021. As the proportion of non-advertised appointments continues to increase in the federal public sector now representing 60% of all appointments), we also continue to observe a sustained increase in the representation of women and members of visible minorities (including most of the sub-groups) in advertised and non-advertised appointments. This increase does not show for appointments of Indigenous peoples or persons with disabilities, which both present a relatively stable representation for all the years included in this report.
Annex 1 - Methodology
Results are based on the fiscal year in which the staffing activity was reflected in the pay system, like in the PSC’s Annual Report. When analyzing employment equity data, employees hired in term positions of less than three months are excluded, along with employees in separate agencies or in a training program.
The number of appointments to advertised positions includes:
- Advertisements open to the public
- Advertisements open only to current public servants
The number of appointments to non-advertised positions includes:
- Promotions
- Acting appointments greater than four months
- New public servant hires to indeterminate positions
- New public servant hires to term positions greater than three months
Appointment data comes from the Hiring and Staffing Activities Database. Only departments and agencies subject to the Public Service Employment Act (PSEA) mandate are included. Self-identification data comes from the Employment Equity Data Bank.
Annex 2 - Results
| Persons with Disabilities | 2013-2014 | 2014-2015 | 2015-2016 | 2016-2017 | 2017-2018 | 2018-2019 | 2019-2020 | 2020-2021 |
|---|---|---|---|---|---|---|---|---|
| Representation in advertised appointments | 4.2% | 3.7% | 3.7% | 4.0% | 3.9% | 4.3% | 4.1% | 4.8% |
| Representation in non-advertised appointments |
4.4% | 4.3% | 4.3% | 3.8% | 4.1% | 4.2% | 4.3% | 4.6% |
| WFA benchmark | 4.4% | 4.4% | 4.4% | 4.4% | 4.4% | 9.0% | 9.0% | 9.0% |
| Women | 2013-2014 | 2014-2015 | 2015-2016 | 2016-2017 | 2017-2018 | 2018-2019 | 2019-2020 | 2020-2021 |
|---|---|---|---|---|---|---|---|---|
| Representation in advertised appointments | 58.0% | 58.9% | 60.3% | 58.7% | 59.6% | 58.9% | 59.3% | 60.3% |
| Representation in non-advertised appointments |
56.9% | 59.1% | 57.7% | 59.1% | 61.4% | 61.8% | 63.3% | 62.1% |
| WFA benchmark | 52.5% | 52.5% | 52.5% | 52.5% | 52.5% | 52.7% | 52.7% | 52.7% |
| Indigenous peoples | 2013-2014 | 2014-2015 | 2015-2016 | 2016-2017 | 2017-2018 | 2018-2019 | 2019-2020 | 2020-2021 |
|---|---|---|---|---|---|---|---|---|
| Representation in advertised appointments | 4.7% | 4.2% | 4.4% | 4.5% | 4.5% | 4.3% | 4.5% | 4.6% |
| Representation in non-advertised appointments |
5.0% | 4.7% | 5.2% | 5.0% | 5.1% | 5.4% | 4.9% | 4.5% |
| WFA benchmark | 3.4% | 3.4% | 3.4% | 3.4% | 3.4% | 4.0% | 4.0% | 4.0% |
| Visible Minorities | 2013-2014 | 2014-2015 | 2015-2016 | 2016-2017 | 2017-2018 | 2018-2019 | 2019-2020 | 2020-2021 |
|---|---|---|---|---|---|---|---|---|
| Representation in advertised appointments | 15.9% | 15.8% | 17.2% | 17.8% | 18.5% | 20.1% | 21.5% | 22.4% |
| Representation in non-advertised appointments |
12.5% | 13.0% | 14.6% | 15.7% | 17.0% | 18.0% | 19.6% | 21.0% |
| WFA benchmark | 13.0% | 13.0% | 13.0% | 13.0% | 13.0% | 15.3% | 15.3% | 15.3% |
| Visible minority subgroup | Type of appointment | 2013-2014 | 2014-2015 | 2015-2016 | 2016-2017 | 2017-2018 | 2018-2019 | 2019-2020 | 2020-2021 |
|---|---|---|---|---|---|---|---|---|---|
| Black | Advertised | 2.5% | 2.8% | 2.7% | 3.1% | 3.3% | 4.0% | 4.4% | 4.8% |
| Black | Non- advertised | 2.2% | 2.4% | 2.1% | 2.4% | 2.8% | 3.5% | 4.0% | 4.3% |
| Chinese | Advertised | 2.4% | 2.8% | 2.7% | 2.6% | 2.6% | 2.9% | 3.0% | 3.3% |
| Chinese | Non- advertised | 2.2% | 2.3% | 2.2% | 2.3% | 2.4% | 2.3% | 2.6% | 2.9% |
| Filipino | Advertised | 0.6% | 0.6% | 0.6% | 0.5% | 0.5% | 0.7% | 0.9% | 0.8% |
| Filipino | Non- advertised | 0.5% | 0.6% | 0.6% | 0.7% | 0.7% | 0.6% | 0.7% | 0.8% |
| Japanese | Advertised | 0.1% | 0.1% | 0.1% | 0.1% | 0.1% | 0.1% | 0.1% | 0.1% |
| Japanese | Non- advertised | 0.2% | NA | NA | NA | 0.1% | 0.1% | 0.1% | 0.1% |
| Korean | Advertised | 0.2% | 0.2% | 0.3% | 0.2% | 0.3% | 0.3% | 0.4% | 0.4% |
| Korean | Non- advertised | NA | 0.1% | 0.3% | 0.2% | 0.2% | 0.2% | 0.3% | 0.3% |
| Latin American | Advertised | 0.6% | 0.5% | 0.6% | 0.7% | 0.7% | 0.8% | 0.8% | 0.9% |
| Latin American | Non- advertised | 0.4% | 0.4% | 0.5% | 0.5% | 0.7% | 1.0% | 0.8% | 0.9% |
| Members of other visible minorities | Advertised | 3.1% | 2.6% | 3.8% | 4.0% | 4.2% | 2.9% | 2.4% | 2.3% |
| Members of other visible minorities | Non- advertised | 1.9% | 1.7% | 3.0% | 3.8% | 3.3% | 2.8% | 2.9% | 2.5% |
| Person of Mixed Origin | Advertised | 1.2% | 1.1% | 1.2% | 1.2% | 1.2% | 1.7% | 1.8% | 2.1% |
| Person of Mixed Origin | Non- advertised | 1.3% | 1.1% | 1.2% | 1.3% | 1.4% | 1.6% | 1.7% | 1.8% |
| South Asian | Advertised | 2.8% | 2.9% | 2.7% | 2.8% | 2.8% | 3.3% | 4.0% | 4.2% |
| South Asian | Non- advertised | 1.8% | 2.0% | 2.2% | 2.1% | 2.7% | 2.9% | 3.0% | 3.7% |
| Southeast Asian | Advertised | 0.5% | 0.6% | 0.7% | 0.6% | 0.7% | 0.9% | 1.0% | 1.0% |
| Southeast Asian | Non- advertised | 0.5% | 0.6% | 0.7% | 0.5% | 0.7% | 0.8% | 0.9% | 0.9% |
| West Asian | Advertised | 1.9% | 1.7% | 1.8% | 2.0% | 2.1% | 2.5% | 2.7% | 2.5% |
| West Asian | Non- advertised | 1.4% | 1.9% | 1.8% | 1.8% | 1.9% | 2.2% | 2.6% | 2.7% |
NA: Due to confidentiality, data from subgroups with less than 10 appointees were suppressed.