
Annex II: Early career researcher data for flagship investigator-initiated research grant competitions
Each agency has provided an update to last year’s report, providing data from the 2020 and 2021 competition years from their flagship investigator-initiated research programs, based on grant amounts committed at the time of offer.
CIHR has included data from the Open Operating Grant program, which ran from 2000 to 2015, and the Project Grant program, which began in 2016.
NSERC has included data from the Discovery Grants program. The Discovery Launch Supplements, which began in 2018, are included for 2020 and 2021.
SSHRC has included data from two funding opportunities separately. The first table includes data for the Insight Development Grants funding opportunity, which began in 2011; the second table includes data for the Insight Grants funding opportunity, which began in 2012.
The CFI has included data from the John R. Evans Leaders Fund.
Canadian Institutes of Health Research
Project Grants are designed to support people at any career stage to build and conduct health-related research and knowledge translation projects while capturing ideas with the greatest potential for important advances in fundamental or applied health-related knowledge, health care, health systems and/or health outcomes. There are two Project Grants competitions per year (spring and fall). Grant values and durations are proportionate to the requirements of the research proposed and vary depending on the research field, research approach and scope of project activities: they are not explicitly capped.
At CIHR, an early career researcher (ECR) has historically been one who, at the time of application, has held a full-time, independent research appointment for a period of up to five years (60 months), excluding leaves of absence. ECR status was validated only for project competitions. ECRs in Open Operating Grant program competitions (2014 to 2015) were considered those within five years of the date of their last degree. Within the overall competition budget, there is a specific funding envelope to ensure the proportion of grants going to ECRs is at least equal to the proportion of applications submitted by ECRs. Competition processes and peer review for this cohort are fully integrated in the entire competition, with no additional steps required on the part of applicants.
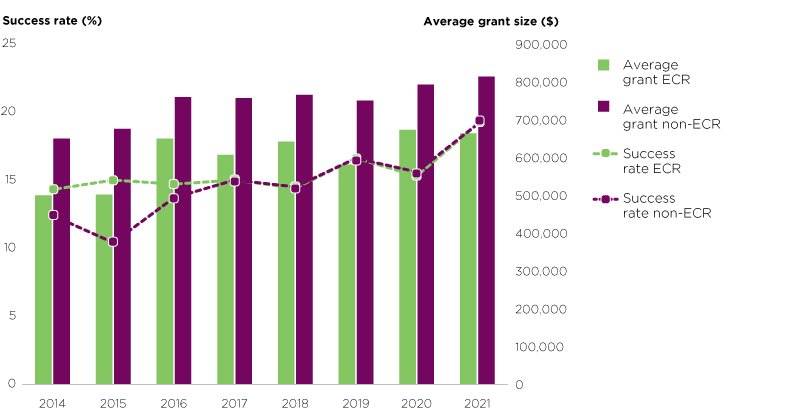
Figure 1: Canadian Institutes of Health Research success rates (lines) and average grant sizes (bars) for early career researchers and non-early career researchers for Open Operating Grant program and Project Grants from 2014 to 2021
Description of Figure 1
Using a line graph and a vertical bar graph, this figure shows CIHR’s success rates and average grant sizes for early career researchers (ECRs) and established researchers for the Open Operating Grant program and the Project Grants program, from 2014 to 2021. The first y-axis, to the left side, shows the success rates, in percentages, from 0 to 25%. The second y-axis, to the right side shows the average grant sizes, in dollars, from $0 to $900,000. The x-axis lists each year from 2014 to 2021.
CIHR’s success rates and average grant sizes for ECRs and for established researchers for the Open Operating Grant Program and Project Grants program, from 2014 to 2021, were as follows:
- In 2014, the success rate was 12.4% for ECRs and 14.3% for established researchers. The average grant size was $499,585 for ECRs and $649,479 for established researchers.
- In 2015, the success rate was 10.4% for ECRs and 15.0% for established researchers. The average grant size was $501,453 for ECRs and $675,264 for established researchers.
- In 2016, the success rate was 13.7% for ECRs and 14.7% for established researchers. The average grant size was $649,423 for ECRs and $759,156 for established researchers.
- In 2017, the success rate was 15.0% for both early career and established researchers. The average grant size was $606,909 for ECRs and $756,462 for established researchers.
- In 2018, the success rate was 14.5% for early career researchers and 14.4% for established researchers. The average grant size was $641,404 for early career researchers and $765,262 for established researchers.
- In 2019, the success rate was 16.6% for both early career and established researchers. The average grant size was $581,139 for early career researchers and $750,253 for established researchers.
- In 2020, the success rate was 15.6% for ECRs and 15.3% for established researchers. The average grant size was $673,052 for ECRs and $792,275 for established researchers.
- In 2021, the success rate was 19.1% for both early career and established researchers. The average grant size was $663,380 for ECRs and $813,471 for established researchers.
| Open Operating Grant Program and Project Grants | 2014 | 2015 | 2016 | 2017 | 2018 | 2019 | 2020 | 2021 |
|---|---|---|---|---|---|---|---|---|
| Number of applications—ECRs | 445 | 403 | 1,515 | 821 | 1,130 | 1,016 | 1,121 | 1,139 |
| Number of applications—total | 2,862 | 2,682 | 6,697 | 3,415 | 5,117 | 4,629 | 4,489 | 4,395 |
| % of all applications | 15.5% | 15.0% | 22.6% | 24.0% | 22.1% | 21.9% | 25.0% | 25.9% |
| Success rate—ECRs | 12.4% | 10.4% | 13.7% | 15.0% | 14.5% | 16.6% | 15.6% | 19.1% |
| Success rate—established researchers | 14.3% | 15.0% | 14.7% | 15.0% | 14.4% | 16.6% | 15.3% | 19.1% |
| Average grant—ECRs | $499,585 | $501,453 | $649,423 | $606,909 | $641,404 | $581,139 | $673,052 | $663,380 |
| Average grant—established researchers | $649,479 | $675,264 | $759,156 | $756,462 | $765,262 | $750,253 | $792,275 | $813,471 |
| Total Open Operating Grant Program / Project Grant program funds awarded—ECRs | $27,477,201 | $21,061,029 | $134,430,504 | $74,649,750 | $105,190,260 | $98,212,527 | $117,784,111 | $144,616,856 |
| Total Open Operating Grant Program / Project Grant funds awarded | $251,547,297 | $251,326,181 | $711,389,291 | $368,913,660 | $545,981,020 | $547,613,842 | $526,597,846 | $649,782,320 |
| % of funds to ECRs | 10.9% | 8.4% | 18.9% | 20.2% | 19.3% | 17.9% | 22.4% | 22.3% |
| Average grant (per year of grant)—ECRs | $122,025 | $122,894 | $151,524 | $142,565 | $145,751 | $140,158 | $155,533 | $152,109 |
| Average grant (per year of grant)—established researchers | $145,307 | $146,186 | $167,376 | $169,043 | $169,984 | $166,980 | $174,951 | $179,988 |
| Total Open Operating Grant Program / Project Grant program funds awarded—ECRs (per year of grant) | $6,711,363 | $5,161,554 | $31,365,461 | $17,535,442 | $23,903,223 | $23,686,639 | $27,218,346 | $33,159,544 |
| Total Open Operating Grant Program / Project Grant program funds awarded (per year of grant) | $56,842,202 | $55,010,876 | $158,571,008 | $83,293,027 | $121,814,153 | $123,707,806 | $117,492,829 | $144,932,544 |
| % of funds to ECRs | 11.8% | 9.4% | 19.8% | 21.1% | 19.6% | 19.1% | 23.2% | 22.9% |
Natural Sciences and Engineering Research Council
NSERC Discovery Grants support ongoing programs of research with long-term goals rather than a single, short-term project or collection of projects. Discovery Grants are five-year grants. There is one Discovery Grants competition per year. Individuals can apply for and hold only one Discovery Grant at a time. Discovery Grant holders cannot reapply for another until the last year of their current award.
Individuals submitting an application are categorized as either ECRs or established researchers. From 2014 to 2016, ECRs were defined as people within two years of the start date of their first eligible position at a university with no prior academic or non-academic independent research experience. From 2017 to 2018, the ECR eligibility window was increased to three years; in 2019, it was increased to five years. In all years reported, the window for being considered an ECR could be adjusted to include instances when they had an eligible delay in research (owing to illness, parental leave, etc.).
While applications from ECRs are evaluated against the same three selection criteria as established researchers, it is recognized that individuals applying early in their career may not have had the opportunity to make the same levels of contribution to training as established researchers. For this reason, NSERC implements a different quality cut-off for funding ECRs, ensures the overall ECR success rate is at least 50%, and offers additional sources of support to those awarded a Discovery Grant. These include:
- an annual $5,000 top-up on their Discovery Grant;
- the Discovery Launch Supplement, introduced in 2018, a one-time award valued at $12,500; and
- since 2017, offering ECRs scheduled to apply for their second Discovery Grant the option of accepting an additional year of funding on their existing Discovery Grant at the same level.
In comparison to previous years, increases in funds awarded to ECRs in 2018 and later reflect the Discovery Launch Supplements and the additional year of funding. In addition to the flagship Discovery Grants program, NSERC also devotes funds to a number of Discovery funding programs, many of which provide support to ECRs.
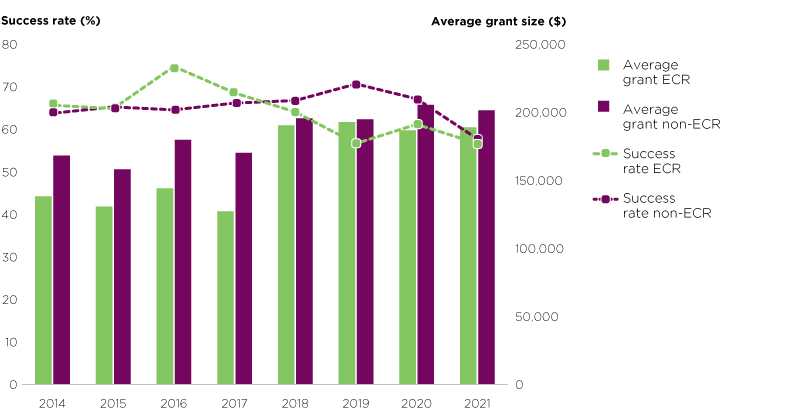
Figure 2: Natural Sciences and Engineering Research Council success rates (lines) and average grant sizes (bars) for early career researchers and non-early career researchers for Discovery Grants from 2014 to 2021
Description of Figure 2
Using a line graph and a vertical bar graph, this figure shows NSERC’s Discovery Grants success rates and average grant sizes for early career researchers (ECRs) and established researchers from 2014 to 2021. The first y-axis, to the left side, shows the success rates, in percentages, from 0 to 80%. The second y-axis, to the right side, shows the average grant sizes, in dollars, from $0 to $250,000. The x-axis lists each year from 2014 to 2021.
NSERC’s Discovery Grants success rates and average grant sizes, from 2014 to 2021, for ECRs and for established researchers, were as follows:
- In 2014, the success rate was 65.6% for ECRs and 63.7% for established researchers. The average grant size was $138,073 for ECRs and $168,017 for established researchers.
- In 2015, the success rate was 64.8% for ECRs and 65.2% for established researchers. The average grant size was $130,553 for ECRs and $157,924 for established researchers.
- In 2016, the success rate was 74.7% for ECRs and 64.5% for established researchers. The average grant size was $143,855 for ECRs and $179,571 for established researchers.
- In 2017, the success rate was 68.5% for ECRs and 66.1% for established researchers. The average grant size was $127,043 for ECRs and $169,937 for established researchers.
- In 2018, the success rate was 64.0% for ECRs and 66.7% for established researchers. The average grant size was $190,094 for ECRs and $195,366 for established researchers.
- In 2019, the success rate was 56.6% for ECRs and 70.6% for established researchers. The average grant size was $192,549 for ECRs and $194,672 for established researchers.
- In 2020, the success rate was 61.1% for ECRs and 67.1% for established researchers. The average grant size was $186,540 for ECRs and $205,158 for established researchers.
- In 2021, the success rate was 56.6% for ECRs and 57.7% for established researchers. The average grant size was $188,798 for ECRs and $201,134 for established researchers.
| Discovery Grants | 2014 | 2015 | 2016 | 2017 | 2018 | 2019 | 2020 | 2021 |
|---|---|---|---|---|---|---|---|---|
| Number of applications—ECRs | 427 | 489 | 494 | 562 | 677 | 882 | 889 | 866 |
| Number of applications—total | 3,134 | 3,159 | 3,167 | 3,240 | 3,213 | 3,404 | 3,372 | 2,008 |
| % of all applications | 13.6% | 15.5% | 15.6% | 17.3% | 21.1% | 25.9% | 26.4% | 43.1% |
| Success rate—ECRs | 65.6% | 64.8% | 74.7% | 68.5% | 64.0% | 56.6% | 61.1% | 56.6% |
| Success rate—established researchers | 63.7% | 65.2% | 64.5% | 66.1% | 66.7% | 70.6% | 67.1% | 57.7% |
| Average grant—ECRs | $138,073 | $130,553 | $143,855 | $127,043 | $190,094 | $192,549 | $186,540 | $188,798 |
| Average grant—established researchers | $168,017 | $157,924 | $179,571 | $169,937 | $195,366 | $194,672 | $205,158 | $201,134 |
| Total Discovery Grants funds awarded—ECRs | $38,660,539 | $41,385,170 | $53,082,500 | $48,911,515 | $82,310,534 | $96,081,926 | $101,291,334 | $92,510,996 |
| Total Discovery Grants funds awarded | $328,489,387 | $316,489,081 | $362,842,820 | $349,530,120 | $412,869,600 | $442,598,291 | $443,084,989 | $225,058,041 |
| % of funds to ECRs | 12.0% | 13.1% | 14.6% | 14.0% | 19.9% | 21.7% | 22.9% | 41.1% |
| Average grant (per year of grant)—ECRs | $27,723 | $26,120 | $28,771 | $25,409 | $32,099 | $32,508 | $31,509 | $31,883 |
| Average grant (per year of grant)—established researchers | $35,513 | $32,903 | $37,135 | $34,948 | $40,355 | $40,071 | $41,032 | $40,227 |
| Total Discovery Grants funds awarded—ECRs (first year of grant) | $8,137,508 | $8,280,084 | $10,616,500 | $9,782,303 | $13,898,839 | $16,221,571 | $17,108,139 | $15,622,666 |
| Total Discovery Grants funds awarded (first year of grant) | $70,208,877 | $65,870,975 | $74,674,964 | $71,605,024 | $82,179,749 | $87,547,244 | $85,466,870 | $42,132,075 |
| % of funds to ECRs | 11.6% | 12.6% | 14.2% | 13.7% | 16.9% | 18.5% | 20.0% | 37.1% |
Social Sciences and Humanities Research Council
Insight Development Grants support the development of new research in its initial stages. Applications are project-based and may be submitted by individual researchers or research teams. Insight Development Grants are valued at up to $75,000 over one to two years.
Within the Insight Development Grants funding opportunity, funding is available for two distinct categories of scholars: emerging scholars and established scholars. Emerging scholars may submit projects that build on and further the applicant’s (or team’s) graduate work and/or represent a continuation of their overall research trajectory. Applications by established scholars must explore new research questions and/or approaches that are distinct from the applicant’s previous/ongoing research. Emerging scholar status is validated for Insight Development Grants and at least 50% of funds are reserved for applications from emerging scholars. The emerging scholar category is used as a proxy for ECRs within the Insight Development Grants funding opportunity.
When applying, emerging scholars must demonstrate that they have not successfully applied, as principal investigator or project director, for a grant offered through SSHRC, NSERC or CIHR. In addition, they must meet at least one of the following criteria:
- have completed their highest degree no more than six years before the competition deadline (SSHRC considers only the date of completion of the first doctorate);
- have held a tenured or tenure-track postsecondary appointment for less than six years;
- have held a postsecondary appointment, but never a tenure-track position (in the case of institutions that offer tenure-track positions); or
- have had their careers significantly interrupted or delayed for health or family reasons within the past six years.
Insight Grants support long-term, investigator-driven research excellence in the social sciences and humanities. Applications are project-based and may be submitted by individual researchers or research teams. Insight Grants are valued at $7,000 to $100,000 per year over two to five years, up to a total of $400,000. Two funding streams are available, depending on the scale of the proposed project:
- Stream A for requests between $7,000 to $100,000; and
- Stream B for requests between $100,000 to $400,000.
Insight Grants are available to both emerging and established scholars. There is no reserved budget envelope for emerging scholars within Insight Grants, as the Insight Development Grants emerging scholars stream serves this purpose. Neither emerging scholar nor ECR status is validated within the scope of the Insight Grants funding opportunity. Instead, a proxy is used to identify ECRs. Applicants who have completed their first highest degree no more than six years before the competition deadline are identified as ECRs.
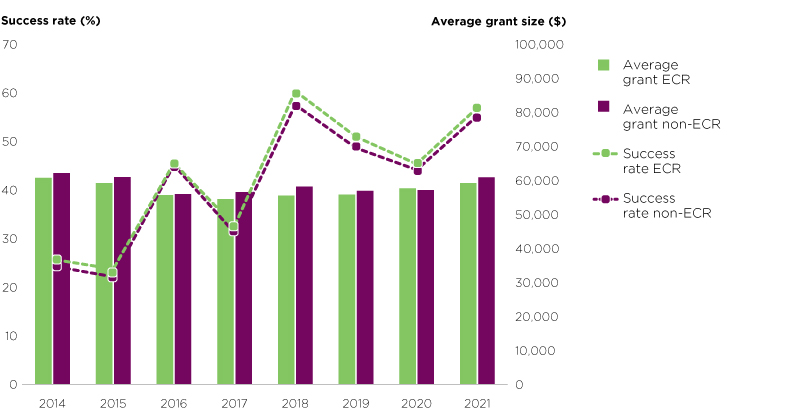
Figure 3: Social Sciences and Humanities Research Council success rates (lines) and average grant sizes (bars) for early career researchers and non-early career researchers for Insight Development Grants from 2014 to 2021
Description of Figure 3
Using a line graph and a vertical bar graph, this figure shows SSHRC’s Insight Development Grants success rates and average grant sizes for early career researchers (ECRs) and established researchers from 2014 to 2021. The first y-axis, to the left side, shows the success rate, in percentages, from 0 to 70%. The second y-axis, to the right side, shows the average grant sizes, in dollars, from $0 to $100,000. The x-axis lists each year from 2014 to 2021.
SSHRC’s Insight Development Grant success rates and average grant sizes, from 2014 to 2021, for ECRs and for established researchers, were as follows:
- In 2014, the success rate was 25.7% for ECRs and 24.3% for established researchers. The average grant size was $60,643 for ECRs and $62,048 for established researchers.
- In 2015, the success rate was 23.7% for ECRs and 22.1% for established researchers. The average grant size was $59,123 for ECRs and $60,869 for established researchers.
- In 2016, the success rate was 45.5% for ECRs and 45.1% for established researchers. The average grant size was $55,604 for ECRs and $55,862 for established researchers.
- In 2017, the success rate was 32.6% for ECRs and 31.1% for established researchers. The average grant size was $54,372 for ECRs and $56,476 for established researchers.
- In 2018, the success rate was 60.3% for ECRs and 57.5% for established researchers. The average grant size was $55,434 for ECRs and $58,087 for established researchers.
- In 2019, the success rate was 50.9% for ECRs and 48.6% for established researchers. The average grant size was $55,694 for ECRs and $56,849 for established researchers.
- In 2020, the success rate was 45.3% for ECRs and 44.1% for established researchers. The average grant size was $57,567 for ECRs and $57,050 for established researchers.
- In 2021, the success rate was 56.9% for ECRs and 55.2% for established researchers. The average grant size was $59,089 for ECRs and $60,776 for established researchers.
| Overall | 2014 | 2015 | 2016 | 2017 | 2018 | 2019 | 2020 | 2021 |
|---|---|---|---|---|---|---|---|---|
| Number of applications—ECRs | 1,055 | 1,026 | 970 | 1,013 | 1,000 | 884 | 960 | 905 |
| Number of applications—total | 3,271 | 3,225 | 2,912 | 2,749 | 2,675 | 2,493 | 2,681 | 2,288 |
| % of all applications | 32.3% | 31.8% | 33.3% | 36.8% | 37.4% | 35.5% | 35.8% | 37.9% |
| Total Insight Development Grants / Insight Grants funds awarded—ECRs | $22,633,881 | $19,972,111 | $27,464,866 | $23,579,015 | $39,941,520 | $29,049,725 | $30,550,140 | $36,237,645 |
| Total Insight Development Grants / Insight Grants funds awarded | $115,651,421 | $98,888,444 | $110,634,127 | $114,577,848 | $139,711,962 | $122,615,958 | $129,715,263 | $143,453,836 |
| % of funds to ECRs | 19.6% | 20.2% | 24.8% | 20.6% | 28.6% | 23.7% | 23.6% | 25.3% |
| Insight Development Grants | ||||||||
| Number of applications—ECRs | 762 | 799 | 803 | 853 | 798 | 739 | 782 | 751 |
| Number of applications—total | 1,128 | 1,237 | 1,211 | 1,236 | 1,139 | 1,128 | 1,256 | 1,175 |
| % of all applications | 67.6% | 64.6% | 66.3% | 69.0% | 70.1% | 65.5% | 62.3% | 63.9% |
| Success rate—ECRs | 25.7% | 23.7% | 45.5% | 32.6% | 60.3% | 50.9% | 45.3% | 56.9% |
| Success rate—established researchers | 24.3% | 22.1% | 45.1% | 31.1% | 57.5% | 48.6% | 44.1% | 55.2% |
| Average grant—ECRs | $60,643 | $59,123 | $55,604 | $54,372 | $55,434 | $55,694 | $57,567 | $59,089 |
| Average grant—established researchers | $62,048 | $60,869 | $55,862 | $56,476 | $58,087 | $56,849 | $57,050 | $60,776 |
| Total funds awarded—ECRs | $11,886,052 | $11,174,264 | $20,295,306 | $15,115,320 | $26,663,844 | $20,940,988 | $20,378,648 | $25,231,168 |
| Total Insight Development Grants funds awarded | $17,408,342 | $17,078,587 | $30,573,895 | $21,835,969 | $38,048,922 | $31,685,401 | $32,302,006 | $39,452,804 |
| % of funds to ECRs | 68.3% | 65.4% | 66.4% | 69.2% | 70.1% | 66.1% | 63.1% | 64.0% |
| Average grant (per year of grant)—ECRs | $30,629 | $29,695 | $27,872 | $27,180 | $28,016 | $27,950 | $28,995 | $29,787 |
| Average grant (per year of grant)—established researchers | $31,649 | $30,592 | $28,101 | $28,599 | $29,419 | $29,482 | $28,805 | $31,188 |
| Total funds awarded—ECRs (per average duration of grant) | $5,926,653 | $5,538,089 | $10,103,675 | $7,542,462 | $13,543,093 | $10,512,432 | $10,232,683 | $12,674,951 |
| Total Insight Development Grants funds awarded (per average duration of grant) | $8,680,117 | $8,490,250 | $15,232,059 | $10,902,787 | $19,324,171 | $15,984,153 | $16,237,526 | $19,891,917 |
| % of funds to ECRs | 68.3% | 65.2% | 66.3% | 69.2% | 70.1% | 66.1% | 63.1% | 64.0% |
| Insight Grants | ||||||||
| Number of applications—ECRs | 293 | 227 | 167 | 160 | 202 | 145 | 178 | 154 |
| Number of applications—total | 2,143 | 1,988 | 1,701 | 1,513 | 1,536 | 1,365 | 1,425 | 1,213 |
| % of all applications | 13.7% | 11.4% | 9.8% | 10.6% | 13.2% | 10.6% | 12.5% | 12.7% |
| Success rate—ECRs | 18.4% | 20.7% | 28.7% | 31.3% | 47.5% | 43.4% | 41.0% | 48.1% |
| Success rate—established researchers | 23.8% | 23.7% | 31.4% | 40.9% | 47.3% | 46.1% | 44.2% | 53.2% |
| Average grant—ECRs | $199,034 | $187,188 | $149,366 | $169,274 | $138,309 | $128,710 | $139,336 | $148,736 |
| Average grant—established researchers | $198,853 | $174,670 | $151,540 | $152,127 | $140,072 | $147,108 | $158,334 | $165,177 |
| Total funds awarded—ECRs | $10,747,829 | $8,797,847 | $7,169,560 | $8,463,695 | $13,277,676 | $8,108,737 | $10,171,492 | $11,006,477 |
| Total Insight Grants funds awarded | $98,243,079 | $81,809,857 | $80,060,232 | $92,741,879 | $101,663,040 | $90,930,557 | $97,413,257 | $104,001,032 |
| % of funds to ECRs | 10.9% | 10.8% | 9.0% | 9.1% | 13.1% | 8.9% | 10.4% | 10.6% |
| Average grant (per year of grant)—ECRs | $50,625 | $45,437 | $37,895 | $39,220 | $36,524 | $34,498 | $37,947 | $40,403 |
| Average grant (per year of grant)—established researchers | $48,947 | $42,830 | $37,925 | $37,349 | $36,316 | $37,422 | $40,267 | $41,296 |
| Total funds awarded—ECRs (per average duration of grant) | $2,712,069 | $2,164,915 | $1,820,841 | $1,941,214 | $3,521,152 | $2,155,487 | $2,719,850 | $2,961,743 |
| Total Insight Grants funds awarded (per average duration of grant) | $24,145,314 | $19,969,335 | $19,818,373 | $22,460,343 | $26,605,122 | $23,338,470 | $24,729,810 | $26,425,472 |
| % of funds to ECRs | 11.2% | 10.8% | 9.2% | 8.6% | 12.8% | 8.7% | 10.4% | 10.6% |
Canada Foundation for Innovation
The John R. Evans Leaders Fund is designed to help institutions attract and retain the best people by providing them with the foundational research infrastructure needed to be or become leaders in their field. The John R. Evans Leaders Fund also offers institutions the opportunity to create competitive research support packages in the form of infrastructure and a portion of the operating and maintenance costs, coupled with direct research costs from partner organizations (Canada Research Chairs Program, Canada Excellence Research Chairs Program, NSERC and SSHRC).
Canadian universities, affiliated research hospitals and research institutions recognized as eligible by the CFI can apply for the John R. Evans Leaders Fund if they have received a minimum annual average of $200,000 in research funding over the last three years from the three federal research funding agencies (CIHR, NSERC and SSHRC).
Research community members listed on the proposal must be:
- recognized innovative leaders or have demonstrated the potential for excellence in the proposed research field;
- engaged in or embarking on research or technology development that is innovative, high quality and meets international standards; and
- current faculty members with full-time academic appointments or candidates that the university is in the process of recruiting to full-time academic positions in a strategic sector.
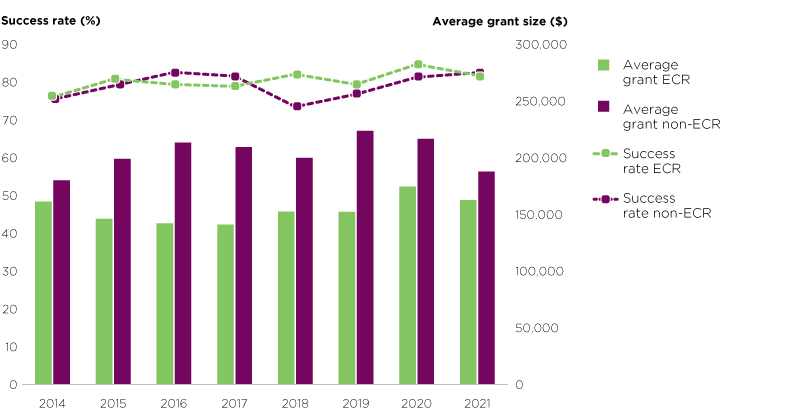
Figure 4: CFI success rates (lines) and average grant sizes (bars) for early career researchers and non-early career researchers for the John R. Evans Leaders Fund from 2014 to 2021
Description of Figure 4
Using a line graph and a vertical bar graph, this figure shows the CFI’s success rates and average grant sizes, from 2014 to 2021, for early career researchers (ECRs) and established researchers, for the John R. Evans Leaders Fund. The first y-axis, to the left side, shows the success rates, in percentages, from 0 to 90%. The second y-axis, to the right side, shows the average grant sizes, in dollars, from $0 to $300,000. The x-axis lists each year from 2014 to 2021
The John R. Evans Leaders Fund success rates and average grant sizes from 2014 to 2020 for ECRs and for established researchers are as follows:
- In 2014, the success rate was 75.9% for ECRs and 75.3% for established researchers. The average grant size was $161,031 for ECRs and $179,824 for established researchers.
- In 2015, the success rate was 80.7% for ECRs and 78.9% for established researchers. The average grant size was $145,845 for ECRs and $198,789 for established researchers.
- In 2016, the success rate was 79.3% for ECRs and 82.5% for established researchers. The average grant size was $141,832 for ECRs and $212,993 for established researchers.
- In 2017, the success rate was 78.8% for ECRs and 81.5% for established researchers. The average grant size was $140,595 for ECRs and $209,100 for established researchers.
- In 2018, the success rate was 82.0% for ECRs and 73.4% for established researchers. The average grant size was $152,209 for ECRs and $199,564 for established researchers.
- In 2019, the success rate was 79.3% for ECRs and 76.7% for established researchers. The average grant size was $151,889 for ECRs and $223,418 for established researchers.
- In 2020, the success rate was 84.6% for ECRs and 81.2% for established researchers. The average grant size was $174,267 for ECRs and $216,270 for established researchers.
- In 2021, the success rate was 81.7% for ECRs and 82.4% for established researchers. The average grant size was $162,407 for ECRs and $187,337 for established researchers.
| John R. Evans Leaders Fund | 2014 | 2015 | 2016 | 2017 | 2018 | 2019 | 2020 | 2021 |
|---|---|---|---|---|---|---|---|---|
| Number of applications—ECRsFootnote * | 216 | 259 | 305 | 240 | 283 | 334 | 273 | 300 |
| Number of applications—totalsFootnote ** | 382 | 439 | 591 | 418 | 452 | 665 | 464 | 522 |
| % of all applications | 56.5% | 59.0% | 51.6% | 57.4% | 62.6% | 50.2% | 58.8% | 57.5% |
| Success rate—ECRs | 75.9% | 80.7% | 79.3% | 78.8% | 82.0% | 79.3% | 84.6% | 81.7% |
| Success rate—established researchers | 75.3% | 78.9% | 82.5% | 81.5% | 73.4% | 76.7% | 81.2% | 82.4% |
| Average grant—ECRs | $161,031 | $145,845 | $141,832 | $140,595 | $152,209 | $151,889 | $174,267 | $162,407 |
| Average grant—established researchers | $179,824 | $198,789 | $212,993 | $209,100 | $199,564 | $223,418 | $216,270 | $187,337 |
| Total John R. Evans Leaders Fund funds awarded—ECRs | $26,409,068 | $30,481,504 | $34,323,312 | $26,572,480 | $35,312,473 | $40,250,531 | $40,255,643 | $39,789,797 |
| Total John R. Evans Leaders Fund funds awarded | $48,887,096 | $58,709,489 | $84,589,750 | $56,891,959 | $60,058,409 | $96,998,760 | $73,777,455 | $74,072,384 |
| % of funds to ECRs | 54.0% | 51.9% | 40.6% | 46.7% | 58.8% | 41.5% | 54.6% | 53.7% |
Notes:
The variances from the previous report are due to the additional data collected since 2020 on first faculty and research-related appointments, and to the dynamic nature of our database.
Definitions of ECRs
- FY2021-22: The difference between the first research-related appointment start date and the proposal submission date is within five years.
- FY2020-21 and before: The difference between the year of the first PhD degree and the proposal submission year is within 10 years.
Page details
- Date modified: