
Report on Hepatitis B and C in Canada: 2016
Download the alternative format
(PDF format, 2.5 MB, 52 pages)
Organization: Public Health Agency of Canada
Published: 2019-04-05
Table of contents
- Foreword
- Acknowledgements
- Abbreviations
- Executive Summary
- 1.0 Methods
- 2.0 Hepatitis B
- 3.0 Hepatitis C
- References
- Appendix A: Case Definitions
- Appendix B: Reported rates of Acute and Chronic HBV Infections per 100,000 population in Canada, CNDSS, 2007-2016
- Appendix C: HCV Infection Reporting in Canada: CNDSS 2007-2016
- Appendix D: Reported rates of HCV infection per 100,000 population in Canada, by sex and age group, CNDSS, 2007-2016
Foreword
The Centre for Communicable Diseases and Infection Control, Public Health Agency of Canada (PHAC), is pleased to present the Report on Hepatitis B and C in Canada: 2016. This report is intended to provide information on trends in cases and rates of hepatitis B virus (HBV) and hepatitis C virus (HCV) infections to those who require surveillance data including program managers, policy makers, researchers, and others.
Viral hepatitis is an inflammation of the liver caused by one of the five hepatitis viruses. Hepatitis B and C viruses are the most common blood-borne hepatitis viruses and are the focus of this report. Although distinct from one another, infection with HBV and HCV can both cause either non-symptomatic or symptomatic acute infection. Infection with either virus may progress to chronic infection, and can result in severe illness and premature death.
Both HBV and HCV infections are notifiable in Canada. The Report on Hepatitis B and C in Canada: 2016 is based on surveillance data reported to the Canadian Notifiable Disease Surveillance System (CNDSS) by provincial and territorial health authorities.
Any comments and suggestions that would improve the usefulness of future publications are appreciated and should be sent to the attention of the staff of the Centre for Communicable Diseases and Infection Control, Public Health Agency of Canada at ccdic-clmti@phac-aspc.gc.ca.
Acknowledgements
The publication of this report would not have been possible without the collaboration of epidemiological units in all provinces and territories, whose continuous contribution to national HBV and HCV infection surveillance is gratefully appreciated.
This report was prepared by the Centre for Communicable Diseases and Infection Control, Infectious Disease Prevention and Control Branch, Public Health Agency of Canada.
Abbreviations
- AB
- Alberta
- BC
- British Columbia
- BSCP
- Blood Safety Contribution Program
- CBS
- Canadian Blood Services
- CCDIC
- Centre for Communicable Diseases and Infection Control
- CDC
- US Centres for Disease Control and Prevention
- CHMS
- The Canadian Health Measures Survey
- CNDSS
- Canadian Notifiable Disease Surveillance System
- CORR
- Canadian Organ Replacement Register
- DNA
- Deoxyribonucleic Acid
- EIA
- Enzyme Immunoassay
- HBV
- Hepatitis B Virus
- HCV
- Hepatitis C Virus
- HIV
- Human Immunodeficiency Virus
- MB
- Manitoba
- NB
- New Brunswick
- NL
- Newfoundland and Labrador
- NS
- Nova Scotia
- NT
- Northwest Territories
- NU
- Nunavut
- ON
- Ontario
- PE
- Prince Edward Island
- PHAC
- Public Health Agency of Canada
- P/T
- Provincial/Territorial
- QC
- Quebec
- RNA
- Ribonucleic Acid
- SK
- Saskatchewan
- TTISS
- Transfusion Transmitted Injury Surveillance System
- UK
- United Kingdom
- US
- United States
- YT
- Yukon
Executive Summary
This report summarizes surveillance data on cases and rates of hepatitis B virus (HBV) and hepatitis C virus (HCV) infection in Canada, reported from 2007 to 2016. Cases of HBV and HCV infections are reported to the Canadian Notifiable Disease Surveillance System (CNDSS) by provincial and territorial health authorities. Information about acute HBV infection offers valuable insight into current transmission trends and patterns, while cases of chronic HBV infection and HCV infection represent the potential burden of disease in Canada.
Hepatitis B and C in a Global Context
Viral hepatitis, including HBV and HCV infections, has been characterized by the World Health Organization (WHO) as constituting a major global public health burden, with significant impacts on morbidity and mortality. In this context, in 2016, the WHO issued the first ever Global Health Sector Strategy on Viral Hepatitis with an overall goal of eliminating viral hepatitis (including HBV and HCV) as a public health threat by 2030Reference 1Reference 2. Robust and enhanced surveillance will be an important contributor to addressing this challenge, and will support the monitoring of progress toward viral hepatitis elimination.
Hepatitis B
Acute infections
In 2016, a total of 187 cases of acute hepatitis B were reported in Canada. The rate of reported acute HBV cases decreased from 1.0 to 0.5 per 100,000 between 2007 and 2016. Over this ten-year timeframe, rates decreased among both males and females of all age groups. In 2016, males consistently demonstrated higher rates of acute HBV infection in age groups 25 years and above. In 2016, rates of reported cases above the national rate of 0.5 per 100,000 were observed in New Brunswick, Nova Scotia, Manitoba and Ontario (1.3, 1.1, 1.0 and 0.8 respectively).
Chronic infections
For chronic HBV infection, the rate of reported cases fluctuated between 2007 and 2016 with no definite trend emerging. In 2016, 4,196 cases of chronic HBV infection were reported in Canada, resulting in a national rate of 11.8 per 100,000. Between 2007 and 2016, chronic HBV infection rates were consistently higher among males than among females.
In 2016, rates of chronic HBV infection were higher among males than females of all age groups except for the 15-29 year age groups. In that year, males in the 30-39 year age group posted the highest rate of chronic HBV infection (28.8 per 100,000), followed by females in the same age group (23.7 per 100,000). Also, British Columbia, Yukon, Alberta, and Ontario reported rates (23.4, 21.0, 13.5, and 12.1 per 100,000 population respectively) higher than the national rate of 11.8 per 100,000 population.
Various potential factors may explain the trends described in this report. For example, Canada’s universal immunization program targeted at newborns and/or school-age children and, in some jurisdictions, high-risk populations, has likely contributed to declining rates of acute HBV infection. Other public health and infection control interventions aimed at preventing the transmission of sexually transmitted and blood-borne infections may have also affected observed trends.
It is worth noting that the national HBV infection rates are influenced by variations in temporal and geographical reporting practices and should therefore be interpreted with caution. Provinces and territories differ in their capacity to distinguish HBV infections by status (acute vs. chronic); as a result, HBV infection reporting is not uniform across the country and many hepatitis B cases are reported as unspecified. Between 2007 and 2016, approximately 15% of all hepatitis B cases were reported as unspecified. These unspecified cases are not included in this report.
Hepatitis C
Most provinces and territories do not report HCV infection differentiated into acute and chronic status. Therefore, for the purpose of this report, such differentiation is not highlighted and all the cases are reported as unspecified HCV infection and include acute, chronic, and resolved cases. Note there is an assumption that chronic HCV infections make up most of the HCV cases reported to the CNDSS as acute infection is usually asymptomatic and less likely to be diagnosed.
The rate of reported HCV infection decreased steadily from 2007 to 2011 and appears to be slightly rising since 2012. Over 2007-2016, reported HCV infection rates were consistently higher among males than females. Among males, from 2007 to 2016, the HCV infection rate decreased by 15.7% (from 46.4 to 39.1 per 100,000), whereas among females it decreased by 12.2% (from 26.2 to 23.0 per 100,000). In 2016, 11,265 cases of HCV infection were reported in Canada, corresponding to an overall national rate of 31.1 per 100,000. The highest rate of HCV infection among males was observed in the 25-29 year age group (63.7 per 100,000 population); among females, the highest rate was also reported in the 25-29 year age group (46.7 per 100,000 population). Saskatchewan, British Columbia, Yukon, Alberta, Manitoba, and Nova Scotia reported rates (62.8, 48.5, 47.3, 39.3, 34.9, and 32.3 respectively) higher than the national average of 31.1 per 100,000.
Advances in blood donation screening, infection control practices in health care settings and medical interventions have likely contributed to the overall observed reductions in rates of reported HCV infections in Canada since 2007. It is also possible that public health interventions that seek to prevent transmission of infection among people who inject drugs have had an impact on these trends.
The difficulties in ascertaining acute or chronic HCV infection status and reporting patterns make it difficult to draw clear inferences about trends in either acute HCV transmission or the burden of chronic infection. Likewise, the lack of risk factor data on reported HCV infections limits the interpretation of the findings presented in this report.
Sex and Gender-Based Analysis+
Sex and gender are important determinants of health. Sex- and gender-based analysis plus (SGBA+) is a systematic approach that considers the needs of different groups of boys, girls, men, women and gender-diverse people. For health, the “plus” in SGBA+ goes beyond the consideration of how sex and gender can differentially affect health status and health outcomes to include other aspects of individual identity and determinants of health such as race, religion, age, ethnicity, sexual orientation, geography, culture, mental or physical disability, income, and education.
In keeping with the federal Health Portfolio’s Sex and Gender-Based Analysis Policy,Footnote a and our broader commitment to health equity across Canadian society, PHAC is taking steps to advance the implementation of SGBA+ in its activities and programs. This will include integrating SGBA+ more systematically into its infectious disease surveillance activities, and related analysis and reporting. PHAC surveillance work on hepatitis B and C has, for many years, provided sex-disaggregated data and analysis. Going forward, we will look for opportunities to expand this work to include analysis on the intersection of sex with other SGBA+ factors that could have important implications for boys, girls, men, women and gender-diverse people affected by these diseases.
Conclusion
National statistics and trends of HBV and HCV infections are used to inform public health programs, guidelines, and recommendations. Based on available data, the observed HBV and HCV infection rates and trends from 2007 to 2016 substantiate the need for continued prevention and management efforts in Canada. As the reporting of acute and chronic HBV and HCV infection becomes more harmonized across the country over time, available data will be more representative of the true burden of viral hepatitis in Canada.1.0 Methods
1.1 Case Definitions
Case definitions for hepatitis B (HBV) and hepatitis C (HCV) used in Canada for surveillance purposes are available in Appendix A. HBV infection has been notifiable in Canada since 1969 and the current national case definition defines acute, chronic, and unspecified infection statusReference 3. Hepatitis C infection has been nationally notifiable since 1991. Surveillance of hepatitis C cases was phased in over time by provinces and territories, with all jurisdictions reporting cases by 1999. The current HCV case definition used for national surveillance defines both acute and unspecified (including chronic, resolved, and indeterminate) infection statusReference 4.
1.2 Data Collection
In Canada, the surveillance of nationally notifiable infectious diseases is conducted by the Public Health Agency of Canada (PHAC) in coordination with provincial and territorial governments, which voluntarily provide non-nominal data to PHAC. Responsibility for primary data collection of notifiable disease data falls to local public health authorities according to provincial/territorial legislationReference 5.
PHAC collects and manages data received from the provinces and territories via the Canadian Notifiable Disease Surveillance System (CNDSS). CNDSS staff validates reported data with the submitting province or territory during data processing to resolve data errors or inconsistencies and maximize accuracy. Variables submitted by all reporting jurisdictions include: age at diagnosis, year of diagnosis, province/territory of diagnosis, and sex. As such, national reporting is limited to analyses of these variables. Extracts from the CNDSS are used as the basis of national surveillance reports. The current report is based on data extracted in May 2018.
1.3 Data Analysis
Until recently, surveillance data reported to the CNDSS by most provinces and territories did not distinguish between acute and chronic HBV infection. A number of provinces and territories began reporting acute HBV infection in 2005; however, chronic HBV infection reporting only became more consistent in 2009. In order to examine trends over time, only those provinces and territories that reported acute or chronic HBV infection over the timeframe considered were included in annual rates. Population estimates from jurisdictions not included in a particular analysis (acute or chronic) were removed from the overall denominator used to calculate corresponding national rates. Consequently, annual rates of acute HBV reported from 2007-2016 included data from British Columbia, Alberta, Saskatchewan, Ontario, Quebec, and selected years for other provinces and territories such as Yukon (2008-2016), New Brunswick (2009-2016), the Northwest Territories (2009-2016), Manitoba (2009-2016), and Nova Scotia (2009-2016). Annual rates of chronic HBV infection reported from 2007-2016 included data from British Columbia, Alberta, Quebec, New Brunswick, and selected years for other provinces and territories such as Saskatchewan (2009-2016, except 2014), Yukon (2008-2016), the Northwest Territories (2009-2016), Nova Scotia (2009-2016), Ontario (2011-2016), and Manitoba (2009-2016, except 2011). Appendix B provides information on the years in which the provinces/territories reported cases differentiated into acute and chronic HBV infection.
For HCV, most provinces and territories confirm cases using antibody testing, which does not distinguish acute from chronic HCV infection, or current from resolved infection; such cases are reported as unspecified HCV infection. As such, HCV data presented in this report are unspecified infections, and includes acute, chronic, resolved, and indeterminate HCV infections. Certain provinces/territories report cases differentiated into acute and chronic HCV infection (Appendix C).
Descriptive analysis of HBV and HCV infection by year, age group, and sex was conducted using data reported to the CNDSS except for New Brunswick which was the direct source of hepatitis C data for 2007 to 2011. Demographic patterns in age and sex were examined in HBV and HCV cases reported in 2016 to provide a more detailed snapshot of the most recent available data. The population data were July 2017 Statistics Canada (Demography Division, Demographic Estimates Section) estimates. Rates calculated with these updated estimates may differ from those reported in previous reports.1.4 Data Limitations
Observed trends over time must be interpreted with caution as rates based on small numbers are more prone to fluctuation. Improved diagnostic capabilities and data cleaning/validation (i.e. duplicate removal), shortened reporting delay, and changes in reporting practices at the jurisdictional level can contribute to changes in observed trends.
Once the data for this report have been validated, adjustments made to provincial/territorial (P/T) data post-validation may not be reflected in that year's national data, but will be updated in subsequent reports. Therefore, small discrepancies between the PHAC and P/T numbers are expected as a result of comparing dynamic databases. For any discrepancy between our report and the P/T reports, the P/T report should be seen as the most accurate. Larger discrepancies may be noted where provinces and territories employ an analytic strategy that is different from what is used in this report. For instance, some jurisdictions choose to report chronic and unspecified HBV infections together as one category, while unspecified infections are excluded from analysis at the national level.
Finally, HCV surveillance data would be improved with the inclusion of more variables, (e.g. risk factor) as such information would provide additional insight and explanation into the observed trends.
2.0 Hepatitis B
2.1 Introduction
HBV is a DNA virus of the Hepadnaviridae family that mainly infects liver cells but has also been found in a variety of tissues and organs, including the kidneys, pancreas, and mononuclear cellsReference 6Reference 7. After acquisition of HBV infection, less than 10% of children and 30-50% of adults will manifest symptoms which may include jaundice, fatigue, loss of appetite, nausea, and joint or abdominal painReference 8. Age at infection is a significant determinant of the likelihood of developing chronic infection, which occurs in approximately 90% of infants infected at birth, and less than 10% in those infected laterReference 8. Chronic HBV infection may, over time, result in liver cirrhosis, hepatocellular carcinoma, decompensated liver disease, and premature deathReference 8.
Transmission of HBV occurs through contact with infected blood and body fluids, most commonly through sexual or close personal contact with an infected person, use of contaminated drug injection equipment, and vertical (mother-to-child) transmission during pregnancy or birthReference 8. The patterns of HBV transmission are somewhat different in developing and developed countries, with vertical transmission and exposure through close family contacts being of significant importance in developing countries, while sexual transmission and injection drug use are the predominant patterns in developed countries such as CanadaReference 9Reference 10. HBV can survive outside the body for up to seven days and has been implicated in both nosocomial transmission (via contaminated medical or dental equipment) and occupational exposure among health care workersReference 11.
Diagnosis of HBV infection requires laboratory confirmation via a blood sample to differentiate HBV infection from other types of hepatitis. Infection markers present in the blood can also be used to distinguish between acute and chronic HBV infection. Acute HBV infection is characterized by the presence of the hepatitis B surface antigen (HBsAg) and immunoglobulin M antibodies to the hepatitis B core antigen (anti-HBc IgM)Reference 8. Chronic infection is characterized by the presence of antibodies to the hepatitis B core antigen (anti-HBc other than IgM) and HBsAg for over six monthsReference 8. The presence of HBeAg, an antigen characteristic of the initial phase of acute infection and which may be present during chronic infection, indicates that the infected individual is highly contagiousReference 12Reference 13. In contrast, anti-HBe appears during recovery from acute infection and its presence during chronic infection generally indicates reduced viral replication and low infectivityReference 13.
A vaccine against hepatitis B has been available globally since 1982Reference 11. In Canada, all provinces and territories have had a universal newborn and/or childhood HBV vaccination program since the 1990s, although programs vary by jurisdiction with respect to the recommended dosages and schedules, as well as the age groups targetedReference 13Reference 14. In addition, some jurisdictions offer the hepatitis B vaccine to individuals who are at increased risk of infection (e.g., people who inject drugs or who engage in high-risk sexual practicesReference 15. The National Advisory Committee on Immunization recommends routine testing for HBsAg during pregnancy or at the time of delivery. Infants born to infected mothers are put on an immediate immunization schedule in an effort to reduce the risk of HBV infectionReference 16.
There is no treatment for acute HBV infection; care is focused on alleviating symptoms, preventing hepatic complications, and reducing the spread of infection through counselingReference 11Reference 13. Among persons with chronic HBV infection, interferon injections and antiviral medications are the approved treatments to prevent the development of cirrhosis, liver failure, and liver cancer. However, only some individuals with chronic HBV are eligible for treatment, determined by the age of the individual, the concentrations of serum aminotransferase and DNA HBV, and the severity of liver disease among other factorsReference 13.2.2 National Trends
2.2.1 Acute Hepatitis B
This section of the report presents the rates and trends of acute HBV infection in Canada between 2007 and 2016. In order to provide consistent time trends, only those provinces and territories that provided data on acute HBV infection during this timeframe are included in national acute HBV infection rates, with denominators adjusted accordingly.
2.2.1.1 Trends over time
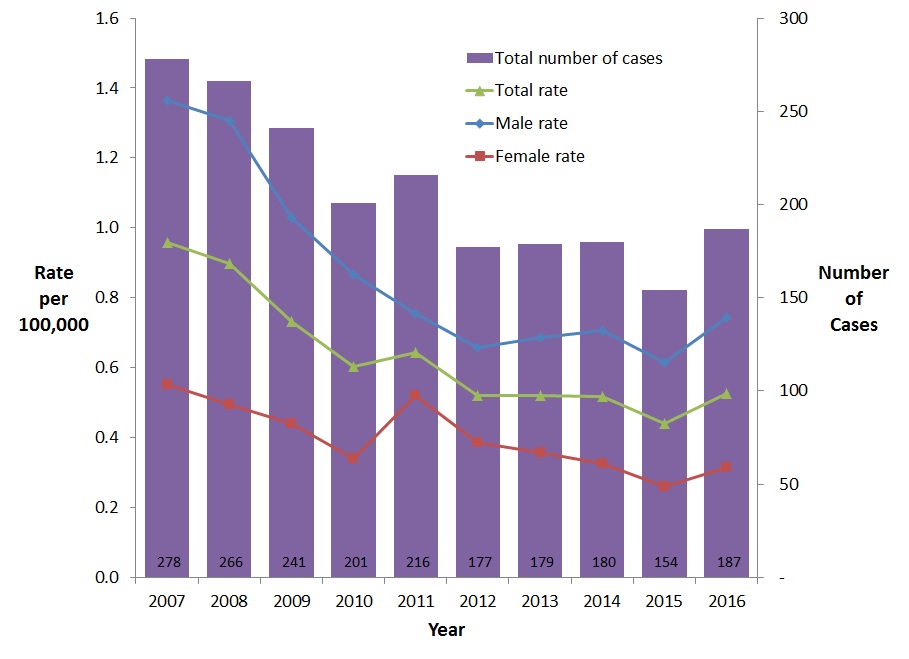
The overall rate of reported cases of acute HBV infection decreased steadily between 2007 and 2015, with a slight increase in 2016. In 2007, a total of 278 cases of acute HBV infection were reported, corresponding to an overall rate of 0.96 per 100,000 population, compared to 187 cases reported in 2016, which represented a rate of 0.53 per 100,000 population (Figure 1).
Between 2007 and 2016, rates of reported cases of acute HBV were consistently higher among males than females. Males and females experienced a similar decrease in rates (45.5% and 43.3% respectively) (Figure 1).
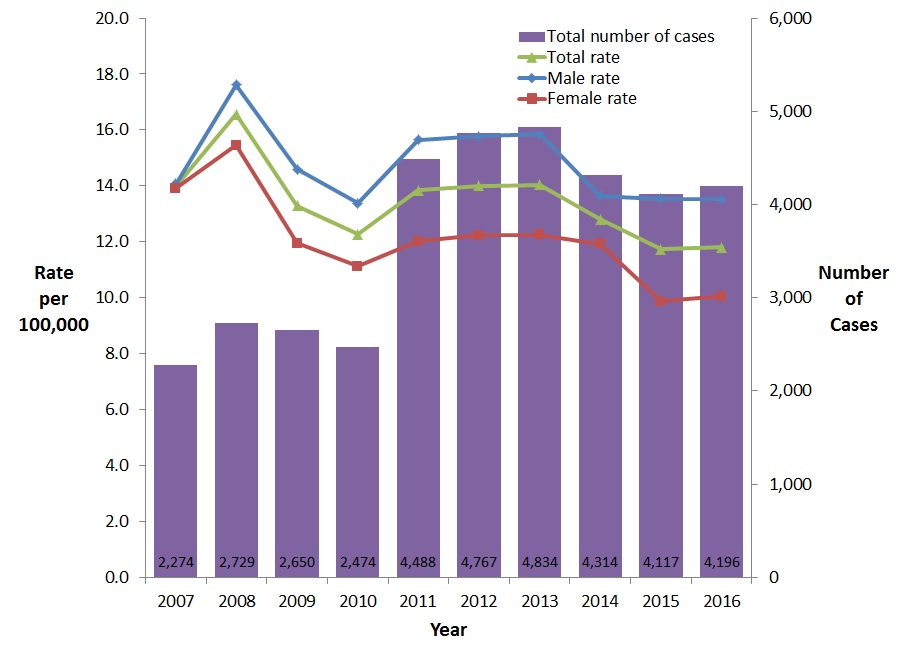
Figure 1. Reported number of cases and rates of acute HBV infection in CanadaFigure 1 Footnote 1 by sex, CNDSS, 2007-2016
- Figure 1 Footnote 1
-
Includes Data from BC, AB, SK, ON, QC (Data from 2007 to 2016); For YT: Data from 2008 to 2016; For MB, NB, NT, and NS: Data from 2009 to 2016
Text Description
This graph displays the overall number of reported cases as well as the overall and sex specific rates of reported acute hepatitis B cases, between 2007 and 2016 in Canada. The horizontal axis shows the calendar years from 2007 to 2016. The vertical axis shows the rate of reported acute hepatitis B cases per 100,000 people for male, female, and overall, as well as the overall number of reported cases of acute hepatitis B.
| Year | Overall Number of Cases | Rate per 100,000 people | ||
|---|---|---|---|---|
| Male | Female | Overall | ||
| 2007 | 278 | 1.4 | 0.6 | 1.0 |
| 2008 | 266 | 1.3 | 0.5 | 0.9 |
| 2009 | 241 | 1.0 | 0.4 | 0.7 |
| 2010 | 201 | 0.9 | 0.3 | 0.6 |
| 2011 | 216 | 0.8 | 0.5 | 0.6 |
| 2012 | 177 | 0.7 | 0.4 | 0.5 |
| 2013 | 179 | 0.7 | 0.4 | 0.5 |
| 2014 | 180 | 0.7 | 0.3 | 0.5 |
| 2015 | 154 | 0.6 | 0.3 | 0.4 |
| 2016 | 187 | 0.7 | 0.3 | 0.5 |
2.2.1.2 Rates of reported cases of acute HBV infection by age group and sex, 2016
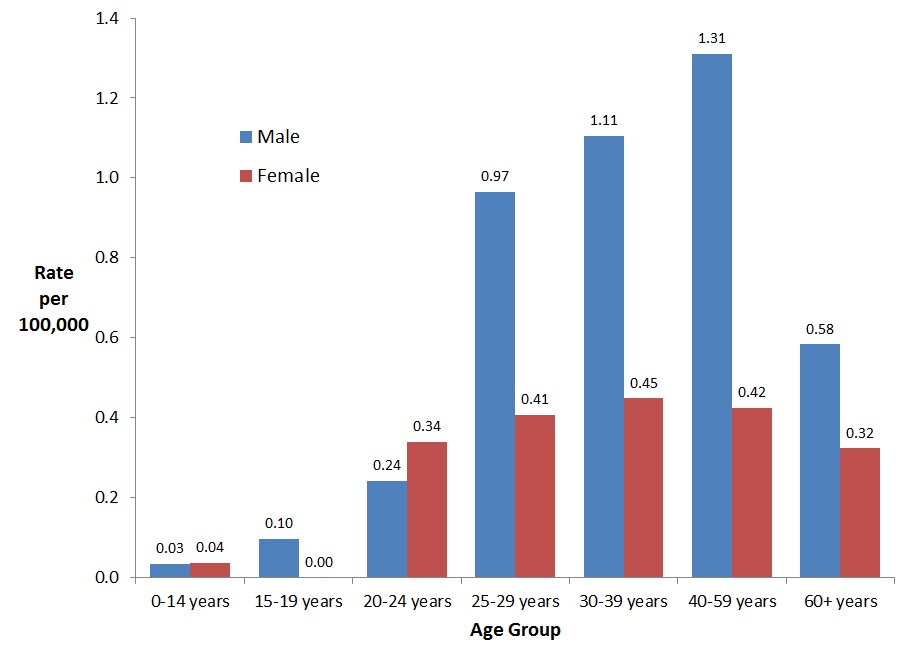
In 2016, the highest rate of reported cases of acute HBV infection among males was observed in the 25-59 year age groups (from 0.97 to 1.31 per 100,000 population). These age groups also had the highest reported rates of acute HBV infection among females (from 0.41 to 0.45 per 100,000 population) (Figure 2). In the 40-59 year age group, the rate among males was more than triple that among females. In the 25-39 year age groups, the rates among males were more than double that among females. Rates were similar among males and females in the younger age groups (0-24 years of age) (Figure 2).
Figure 2. Rates of reported cases of acute HBV in CanadaFigure 2 Footnote 1 by age group and sex, CNDSS, 2016
- Figure 2 Footnote 1
-
Includes data from BC, AB, SK, MB, ON, QC, NB, NS, YT and NT
Text Description
This graph displays the rate of reported acute hepatitis B cases by sex and age group, in 2016 in Canada. The horizontal axis shows the age groups from 0-14 years of age to over 60 years of age. The vertical axis shows the rate of reported acute hepatitis B cases per 100,000 for males and females.
| Age Group | Rate per 100,000 people | |
|---|---|---|
| Male | Female | |
| 0-14 years | 0.03 | 0.04 |
| 15-19 years | 0.10 | 0.00 |
| 20-24 years | 0.24 | 0.34 |
| 25-29 years | 0.97 | 0.41 |
| 30-39 years | 1.11 | 0.45 |
| 40-59 years | 1.31 | 0.42 |
| 60+ years | 0.58 | 0.32 |
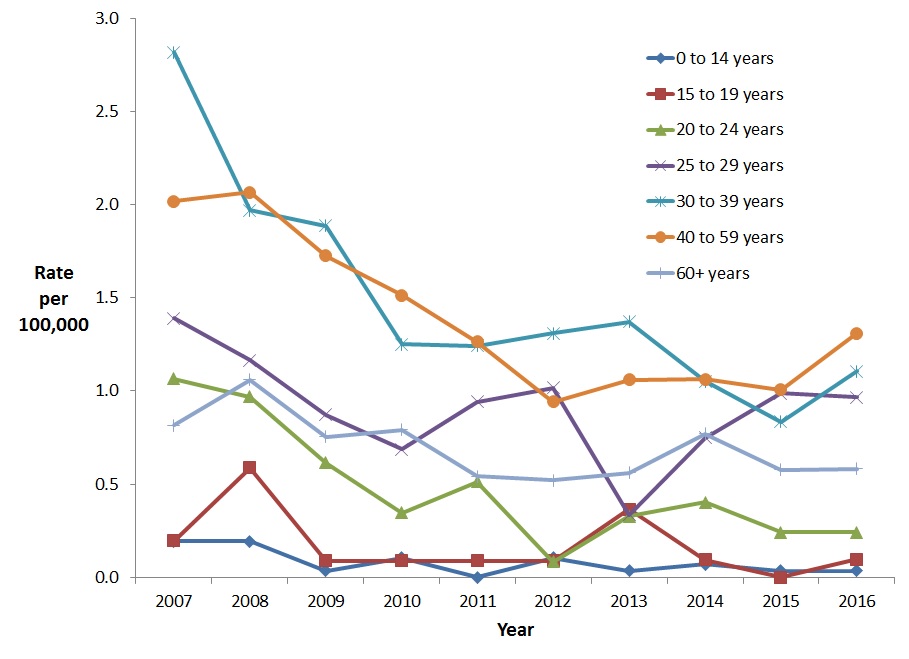
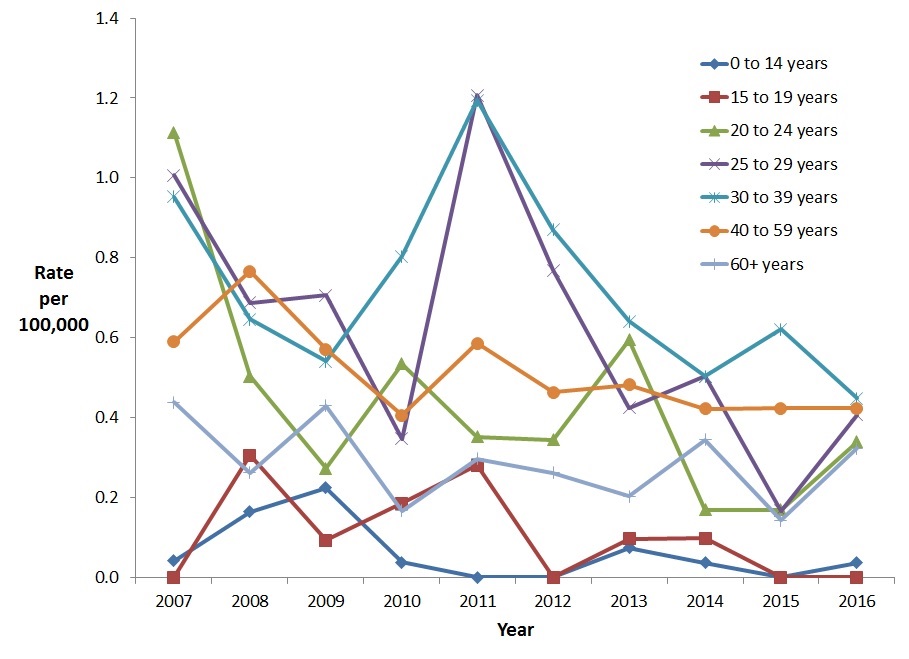
Among males, between 2007 and 2016, the rate of reported cases of acute HBV infection decreased for all age groups with the most significant reduction (82.4%) seen in the 0-14 year age group followed by the 20-24 year age group (77.4% reduction) and the 30-39 year age group (60.7% reduction) (Figure 3).
Figure 3. Rates of reported cases of acute HBV in CanadianFigure 3 Footnote 1 males by age group and year, CNDSS, 2007-2016
- Figure 3 Footnote 1
-
Includes Data from BC, AB, SK, ON, QC (Data from 2007 to 2016); For YT: Data from 2008 to 2016; For MB, NB, NT, and NS: Data from 2009 to 2016
Text Description
This graph displays the rate of reported acute hepatitis B cases among males by age group, between 2007 and 2016, in Canada. The horizontal axis shows the calendar years from 2007 to 2016. The vertical axis shows the rates of reported acute hepatitis B cases per 100,000 people for age groups 0-14 years of age to over 60 years of age.
| Year | Rate per 100,000 people | ||||||
|---|---|---|---|---|---|---|---|
| 0-14 years | 15-19 years | 20-24 years | 25-29 years | 30-39 years | 40-59 years | 60+ years | |
| 2007 | 0.2 | 0.2 | 1.1 | 1.4 | 2.8 | 2.0 | 0.8 |
| 2008 | 0.2 | 0.6 | 1.0 | 1.2 | 2.0 | 2.1 | 1.1 |
| 2009 | 0.0 | 0.1 | 0.6 | 0.9 | 1.9 | 1.7 | 0.8 |
| 2010 | 0.1 | 0.1 | 0.3 | 0.7 | 1.3 | 1.5 | 0.8 |
| 2011 | 0.0 | 0.1 | 0.5 | 0.9 | 1.2 | 1.3 | 0.5 |
| 2012 | 0.1 | 0.1 | 0.1 | 1.0 | 1.3 | 0.9 | 0.5 |
| 2013 | 0.0 | 0.4 | 0.3 | 0.3 | 1.4 | 1.1 | 0.6 |
| 2014 | 0.1 | 0.1 | 0.4 | 0.7 | 1.1 | 1.1 | 0.8 |
| 2015 | 0.0 | 0.0 | 0.2 | 1.0 | 0.8 | 1.0 | 0.6 |
| 2016 | 0.0 | 0.1 | 0.2 | 1.0 | 1.1 | 1.3 | 0.6 |
Among females, the greatest decrease in the rate of acute HBV infection was noted among those 20-24 years of age (69.6% reduction) followed by the 25-29 year age group (59.6% reduction) and the 30-39 year age group (53.0% reduction). In 2011, there was a notable rate increase among females in the 25-39 year age groups, followed by a decline in 2012 and 2013 (Figure 4).
Figure 4. Rates of reported cases of acute HBV in CanadianFigure 4 Footnote 1 females by age group and year, CNDSS, 2007-2016
- Figure 4 Footnote 1
-
Includes Data from BC, AB, SK, ON, QC (Data from 2007 to 2016); For YT: Data from 2008 to 2016; For MB, NB, NT, and NS: Data from 2009 to 2016
Text Description
This graph displays the rate of reported acute hepatitis B cases among females by age group, between 2007 and 2016, in Canada. The horizontal axis shows the calendar years from 2007 to 2016. The vertical axis shows the rates of reported acute hepatitis B cases per 100,000 people for age groups 0-14 years of age to over 60 years of age.
| Year | Rate per 100,000 people | ||||||
|---|---|---|---|---|---|---|---|
| 0-14 years | 15-19 years | 20-24 years | 25-29 years | 30-39 years | 40-59 years | 60+ years | |
| 2007 | 0.0 | 0.0 | 1.1 | 1.0 | 1.0 | 0.6 | 0.4 |
| 2008 | 0.2 | 0.3 | 0.5 | 0.7 | 0.6 | 0.8 | 0.3 |
| 2009 | 0.2 | 0.1 | 0.3 | 0.7 | 0.5 | 0.6 | 0.4 |
| 2010 | 0.0 | 0.2 | 0.5 | 0.3 | 0.8 | 0.4 | 0.2 |
| 2011 | 0.0 | 0.3 | 0.4 | 1.2 | 1.2 | 0.6 | 0.3 |
| 2012 | 0.0 | 0.0 | 0.3 | 0.8 | 0.9 | 0.5 | 0.3 |
| 2013 | 0.1 | 0.1 | 0.6 | 0.4 | 0.6 | 0.5 | 0.2 |
| 2014 | 0.0 | 0.1 | 0.2 | 0.5 | 0.5 | 0.4 | 0.3 |
| 2015 | 0.0 | 0.0 | 0.2 | 0.2 | 0.6 | 0.4 | 0.1 |
| 2016 | 0.0 | 0.0 | 0.3 | 0.4 | 0.4 | 0.4 | 0.3 |
2.2.1.3 Rates by province/territory
In 2016, 187 cases of acute HBV were reported in Canada. The provinces with the highest number of cases were Ontario (115 cases), Alberta (19 cases), Manitoba (13 cases) and Quebec (12 cases). The rates of reported cases of acute HBV infection were low in all jurisdictions, however, New Brunswick (1.3 per 100,000 population), Nova Scotia (1.1 per 100,000 population), Manitoba (1.0 per 100,000 population), and Ontario (0.8 per 100,000 population) reported acute HBV infection rates above the national average of 0.5 per 100,000 (Table 1). Rates among males were consistently higher than those among females for all provinces and territories except in the Yukon and Northwest Territories where no cases were reported in 2016.
| Jurisdiction | Male | Female | Total | |||
|---|---|---|---|---|---|---|
| Number of cases | Rate per 100,000 | Number of cases | Rate per 100,000 | Number of cases | Rate per 100,000 | |
| Canada | 131 | 0.73 | 56 | 0.31 | 187 | 0.52 |
| BC | 4 | 0.17 | 1 | 0.04 | 5 | 0.11 |
| AB | 13 | 0.61 | 6 | 0.29 | 19 | 0.45 |
| SK | 3 | 0.52 | 0 | 0.00 | 3 | 0.26 |
| MB | 10 | 1.52 | 3 | 0.45 | 13 | 0.99 |
| ON | 77 | 1.12 | 38 | 0.53 | 115 | 0.82 |
| QC | 8 | 0.19 | 4 | 0.09 | 12 | 0.14 |
| NB | 10 | 2.67 | 0 | 0.00 | 10 | 1.32 |
| NS | 6 | 1.29 | 4 | 0.83 | 10 | 1.05 |
| PE | N/A | N/A | N/A | N/A | N/A | N/A |
| NL | N/A | N/A | N/A | N/A | N/A | N/A |
| YT | 0 | 0.00 | 0 | 0.00 | 0 | 0.00 |
| NT | 0 | 0.00 | 0 | 0.00 | 0 | 0.00 |
| NU | N/A | N/A | N/A | N/A | N/A | N/A |
| ||||||
2.2.2 Chronic Hepatitis B
Provinces and territories started reporting chronic cases of HBV infection in different years (Appendix B). Chronic HBV infection statistics presented in this report were adjusted to account for differences related to the variation in the year when each jurisdiction started the reporting. As a consequence, cautious interpretation of these statistics is recommended.
2.2.2.1 Trends over time
The rate of reported cases of chronic HBV infection fluctuated between 2007 and 2016. This may be related to provinces and territories with different rates joining the surveillance systems in different years. The overall rate of reported chronic HBV decreased by 16% between 2007 and 2016, from 14.0 to 11.8 per 100,000 population (Figure 5). The decrease occurred among both males and females, but was more prominent among females (27.7% reduction) than males (4.0% reduction).
Figure 5. Reported number of cases and rates of chronic HBV infection in CanadaFigure 5 Footnote 1 by sex, CNDSS, 2007-2016
- Figure 5 Footnote 1
-
Includes data from AB, BC, QC, NB (Data from 2007 to 2016); SK (Data from 2009 to 2016, except for 2014); YT (Data from 2008 to 2016); NT, NS (Data from 2009 to 2016); MB (Data from years 2009 to 2016, except 2011); ON (Data from 2011-2016)
Text Description
This graph displays the overall number of reported cases as well as the overall and sex specific rates of reported chronic hepatitis B cases, between 2007 and 2016 in Canada. The horizontal axis shows the calendar years from 2007 to 2016. The vertical axis shows the rate of reported chronic hepatitis B cases per 100,000 people for male, female, and overall, as well as the overall number of reported cases of chronic hepatitis B.
| Year | Overall Number of Cases | Rate per 100,000 people | ||
|---|---|---|---|---|
| Male | Female | Overall | ||
| 2007 | 2,274 | 14.0 | 13.9 | 14.0 |
| 2008 | 2,729 | 17.6 | 15.5 | 16.6 |
| 2009 | 2,650 | 14.6 | 11.9 | 13.3 |
| 2010 | 2,474 | 13.4 | 11.1 | 12.3 |
| 2011 | 4,488 | 15.7 | 12.0 | 13.8 |
| 2012 | 4,767 | 15.8 | 12.2 | 14.0 |
| 2013 | 4,834 | 15.8 | 12.2 | 14.0 |
| 2014 | 4,314 | 13.6 | 11.9 | 12.8 |
| 2015 | 4,117 | 13.5 | 9.9 | 11.7 |
| 2016 | 4,196 | 13.5 | 10.1 | 11.8 |
2.2.2.2 Rates of reported cases of chronic HBV infection by age group and sex, 2016
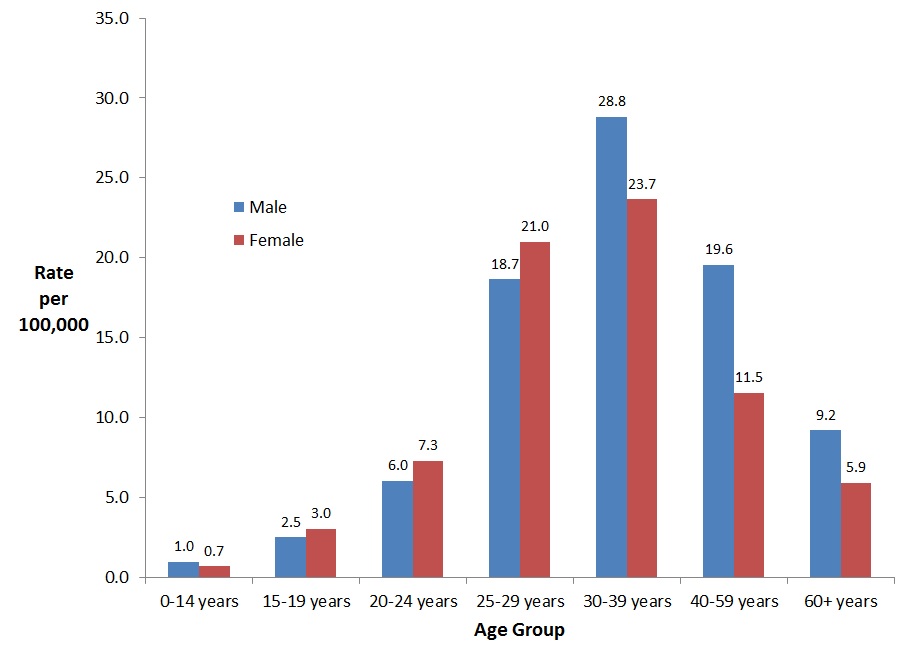
In 2016, rates of chronic HBV infection were higher among males than females in all age groups except the 15-29 year age groups. For both males and females, the highest rate of reported cases of chronic HBV infection in 2016 was observed in the 30-39 year age group (28.8 per 100,000 among males, and 23.7 per 100,000 among females) (Figure 6).
Figure 6. Rates of reported cases of chronic HBV in CanadaFigure 6 Footnote 1 by age group and sex, CNDSS, 2016
- Figure 6 Footnote 1
-
Includes data from BC, AB, SK, MB, ON, QC, NB, NS, YT and NT
Text Description
This graph displays the rate of reported chronic hepatitis B cases by sex and age group, in 2016 in Canada. The horizontal axis shows the age groups from under 15 years of age to over 60 years of age. The vertical axis shows the rate of reported chronic hepatitis B cases per 100,000 for males and females.
| Age Group | Rate per 100,000 people | |
|---|---|---|
| Male | Female | |
| 0-14 years | 1.0 | 0.7 |
| 15-19 years | 2.5 | 3.0 |
| 20-24 years | 6.0 | 7.3 |
| 25-29 years | 18.7 | 21.0 |
| 30-39 years | 28.8 | 23.7 |
| 40-59 years | 19.6 | 11.5 |
| 60+ years | 9.2 | 5.9 |
2.2.2.3 Rates of reported cases of chronic HBV infection by province/territory, 2016
The reported number of chronic HBV cases and rates by sex and province/territory for 2016 are presented in Table 2. In 2016, Ontario reported the highest number of cases, 1,691, followed by British Columbia with 1,113. The jurisdictions of British Columbia (23.4 per 100,000 population), Yukon (21.0 per 100,000 population), Alberta (13.5 per 100,000 population) and Ontario (12.1 per 100,000 population) reported rates of chronic HBV infection above the national average of 11.8 per 100,000 population. Rates among males were consistently higher than those among females for all provinces and territories except in the Northwest Territories where no cases were reported in 2016 (Table 2).
| Jurisdiction | Male | Female | Total | |||
|---|---|---|---|---|---|---|
| Number of cases | Rate per 100,000 | Number of cases | Rate per 100,000 | Number of cases | Rate per 100,000 | |
| Canada | 2,382 | 13.5 | 1,802 | 10.1 | 4,196 | 11.8 |
| BC | 577 | 24.4 | 536 | 22.4 | 1,113 | 23.4 |
| AB | 350 | 16.3 | 224 | 10.7 | 574 | 13.5 |
| SK | 83 | 14.3 | 46 | 8.1 | 129 | 11.2 |
| MB | 77 | 11.7 | 59 | 8.9 | 136 | 10.3 |
| ON | 974 | 14.2 | 707 | 9.9 | 1,691 | 12.1 |
| QC | 271 | 6.6 | 189 | 4.5 | 462 | 5.6 |
| NB | 37 | 9.9 | 32 | 8.4 | 69 | 9.1 |
| NS | 8 | 1.7 | 6 | 1.2 | 14 | 1.5 |
| PE | N/A | N/A | N/A | N/A | N/A | N/A |
| NL | N/A | N/A | N/A | N/A | N/A | N/A |
| YT | 5 | 25.8 | 3 | 16.0 | 8 | 21.0 |
| NT | 0 | 0.0 | 0 | 0.0 | 0 | 0.0 |
| NU | N/A | N/A | N/A | N/A | N/A | N/A |
| ||||||
2.3 Discussion
Overall, although the rate of reported cases of HBV in Canada is low, it remains an important and preventable cause of illness and death. In 2013 (the most recent year for which mortality data were available from Statistics Canada), acute HBV infection was documented as the leading cause of 18 deaths in Canada, and a further 50 deaths were attributed to chronic HBV infectionReference 17. The true magnitude of HBV-related deaths is likely higher due to potential misclassification on death certificatesReference 18.
Acute HBV cases offer valuable insight into current transmission trends and patterns, as cases diagnosed and reported as acute infection approximate incident cases (i.e., those that have been recently acquired). Data from the CNDSS indicate a decrease in the overall rates of reported cases of acute HBV infection between 2007 and 2015 in Canada, with a slight increase observed in 2016. It is however too early to know if this increase is real or due to fluctuation. Rates were consistently higher among males than females over this timeframe. In 2016, the rate of reported cases of acute HBV infection was highest among males and females in the 25-59 year age groups.
These decreasing rates of acute HBV infection in Canada may be attributable to the implementation of routine immunization programs in all provinces and territories, starting in the early 1990s. These programs are offered to infants and/or school-aged children and, in some jurisdictions, to high-risk populationsReference 15. Those who received HBV vaccines are considered to be protected both from acute and chronic HBV infection. As an increasing proportion of the Canadian population is covered by HBV immunization, it is reasonable to expect continued decreases in acute HBV rates. In 2015, HBV immunization coverage by the second birthday was estimated to be 69.2% in provinces and territories with a three-dose infant programReference 19. Coverage with at least one dose of the HBV vaccine by the 17th birthday was 88.1% in 2015Reference 19. In 2014, national HBV immunization coverage was estimated to be at 52.2% for adults belonging to the 18 to 64 age cohort; however, approximately 72.2% of health care workers had received at least one dose of HBV vaccineReference 20.
Refinement in blood screening and improved infection prevention and control practices in health care settings have also likely contributed to Canada's decreasing rates of acute HBV infection. Under the Blood Safety Contribution Program (BSCP) of PHAC through the Transfusion Transmitted Injury Surveillance System (TTISS), no case of acute HBV infection related to blood transfusion has been reported. Surveillance of blood donations received by the Canadian Blood Services (CBS) in 2016 indicate that HBV was detected in 55.6 per 100,000 first-time donors (first time donations comprise nearly 10% of the total overall donations) and only 0.9 per 100,000 repeat donors (i.e. donations among those who have donated previously)Reference 21. HBV positivity was higher in donations received from males (8.7 per 100,000 donations) compared to donations from females (3.6 per 100, 000 donations).
Comparisons in acute HBV rates between Canada and other countries are limited due to differences in case definitions, reporting sources, public health interventions and screening programs. However, declining rates have been similarly observed in most countries with comparable population structures, health status, and public health infrastructure. For example, data from routine and/or enhanced surveillance in England indicate that the annual rate of acute HBV in that country has been decreasing over timeReference 22. From 2015 to 2016, the annual rate of reported acute HBV cases decreased from 0.83 per 100,000 population to 0.82 per 100,000 populationReference 22. On the other hand, the annual number of reported cases of acute HBV infection has been fluctuating in the US between 2012 and 2016, with each decrease in this time period being followed by a small increase the following yearReference 23. From 2015 to 2016, a decrease of 4.5% was observed from 3,370 (1.1 case per 100,000) to 3,218 cases (1.0 case per 100,000)Reference 23.
Understanding the magnitude of chronic HBV infection in Canada is important as it represents the potential burden of disease in Canada resulting from the prolonged inability to clear the infection. Chronic HBV infection can lead to long-term conditions such as cirrhosis and liver cancerReference 8. Data from the Canadian Organ Replacement Register (CORR) indicate that HBV was the primary diagnosis for 3.0% of liver transplant recipients in Canada, excluding Quebec, from 2007 to 2016Reference 24. In comparison to acute HBV infection, individuals with chronic HBV infection are more likely to transmit the virus to others, as the period of communicability is relatively brief during acute infectionReference 25.
As a result of variable reporting of chronic HBV cases by provinces and territories between 2007 and 2016, the analysis of chronic HBV infection trends over time must be interpreted with caution. CNDSS data indicate that rates of reported chronic HBV cases decreased between 2013 and 2015. In 2016, the highest rates both among males and females were observed in the 30-39 year age group.
The rates of reported chronic HBV infection are higher than those of acute HBV for a variety of reasons, including the longer duration of chronic infection and also the likely under-diagnosis of acute cases due to their largely asymptomatic nature. Chronic HBV infection is more likely to be diagnosed among those who were not immunized as children, as evidenced by higher rates of reported cases among those 30 years old and over, who would have been older than the recommended recipients of vaccine at the time of the implementation of universal immunization programs.
Population seroprevalence studies can help provide additional information on the burden of HBV infection in Canada. The Canadian Health Measures Survey (CHMS)Reference 26Reference 27 found the seroprevalence of current HBV infection, inclusive of both acute and chronic infection, to be 0.4% over a period of data collection spanning from 2007 to 2011. Serological evidence of a previous HBV infection was identified among 4.2% of participants. Of those previously infected with HBV, 79% demonstrated complete resolution and protective immunityReference 28. Such surveys provide useful information and complement the surveillance system to better characterize disease burden due to HBV infection.
There is evidence that immigration from countries where HBV is endemic likely contributes to the burden of HBV in CanadaReference 29. According to one study conducted in 2011, approximately 3% of immigrants to Canada during the early 2000s were estimated to be infected with HBV while only 0.5% of Canadian-born people were infected during the same periodReference 30. However, the prevalence of chronic HBV infection amongst immigrants to Canada could actually be higher than 3% as found in a 2012 study from McGill University in which 6.7% of immigrants had chronic HBVReference 31. In a study in British Columbia, the majority of the chronic HBV infections identified in recent years were among persons who had emigrated from a country where HBV was endemicReference 32.
Though HBV infection rates are generally low among the general population in Canada, past research has demonstrated that certain factors are strongly associated with the risk of infection; these include high-risk sexual activity, injection drug use, household contact with an HBsAg carrier, a history of blood transfusion, and body piercing and tattooingReference 33Reference 34. Due to such risk factors, some vulnerable populations experience higher than average rates of HBV infection, such as people who inject drugs and street-involved youth who may not have benefitted from provincial/territorial immunization programs despite being eligible for themReference 35Reference 36.
2.4 Limitations
There are notable limitations to the findings presented in this report. Reporting practices did not remain consistent over the timeframe included in this report and, as a result, certain provinces and territories were not included in acute and/or chronic HBV infection data analyses during some time periods. Unlike the reporting of acute HBV which was more consistent over the 2009-2016 timeframe, reporting of chronic HBV across jurisdictions over this same period was more variable. In addition, Prince Edward Island, Newfoundland and Labrador, and Nunavut did not specify infection status for the HBV cases reported to CNDSS and have always reported hepatitis B cases as unspecified. Among those provinces that reported acute and chronic cases, some of the cases were also reported as unclassified. In 2016 alone, 578 cases of HBV infections were reported as unspecified and therefore are not presented in this report.
The data are limited to analysis by age, sex, and infection status. At this time, there are no additional data elements in the CNDSS to help explain observed trends. Consequently, it is not clear what proportion of reported HBV infections are due to cases imported from endemic countries, injection drug use, or high risk sexual practices.
Observed trends over time may also be reflective of changes in screening practices or improved diagnostic capability, resulting in increased detection of persons with HBV infection, many of whom likely acquired the infection well before the time of diagnosis. Additionally, these trends may be attributable to the heightened ability to distinguish acute from chronic infection, or improved surveillance and reporting.
Rates based on small numbers of cases are more prone to fluctuation over time, such as with acute HBV, and should be interpreted with caution.
Finally, the HBV rates presented in this report are likely an underestimation of the true burden of infection in Canada. As acute HBV infection is asymptomatic in over 90% of children and 50-70% of adults, the majority of individuals recently infected will not present to a health care practitioner for testing and therefore will not be reported to the CNDSS as an acute case of HBV. Results from the 2007 to 2009 and 2009 to 2011 CHMS suggest that more than half of the survey participants with laboratory-confirmed HBV were unaware of their infectionsReference 28. Additionally, HBV infection often occurs in hard-to-reach populations who may not have access to a health care provider or who may exhibit low health care seeking behaviour.
The burden of chronic HBV infection in Canada, in terms of number of cases, is underestimated in this report due to the unavailability of chronic HBV infection data from different provinces for the timeframe presented. Finally, though in some instances a reported acute case may become a carrier at a later time, this was not assessed in the present report and data provided to PHAC by provinces and territories were considered final for the respective reporting year.
2.5 Conclusion
Although there are limitations to available data, the findings presented in this report help address a significant knowledge gap and are useful for detecting major trends in acute and chronic HBV infection in Canada. Canada continues to have a downward trend in HBV rates, most notably in acute HBV cases, and a continued downward trend in chronic HBV cases will eventually result from the vaccination strategies, especially those targeting high-risk populations.
Given the potential for HBV infection to progress to more serious conditions, such as cirrhosis, hepatocellular carcinoma and liver decompensation, and the consequent potential for putting a strain on Canada's health care system, continued monitoring of HBV infection is essential. Surveillance data are used to inform the development of public health programs, guidelines, and recommendations. PHAC released a primary care reference guide for the management of hepatitis B in 2013Reference 13, and provides recommendations on the use of HBV vaccine in the Canadian Immunization GuideReference 15. In the future, increasing national capacity to differentiate between acute and chronic HBV cases and standardized reporting will generate more robust data to better assess the state of HBV infection in Canada, and further contribute to public health actions.
3.0 Hepatitis C
3.1 Introduction
HCV is an enveloped, single-stranded linear RNA virus belonging to the Flaviviridae family. Six genotypes of hepatitis C virus have been identified; genotype 1 is the predominant strain in Canada and throughout North AmericaReference 37Reference 38. Individuals with acute HCV infection are commonly asymptomatic, which poses a challenge for identifying new cases. Approximately 15% to 50% of individuals will spontaneously clear and recover from their infectionReference 8. Spontaneous clearance has been found to occur more often among those who experience symptomatic HCV infection, which is thought to signal a more robust immune responseReference 39. Approximately 50% to 85% of those with acute HCV infection will progress to chronic infection but will remain asymptomatic for decadesReference 40. Chronic hepatitis C infection can lead to liver fibrosis, cirrhosis and hepatocarcinoma. It is associated with high costs and a significant burden for individuals and for the healthcare system.
It is estimated that up to 246,000 people were living with HCV infection in Canada in 2011; 44% of them were unaware of their infectionReference 41. From 2004 to 2010 in Canada, the number of hospital admissions associated with hepatitis C and liver disease increased at a rate of 6.0% per yearReference 42. Chronic hepatitis C is also the main factor associated with the need for liver transplants in CanadaReference 25 and the disease associated with the greatest relative contribution to the burden of infectious diseases in Ontario according to a 2010 studyReference 43. Data from the Canadian Organ Replacement Register (CORR) indicate that hepatitis C was the second most common primary diagnosis, after cancer, for liver transplant recipients in Canada from 2007 to 2016, excluding QuebecReference 24. HCV was the primary diagnosis for 18.1% of liver transplant recipients.
HCV is highly transmissible, and is spread through contact with infected blood. The majority of HCV infections in Canada occur through the sharing of needles and other drug injection materials (e.g., cooker, water, filter, etc.)Reference 44. In the 2011 surveillance report on HCV in Canada, it was estimated that 54% to 70% of hepatitis C infection cases between 2005 and 2010 were a result of injection drug useReference 44. In a surveillance survey conducted by PHAC in 2004-2008, 63% of newly diagnosed HCV cases with known risk factor information were associated with injection drug useReference 45.
Today, the risk of being infected with HCV from blood transfusions in Canada is significantly lower than becoming infected through injection drug use. In Canada, all blood donations are tested for the virus before transfusionReference 46. In its 2016 surveillance report, the Canadian Blood Services stated that the estimated residual risk of transmitting HCV in Canada through blood transfusions is 1 in 12.6 million donationsReference 21. Other less common routes of HCV transmission include spread through the sharing of sharp instruments and personal hygiene equipment with an infected person (e.g., razors, toothbrushes, scissors and nail clippers), as well as equipment for snorting or smoking drugs (e.g., straws, pipes, etc.).
High-risk populations include persons who inject drugs, incarcerated populations (through contact with infected blood through injection drug use, fights or tattooing), Indigenous peoples (injection drug use being the primary risk factor) and foreign-born persons from endemic countries (prevalence greater than 3%)Reference 47. Persons born during the years 1950-1970 have been also been reported as having high chronic HCV infection ratesReference 41.
Sexual transmission is thought to be rare in general, although HIV-positive gay, bisexual and other men who have sex with men appear to be at an elevated risk of contracting HCV through sexual transmissionReference 48. Additionally, couples who have unprotected sex during a woman's menstrual cycle could have moderate risk of sexual transmission if one of the sexual partners is infected with the virusReference 49. Vertical transmission from mother to child has also been documentedReference 50Reference 51.
Although there is no vaccine to prevent hepatitis C, new treatments called direct-acting antiviral agents (DAA) have been approved by Health Canada since 2014. In addition to being highly effective, these drugs require a shorter duration of treatment than previously used interferon-based treatment and are associated with fewer side effects.
This section of the report summarizes surveillance data on cases and rates of hepatitis C virus infection in Canada during the period 2007 to 2016. The HCV data presented in this report represent unspecified infections and include acute, chronic, resolved, and indeterminate HCV infections.
3.2 National Trends
3.2.1 Trends over time
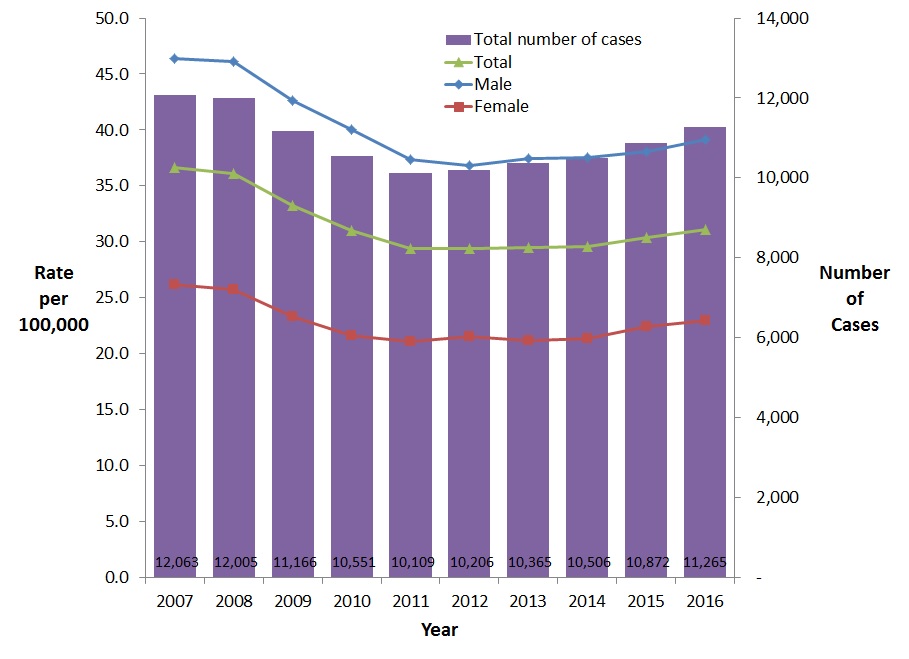
Between 2007 and 2011, the overall rates of reported cases of HCV infection decreased steadily, and appear to be stabilizing or increasing slightly since 2012 (Figure 7). In 2007, a total of 12,063 cases were reported, corresponding to a rate of 36.7 per 100,000, compared to 2016 when a total of 11,265 cases were reported, for a rate of 31.1 per 100,000. This represents a 15.3% decrease from 2007 to 2016. The rate of reported HCV infection was slightly higher in 2016 compared to 2015 (31.1 vs. 30.3 per 100,000 population).
Between 2007 and 2016, reported HCV infection rates were consistently higher among males than females. During this period, the HCV infection rate among males decreased by 15.7% (from 46.4 to 39.1 per 100,000), whereas it decreased by 12.2% among females (from 26.2 to 23.0 per 100,000) (Figure 7).
Figure 7. Reported number of cases and rates of HCV infection in Canada, by sex, CNDSS, 2007 - 2016
Text Description
This graph displays the overall number of reported cases as well as the overall and sex specific rates of reported hepatitis C cases, between 2007 and 2016 in Canada. The horizontal axis shows the calendar years from 2007 to 2016. The vertical axis shows the rate of reported hepatitis C cases per 100,000 people for male, female, and overall, as well as the overall reported number of cases of hepatitis C.
| Year | Overall Number of Cases | Rate per 100,000 people | ||
|---|---|---|---|---|
| Male | Female | Overall | ||
| 2007 | 12,063 | 46.4 | 26.2 | 36.7 |
| 2008 | 12,005 | 46.1 | 25.8 | 36.1 |
| 2009 | 11,166 | 42.6 | 23.3 | 33.2 |
| 2010 | 10,551 | 40.0 | 21.6 | 31.0 |
| 2011 | 10,109 | 37.4 | 21.1 | 29.4 |
| 2012 | 10,206 | 36.8 | 21.5 | 29.4 |
| 2013 | 10,365 | 37.4 | 21.2 | 29.5 |
| 2014 | 10,506 | 37.5 | 21.4 | 29.6 |
| 2015 | 10,872 | 38.0 | 22.4 | 30.3 |
| 2016 | 11,265 | 39.1 | 23.0 | 31.1 |
3.2.2 Rates of reported cases of HCV in Canada by age group and sex, 2016
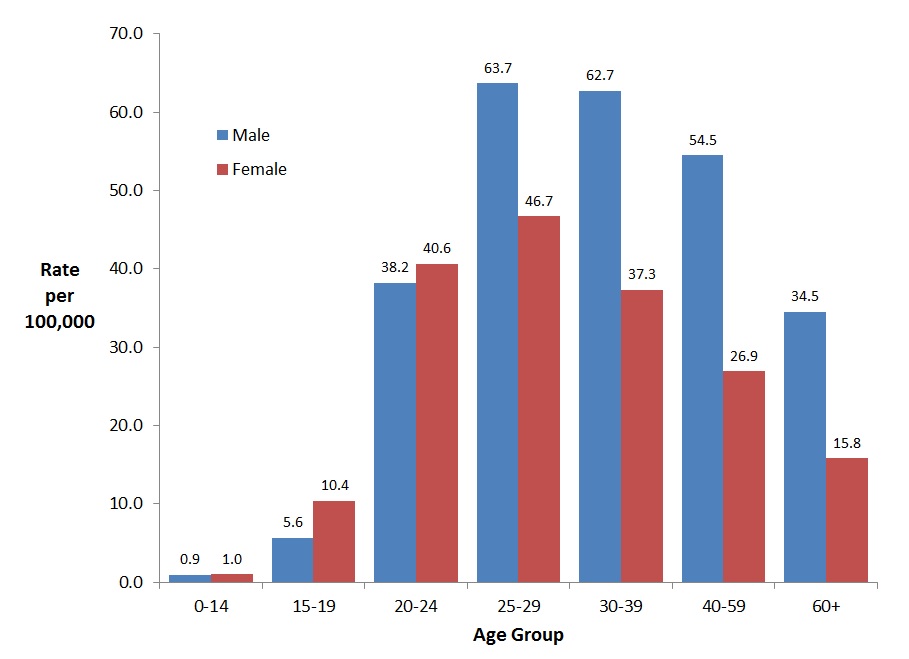
In 2016, 7,039 hepatitis C cases (62.6%) were reported among males compared to 4,204 cases (37.4%) among females. The highest rates of HCV infection among males were observed in the 25-59 year age groups and ranged from 54.5 (40-59 year age group) to 63.7 (25-29 year age group) per 100,000. Among females, the rates were highest in the 25-29 year age group (46.7 per 100,000 population) followed by the 20-24 year age group (40.6 per 100,000 population) and the 30-39 year age group (37.3 per 100,000 population). Rates of HCV infection were lowest among those under 15 years of age, 0.9 and 1.0 per 100,000 for males and females respectively (Figure 8).
Figure 8. Rates of reported cases of HCV in Canada by age group and sex, CNDSS, 2016
Text Description
This graph displays the rate of reported hepatitis C cases by sex and age group, in 2016 in Canada. The horizontal axis shows the age groups from under 15 years of age to over 60 years of age. The vertical axis shows the rate of reported hepatitis C cases per 100,000 for males and females.
| Age Group | Rate per 100,000 people | |
|---|---|---|
| Male | Female | |
| 0-14 years | 0.9 | 1.0 |
| 15-19 years | 5.6 | 10.4 |
| 20-24 years | 38.2 | 40.6 |
| 25-29 years | 63.7 | 46.7 |
| 30-39 years | 62.7 | 37.3 |
| 40-59 years | 54.5 | 26.9 |
| 60+ years | 34.5 | 15.8 |
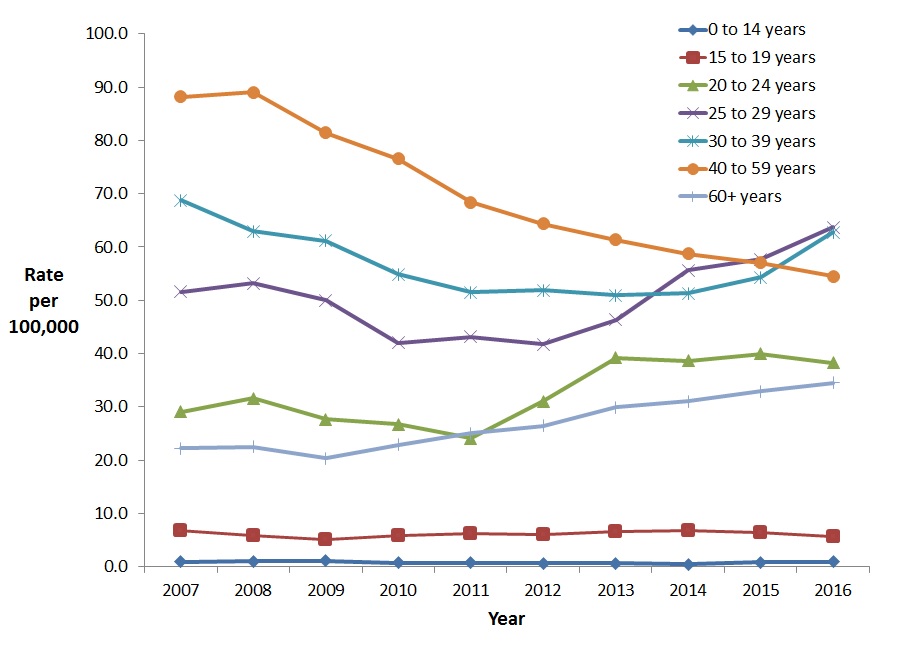
Between 2007 and 2016, males aged 30-59 years old and 15-19 years old showed decreases in the rate of reported cases. There was an 8.7% rate decrease in the 30-39 year age group (from 68.8 to 62.7 cases per 100,000 population), a 38.2% decrease in the 40-59 year age group (from 88.2 to 54.5 per 100,000 population), and a 16.3% decrease in the 15-19 year age group (from 6.7 to 5.6 cases per 100,000). From 2012 to 2016, the rate of reported HCV cases among males younger than 15 years of age appeared to increase the most (59.9%,from 0.6 to 0.9 per 100,000 population) (Figure 9). Between 2007 and 2016, males 60 years of age and older had the highest increase in reported rates (55.6%, from 22.2 to 34.5 per 100,000).
Figure 9. Rates of reported cases of HCV in Canadian males by age group and year, CNDSS, 2007 – 2016
Text Description
This graph displays the overall rate of reported hepatitis C cases among males by age group, between 2007 and 2016, in Canada. The horizontal axis shows the calendar years from 2007 to 2016. The vertical axis shows the rates of reported hepatitis C cases per 100,000 people for age groups 0-14 years of age to over 60 years of age.
| Year | Rate per 100,000 people | ||||||
|---|---|---|---|---|---|---|---|
| 0-14 years | 15-19 years | 20-24 years | 25-29 years | 30-39 years | 40-59 years | 60+ years | |
| 2007 | 0.9 | 6.7 | 29.1 | 51.6 | 68.8 | 88.2 | 22.2 |
| 2008 | 1.0 | 5.8 | 31.6 | 53.2 | 63.0 | 89.0 | 22.5 |
| 2009 | 1.1 | 5.0 | 27.7 | 50.0 | 61.2 | 81.4 | 20.3 |
| 2010 | 0.7 | 5.8 | 26.7 | 42.0 | 54.8 | 76.6 | 22.8 |
| 2011 | 0.7 | 6.2 | 24.0 | 43.2 | 51.5 | 68.4 | 25.0 |
| 2012 | 0.6 | 6.0 | 31.0 | 41.7 | 51.9 | 64.4 | 26.5 |
| 2013 | 0.6 | 6.5 | 39.2 | 46.3 | 51.0 | 61.4 | 29.9 |
| 2014 | 0.5 | 6.7 | 38.6 | 55.6 | 51.3 | 58.7 | 31.1 |
| 2015 | 0.8 | 6.5 | 40.0 | 57.7 | 54.3 | 57.0 | 32.9 |
| 2016 | 0.9 | 5.6 | 38.2 | 63.7 | 62.7 | 54.5 | 34.5 |
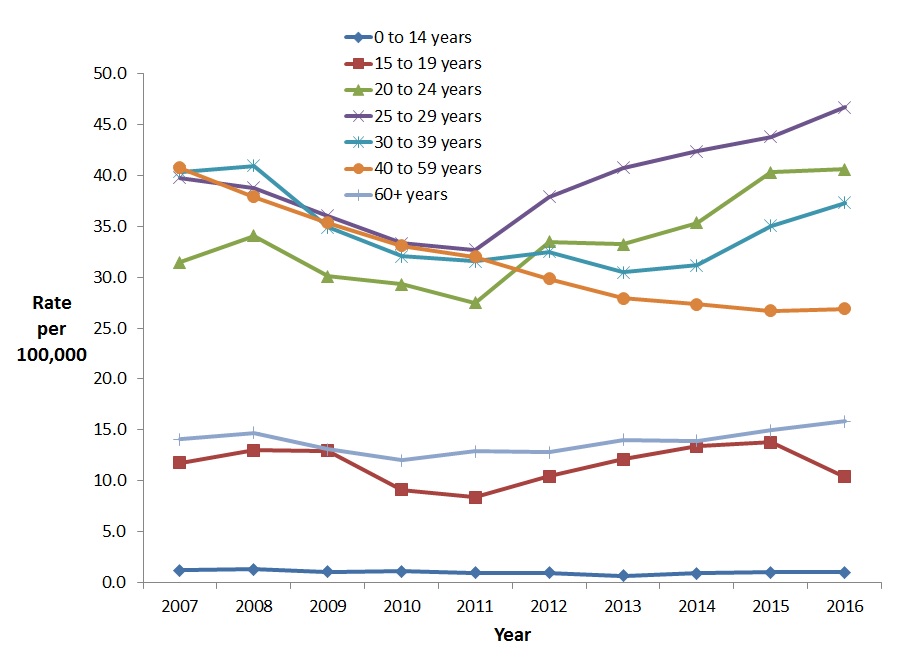
The highest increase in rates of reported HCV cases among females between 2007 and 2016 was observed for the 20-24 year age group (29.1%, from 31.5 to 40.6 cases per 100,000 population) (Figure 10). For the same period, the greatest decrease in rate for women was observed in the 40-59 year age group of (34.0%, from 40.7 to 26.9 per 100,000).
Age group and sex-specific rates of reported cases of hepatitis C from 2007 to 2016 are presented in Appendix D.
Figure 10. Rates of reported cases of HCV in Canadian females by age group and year, CNDSS, 2007 – 2016
Text Description
This graph displays the overall rate of reported hepatitis C cases among females by age group, between the years 2007 and 2016, in Canada. The horizontal axis shows the calendar years from 2007 to 2016. The vertical axis shows the rates of reported hepatitis C cases per 100,000 people for age groups 0-14 years of age to over 60 years of age.
| Year | Rate per 100,000 people | ||||||
|---|---|---|---|---|---|---|---|
| 0-14 years | 15-19 years | 20-24 years | 25-29 years | 30-39 years | 40-59 years | 60+ years | |
| 2007 | 1.2 | 11.7 | 31.5 | 39.8 | 40.4 | 40.7 | 14.1 |
| 2008 | 1.3 | 13.0 | 34.1 | 38.8 | 41.0 | 37.9 | 14.7 |
| 2009 | 1.0 | 12.9 | 30.1 | 36.0 | 34.9 | 35.3 | 13.1 |
| 2010 | 1.1 | 9.1 | 29.3 | 33.3 | 32.1 | 33.1 | 12.0 |
| 2011 | 0.9 | 8.3 | 27.5 | 32.7 | 31.6 | 32.0 | 12.9 |
| 2012 | 0.9 | 10.4 | 33.5 | 37.9 | 32.5 | 29.8 | 12.8 |
| 2013 | 0.7 | 12.1 | 33.2 | 40.8 | 30.5 | 27.9 | 14.0 |
| 2014 | 0.9 | 13.4 | 35.3 | 42.4 | 31.2 | 27.3 | 13.9 |
| 2015 | 1.0 | 13.7 | 40.3 | 43.8 | 35.1 | 26.7 | 14.9 |
| 2016 | 1.0 | 10.4 | 40.6 | 46.7 | 37.3 | 26.9 | 15.8 |
3.2.3 Reported number of cases and rates of HCV infection by sex and province/territory in Canada, 2016
In 2016, the highest rates of reported cases of HCV infection were observed in Saskatchewan (62.8 per 100,000 population) and British Columbia (48.5 per 100,000 population), followed by Yukon (47.3 per 100,000 population), Alberta (39.3 per 100,000 population), Manitoba (34.9 per 100,000 population), and Nova Scotia (32.3 per 100,000 population); all these provinces/territories reported rates above the national average of 31.1 per 100,000 population (Table 3).
Rates among males were consistently higher than rates among females across all provinces and territories, except in Nunavut where no cases were reported in 2016.
| Jurisdiction | Male | Female | TotalTable 3 Footnote 1 | |||
|---|---|---|---|---|---|---|
| Number of cases | Rate per 100,000 | Number of cases | Rate per 100,000 | Number of cases | Rate per 100,000 | |
| Canada | 7,039 | 39.1 | 4,204 | 23.0 | 11,265 | 31.1 |
| BC | 1,488 | 63.0 | 819 | 34.2 | 2,307 | 48.5 |
| AB | 1,028 | 47.9 | 638 | 30.6 | 1,667 | 39.3 |
| SK | 439 | 75.8 | 282 | 49.5 | 721 | 62.8 |
| MB | 250 | 38.1 | 209 | 31.6 | 460 | 34.9 |
| ON | 2,668 | 38.8 | 1,660 | 23.4 | 4,342 | 31.1 |
| QC | 688 | 16.6 | 359 | 8.6 | 1,053 | 12.7 |
| NB | 122 | 32.6 | 59 | 15.4 | 181 | 23.9 |
| NS | 211 | 45.4 | 95 | 19.6 | 306 | 32.3 |
| PE | 19 | 26.1 | 13 | 17.0 | 32 | 21.4 |
| NL | 107 | 40.9 | 58 | 21.6 | 165 | 31.1 |
| YT | 11 | 56.8 | 7 | 37.4 | 18 | 47.3 |
| NT | 8 | 35.0 | 5 | 22.9 | 13 | 29.1 |
| NU | 0 | 0.0 | 0 | 0.0 | 0 | 0.0 |
| ||||||
3.2.4 Reported number of cases and rates of HCV infection by age group and province/territory in Canada, 2016
The proportion of cases of hepatitis C by age group is presented in Table 4 for each province and territory. In 2016, the highest proportion of cases was found in the 20-39 year age group in Canada. Although this age group represents 27% of the total Canadian population, they accounted for 43.2% of all cases. However, when adding up proportion of cases for those age 40 and over, it appeared that in Alberta, British Columbia, the Northwest Territories, Ontario, Quebec and Yukon, over 50% of the cases were 40 years old and over. This proportion of cases over 40 years was 54.8% nationally.
| Province/Territory | Proportion of cases of hepatitis C by age group (%)* |
|||
|---|---|---|---|---|
| 0-19 | 20-39 | 40-59 | 60+ | |
| Canada | 2.0 | 43.2 | 36.7 | 18.1 |
| BC | 1.0 | 39.1 | 37.1 | 22.8 |
| AB | 1.6 | 38.7 | 41.5 | 18.2 |
| SK | 4.0 | 59.1 | 30.2 | 6.7 |
| MB | 3.3 | 57.6 | 27.6 | 11.1 |
| ON | 2.2 | 44.3 | 35.3 | 18.1 |
| QC | 0.9 | 25.6 | 49.4 | 24.1 |
| NB | 3.3 | 53.6 | 30.9 | 12.2 |
| NS | 2.6 | 61.8 | 26.8 | 8.8 |
| PE | 3.1 | 75.0 | 21.9 | 0.0 |
| NL | 4.3 | 69.8 | 17.9 | 8.0 |
| YT | 0.0 | 50.0 | 27.8 | 22.2 |
| NT | 0.0 | 15.4 | 38.5 | 46.2 |
| NU | N/A | N/A | N/A | N/A |
| N/A: Not available | ||||
3.3 Discussion
Infection with HCV is a significant public health issue affecting certain segments of the Canadian population, and has multiple treatment and care implicationsReference 25.
Between 2007 and 2016, the overall rate of reported HCV infections in Canada declined by 15.3%. However, when considering the past 5 years (2012-2016), the rates appear to have stabilized (from 29.5 in 2012 to 31.1 per 100,000 population in 2016). The majority of cases (62.6%) were found among males in 2016, in line with previous years. The general trend in HCV rates among both men and women consists of a sharp decrease in the 1990s and 2000s followed by stabilization in recent years.
Hepatitis C rates recently increased in adults aged 20-39 years old. Over the past 5 years, rates among those 25-39 years old increased the most. Noteworthy is the fact that rates among 20-24 year old females also notably increased over the past 5 years. In 2016, the highest rates of hepatitis C were found among men 25-59 years of age and among women 20-39 years of age.
Rates in provinces and territories ranged from 0.0 to 62.8 per 100,000 population with six provinces and territories (British Columbia, Alberta, Saskatchewan, Manitoba, Yukon and Nova Scotia) exhibiting rates above the 2016 national average of 31.1 per 100,000 population.
The United States Centers for Disease Control and Prevention (USCDC) reported an increase in acute cases of hepatitis C since 2010 in both men and women with an overall 3.5-fold increase from 2010 through 2016 after having declined by 48.2% between 2001 and 2010Reference 52. Among those with known risk factors, injection drug use was the most frequently reported risk exposure. Reasons for rising rates were said to be related to an increase in injection drug use and to a lesser extent, to improved case detection. Injection drug use was also reported as the most important risk factor for HCV infection in FranceReference 53 and in the United Kingdom (UK)Reference 54. In the latter, men also had higher rates than females. In 2016, the highest number of cases was reported among those between 25-49 years of age in the UK. Similarly, the highest rate was in the 25-39 year age group in Australia in 2014Reference 55. Similar to the situation observed in Canada, the rate of hepatitis C infection in Australia has remained stable between 2012 and 2015, following a 22% decline between 2006 and 2011. A similar trend was observed in all age groups.
The Canadian Health Measures Survey (CHMS) estimated the seroprevalence of the HCV antibody (anti-HCV), a marker of lifetime exposure to the virus, to be 0.5% of the household-dwelling population in Canada over a period of data collection spanning 2007 to 2011Reference 28. However, 2011 modelled prevalence estimates, taking into account vulnerable populations not surveyed by the CHMS (such as the homeless, prison inmates, and foreign-born populations who do not speak English or French) indicate that the rate of anti-HCV in the Canadian population may be closer to 1% (plausibility range: 0.6-1.3%), with approximately 42% to 45% of those being unaware of their status. The prevalence of chronic HCV infection was estimated to be at 0.6%Reference 41.
In a 2014 study, it was estimated that by 2035, 23% of chronic hepatitis C patients in Canada will experience severe complicationsReference 56. Between 2013 and 2035, compensated cirrhosis is expected to increase by 89%, decompensated cirrhosis by 80%, hepatocellular carcinoma by 205%, and liver-related deaths by 160%. Another study published in 2016 indicated that between 1990 and 2013, disability-adjusted life years in high income North American countries increased from 89.2 per 100,000 to 177.2 per 100,000 for HCV infection attributable to injection drug useReference 57.
Although no deaths were reported in Canada due to acute HCV infection in 2013 (as compared to 33 in 2012 and 34 in 2011), 465 deaths were attributed to chronic HCV in that year (an increase from the 408 cases reported in 2012)Reference 17. As with HBV, there is likely considerable underestimation of the number of HCV-related deaths due to potential misclassification on death certificatesReference 58.
Males have consistently represented a larger proportion of reported HCV infections, particularly among those aged 25 years and over although differences in male and female rates have narrowed since 2007 because of a larger decrease in the number of reported HCV infections among males (15.7%) compared to females (12.2%). These differences in rates between males and females might be explained in part by injection drug use, the most prevalent mode of transmission of HCV in Canada. Studies among people who inject drugs in Canada during 2010 to 2012 found that the lifetime exposure to hepatitis C (as measured by HCV antibody in a dried blood spot specimen) was 68%Reference 59. The majority of participants in these studies (and the majority of people who inject drugs in general) are male which may partly explain why rates of reported HCV cases are higher among men. Differences between rates of reported infections and undiagnosed infections among males and females may also be a reflection of different testing behaviours as females are more likely to seek health care and testingReference 60.
Trends in HCV infection rates may be affected by changes in drug use practices. For example, studies have shown that use of smoked or snorted drugs such as crack cocaine in place of those administered primarily by injection can lessen the risk of HCV and other blood-borne infection transmissionReference 61. Public health interventions aimed at preventing adverse consequences of drug use may also have a significant effect on these trends by affecting transmission ratesReference 62.
As with HBV infection, changes in blood donation and infection control practices may have also contributed to Canada's decreasing rates of HCV. Canadian Blood Services data from 2016 indicate that HCV was detected in 43.4 per 100,000 first-time donors, and 0.5 per 100,000 repeat donorsReference 21.
An additional source of HCV cases may be immigration to Canada from countries where the virus is endemic, particularly from those regions where infection control measures to prevent the transmission of blood-borne infections in health care settings are not routinely implemented. In 2002, it was estimated that immigrants accounted for 20% of hepatitis C cases in CanadaReference 63.
New highly effective direct-acting antiviral (DAA) treatments are making a difference; they provide an opportunity for broad treatment scale-up, as they might now be more acceptable to high risk populations such as people who inject drugs, given their short treatment duration and lack of side effects, contrary to previous interferon-based regimensReference 64Reference 65. One challenge raised by hepatitis C treatment is the possibility of a higher risk of reinfection after shorter, better-tolerated treatments if risk behaviours are continued, especially in high risk populations such as people who inject drugs and HIV-positive gay, bisexual and other men who have sex with menReference 66Reference 67Reference 68. Concurrent harm-reduction strategies and behavioural and structural interventions are needed along with treatment scale-up to reduce the risk of reinfections. The current public health crisis of opioid overdoses may add another burden in populations such as people who inject drugs who are concurrently affected by the opioid epidemic and hepatitis C. Interventions implemented to address one of these issues should also support the second one, where possible.
3.4 Limitations
The findings of this report should be interpreted in light of several data limitations. First, the HCV case definition used for national surveillance and the reporting protocols used by provinces and territories have evolved over time, which may have affected case reporting. The case definition has consistently allowed confirmatory testing to be conducted using a second manufacturer's enzyme immunoassay (EIA). The lower sensitivity and specificity of first and second generations of these HCV assays may have affected the accuracy of resulting HCV surveillance dataReference 69.
Second, it is uncertain to what extent these data reflect true HCV incidence. Those with acute HCV infection are commonly asymptomatic, and thus may not have been tested or diagnosed; as a result, CNDSS data may reflect primarily chronic cases. According to results from the CHMS, only 30% of Canadian respondents who tested positive for a current HCV infection reported having been diagnosed with HCVReference 28. In addition, due to the long duration of infection, it is possible that an individual may be tested and diagnosed in more than one province or territory over time, and consequently counted more than once in the CNDSS dataset.
Third, the data available from CNDSS are limited to analysis by age, sex, and province/territory. At this time, there are no additional data elements in the CNDSS that could explain observed trends. Consequently, it is not clear what proportion of reported HCV infections is due to transmission through injection drug use or other risky behaviours or whether the virus is disproportionality affecting other populations.
Finally, information on whether reported HCV infections were acute or chronic was not available from most provinces and territories; the data presented here represent unspecified cases and so cannot indicate trends in acute (or more recent) HCV infection.
3.5 Conclusion
The rate of reported HCV infections appears to be stabilizing in Canada. Given the potential for HCV infection to progress to more serious conditions and the consequent potential burden on Canada's health care system, continued monitoring of HCV infections is essential.
To improve the ability of surveillance data to help monitor Canada's progress towards prevention and control of HCV infection, additional efforts are being made to harmonize the reporting of hepatitis C cases by stage of infection and to improve the quality of HCV infection data collected through routine surveillance. Surveillance, supported by research that examines factors affecting observed trends, can contribute to the development of tailored interventions to address HCV infections in Canada.
References
- Reference 1
-
World Health Organization. Global Health Sector Strategy on Viral Hepatitis. 2016. Available at: http://apps.who.int/iris/bitstream/handle/10665/246177/WHO-HIV-2016.06-eng.pdf;jsessionid=05604C0B25A229B8FDC7A85F11DD152C?sequence=1. Accessed March 26, 2018.
- Reference 2
-
World Health Organization. News release: Sixty-ninth World Health Assembly closes. 2016. Available at: http://www.who.int/news-room/detail/28-05-2016-sixty-ninth-world-health-assembly-closes. Accessed March 26, 2018.
- Reference 3
-
Public Health Agency of Canada. Case definitions for communicable diseases under national surveillance Available at http://www.phac-aspc.gc.ca/publicat/ccdr-rmtc/09vol35/35s2/index-eng.php. Accessed July 20, 2017.
- Reference 4
-
Public Health Agency of Canada. Canadian Notifiable Disease Surveillance System National report: 2005-2008. 2012.
- Reference 5
-
Public Health Agency of Canada. Supplement - case definitions for communicable diseases under national surveillance - 2009. Canada Communicable Disease Report 2009;35(Supplement 2).
- Reference 6
-
Gitlin N. Hepatitis B: diagnosis, prevention, and treatment. Clin Chem 1997 Aug;43(8 Pt 2):1500-1506.
- Reference 7
-
Ganem D, Prince AM. Hepatitis B virus infection — natural history and clinical consequences. N Engl J Med. 2004 Mar 11;350(11):1118-1129.
- Reference 8
-
Heymann D editor. Control of communicable diseases manual. 19th ed. United States of America: American Public Health Association; 2008.
- Reference 9
-
Davis LG, Weber DJ, Lemon SM. Horizontal transmission of hepatitis B virus. Lancet. 1989 Apr 22;1(8643):889-893.
- Reference 10
-
Modi AA, Feld JJ. Viral hepatitis and HIV in Africa. AIDS Rev. 2007 Jan-Mar;9(1):25-39.
- Reference 11
-
World Health Organization. Hepatitis B. April 2017; Available at: http://www.who.int/mediacentre/factsheets/fs204/en/. Accessed July 20, 2017.
- Reference 12
-
World Health Organization. Hepatitis B vaccines. Weekly Epidemiological Record. 2009 Oct 2;84(40):405-420.
- Reference 13
-
Public Health Agency of Canada. Primary Care Management of Hepatitis B - Quick Reference. 2013.
- Reference 14
-
National Advisory Committee on Immunization (NACI). Canadian national immunization report: program update. Paediatr Child Health 1999;4(Suppl C):30C.
- Reference 15
-
Public Health Agency of Canada. Page 7: Canadian Immunization Guide: Part 4 Active Vaccines -Hepatitis B Vaccine. 2017 Mar; Available at: https://www.canada.ca/en/public-health/services/publications/healthy-living/canadian-immunization-guide-part-4-active-vaccines/page-7-hepatitis-b-vaccine.html. Accessed March 2017.
- Reference 16
-
Health Canada. Canadian Immunization Guide Available at https://www.canada.ca/en/public-health/services/canadian-immunization-guide.html. Accessed July 20, 2017.
- Reference 17
-
Statistics Canada. Table 102-0521 – deaths, by cause, Chapter I: Certain infectious and parasitic diseases (A00 to B99), age group and sex, Canada, annual (number), CANSIM (database). Accessed June 28, 2017.
- Reference 18
-
Pohani G, Zou S, Tepper M. Trends of hepatitis B and hepatitis C mortality in Canada, 1979-1997. Can J Public Health. 2001 Jul-Aug;92(4):250-254.
- Reference 19
-
Statistics Canada. Childhood National Immunization Coverage Survey, 2015 Ottawa: Stats Can 2017. Available at: http://www.statcan.gc.ca/daily-quotidien/170628/dq170628a-eng.pdf . Accessed June 30, 2017.
- Reference 20
-
Public Health Agency of Canada. Vaccine uptake in Canadian adults: results from the 2014 National Immunization Coverage Survey. 2016; Available at: https://www.canada.ca/en/public-health/services/publications/healthy-living/vaccine-uptake-canadian-adults-results-2014-adult-national-immunization-coverage-survey.html. Accessed June 30, 2017.
- Reference 21
-
Canadian Blood Services. Surveillance Report, 2016. Ottawa: CBS. Available at: https://blood.ca/sites/default/files/Surveillance_Report_2016_FINAL.pdf. Accessed July 11, 2017.
- Reference 22
-
Public Health England. Acute hepatitis B (England): annual report for 2016. Public Health England, Public Health England. London: Public Health England, 2017. Pg. 1 - 6; Available at: https://assets.publishing.service.gov.uk/government/uploads/system/uploads/attachment_data/file/643558/hpr3117_hepB_ann.pdf. Accessed July 20, 2018.
- Reference 23
-
Surveillance for Viral Hepatitis – United States, 2016.. Centers for Disease Control and Prevention. United States, 2018; Available at: https://www.cdc.gov/hepatitis/statistics/2016surveillance/index.htm. Accessed September 28, 2018
- Reference 24
-
Canadian Institute for Health Information. Canadian Organ Replacements Register Annual Statistics, 2007-2016. CIHI 2018 Ottawa, ON. Available at: https://www.cihi.ca/en/corr-annual-statistics-extra-renal-transplants-2007-to-2016. Accessed July 20, 2018.
- Reference 25
-
Canadian Liver Foundation. Liver disease in Canada: A Crisis In The Making. 2013 Mar. Available at: https://www.liver.ca/wp-content/uploads/2017/09/Liver-Disease-in-Canada-E-3.pdf.. Accessed March 26, 2018.
- Reference 26
-
Statistics Canada. Canadian Health Measures Survey (CHMS) Data User Guide: Cycle 1. 2011 Apr. Available at: http://www23.statcan.gc.ca/imdb-bmdi/pub/document/5071_D2_T1_V1-eng.htm. Accessed March 26, 2018.
- Reference 27
-
Statistics Canada. List of other Canadian Health Measures Survey (CHMS) documents available. 2016 Jun 3; Available at: http://www23.statcan.gc.ca/imdb-bmdi/document/5071_D4_T9_V1-eng.htm. Accessed December 18, 2013.
- Reference 28
-
Rotermann M, Langlois K, Andonov A, Trubnikov M. Seroprevalence of hepatitis B and C virus infections: Results from the 2007 to 2009 and 2009 to 2011 Canadian Health Measures Survey. Health Rep. 2013 Nov;24(11):3-13.
- Reference 29
-
Greenaway C, Narasiah L, Plourde P, Ueffing E, Pottie K, Deschenes M, et al. Appendix 5: Hepatitis B: evidence review for newly arriving immigrants and refugees. Canadian Medical Association Journal 2011;183(12).
- Reference 30
-
Pottie K, Greenaway C, Feightner J, Welch V, Swinkels H, Rashid M, et al. Evidence-based clinical guidelines for immigrants and refugees. CMAJ. 2011 Sep 6; 183(12):E824-E925.
- Reference 31
-
Rossi C, Shrier I, Marshall L, Cnossen S, Schwartzman K, Klein MB, et al. Seroprevalence of Chronic Hepatitis B Virus Infection and Prior Immunity in Immigrants and Refugees: A Systematic Review and Meta-Analysis. PloS One. 2012;7(9):e44611. Available at: http://journals.plos.org/plosone/article/file?id=10.1371/journal.pone.0044611&type=printable. Accessed April 12, 2017.
- Reference 32
-
BC Centre for Disease Control. British Columbia Annual Summary of Reportable Diseases, 2013. 2014 Sep 3. Available at: http://www.bccdc.ca/resource-gallery/Documents/Statistics%20and%20Research/Statistics%20and%20Reports/Epid/Annual%20Reports/2013CDAnnualReportFinal.pdf. Accessed March 26, 2018.
- Reference 33
-
Jafari S, Buxton JA, Afshar K, Copes R, Baharlou S. Tattooing and risk of hepatitis B: a systematic review and meta-analysis. Can J Public Health. 2012 May-Jun;103(3):207-212.
- Reference 34
-
Zhang J, Zou S, Giulivi A. Epidemiology of hepatitis B in Canada. Can J Infect Dis. 2001 Nov-Dec;12(6):345-350.
- Reference 35
-
Moses S, Mestery K, Kaita KD, Minuk GY. Viral hepatitis in a Canadian street-involved population. Can J Public Health. 2002 Mar-Apr;93(2):123-128.
- Reference 36
-
Huang L, Gilbert ML, Rossi MF, Haase D, Wright J, Sicard N, et al. Trends in vaccine-induced immunity to hepatitis B among Canadian street-involved youth. J Urban Health. 2010 Mar;87(2):337-348.
- Reference 37
-
Joy JB, McCloskey RM, Nguyen T, Liang RH, Khudyakov Y, Olmstead A, et al. The spread of hepatitis C virus genotype 1a in North America:a retrospective phylogenetic study. Lancet Infect Dis.2016 Jun; 16(6):698-702.
- Reference 38
-
Messina JP, Humphreys I, Flaxman A, Brown A, Cooke GS, Pybus OG, et al. Global distribution and prevalence of hepatitis C virus genotypes. Hepatology. 2015 Jan;61(1):77–87.
- Reference 39
-
Micallef JM, Kaldor JM, Dore GJ. Spontaneous viral clearance following acute hepatitis C infection: a systematic review of longitudinal studies. J Viral Hepat. 2006 Jan;13(1):34-41.
- Reference 40
-
Wong T, Lee SS. Hepatitis C: a review for primary care physicians. CMAJ. 2006 Feb 28;174(5):649-659.
- Reference 41
-
Trubnikov M, Yan P, Archibald C. Estimated prevalence of Hepatitis C virus infection in Canada, 2011. CCDR. 2014 Dec 8;40(19):429-436.
- Reference 42
-
Schanzer DL, Paquette D, Lix LM. Historical trends and projected hospital admissions for chronic hepatitis C infection in Canada : a birth cohort analysis. CMAJ Open. 2014. DOI:10.9778/cmajo.20130087. Available at: https://www.ncbi.nlm.nih.gov/pmc/articles/PMC4183164/pdf/cmajo.20130087.pdf. Accessed March 26, 2018.
- Reference 43
-
Kwong J, Crowcroft N, Campitelli M, Ratnasingham S, Daneman N, Deeks S, et al. Ontario Burden of Infectious Disease Study (ONBOIDS): An OAHPP/ICES Report 2010;Toronto: Ontario Agency for Health Protection and Promotion, Institute for Clinical Evaluative Sciences. Available at: https://www.publichealthontario.ca/en/eRepository/ONBoID_ICES_Report_ma18.pdf. Accessed July 20, 2017.
- Reference 44
-
Public Health Agency of Canada. Hepatitis C in Canada 2005-2010 Surveillance Report. Centre for Communicable Diseases and Infection Control, Infectious Disease Prevention and Control Branch, Public Health Agency of Canada; 2011. Available at: http://publications.gc.ca/collections/collection_2012/aspc-phac/HP40-70-2012-eng.pdf. Accessed April 12, 2017.
- Reference 45
-
Public Health Agency of Canada, Hep C & STI, surveillance and epi section. Epidemiology of acute hepatitis C infection in Canada: results from the enhanced hepatitis strain surveillance system (EHSSS). 2009. Available at: http://publications.gc.ca/collections/collection_2010/aspc-phac/HP40-41-2009-eng.pdf. Accessed July 20, 2017.
- Reference 46
-
Canadian Blood Services. Blood Safety. 2017 Available at: https://blood.ca/en/blood/blood-safety. Accessed July 20, 2017.
- Reference 47
-
Ha S, Totten S, Pogany L, Wu J, Gale-Rowe M. Hepatitis C in Canada and the importance of risk-based screening. Can Comm Dis Rep. 2016;42:57-62. Available at : http://www.phac-aspc.gc.ca/publicat/ccdr-rmtc/16vol42/dr-rm42-3/assets/pdf/16vol42_3-ar-02-eng.pdf. Accessed April 12, 2017.
- Reference 48
-
Totten S, McGuire M, Cox J, Lambert G, Fyfe M, Husbands W, et al. Hepatitis C virus in men who have sex with men with no history of injection drug use - Evidence for sexual transmission? A Canadian perspective. http://sti.bmj.com/content/87/Suppl_1/A145.1.
- Reference 49
-
Canadian Liver Foundation. Hepatitis C. 2016 Available at: https://www.liver.ca/patients-caregivers/liver-diseases/hepatitis-c/. Accessed July 20, 2017.
- Reference 50
-
Bevilacqua E, Fabris A, Floreano P, Pembrey L, Newell ML, Tovo PA, et al. Genetic factors in mother-to-child transmission of HCV infection. Virology. 2009 Jul 20;390(1):64-70.
- Reference 51
-
Ngo-Giang-Huong N, Jourdain G, Sirirungsi W, Decker L, Khamduang W, Le Coeur S, et al. Human immunodeficiency virus-hepatitis C virus co-infection in pregnant women and perinatal transmission to infants in Thailand. Int J Infect Dis. 2010 Jul;14(7):e602-7.
- Reference 52
-
US CDC. Viral Hepatitis Surveillance –United States, 2016. Available at: https://www.cdc.gov/hepatitis/statistics/2016surveillance/pdfs/2016HepSurveillanceRpt.pdf
- Reference 53
-
Vaux S, Pioche C, Brouard C, Pillonel J, Bousquet V, et al. Surveillance des hépatites B et C. Saint-Maurice : Santé publique France ; 2017. 28 p. Available at: http://invs.santepubliquefrance.fr/Publications-et-outils/Rapports-et-syntheses/Maladies-infectieuses/2017/Surveillance-des-hepatites-B-et-C
- Reference 54
-
Public Health England. Hepatitis C in England – 2018 report. Available at: https://assets.publishing.service.gov.uk/government/uploads/system/uploads/attachment_data/file/693917/HCV_in_England_2018.pdf
- Reference 55
-
The Kirby Institute. Hepatitis B and C in Australia Annual Surveillance Report Supplement 2016. The Kirby Institute, UNSW Australia, Sydney NSW 2052. Available at: https://kirby.unsw.edu.au/sites/default/files/kirby/report/SERP_HepBandC-Annual-Surveillance-Report-Supp-2016.pdf
- Reference 56
-
Myers RP, Krajden M, Bilodeau M, Kaita K, Marotta P, Peltekian K, et al. Burden of disease and cost of chronic hepatitis C infection in Canada. Can J Gastroenterol Hepatol. 2014 May; 28(5):243-250.
- Reference 57
-
Degenhardt L, Charlson F, Stanaway J, Larney S, Alexander LT, Hickman M, et al.. Estimating the burden of disease attributable to injecting drug use as a risk factor for HIV, hepatitis C, and hepatitis B: findings from the Global Burden of Disease Study 2013. Lancet Infect Dis. 2016 Dec; 16(12):1385-1398.
- Reference 58
-
Mahajan R, Xing J, Liu SJ, Ly KN, Moorman AC, Rupp L, et al. Mortality among persons in care with hepatitis C virus infection: the Chronic Hepatitis Cohort Study (CHeCS), 2006-2010. Clin Infect Dis. 2014 Apr;58(8):1055-1061.
- Reference 59
-
Public Health Agency of Canada. Summary of key findings from I-Track Phase 3 (2010–2012). Ottawa (ON): The Agency; 2014. Available at: https://www.canada.ca/en/public-health/services/hiv-aids/publications/summary-key-findings-i-track-phase-3-2010-2012.html.
- Reference 60
-
Galdas PM, Cheater F, Marshall P. Men and health help-seeking behaviour: literature review. J Adv Nurs. 2005 Mar;49(6):616-623.
- Reference 61
-
Strike C, Gohil H, Watson TM. Safer crack cocaine smoking equipment distribution: Comprehensive best practice guidelines. Prevention in Focus: Spotlight on programming and research. 2014. Available at: http://www.catie.ca/en/pif/fall-2014/safer-crack-cocaine-smoking-equipment-distribution-comprehensive-best-practice-guideli.
- Reference 62
-
Grebely J, Lima VD, Marshall BD, Milloy MJ, DeBeck K, Montaner J, et al. Declining incidence of hepatitis C virus infection among people who inject drugs in a Canadian setting, 1996-2012. PLoS One. 2014 Jun 4;9(6):e97726.
- Reference 63
-
Greenaway C, Thu Ma A, Kloda LA, Klein M, Cnossen S, Schwarzer G, et al. The Seroprevalence of Hepatitis C Antibodies in Immigrants and Refugees from Intermediate and High Endemic Countries: A Systematic Review and Meta-Analysis. PLoS One. 2015 Nov 11; 10(11):e0141715. Available at: http://journals.plos.org/plosone/article/file?id=10.1371/journal.pone.0141715&type=printable. Accessed April 12, 2017.
- Reference 64
-
Roy E, Nonn E, Haley N, Cox J (2007). Hepatits C meanings and preventive strategies among street-involved young injection drug users in Montreal. International journal of drug policy : 18:397-40.
- Reference 65
-
Harris M, Rhodes T. Hepatitis C treatment access and uptake for people who inject drugs: a review mapping the role of social factors. Harm Reduction Journal. 2013May;10:7. doi:10.1186/1477-7517-10-7.
- Reference 66
-
Simmons B, Saleem J, Hill A, Riley RD, Cooke GS. Risk of Late Relapse or Reinfection With Hepatitis C Virus After Achieving a Sustained Virological Response: A Systematic Review and Meta-analysis, Clinical Infectious Diseases, Volume 62, Issue 6, 15. 2016 March, 62(6):683-694.
- Reference 67
-
Ingiliz P, Martin TC, Rodger A, Stellbrink H-J, Mauss S, Boesecke C, et al. HCV reinfection incidence and spontaneous clearance rates in HIV-positive men who have sex with men in Western Europe. Journal of Hepatology. 2017 Feb;66(2):282-287.
- Reference 68
-
Hajarizadeh B, Grebely J, Martinello M, Matthews GV, Lloyd AR, Dore GJ. Hepatitis C treatment as prevention: evidence, feasibility, and challenges. The Lancet Gastroenterology & Hepatology. 2016 Dec;1(4):317-327.
- Reference 69
-
Kesli R. Evaluation of assay methods and false positive results in the laboratory diagnosis of hepatitis C virus infection. Archives of Clinical Microbiology. 2011;2(4):1-4.
Appendix A: Case Definitions
| Infection status | Case definitionReference 3 |
|---|---|
Acute HBV infection |
HBsAg and anti-HBcIgM positive in the context of a compatible clinical history or probable exposure OR clearance of HBsAg in a person who was documented to be HBsAg positive within the last six months in the context of a compatible clinical history or probable exposure |
Confirmed chronic HBV infection |
a person being HBsAg positive for more than 6 months OR detection of HBsAg in the documented absence of anti-HBcIgM OR detection of HBV DNA for more than 6 months. |
Unspecified HBV infectionTable 5 Footnote 1 |
serological profile not in line with either acute or chronic case definition and HBsAg positive OR detection of HBV DNA |
| |
| Infection status | Case definitionReference 4 |
|---|---|
Confirmed case - Acute or recent infection |
Detection of hepatitis C virus antibodies (anti-HCV) or hepatitis C virus RNA (HCV RNA) in a person with discrete onset of any symptom or sign of acute viral hepatitis within 6 months preceding the first positive HCV test AND negative anti-HAV IgM, and negative anti-HBc IgM or HBsAg tests AND serum alanine aminotransferase (ALT) greater than 2.5 times the upper normal limit OR Detection of hepatitis C virus antibodies (anti-HCV) in a person with a documented anti-HCV negative test within the preceding 12 months OR Detection of hepatitis C virus RNA (HCV RNA) in a person with a documented HCV RNA negative test within the preceding 12 months |
Confirmed case – Unspecified (including chronic and resolved infectionsTable 6 Footnote 1 |
Detection of hepatitis C virus antibodies (anti-HCV) OR Detection of hepatitis C virus RNA (HCV RNA) |
NOTE:
|
|
Appendix B: Reported rates of Acute and Chronic HBV Infections per 100,000 population in Canada, CNDSS, 2007-2016
| P/T | 2007 | 2008 | 2009 | 2010 | 2011 | 2012 | 2013 | 2014 | 2015 | 2016 |
|---|---|---|---|---|---|---|---|---|---|---|
| BC | 0.91 | 0.71 | 0.59 | 0.25 | 0.29 | 0.29 | 0.24 | 0.39 | 0.17 | 0.11 |
| AB | 0.51 | 0.92 | 0.71 | 0.62 | 0.58 | 0.62 | 0.65 | 0.24 | 0.45 | 0.45 |
| SK | 0.70 | 1.38 | 0.77 | 1.05 | 1.22 | 0.83 | 0.63 | 0.80 | 0.88 | 0.26 |
| MB | UN | UN | 0.33 | 0.16 | 0.49 | 0.16 | 0.40 | 0.31 | 0.23 | 0.99 |
| ON | 1.32 | 1.12 | 1.01 | 0.96 | 0.94 | 0.70 | 0.76 | 0.75 | 0.66 | 0.82 |
| QC | 0.58 | 0.57 | 0.43 | 0.28 | 0.30 | 0.37 | 0.22 | 0.24 | 0.13 | 0.14 |
| NB | NR | NR | 1.07 | 0.53 | 1.06 | 0.40 | 0.13 | 1.19 | 0.27 | 1.32 |
| NS | UN | UN | 0.32 | 0.11 | 0.53 | 0.21 | 0.74 | 0.74 | 0.96 | 1.05 |
| PE | UN | UN | UN | UN | UN | UN | UN | UN | UN | UN |
| NL | UN | UN | UN | UN | UN | UN | UN | UN | UN | UN |
| YT | NR | 0.00 | 0.00 | 2.89 | 0.00 | 0.00 | 0.00 | 0.00 | 2.68 | 0.00 |
| NT | NR | NR | 2.32 | 0.00 | 0.00 | 0.00 | 2.28 | 2.28 | 0.00 | 0.00 |
| NU | UN | UN | UN | UN | UN | UN | UN | UN | UN | UN |
| P/T | 2007 | 2008 | 2009 | 2010 | 2011 | 2012 | 2013 | 2014 | 2015 | 2016 |
|---|---|---|---|---|---|---|---|---|---|---|
| BC | 32.00 | 29.98 | 26.73 | 25.95 | 22.94 | 21.95 | 24.36 | 21.39 | 21.53 | 23.39 |
| AB | 5.86 | 19.83 | 16.63 | 15.38 | 12.90 | 17.08 | 15.28 | 13.39 | 12.73 | 13.55 |
| SK | NR | NR | 7.83 | 8.18 | 6.85 | 12.52 | 9.14 | NR | 9.19 | 11.23 |
| MB | UN | UN | 8.44 | 10.73 | NR | 4.16 | 4.66 | 5.39 | 9.34 | 10.32 |
| ON | NR | NR | NR | NR | 18.76 | 17.85 | 17.34 | 15.40 | 13.28 | 12.10 |
| QC | 8.96 | 9.01 | 8.12 | 6.07 | 4.66 | 5.85 | 6.62 | 6.59 | 5.58 | 5.55 |
| NB | 0.80 | 1.74 | 4.53 | 4.38 | 3.18 | 5.15 | 5.69 | 3.98 | 5.70 | 9.11 |
| NS | UN | UN | 0.53 | 0.64 | 0.42 | 0.85 | 0.53 | 1.80 | 0.96 | 1.48 |
| PE | UN | UN | UN | UN | UN | UN | UN | UN | UN | UN |
| NL | UN | UN | UN | UN | UN | UN | UN | UN | UN | UN |
| YT | NR | 0.00 | 0.00 | 11.56 | 14.12 | 8.32 | 16.53 | 16.30 | 13.41 | 21.01 |
| NT | NR | NR | 0.00 | 0.00 | 0.00 | 0.00 | 0.00 | 0.00 | 0.00 | 0.00 |
| NU | UN | UN | UN | UN | UN | UN | UN | UN | UN | UN |
UN: Only Unspecified Cases Reported | ||||||||||
Appendix C: HCV Infection Reporting in Canada: CNDSS 2007-2016
| 2007 | 2008 | 2009 | 2010 | 2011 | 2012 | 2013 | 2014 | 2015 | 2016 | |
|---|---|---|---|---|---|---|---|---|---|---|
| BC | Reported as unspecified HCV Infection | Reported HCV Infection classified into Acute and Chronic categories | ||||||||
| AB | Reported as unspecified HCV Infection | Reported as Chronic HCV Infection | Reported HCV Infection classified into Acute, Chronic, and Unspecified categories | |||||||
| SK | Reported as unspecified HCV Infection | |||||||||
| MB | Reported as unspecified HCV Infection | |||||||||
| ON | Reported as unspecified HCV Infection | |||||||||
| QC | Reported as unspecified HCV Infection | Reported HCV Infection classified into Acute and Unspecified categories | ||||||||
| NB | Reported as unspecified HCV Infection | |||||||||
| NS | Reported as unspecified HCV Infection | |||||||||
| PE | Reported as unspecified HCV Infection | |||||||||
| NL | Reported as unspecified HCV Infection | |||||||||
| YT | Reported as unspecified HCV Infection | Reported HCV Infection classified into Acute vs Chronic categories | ||||||||
| NT | Reported as unspecified HCV Infection | |||||||||
| NU | Reported as unspecified HCV Infection | |||||||||
Appendix D: Reported rates of HCV infection per 100,000 population in Canada, by sex and age group, CNDSS, 2007-2016
| Year | Overall rate | Age groups | ||||||
|---|---|---|---|---|---|---|---|---|
| 0-14 years | 15-19 years | 20-24 years | 25-29 years | 30-39 years | 40-59 years | 60+ years | ||
| 2007 | 46.4 | 0.9 | 6.7 | 29.1 | 51.6 | 68.8 | 88.2 | 22.2 |
| 2008 | 46.1 | 1.0 | 5.8 | 31.6 | 53.2 | 63.0 | 89.0 | 22.5 |
| 2009 | 42.6 | 1.1 | 5.0 | 27.7 | 50.0 | 61.2 | 81.4 | 20.3 |
| 2010 | 40.0 | 0.7 | 5.8 | 26.7 | 42.0 | 54.8 | 76.6 | 22.8 |
| 2011 | 37.4 | 0.7 | 6.2 | 24.0 | 43.2 | 51.5 | 68.4 | 25.0 |
| 2012 | 36.8 | 0.6 | 6.0 | 31.0 | 41.7 | 51.9 | 64.4 | 26.5 |
| 2013 | 37.4 | 0.6 | 6.5 | 39.2 | 46.3 | 51.0 | 61.4 | 26.2 |
| 2013 | 37.4 | 0.7 | 6.4 | 38.9 | 46.2 | 51.0 | 61.6 | 29.7 |
| 2015 | 38.0 | 0.8 | 6.5 | 40.0 | 57.7 | 54.3 | 57.0 | 32.9 |
| 2016 | 39.1 | 0.9 | 5.6 | 38.2 | 63.7 | 62.7 | 54.5 | 34.5 |
| Year | Overall rate | Age groups | ||||||
|---|---|---|---|---|---|---|---|---|
| 0-14 years | 15-19 years | 20-24 years | 25-29 years | 30-39 years | 40-59 years | 60+ years | ||
| 2007 | 26.2 | 1.2 | 11.7 | 31.5 | 39.8 | 40.4 | 40.7 | 14.1 |
| 2008 | 25.8 | 1.3 | 13.0 | 34.1 | 38.8 | 41.0 | 37.9 | 14.7 |
| 2009 | 23.3 | 1.0 | 12.9 | 30.1 | 36.0 | 34.9 | 35.3 | 13.1 |
| 2010 | 21.6 | 1.1 | 9.1 | 29.3 | 33.3 | 32.1 | 33.1 | 12.0 |
| 2011 | 21.1 | 0.9 | 8.3 | 27.5 | 32.7 | 31.6 | 32.0 | 12.9 |
| 2012 | 21.5 | 0.9 | 10.4 | 33.5 | 37.9 | 32.5 | 29.8 | 12.8 |
| 2013 | 21.2 | 0.7 | 12.1 | 33.2 | 40.8 | 30.5 | 27.9 | 14.0 |
| 2014 | 21.4 | 0.9 | 13.4 | 35.3 | 42.4 | 31.2 | 27.3 | 13.9 |
| 2015 | 22.4 | 1.0 | 13.7 | 40.3 | 43.8 | 35.1 | 26.7 | 14.9 |
| 2016 | 23.0 | 1.0 | 10.4 | 40.6 | 46.7 | 37.3 | 26.9 | 15.8 |
Footnotes
- Footnote a
-
https://www.canada.ca/en/health-canada/corporate/transparency/corporate-management-reporting/heath-portfolio-sex-gender-based-analysis-policy.html