
Quarterly Financial Report - For the quarter ended December 31, 2016
Table of contents
- 1.0 Introduction
- 2.0 Highlights of Fiscal Quarter and Fiscal Year-to-Date Results
- 3.0 Risks and Uncertainty
- 4.0 Significant Changes in Relation to Operations, Personnel and Programs
- 5.0 Statement of Authorities (unaudited)
- 6.0 Departmental Budgetary Expenditures by Standard Object (unaudited)
- 7.0 Glossary
Quarterly Financial Report – For the quarter ended December 31, 2016 (PDF Version, 1.2 MB)
Free PDF download available
1.0 Introduction
This Quarterly Financial Report should be read in conjunction with the 2016-17 Main Estimates, the 2016‑17 Supplementary Estimates (A) and the 2016‑17 Supplementary Estimates (B). This report has been prepared by management as required by Section 65.1 of the Financial Administration Act and in the form and manner prescribed by the Treasury Board Accounting Standard 1.3. It has not been subject to an external audit or review.
1.1 Authority, Mandate and Programs
The Government of Canada created Shared Services Canada (SSC) in 2011 to modernize how the government manages its information technology (IT) infrastructure. SSC has brought together people, IT resources and assets to improve the efficiency, reliability and security of the government’s IT infrastructure, increase productivity across departments and agencies, and support the vision of a 21st century public service, as articulated in Blueprint 2020.
SSC reports to Parliament through the Minister of Public Services and Procurement Canada and Minister responsible for SSC. The Department is mandated to deliver email, data centre, network and workplace technology device services to departments and agencies in a consolidated and standardized manner to support the delivery of Government of Canada programs and services. SSC also provides certain optional technology services to other organizations on a cost-recovery basis.
As part of its mandate, SSC is maintaining and improving IT infrastructure service delivery while renewing the government’s aging IT infrastructure. In doing so, the Department is:
- working in partnership with key public and private sector stakeholders;
- adopting enterprise wide approaches for managing IT infrastructure services; and
- implementing efficient and effective business management processes in support of its mandate.
The main legislative authorities for the Department may be found in the Shared Services Canada Act.
SSC's Program Alignment Architecture (PAA), as approved by the Treasury Board of Canada, supports the achievement of the following strategic outcome: Modern, reliable, secure and cost-effective IT infrastructure services to support government priorities and program delivery. Minor changes were made to the 2016-17 PAA, consisting of updates to sub-sub-programs and revision of titles and descriptions. In addition to supporting the achievement of SSC’s commitments to Parliament and Canadians, the 2016-17 PAA is an evergreen document that will evolve as the Department’s programs mature.
Further details on SSC’s authority, mandate, responsibilities and programs may be found in the 2016-17 Main Estimates and 2016-17 Report on Plans and Priorities.
1.2 Basis of Presentation
This quarterly financial report has been prepared by management using an expenditure basis of accounting (modified cash accounting). The accompanying Statement of Authorities presents the Department's spending authorities granted by Parliament and those used by the Department consistent with the 2016-17 Main Estimates, the 2016-17 Supplementary Estimates (A) and the 2016-17 Supplementary Estimates (B).
The authority of Parliament is required before monies can be spent by the Government. Approvals are given in the form of annually approved limits through appropriation acts or through legislation in the form of statutory spending authority for specific purposes.
As part of the Parliamentary business of supply, the Main Estimates must be tabled in Parliament on or before March 1 preceding the new fiscal year.
The Department uses the full accrual method of accounting to prepare and present its annual departmental financial statements, which are part of the departmental performance reporting process. However, the spending authorities voted by Parliament remain on an expenditure basis.
1.3 Shared Services Canada Financial Structure
SSC has a financial structure composed mainly of voted budgetary authorities, namely Vote 1 - Operating Expenditures, including Vote Netted Revenues, and Vote 5 - Capital Expenditures, while the statutory authorities comprise the contributions to the Employee Benefit Plans (EBP). The contributions to EBP include both the contributions for SSC’s employees and for the Members of Royal Canadian Mounted Police.
At the end of the third quarter of 2016-17, 93 percent of the Department’s budget was devoted to support its IT consolidation and standardization goals while ensuring that current and future IT infrastructure services offered to the Government of Canada are maintained in an environment of operational excellence. The remaining 7 percent was devoted to Internal Services which support IT infrastructure services.
Total Vote Netted Revenue authority for 2016-17 is $407.1 million, which consists of respendable revenue for IT infrastructure services provided by SSC to partner organizations and other organizations on a cost-recovery basis.
2.0 Highlights of Fiscal Quarter and Fiscal Year-to-Date Results
The numbers presented in the report are in accordance with the government-wide Chart of Accounts for Canada for 2016-17 and Treasury Board Accounting Standard 1.3.
The following graph provides a comparison of the net budgetary authorities available for spending, the year-to-date expenditures, and the expenditures for the quarters ended December 31, 2016 and December 31, 2015, for the Department’s combined Vote 1 - Operating Expenditures, Vote 5 - Capital Expenditures and Statutory Authorities.
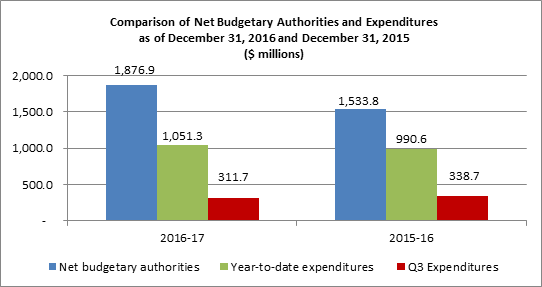
As shown on the graph, at the end of the third quarter, expenditures were incurred at a slower pace than in the previous year. SSC’s year-to-date expenditures represented 65 percent of the net authorities in 2015-16, compared to 56 percent in 2016-17. Given that SSC anticipated an increase of $343.1 million in the volume of activities in 2016-17, mitigation strategies have been implemented to maximize the use of available funds to deliver on SSC key initiatives such as: Mission Critical Information Technology Infrastructure, Cyber Security and Partner priorities.
2.1 Significant Changes to Authorities
For the period ended December 31, 2016, the authorities provided to the Department include the Main Estimates, the Supplementary Estimates (A), the Supplementary Estimates (B) and the Budget Carry Forward from 2015-16. Authorities available for spending in 2016-17 were $1,876.9 million at the end of the third quarter as compared with $1,533.8 million at the end of the third quarter of 2015-16, representing an increase of $343.1 million, or 22.4 percent. This net increase is a combination of an increase of $133.7 million in Vote 1 - Operating Expenditures, an increase of $204.7 million in Vote 5 - Capital Expenditures, an increase in Budgetary Statutory Authorities of $0.7 million and a decrease of $4.0 million in Vote Netted Revenues which increased the total net authorities available.
The 2016-17 Supplementary Estimates (A) included Budget 2016 approved initiatives in the amount of $256.1 million, of which, $232.5 million for Mission Critical Information Technology Infrastructure and $23.6 million to enhance the security of network and cyber systems.
Comparison of Net Budgetary Authorities for the Quarters Ended December 31, 2016 and December 31, 2015
| Net Authorities Available ($ millions) | 2016–17 | 2015–16 | Variance |
|---|---|---|---|
| Vote 1 - Operating Expenditures | 1,748.5 | 1,614.8 | 133.7 |
| Vote 5 - Capital Expenditures | 445.5 | 240.8 | 204.7 |
| Vote Netted Revenues | (407.1) | (411.1) | 4.0 |
| Statutory (EBP) | 90.0 | 89.3 | 0.7 |
| Total Net Authorities | 1,876.9 | 1,533.8 | 343.1 |
Vote 1 - Operating Expenditures (includes Vote Netted Revenues)
The Department’s Vote 1 increased by $133.7 million, compared to the third quarter of 2015-16, due to:
- An increase of $132.8 million related to funding received for various projects and initiatives, such as Mission Critical Information Technology Infrastructure ($99.0 million), Cyber Security ($24.1 million), and Canada Revenue Agency Legislative Measure and Enhanced Compliance Measures ($2.7 million);
- An increase of $1.9 million related to the 2015-16 Operating Budget Carry Forward received in 2016-17 compared to the 2014-15 Operating Budget Carry Forward received in 2015-16; and
- A net decrease of $1.0 million mainly due to a decrease in Vote Netted Revenues, based on the 2016-17 revenue forecast ($4.0 million), offset by a net increase in transfers from partners and funding related to various projects ($3.0 million).
Vote 5 - Capital Expenditures
The Department’s Vote 5 increased by $204.7 million, compared to the third quarter of 2015-16, due to:
- An increase of $176.2 million related to funding received for various projects and initiatives, such as Mission Critical Information Technology Infrastructure ($133.5 million), Cyber Security ($25.3 million), and High Performance Computing ($12.9 million);
- A net increase of $51.5 million in funding for various projects, including $34.1 million related to the reprofiling of funding for the Carling Campus project; and
- A decrease of $23.0 million related to the 2015-16 Capital Budget Carry Forward received in 2016-17 compared to the 2014-15 Capital Budget Carry Forward received in 2015-16.
2.2 Explanations of Significant Variances from Previous Year Expenditures
Compared to the previous year, the total year-to-date expenditures, for the period ended December 31, 2016, have increased by $60.7 million, from $990.6 million to $1,051.3 million as per the table below. This represents an increase of 6.1 percent against expenditures recorded for the same period in 2015-16.
Comparison of Year-to-Date Expenditures for the Quarters Ended December 31, 2016 and December 31, 2015
| Net Year-to-Date Expenditures ($ millions) | 2016–17 | 2015–16 | Variance |
|---|---|---|---|
| Vote 1 - Operating Expenditures | 1,089.2 | 1,049.1 | 40.1 |
| Vote 5 - Capital Expenditures | 142.2 | 66.0 | 76.2 |
| Vote Netted Revenues | (248.1) | (179.8) | (68.3) |
| Statutory (EBP) | 68.0 | 55.3 | 12.7 |
| Total Net Year-to-Date Expenditures | 1,051.3 | 990.6 | 60.7 |
Vote 1 - Increase of $40.1 million
The net increase in operating expenditures, compared to the third quarter of 2015-16, is mainly attributed to:
- Transportation and telecommunications expenditures increased by $74.6 million. This increase is mainly due to timing differences between fiscal years in processing payments related to various contracts;
- Rentals expenditures increased by $12.6 million. This increase is mainly due to a change in operational requirements that resulted in a shift of expenditures from Acquisitions of machinery and equipment to Rentals. This increase is offset by a decrease due to an overpayment made in the third quarter of previous year, which was reversed in the following quarter;
- Repair and maintenance expenditures increased by $11.7 million. This increase is mainly due to a change in operational requirements that resulted in a shift of expenditures from Acquisitions of machinery and equipment to Repair and maintenance. The increase is also attributable to new contracts for repair, maintenance and support services related to computer hardware and software;
- Acquisitions of machinery and equipment decreased by $40.8 million. Most of the decrease is due to a change in operational requirements that resulted in a shift of expenditures from Acquisitions of machinery and equipment to Rentals and to Repair and maintenance. The decrease is also due to the completion, in the previous year, of a contract related to the Government Managed Cabling Service; and
- Personnel expenditures decreased by $15.0 million. This decrease is due to the reduction of the number of SSC’s employees and to timing differences between fiscal years in processing payments related to the salaries of members of Royal Canadian Mounted Police.
Vote 5 – Increase of $76.2 million
The net increase in capital expenditures, compared to the third quarter of 2015-16, is mainly attributed to:
- Acquisitions of machinery and equipment increased by $52.1 million. This increase is mainly explained by a new contract for the provision of hardware, software, maintenance and support services, by a new contract related to High Performance Computing and by new contracts to acquire servers;
- Professional and special services expenditures increased by $11.6 million. This increase is mainly explained by contracts related to the Carling Campus Project, the Email Transformation Initiative, the GCNet WAN Services, and the Borden Enterprise Data Centre Expansion; and
- Rentals expenditures increased by $6.6 million. This increase is mainly attributable to an increase of the payments related to a consolidated contract for mainframe hardware and software. The increase is also due to a new contract related to critical switches.
Vote Netted Revenue - Increase of $68.3 million
The increase in the collected Vote Netted Revenues, compared to the third quarter of 2015-16, is mainly attributed to new services provided to partner departments in 2016-17 and includes:
- $29.9 million for an upgrade of the Unisys mainframe;
- $9.3 million for an uplift of processing capacity for mainframes;
- $5.6 million for additional services offered, such as the Pay Modernization System and the Pension Modernization System; and
- $4.8 million for an upgrade of licencing model, a Business Intelligence initiative and to procure, install and configure SSC services and software.
3.0 Risks and Uncertainty
As SSC moves forward with the operationalization of its transformation agenda, the management of internal and external risks is vital in supporting strategic and business planning, as well as the successful delivery of SSC services to partner organizations and other organizations. SSC continues to improve its enabling functions such as financial management, project management and people management, which are essential to the successful implementation of spending plans and achievement of strategic objectives.
SSC is promoting effective financial management practices and financial sustainability to ensure that it has the financial resources, systems and funding mechanisms in place to maintain mission-critical systems and fund the transformation plan. The Department is also taking steps, such as the development and implementation of a mobility framework to facilitate the realignment of resources to support transformation, to ensure a workforce with the right skills and capacity to sustain current, transitional and future business needs.
Following a comprehensive risk-based determination of activities and projects, the forecasted level of expenditures at the conclusion of the third quarter is within SSC’s reference levels. While expenditures at the end of the third quarter were incurred at a slower pace than in the previous year, SSC anticipates a significant increase in the volume of activities during the remainder of 2016-17. Mitigation strategies have been implemented to deliver those activities and maximize the use of available funds in accordance with departmental plans.
Additional risks that may impact the Department’s spending plans, as well as strategies to mitigate those risks, are described in the 2016-17 Report on Plans and Priorities.
4.0 Significant Changes in Relation to Operations, Personnel and Programs
On October 5, 2016, SSC’s Business Analytics Program was launched to focus on sourcing, storing and providing reliable data to support informed evidence-based decisions. This program will support the Government’s new results and delivery agenda by ensuring the availability of accurate enterprise data and to continually monitor departmental performance.
On October 31, 2016, Julie Hébert has joined SSC as the Director General, Communications and Organizational Effectiveness.
On October 31, 2016, Louis-Paul Normand has joined SSC as the Senior Assistant Deputy Minister of the new established Project Management and Delivery Branch.
On December 28, 2016, Peter Bruce, Senior Assistant Deputy Minister of the Strategy Branch, retired. As of April 1, 2017, Sarah Paquet will join SSC as the new Senior Assistant Deputy Minister, Strategy Branch. In the interim, the position is held by Graham Barr.
Approval by Senior Officials
Approved by:
Original signed by
Ron Parker, President
Ottawa, Canada
February 24, 2017
Original signed by
Alain Duplantie, MBA, CPA, CGA
Senior Assistant Deputy Minister,
Corporate Services and Chief Financial Officer
| Total available for use for the year ending March 31, 2017 * |
Used during the quarter ended December 31, 2016 |
Year-to-date used at quarter-end |
|
|---|---|---|---|
| Vote 1 - Operating expenditures | |||
| Gross Operating expenditures | 1,748,516 | 389,988 | 1,089,156 |
| Vote Netted Revenues | (407,094) | (145,720) | (248,067) |
| Net Operating expenditures | 1,341,422 | 244,268 | 841,089 |
| Vote 5 - Capital expenditures | 445,493 | 45,199 | 142,236 |
| (S) Contributions to employee benefit plans | 90,014 | 22,251 | 68,018 |
| Total Budgetary authorities | 1,876,929 | 311,718 | 1,051,343 |
Fiscal year 2015–16
(in thousands of dollars)
*Includes authorities available for use and granted by Parliament at quarter-end.
| Total available for use for the year ending March 31, 2016 * |
Used during the quarter ended December 31, 2015 |
Year-to-date used at quarter-end |
|
|---|---|---|---|
| Vote 1 - Operating expenditures | |||
| Gross Operating expenditures | 1,614,752 | 347,025 | 1,049,116 |
| Vote Netted Revenues | (411,075) | (60,673) | (179,845) |
| Net Operating expenditures | 1,203,677 | 286,352 | 869,271 |
| Vote 5 - Capital expenditures | 240,780 | 34,619 | 66,040 |
| (S) Contributions to employee benefit plans | 89,324 | 17,728 | 55,331 |
| Total Budgetary authorities | 1,533,781 | 338,699 | 990,642 |
6.0 Departmental Budgetary Expenditures by Standard Object (unaudited)
Fiscal year 2016–17
(in thousands of dollars)
| Planned expenditures for the year ending March 31, 2017* |
Expended during the quarter ended December 31, 2016 |
Year-to-date used at quarter-end |
|
|---|---|---|---|
| Expenditures: | |||
| Personnel (includes EBP) | 612,824 | 132,652 | 410,505 |
| Transportation and telecommunications | 478,978 | 134,355 | 324,502 |
| Information | 667 | 353 | 736 |
| Professional and special services | 235,084 | 54,845 | 123,245 |
| Rentals | 297,768 | 57,167 | 246,977 |
| Repair and maintenance | 144,387 | 21,250 | 63,898 |
| Utilities, materials and supplies | 5,713 | 1,276 | 3,565 |
| Acquisition of land, buildings and works | 1 | - | - |
| Acquisition of machinery and equipment | 502,904 | 59,374 | 123,558 |
| Transfer payments | - | - | - |
| Public debt charges | - | - | - |
| Other subsidies and payments | 5,697 | (3,834) | 2,424 |
| Total gross budgetary expenditures | 2,284,023 | 457,438 | 1,299,410 |
| Less Revenues netted against expenditures: | |||
| Vote Netted Revenues | 407,094 | 145,720 | 248,067 |
| Total Revenues netted against expenditures | 407,094 | 145,720 | 248,067 |
| Total net budgetary expenditures | 1,876,929 | 311,718 | 1,051,343 |
Fiscal year 2015–16
(in thousands of dollars)
| Planned expenditures for the year ending March 31, 2016 * |
Expended during
the quarter ended December 31, 2015 |
Year-to-date used at quarter-end |
|
|---|---|---|---|
| Expenditures: | |||
| Personnel (includes EBP) | 603,554 | 130,878 | 408,964 |
| Transportation and telecommunications | 479,290 | 92,156 | 247,054 |
| Information | 1,364 | 257 | 462 |
| Professional and special services | 208,146 | 56,186 | 113,459 |
| Rentals | 244,875 | 57,733 | 227,825 |
| Repair and maintenance | 82,742 | 19,402 | 52,530 |
| Utilities, materials and supplies | 8,018 | 1,254 | 2,798 |
| Acquisition of land, buildings and works | - | - | - |
| Acquisition of machinery and equipment | 314,088 | 43,597 | 112,280 |
| Transfer payments | - | - | - |
| Public debt charges | - | - | - |
| Other subsidies and payments | 2,779 | (2,091) | 5,115 |
| Total gross budgetary expenditures | 1,944,856 | 399,372 | 1,170,487 |
| Less Revenues netted against expenditures: | |||
| Vote Netted Revenues | 411,075 | 60,673 | 179,845 |
| Total Revenues netted against expenditures | 411,075 | 60,673 | 179,845 |
| Total net budgetary expenditures | 1,533,781 | 338,699 | 990,642 |
* Includes authorities available for use and granted by Parliament at quarter-end, which are distributed based on historical financial data.
7.0 Glossary
- Appropriations / Authorities
- Expenditure authorities are approvals from Parliament for individual government organizations to spend up to specific amounts. Expenditure authority is provided in two ways: annual appropriation acts that specify the amounts and broad purposes for which funds can be spent; and other specific statutes that authorize payments and set out the amounts and time periods for those payments. The amounts approved in appropriation acts are referred to as voted amounts, and the expenditure authorities provided through other statutes are called statutory authorities.
- Vote 1 - Operating Expenditures
A vote that covers most day-to-day expenses, such as salaries, utilities and minor capital expenditures. - Vote 5 - Capital Expenditures
Capital expenditures are those made for the acquisition or development of items that are classified as tangible capital assets as defined by Government accounting policies. This vote is generally used for capital expenditures that exceed $10,000.
- Expenditure authorities are approvals from Parliament for individual government organizations to spend up to specific amounts. Expenditure authority is provided in two ways: annual appropriation acts that specify the amounts and broad purposes for which funds can be spent; and other specific statutes that authorize payments and set out the amounts and time periods for those payments. The amounts approved in appropriation acts are referred to as voted amounts, and the expenditure authorities provided through other statutes are called statutory authorities.
- Capital Budget Carry Forward
- Treasury Board centrally managed vote that permits departments to bring forward eligible lapsing funds from one fiscal year to the next in an amount up to twenty percent of their year-end allotments in the Capital Expenditures Vote as reflected in Public Accounts.
- Treasury Board centrally managed vote that permits departments to bring forward eligible lapsing funds from one fiscal year to the next in an amount up to twenty percent of their year-end allotments in the Capital Expenditures Vote as reflected in Public Accounts.
- Cash method of accounting
- The cash method recognizes revenues when they are received and expenses when they are paid for.
- The cash method recognizes revenues when they are received and expenses when they are paid for.
- Collective agreement
- Collective agreement means an agreement in writing entered into under the Public Service Staff Relations Act between the employer and a bargaining agent and containing provisions covering terms and conditions of employment and related matters.
- Collective agreement means an agreement in writing entered into under the Public Service Staff Relations Act between the employer and a bargaining agent and containing provisions covering terms and conditions of employment and related matters.
- Employee Benefit Plan (EBP)
- A statutory item that includes employer contributions for the Public Service Superannuation Plan, the Canada and the Quebec Pension Plans, Death Benefits, and the Employment Insurance accounts. Expressed as a percentage of salary, the EBP rate is changed every year as directed by the Treasury Board Secretariat.
- A statutory item that includes employer contributions for the Public Service Superannuation Plan, the Canada and the Quebec Pension Plans, Death Benefits, and the Employment Insurance accounts. Expressed as a percentage of salary, the EBP rate is changed every year as directed by the Treasury Board Secretariat.
- Expenditure basis of accounting (modified cash accounting)
- An accounting method that combines elements of the two major accounting methods, the cash method and the accrual method. The modified cash accounting method recognizes revenues when cash is received and expenses when liabilities are incurred or cash is paid out.
- An accounting method that combines elements of the two major accounting methods, the cash method and the accrual method. The modified cash accounting method recognizes revenues when cash is received and expenses when liabilities are incurred or cash is paid out.
- Frozen allotments
- Frozen allotments are used to prohibit the spending of funds previously appropriated by Parliament. There are two types of frozen allotments:
- Permanent: where the Treasury Board has directed that funds lapse at the end of the fiscal year; and
- Temporary: where an appropriation is frozen until such time as conditions have been met.
- Frozen allotments are used to prohibit the spending of funds previously appropriated by Parliament. There are two types of frozen allotments:
- Full accrual method of accounting
- An accounting method that measures the performance and position of an organization by recognizing economic events regardless of when cash transactions occur. Therefore, the full accrual method of accounting recognizes revenues when they are earned (for example, when the terms of a contract are fulfilled) and expenses when they are incurred.
- An accounting method that measures the performance and position of an organization by recognizing economic events regardless of when cash transactions occur. Therefore, the full accrual method of accounting recognizes revenues when they are earned (for example, when the terms of a contract are fulfilled) and expenses when they are incurred.
- Government-wide Chart of Accounts
- The Government-wide Chart of Accounts (COA) provides the framework for identifying, collecting and reporting financial transactions to satisfy the government’s corporate information requirements. The COA contains accounts and codes for all the fields that comprise the government-wide coding block.
- The Government-wide Chart of Accounts (COA) provides the framework for identifying, collecting and reporting financial transactions to satisfy the government’s corporate information requirements. The COA contains accounts and codes for all the fields that comprise the government-wide coding block.
- Main Estimates
- Each year, the government prepares estimates in support of its request to Parliament for authority to spend public funds. This request is formalized through the introduction of appropriation bills in Parliament. In support of the Appropriation Act, the Main Estimates identify the spending authorities (Votes) and amounts to be included in subsequent appropriation bills. Parliament is asked to approve these Votes to enable the government to proceed with its spending plans.
- Operating Budget Carry Forward
- Treasury Board centrally managed vote that permits departments to bring forward eligible lapsing funds from one fiscal year to the next in an amount up to five percent of their Main Estimates gross Operating Budget allotment.
- Treasury Board centrally managed vote that permits departments to bring forward eligible lapsing funds from one fiscal year to the next in an amount up to five percent of their Main Estimates gross Operating Budget allotment.
- Program Alignment Architecture (PAA)
- A structured inventory of a department’s programs, where programs are arranged in a hierarchical manner to depict the logical relationship between each program and the strategic outcomes to which they contribute.
- A structured inventory of a department’s programs, where programs are arranged in a hierarchical manner to depict the logical relationship between each program and the strategic outcomes to which they contribute.
- Reports on Plans and Priorities (RPP)
- Reports on Plans and Priorities are expenditure plans for each department and agency (excluding Crown corporations). They describe departmental priorities, expected results and associated resource requirements covering a three-year period, beginning with the year indicated in the title of the report.
- Reports on Plans and Priorities are expenditure plans for each department and agency (excluding Crown corporations). They describe departmental priorities, expected results and associated resource requirements covering a three-year period, beginning with the year indicated in the title of the report.
- Standard objects
- A system in accounting that classifies and summarizes the expenditures by categories, such as type of goods or services acquired, for monitoring and reporting.
- A system in accounting that classifies and summarizes the expenditures by categories, such as type of goods or services acquired, for monitoring and reporting.
- Strategic Outcome
- A long-term and enduring benefit to Canadians that is linked to the department's mandate, vision, and core functions.
- Supplementary Estimates
- The President of the Treasury Board tables three Supplementary Estimates usually in late spring, late fall and early spring to obtain the authority of Parliament to adjust the government's expenditure plan set out in the estimates for that fiscal year. Supplementary Estimates serve two purposes. First, they seek authority for revised spending levels that Parliament will be asked to approve in an Appropriation Act. Second, they provide Parliament with information on changes in the estimated expenditures to be made under the authority of statutes previously passed by Parliament. Each Supplementary Estimates document is identified alphabetically (A, B and C).
- The President of the Treasury Board tables three Supplementary Estimates usually in late spring, late fall and early spring to obtain the authority of Parliament to adjust the government's expenditure plan set out in the estimates for that fiscal year. Supplementary Estimates serve two purposes. First, they seek authority for revised spending levels that Parliament will be asked to approve in an Appropriation Act. Second, they provide Parliament with information on changes in the estimated expenditures to be made under the authority of statutes previously passed by Parliament. Each Supplementary Estimates document is identified alphabetically (A, B and C).
- Vote Netted Revenues Authority
- The authority by which Shared Services Canada has permission to collect and spend revenue earned and collected from the provision of IT services within the government.
Free PDF download
To access the Portable Document Format (PDF) version you must have a PDF reader installed. If you do not already have such a reader, there are numerous PDF readers available for free download or for purchase on the Internet: