
Quarterly Financial Report – For the quarter ended December 31, 2017
Table of contents
- 1.0 Introduction
- 2.0 Highlights of Fiscal Quarter and Fiscal Year-to-Date Results
- 3.0 Risks and Uncertainty
- 4.0 Significant Changes in Relation to Operations, Personnel and Programs
- 5.0 Statement of Authorities (unaudited)
- 6.0 Departmental Budgetary Expenditures by Standard Object (unaudited)
- 7.0 Glossary
1.0 Introduction
This quarterly financial report should be read in conjunction with the 2017-18 Main Estimates and the 2017-18 Supplementary Estimates (B). Shared Services Canada (SSC) had no items in the 2017-18 Supplementary Estimates (A) process. This report has been prepared by management as required by Section 65.1 of the Financial Administration Act and in the form and manner prescribed by the Treasury Board. It has not been subject to an external audit or review.
1.1 Authority, Mandate and Programs
SSC was created on August 4, 2011 to transform how the Government of Canada manages its information technology (IT) infrastructure. SSC is delivering email, data centre, network and workplace technology device services to departments and agencies in a consolidated and standardized manner to support the delivery of Government of Canada programs and services. With a whole-of-government approach to IT infrastructure services, SSC is creating economies of scale to deliver more efficient, reliable and secure IT infrastructure services. SSC also provides certain optional technology services to other organizations on a cost-recovery basis.
SSC reports to Parliament through the Minister of Public Services and Procurement Canada and Minister responsible for SSC. By bringing together people, IT resources, and assets from 43 federal departments and agencies, SSC works to manage and improve the efficiency, reliability, and security of the government’s IT infrastructure. A more efficient use of technology will increase productivity across departments and support the vision of a 21st-century Public Service, as articulated in Blueprint 2020.
In carrying out its mandate, SSC is working in partnership with key public-sector and private-sector stakeholders; implementing enterprise-wide approaches for managing IT infrastructure services; and employing effective and efficient business management processes.
A full explanation of SSC’s main legislative authorities and responsibilities may be found in the Shared Services Canada Act.
SSC’s Program Alignment Architecture (PAA), as approved by the Treasury Board of Canada, supports the achievement of the following strategic outcome: Modern, reliable, secure, timely and cost-effective IT infrastructure services to support government priorities and program delivery. Significant changes were made to the 2017-18 PAA to move the sub-programs to the program level and add two new programs. Changes were also made to the titles and descriptions of the PAA items in order to make them more plain language and understandable. In 2018-19, SSC’s PAA will evolve into the Departmental Results Framework (DRF) as per the Treasury Board Policy on Results. The DRF will be a plain language document which will describe, at a high level, the domains in which SSC acts, the changes it seeks to contribute to, and how it will measure and report on its progress.
Further details on SSC’s authority, mandate, responsibilities and programs may be found in SSC’s 2017-18 Main Estimates and in the 2017-18 Departmental Plan.
1.2 Basis of Presentation
This quarterly financial report has been prepared by management using an expenditure basis of accounting. The accompanying Statement of Authorities includes the Department's spending authorities granted by Parliament, and those used by the Department consistent with the 2017-18 Main Estimates and the 2017-18 Supplementary Estimates (B). This quarterly report has been prepared using a special purpose financial reporting framework designed to meet financial information needs with respect to the use of spending authorities.
The authority of Parliament is required before money can be spent by the Government. Approvals are given in the form of annually approved limits through appropriation acts or through legislation in the form of statutory spending authority for specific purposes.
When Parliament is dissolved for the purposes of a general election, section 30 of the Financial Administration Act authorizes the Governor General, under certain conditions, to issue a special warrant authorizing the Government to withdraw funds from the Consolidated Revenue Fund. A special warrant is deemed to be an appropriation for the fiscal year in which it is issued.
The Department uses the full accrual method of accounting to prepare and present its annual departmental financial statements that are part of the departmental results reporting process. However, the spending authorities voted by Parliament remain on an expenditure basis. The main difference between the Quarterly Financial Report and the Departmental Financial Statements is the timing of when revenues and expenses are recognized. The Quarterly Financial Report presents revenues only when the money is received and expenses only when the money is paid out. The Departmental Financial Statements report revenues when they are earned and expenses when they are incurred. In the latter case, revenues are recorded even if cash has not been received and expenses are incurred even if cash has not yet been paid out.
1.3 Shared Services Canada Financial Structure
SSC has a financial structure composed mainly of voted budgetary authorities, namely Vote 1 - Operating Expenditures and Vote 5 - Capital Expenditures, including Vote Netted Revenues, while the statutory authorities comprise the contributions to the Employee Benefit Plans (EBP). The contributions to EBP consist of the contributions for SSC’s employees including the members of Royal Canadian Mounted Police.
At the end of the third quarter of 2017-18, 93 percent of the Department’s budget was devoted to support its IT consolidation and standardization goals while ensuring that current and future IT infrastructure services offered to the Government of Canada are maintained in an environment of operational excellence. The remaining 7 percent was devoted to Internal Services which support services provided by SSC.
Total Vote Netted Revenue authority for 2017-18 is $442.1 million, which consists of respendable revenue for IT infrastructure services provided by SSC to partner organizations and other organizations on a cost-recovery basis.
2.0 Highlights of Fiscal Quarter and Fiscal Year-to-Date Results
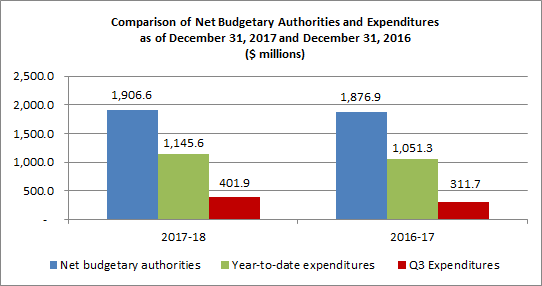
The following graph provides a comparison of the net budgetary authorities available for spending, the year-to-date expenditures, and the expenditures for the quarters ended December 31, 2017 and December 31, 2016, for the Department’s combined Vote 1 - Operating Expenditures, Vote 5 - Capital Expenditures and Statutory Authorities.
2.1 Significant Changes to Authorities
For the period ended December 31, 2017, the authorities provided to the Department include the Main Estimates, the Supplementary Estimates (B) and the funding from Treasury Board Central Votes, such as the Budget Carry Forward from 2016-17 and the collective bargaining funding. Authorities available for spending in 2017‑18 were $1,906.6 million at the end of the third quarter, compared to $1,876.9 million at the end of the third quarter of 2016-17, representing an increase of $29.7 million, or 1.6 percent. This total increase is a combination of an increase of $34.9 million in Vote 1 - Operating Expenditures, an increase of $38.1 million in Vote 5 - Capital Expenditures, a decrease in Budgetary Statutory Authorities of $8.3 million and an increase of $35.0 million in Vote Netted Revenues which decreased the total net authorities available.
SSC received additional authorities approved in Budget 2016 for the following initiatives: Refresh of the Mission Critical Infrastructure Technology and Secure Canada’s Government IT Infrastructure and Information. The bulk of these authorities was received in 2016-17 and the remainder in 2017-18.
Comparison of Net Budgetary Authorities for the Quarters Ended December 31, 2017 and December 31, 2016
| Net Authorities Available ($ millions) | 2017-18 | 2016-17 | Variance |
|---|---|---|---|
| Vote 1 - Operating Expenditures | 1,783.4 | 1,748.5 | 34.9 |
| Vote 5 - Capital Expenditures | 483.6 | 445.5 | 38.1 |
| Vote Netted Revenues | (442.1) | (407.1) | (35.0) |
| Statutory (EBP) | 81.7 | 90.0 | (8.3) |
| Total Net Authorities | 1,906.6 | 1,876.9 | 29.7 |
Vote 1 - Operating Expenditures (includes Vote Netted Revenues)
The Department’s Vote 1 increased by $34.9 million, compared to the third quarter of 2016-17, mainly due to:
- An increase of $43.6 million related to the 2016-17 Operating Budget Carry Forward received in 2017-18 compared to the 2015-16 Operating Budget Carry Forward received in 2016-17
- A net decrease of $24.3 million related to funding received for various projects and initiatives, such as:
- Refresh of the Mission Critical Infrastructure Technology (decrease of $51.1 million)
- Cyber Security (decrease of $15.1 million)
- High Performance Computing (increase of $18.0 million)
- Signed collective agreements (increase of $17.7 million)
- Expanding Biometrics screening in Canada’s Immigration System (increase of $9.0 million)
- An increase of $13.5 million related to the reprofiling of funding for High Performance Computing ($8.7 million), Secure Canada’s Government IT Infrastructure and Information ($3.8 million), Refresh of the Mission Critical Infrastructure Technology ($0.7 million) and the Workspace Renewal Project ($0.3 million)
- A net increase of $2.1 million in transfers from partners related to funding for various projects
Vote 5 - Capital Expenditures (includes Vote Netted Revenues)
The Department’s Vote 5 increased by $38.1 million, compared to the third quarter of 2016-17, mainly due to:
- A decrease of $69.6 million related to funding received for various projects and initiatives, such as Refresh of the Mission Critical Infrastructure Technology ($30.1 million) and Carling Campus project ($29.4 million)
- An increase of $46.0 million related to the 2016-17 Capital Budget Carry Forward received in 2017-18 compared to the 2015-16 Capital Budget Carry Forward received in 2016-17
- An increase of $35.0 million related to the new Vote Netted Revenue authority for capital expenditures
- An increase of $19.9 million related to the reprofiling of funding for Secure Canada’s Government IT Infrastructure and Information ($12.3 million) and Carling Campus project ($7.6 million)
- A net increase of $6.8 million in transfers from partners related to funding for various projects
Statutory (EBP)
The Department’s Employee Benefits Plan (EBP) authority decreased by $8.3 million, mainly due to the Vote Netted Revenue and to the rate decrease from 17.2 percent in 2016-17 to 15.7 percent in 2017-18 in the Annual Reference Level Update exercise.
2.2 Explanations of Significant Variances from Previous Year Expenditures
Compared to the previous year, the total year-to-date expenditures, for the period ended December 31, 2017, have increased by $94.3 million, from $1,051.3 million to $1,145.6 million as per the table below. This represents an increase of 9.0 percent against expenditures recorded for the same period in 2016-17.
Comparison of Year-to-Date Expenditures for the Quarters Ended December 31, 2017 and December 31, 2016
| Net Year-to-Date Expenditures ($ millions) | 2017-18 | 2016-17 | Variance |
|---|---|---|---|
| Vote 1 - Operating Expenditures | 1,177.1 | 1,089.2 | 87.9 |
| Vote 5 - Capital Expenditures | 151.8 | 142.2 | 9.6 |
| Vote Netted Revenues | (245.4) | (248.1) | 2.7 |
| Statutory (EBP) | 62.1 | 68.0 | (5.9) |
| Total Net Year-to-Date Expenditures | 1,145.6 | 1,051.3 | 94.3 |
Vote 1 - Increase of $87.9 million
The net increase in operating expenditures, compared to the third quarter of 2016-17, is mainly attributed to:
- Personnel expenditures increased by $50.6 million. This increase is mainly due to the increase of the number of SSC’s employees in 2017-18 and to the payments of retroactive pay for current and previous fiscal years as a result of the signature of new collective agreements
- Repair and maintenance expenditures increased by $32.1 million. This increase is mostly attributable to two new contracts for maintenance and support services related to computer hardware and software. The increase is also attributable to expenditures related to Refresh of the Mission Critical Infrastructure Technology which did not commence until the second quarter of 2016-17 and to a change in operational requirements that resulted in a shift of expenditures from Transportation and communications in Vote 5 to Repair and maintenance in Vote 1
- Professional and special services expenditures increased by $23.3 million. This increase is mainly due to expenditures for information technology and telecommunication consultants, including expenditures related to Refresh of the Mission Critical Infrastructure Technology. This increase is also due to expenditures related to management consulting
- Acquisitions of machinery and equipment increased by $23.0 million. This increase is mainly due to the renewal of a multi-year contract for the High Performance Computing for which the first payment of the solution hosting facility portion was made in the second quarter of 2017-18
- Transportation and communications expenditures increased by $6.1 million. This increase is mainly due to timing difference in payments made for cabling services, telephony services, and IT and telecoms services in missions abroad. The increase is also due to the increase of the monthly costs of telecommunication services related to the Borden Data Centre and the Government of Canada Wide Area Network as well as the increase of the costs of cabling services
- Rentals expenditures decreased by $51.8 million. This decrease is mainly due to timing difference in payments made to IBM Canada for maintenance and support of IBM Enterprise License Agreement distributed suite of products and for the consolidated contract for mainframe hardware, software maintenance and support services. The decrease is also due to the end of the contract with IBM Canada for maintenance and support of IBM Enterprise License Agreement distributed suite of products
Vote 5 - Increase of $9.6 million
The net increase in capital expenditures, compared to the third quarter of 2016-17, is mainly attributed to:- Professional and special services expenditures increased by $11.9 million. This increase is mainly due to a new contract related to the Enterprise Data Centre Borden Expansion Project
- Rentals expenditures increased by $6.5 million. This increase is mainly due to timing differences between fiscal years in reallocating the payments related to capital lease obligations. The increase is also attributable to expenditures related to Secure Canada’s Government IT Infrastructure and Information
- Transportation and communications expenditures decreased by $11.6 million, mainly due to a change in operational requirements that resulted in a shift of expenditures from Transportation and communications in Vote 5 to Repair and maintenance in Vote 1
Statutory (EBP) - Decrease of $5.9 million
The EBP expenditures are based on the EBP authorities approved in the Main Estimates. Because the authorities decreased from 2016-17 to 2017-18, the expenditures similarly decreased compared to the third quarter of 2016-17.
3.0 Risks and Uncertainty
As SSC moves forward with the operationalization of its modernization agenda, the management of internal and external risks is vital in supporting strategic and business planning, as well as the successful delivery of SSC services to partner organizations and other organizations. SSC continues to improve its enabling functions such as financial management, project management and people management, which are essential to the successful implementation of spending plans and achievement of strategic objectives.
SSC is promoting effective financial management practices and financial sustainability to ensure that it has the financial resources, systems and funding mechanisms in place to maintain mission-critical systems and fund the modernization initiatives. The Department is also taking steps, such as developing recruitment and retention strategies that focus on learning, re-training, re-skilling, alternate and flexible work arrangements, and proactive classification and staffing resourcing strategies, to ensure a workforce with the right skills and capacity to sustain current, transitional and future business needs.
Additional risks that may impact the Department’s spending plans, as well as strategies to mitigate those risks, are described in the 2017-18 Departmental Plan.
4.0 Significant Changes in Relation to Operations, Personnel and Programs
Since October 10, 2017, Pankaj Sehgal and Raj Thuppal exchanged their roles. Pankaj Sehgal became Assistant Deputy Minister of Cyber and IT Security and Raj Thuppal became Assistant Deputy Minister of Network and End Users.
Effective December 1, 2017, John A. Glowacki Jr., Chief Operating Officer, left the department. A process is underway to identify a successor.
At the end of December 2017, Dave Adamson, Assistant Deputy Minister of Special Projects and Cloud Brokering, took his retirement. At the same time, the Cloud Brokering function has been transferred to the Data Center Services Branch, under the leadership of Ken Canam, the Assistant Deputy Minister.
Approval by Senior Officials
Original signed by
Ron Parker, President
Ottawa, Canada
February 27, 2018
Original signed by
Alain Duplantie, MBA, CPA, CGA
Senior Assistant Deputy Minister,
Corporate Services and Chief Financial Officer
| Total available for use for the year ending March 31, 2018 Footnote * |
Used during the quarter ended December 31, 2017 |
Year-to-date used at quarter-end |
|
|---|---|---|---|
| Vote 1 - Operating expenditures | |||
| Gross Operating expenditures | 1,783,398 | 381,969 | 1,177,078 |
| Vote Netted Revenues | (407,094) | (85,088) | (245,415) |
| Net Operating expenditures | 1,376,304 | 296,881 | 931,663 |
| Vote 5 - Capital expenditures | |||
| Gross Capital expenditures | 483,645 | 83,833 | 151,864 |
| Vote Netted Revenues | (35,000) | - | - |
| Net Capital expenditures | 448,645 | 83,833 | 151,864 |
| (S) Contributions to employee benefit plans | 81,688 | 21,229 | 62,073 |
| Total Budgetary authorities | 1,906,637 | 401,943 | 1,145,600 |
Fiscal year 2016–17
(in thousands of dollars)
| Total available for use for the year ending March 31, 2017 Footnote * |
Used during the quarter ended December 31, 2016 |
Year-to-date used at quarter-end |
|
|---|---|---|---|
| Vote 1 - Operating expenditures | |||
| Gross Operating expenditures | 1,748,516 | 389,988 | 1,089,156 |
| Vote Netted Revenues | (407,094) | (145,720) | (248,067) |
| Net Operating expenditures | 1,341,422 | 244,268 | 841,089 |
| Vote 5 - Capital expenditures | |||
| Gross Capital expenditures | 445,493 | 45,199 | 142,236 |
| Vote Netted Revenues | - | - | - |
| Net Capital expenditures | 445,493 | 45,199 | 142,236 |
| (S) Contributions to employee benefit plans | 90,014 | 22,251 | 68,018 |
| Total Budgetary authorities | 1,876,929 | 311,718 | 1,051,343 |
6.0 Departmental Budgetary Expenditures by Standard Object (unaudited)
Fiscal year 2017–18
(in thousands of dollars)
| Planned expenditures for the year ending March 31, 2018Footnote ** |
Expended during the quarter ended December 31, 2017 |
Year-to-date used at quarter-end |
|
|---|---|---|---|
| Expenditures: | |||
| Personnel (includes EBP) | 621,065 | 156,056 | 456,807 |
| Transportation and communications | 529,839 | 122,654 | 319,035 |
| Information | 767 | 345 | 621 |
| Professional and special services | 246,002 | 73,879 | 158,409 |
| Rentals | 329,849 | 38,489 | 201,681 |
| Repair and maintenance | 109,834 | 28,818 | 97,108 |
| Utilities, materials and supplies | 7,900 | 1,459 | 3,994 |
| Acquisition of land, buildings and works | 3,150 | - | - |
| Acquisition of machinery and equipment | 497,292 | 66,775 | 146,651 |
| Transfer payments | - | - | - |
| Public debt charges | - | - | - |
| Other subsidies and payments | 3,033 | (1,444) | 6,709 |
| Total gross budgetary expenditures | 2,348,731 | 487,031 | 1,391,015 |
| Less Revenues netted against expenditures: | |||
| Vote Netted Revenues | 442,094 | 85,088 | 245,415 |
| Total Revenues netted against expenditures | 442,094 | 85,088 | 245,415 |
| Total net budgetary expenditures | 1,906,637 | 401,943 | 1,145,600 |
Fiscal year 2016–17
(in thousands of dollars)
| Planned expenditures for the year ending March 31, 2017Footnote ** |
Expended during the quarter ended December 31, 2016 |
Year-to-date used at quarter-end |
|
|---|---|---|---|
| Expenditures: | |||
| Personnel (includes EBP) | 612,824 | 132,652 | 410,505 |
| Transportation and communications | 478,978 | 134,355 | 324,502 |
| Information | 667 | 353 | 736 |
| Professional and special services | 235,084 | 54,845 | 123,245 |
| Rentals | 297,768 | 57,167 | 246,977 |
| Repair and maintenance | 144,387 | 21,250 | 63,898 |
| Utilities, materials and supplies | 5,713 | 1,276 | 3,565 |
| Acquisition of land, buildings and works | 1 | - | - |
| Acquisition of machinery and equipment | 502,904 | 59,374 | 123,558 |
| Transfer payments | - | - | - |
| Public debt charges | - | - | - |
| Other subsidies and payments | 5,697 | (3,834) | 2,424 |
| Total gross budgetary expenditures | 2,284,023 | 457,438 | 1,299,410 |
| Less Revenues netted against expenditures: | |||
| Vote Netted Revenues | 407,094 | 145,720 | 248,067 |
| Total Revenues netted against expenditures | 407,094 | 145,720 | 248,067 |
| Total net budgetary expenditures | 1,876,929 | 311,718 | 1,051,343 |
7.0 Glossary
Appropriations / Authorities
Expenditure authorities are approvals from Parliament for individual government organizations to spend up to specific amounts. Expenditure authority is provided in two ways: annual appropriation acts that specify the amounts and broad purposes for which funds can be spent; and other specific statutes that authorize payments and set out the amounts and time periods for those payments. The amounts approved in appropriation acts are referred to as voted amounts, and the expenditure authorities provided through other statutes are called statutory authorities.
- Vote 1 - Operating Expenditures
A vote that covers most day-to-day expenses, such as salaries, utilities and minor capital expenditures. - Vote 5 - Capital Expenditures
Capital expenditures are those made for the acquisition or development of items that are classified as tangible capital assets as defined by Government accounting policies. This vote is generally used for capital expenditures that exceed $10,000.
Capital Budget Carry Forward
Treasury Board centrally managed vote that permits departments to bring forward eligible lapsing funds from one fiscal year to the next in an amount up to twenty percent of their year-end allotments in the Capital Expenditures Vote as reflected in Public Accounts.
Cash method of accounting
The cash method recognizes revenues when they are received and expenses when they are paid for.
Collective agreement
Collective agreement means an agreement in writing entered into under the Public Service Staff Relations Act between the employer and a bargaining agent and containing provisions covering terms and conditions of employment and related matters.
Departmental Plan
The Departmental Plan (formerly known as the Report on Plans and Priorities) is an expenditure plan for each department and agency (excluding Crown corporations). It describes departmental priorities, expected results and associated resource requirements covering a three-year period, beginning with the year indicated in the title of the report.
Employee Benefit Plan (EBP)
A statutory item that includes employer contributions for the Public Service Superannuation Plan, the Canada and the Quebec Pension Plans, Death Benefits, and the Employment Insurance accounts. Expressed as a percentage of salary, the EBP rate is changed every year as directed by the Treasury Board Secretariat.
Expenditure basis of accounting
An accounting method that combines elements of the two major accounting methods, the cash method and the accrual method. The expenditure basis of accounting method recognizes revenues when cash is received and expenses when liabilities are incurred or cash is paid out.
Frozen allotments
Frozen allotments are used to prohibit the spending of funds previously appropriated by Parliament. There are two types of frozen allotments:
- Permanent: where the Treasury Board has directed that funds lapse at the end of the fiscal year
- Temporary: where an appropriation is frozen until such time as conditions have been met
Full accrual method of accounting
An accounting method that measures the performance and position of an organization by recognizing economic events regardless of when cash transactions occur. Therefore, the full accrual method of accounting recognizes revenues when they are earned (for example, when the terms of a contract are fulfilled) and expenses when they are incurred.
Government-wide Chart of Accounts
The Government-wide Chart of Accounts (COA) provides the framework for identifying, collecting and reporting financial transactions to satisfy the government’s corporate information requirements. The COA contains accounts and codes for all the fields that comprise the government-wide coding block.
Main Estimates
Each year, the government prepares estimates in support of its request to Parliament for authority to spend public funds. This request is formalized through the introduction of appropriation bills in Parliament. In support of the Appropriation Act, the Main Estimates identify the spending authorities (Votes) and amounts to be included in subsequent appropriation bills. Parliament is asked to approve these Votes to enable the government to proceed with its spending plans.
Operating Budget Carry Forward
Treasury Board centrally managed vote that permits departments to bring forward eligible lapsing funds from one fiscal year to the next in an amount up to five percent of their Main Estimates gross Operating Budget allotment.
Program Alignment Architecture (PAA)
A structured inventory of a department’s programs, where programs are arranged in a hierarchical manner to depict the logical relationship between each program and the strategic outcomes to which they contribute.
Standard objects
A system in accounting that classifies and summarizes the expenditures by categories, such as type of goods or services acquired, for monitoring and reporting.
Strategic Outcome
A long-term and enduring benefit to Canadians that is linked to the department's mandate, vision, and core functions.
Supplementary Estimates
The President of the Treasury Board tables three Supplementary Estimates usually in late spring, late fall and early spring to obtain the authority of Parliament to adjust the government's expenditure plan set out in the estimates for that fiscal year. Supplementary Estimates serve two purposes. First, they seek authority for revised spending levels that Parliament will be asked to approve in an Appropriation Act. Second, they provide Parliament with information on changes in the estimated expenditures to be made under the authority of statutes previously passed by Parliament. Each Supplementary Estimates document is identified alphabetically (A, B and C).
Vote Netted Revenues Authority
The authority by which Shared Services Canada has permission to collect and spend revenue earned and collected from the provision of IT services within the government.
Free PDF download
To access the Portable Document Format (PDF) version you must have a PDF reader installed. If you do not already have such a reader, there are numerous PDF readers available for free download or for purchase on the Internet: