
Progress on greening procurement: Trends
As outlined in the Greening Government Strategy, the GC is committed to greening multiple aspects of its operations, including procurement. Below is a summary of the progress towards the following targets:
- Starting in 2025, 100% of new light-duty fleet vehicle purchases will be zero-emissions vehicles (ZEV) where suitable options are available
- By 2030, the government’s light-duty fleet will be 100% ZEV
- By 2030, at least 40% of new commercial medium- and heavy-duty vehicle purchases will be ZEVs
- By 2025, use 100% clean electricity by producing or purchasing clean renewable electricity, where available
- Include criteria that address GHG emission reductions (including embodied emissions), as well as broader environmental benefits such as reducing waste (including plastic waste), in all phases of the procurement of products and services that have a high environmental impact
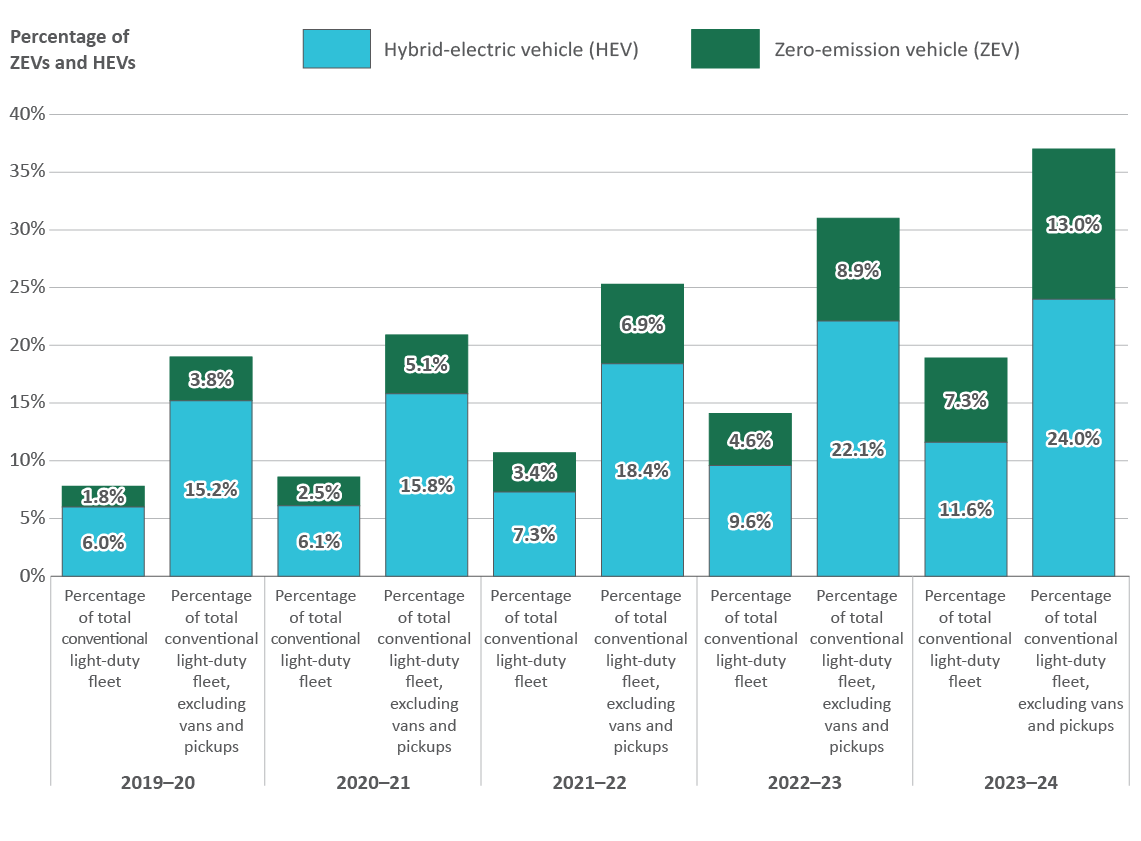
Figure 1 - Text version
For each fiscal year from 2019-20 to 2024-25, the bar graph shows the proportion of zero-emission and hybrid-electric vehicles as a percentage of the total number of vehicles in the conventional light-duty fleet. Above the bar graph is a line that shows the percentage of total zero-emission and hybrid-electric vehicles in the conventional light-duty fleet if vans and pickups were excluded from the vehicle count.
| Fiscal year | Hybrid-electric vehicles as a percentage of the total conventional light-duty fleet | Zero-emission vehicles as a percentage of the total conventional light-duty fleet | Hybrid-electric vehicles as a percentage of the conventional light-duty fleet, excluding vans and pickups | Zero-emission vehicles as a percentage of the conventional light-duty fleet, excluding vans and pickups |
|---|---|---|---|---|
| 2019–20 | 6.0% | 1.8% | 15.2% | 3.8% |
| 2020–21 | 6.1% | 2.5% | 15.8% | 5.1% |
| 2021–22 | 7.3% | 3.4% | 18.4% | 6.9% |
| 2022–23 | 9.6% | 4.5% | 22.1% | 8.9% |
| 2023–24 | 11.6% | 7.3% | 24.0% | 13.0% |
| 2024–25 | 17.4% | 14.0% | 29.7% | 20.1% |
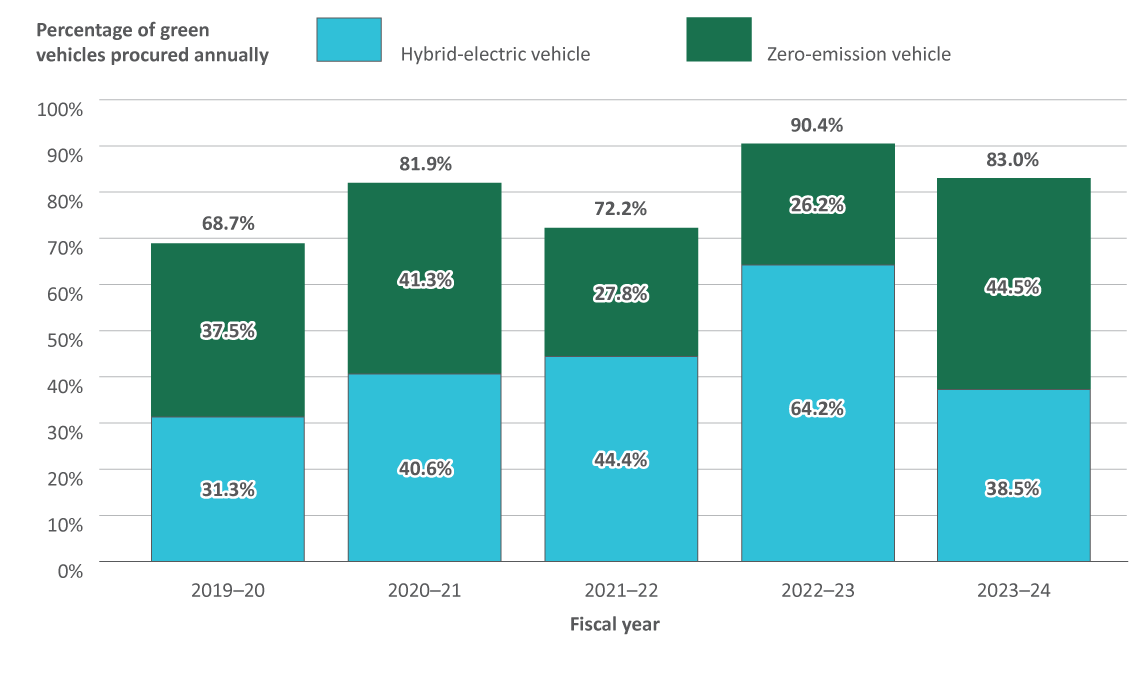
Figure 2 - Text version
For each fiscal year from 2019-20 to 2024-25, the bar graph shows the proportion of zero-emission and hybrid-electric vehicles purchased each year as a percentage of the total number of conventional light-duty vehicles purchased, where the target was applicable.
| Fiscal year | Hybrid-electric vehicles as a percentage of light-duty vehicles procured | Zero-emission vehicles as a percentage of light-duty vehicles procured | Green vehicles as percentage of light-duty vehicles procured |
|---|---|---|---|
| 2019–20 | 31.3% | 37.5% | 68.8% |
| 2020–21 | 40.6% | 41.3% | 81.9% |
| 2021–22 | 44.4% | 27.8% | 72.2% |
| 2022–23 | 64.2% | 26.2% | 90.4% |
| 2023–24 | 38.5% | 44.5% | 83.0% |
| 2024–25 | 25.0% | 50.0% | 75.0% |
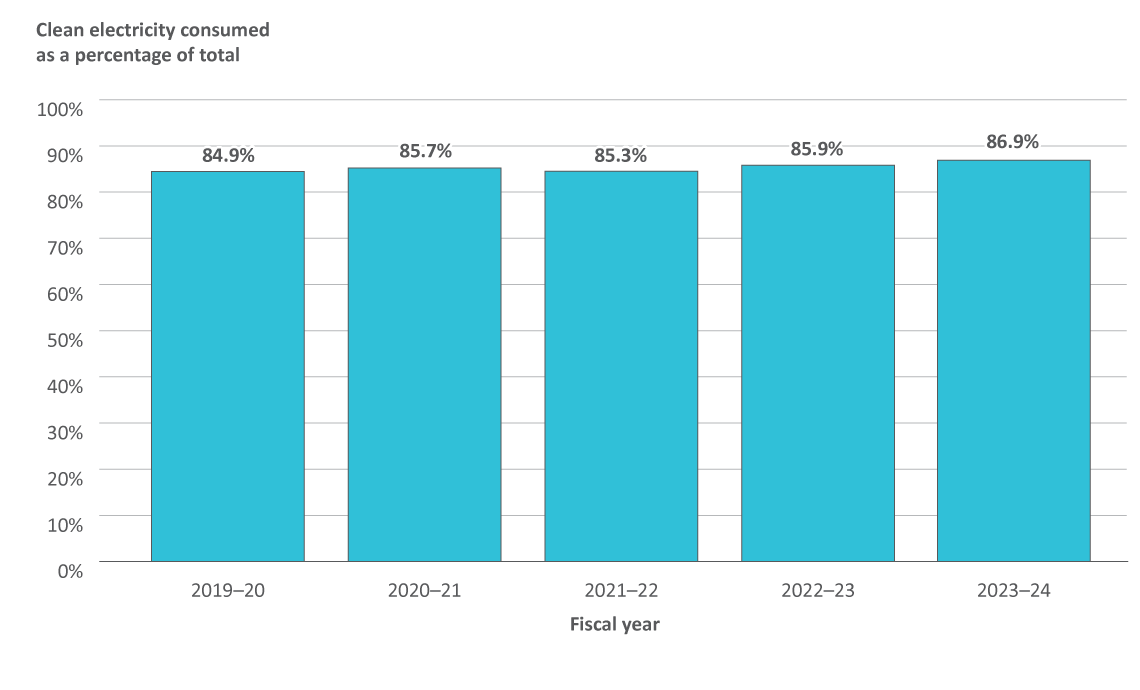
Figure 3 - Text version
For each fiscal year from 2019-20 to 2024–25, the bar graph shows the percentage of clean electricity consumed in federal operations. In this context, clean electricity comes from generation sources that do no emit greenhouse gases.
| Fiscal year | Clean electricity consumed as a percentage of the total electricity consumed by the federal government |
|---|---|
| 2019–20 | 84.9% |
| 2020–21 | 85.7% |
| 2021–22 | 85.3% |
| 2022–23 | 85.9% |
| 2023-24 | 86.9% |
| 2024-25 | 85.3% |
Key results
- The proportion of green vehicles (hybrid-electric or zero-emission) in the GC light-duty conventional fleet continues to grow. The latest data show that the proportion has grown by 23.6% since 2019–20, reaching 31.4% in 2024–25. Of the green vehicles, 14% are zero-emission vehicles (ZEVs) and 17% are hybrid-electric vehicles (HEVs).
- The GC is adopting green vehicles at a faster pace than the national average for the Canadian market, as the most recent Statistics Canada data shows that only 2.8 % of registered light-duty vehicles were green at the end of 2024.
- Green vehicle purchases are progressing well in the categories with high market availability (passenger cars and multi-purpose vehicles). Progress is slower in categories where there is limited market availability (vans and pickups, which account for 61% of the federal fleet). This situation is changing as more green van and pickup options are becoming available and accelerated progress in these segments is expected.
- The proportion of clean electricity consumed by the GC as a percentage of the total electricity consumed decreased to 85 % in 2024-25. Much of the decrease can be attributed to the increased emissions intensity of the Ontario grid. However, the proportion of clean electricity will increase as in-process clean electricity procurements in multiple jurisdictions are completed and new generating facilities come online.