
2022 Public Service Employee Survey results: Official languages
About the data
Methodological notes
About the dashboards
The dashboards show the Public Service Employee Survey (PSES) results for specific demographic groups in comparison with the results for other employees.
In the dashboards, “employees” means “employees who responded to survey.”
About the data
Percentages reflect the total of different possible affirmative responses (in other words, “Strongly agree” and “Somewhat agree” responses; “Always/Almost always” and “Often” responses; “Very high” and “High” responses; “To a large extent” and “To a very large extent” responses; or the selected response from a list).
Percentages exclude the responses “Don’t know” and “Not applicable.”
Results by employment equity group are on the Open Government Portal, in the EEInfoDV dataset.
Results by official language
First official language
In the 2022 PSES, 129,551 respondents said their first official language was English and 58,204 said it was French.
| Question | English | French |
|---|---|---|
| Got the training they need to do their job | 72% | 75% |
| Believed their organization does a good job of supporting employee career development | 62% | 65% |
| Indicated a lack of access to learning opportunities affected their career progress over the last 12 months | 12% | 10% |
First official language in bilingual areas
In the 2022 PSES, 58,177 respondents in bilingual areasFootnote 1 said their first official language was English, and 45,453 said it was French.
| Question | English | French |
|---|---|---|
| Got the training they need to do their job | 74% | 76% |
| Believed their organization does a good job of supporting employee career development | 64% | 66% |
| Indicated a lack of access to learning opportunities affected their career progress over the last 12 months | 10% | 10% |
Executives by first official language
In the 2022 PSES, 3,569 respondents who were executives said their first official language was English, and 1,987 said it was French.
| Question | English | French |
|---|---|---|
| Got the training they need to do their job | 79% | 83% |
| Believed their organization does a good job of supporting employee career development | 71% | 72% |
| Indicated a lack of access to learning opportunities affected their career progress over the last 12 months | 5% | 5% |
Comparative results by official language
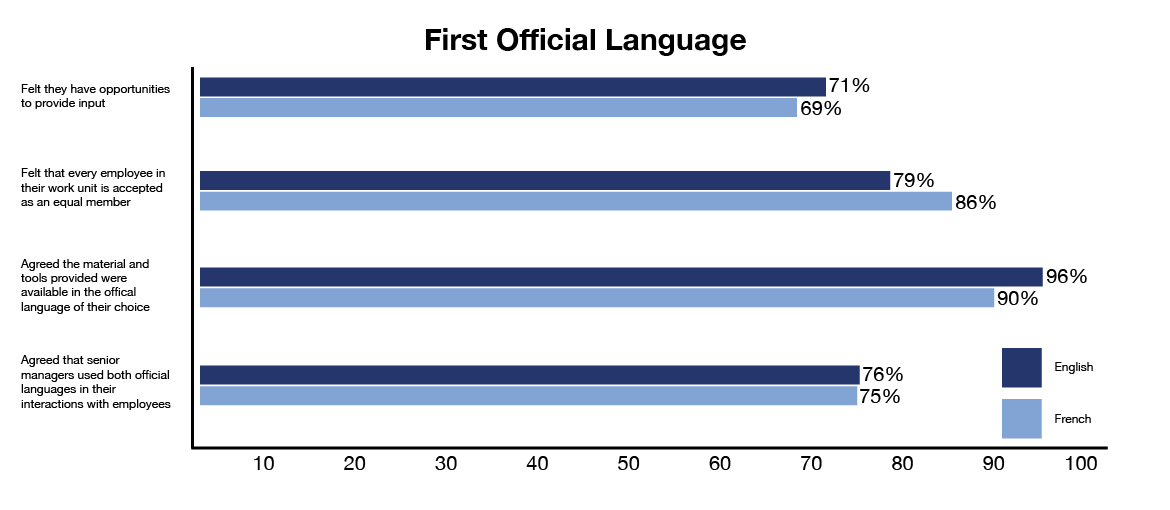
Figure 1 - Text version
| Question | English | French |
|---|---|---|
| Felt they have opportunities to provide input | 71% | 69% |
| Felt that every employee in their work unit is accepted as an equal member | 79% | 86% |
| Agreed the material and tools provided were available in the official language of their choice | 96% | 90% |
| Agreed that senior managers used both official languages in their interactions with employees | 76% | 75% |
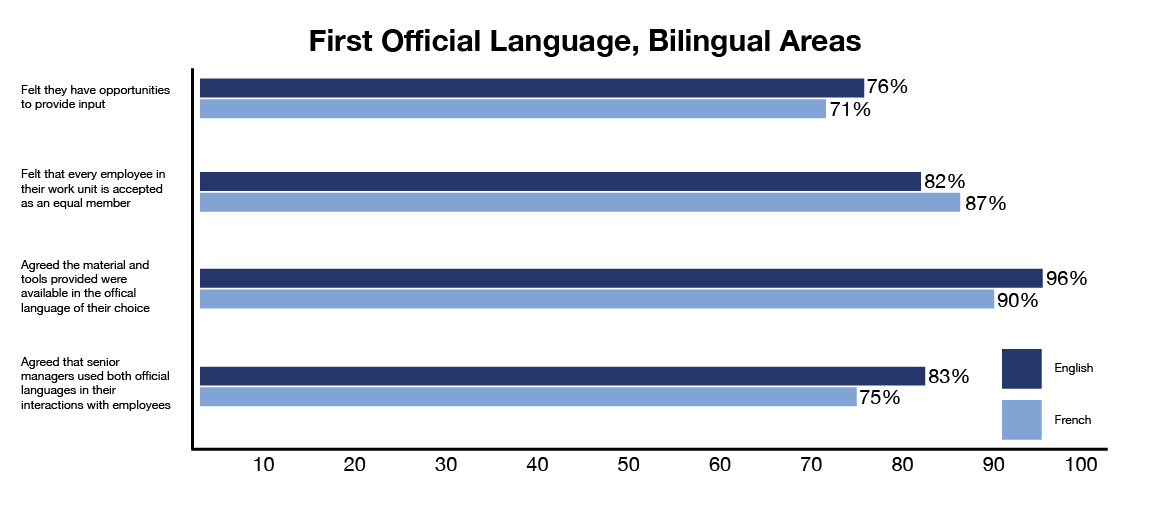
Figure 2 - Text version
| Question | English | French |
|---|---|---|
| Felt they have opportunities to provide input | 76% | 71% |
| Felt that every employee in their work unit is accepted as an equal member | 82% | 87% |
| Agreed the material and tools provided were available in the official language of their choice | 96% | 90% |
| Agreed that senior managers used both official languages in their interactions with employees | 83% | 75% |
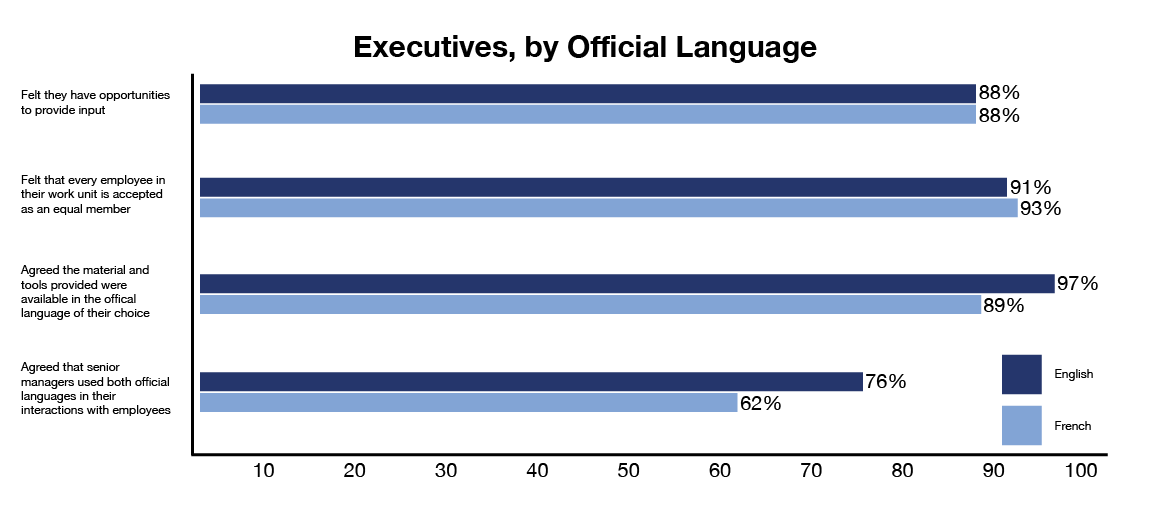
Figure 3 - Text version
| Question | English | French |
|---|---|---|
| Felt they have opportunities to provide input | 88% | 88% |
| Felt that every employee in their work unit is accepted as an equal member | 91% | 93% |
| Agreed the material and tools provided were available in the official language of their choice | 97% | 89% |
| Agreed that senior managers used both official languages in their interactions with employees | 76% | 62% |