2022 Public Service Employee Survey results: Racial group
About the data
Methodological notes
About the dashboards
The dashboards show the Public Service Employee Survey (PSES) results for specific demographic groups in comparison with the results for other employees.
About the data
In the dashboards, “employees” means employees who responded to the survey.
Percentages reflect the total of different possible affirmative responses (in other words, “Strongly agree” and “Somewhat agree” responses; “Always/Almost always” and “Often” responses; “Very high” and “High” responses; “To a large extent” and “To a very large extent” responses; or the selected response from a list).
Percentages exclude the responses “Don’t know” and “Not applicable.”
In the 2022 PSES, 40,915 employees identified as being in a racialized group (Black, East/Southeast Asian, Latino/Latina/Latinx, Middle Eastern, South Asian, or another racial group).
Question
Result for all racialized employees
Result for non-racialized (white) employees
Got a sense of satisfaction from their work
81%
79%
Felt valued at work
76%
73%
Felt encouraged to be innovative
74%
73%
Felt supported to propose new ideas
66%
68%
Felt their organization does a good job of raising awareness of mental health in the workplace
76%
73%
Felt their workplace is psychologically healthy
73%
68%
Experienced "high" or "very high" levels of work-related stress
16%
19%
Felt emotionally drained after their workday
24%
29%
Experienced harassment in the workplace in the last 12 months
9%
10%
Experienced discrimination in the workplace in the last 12 months
9%
6%
Black employees
In the 2022 PSES, 8,183 employees identified as a Black.
Question
Result for Black employees
Result for all other employees
Got a sense of satisfaction from their work
81%
79%
Felt valued at work
75%
74%
Felt encouraged to be innovative
71%
74%
Felt supported to propose new ideas
64%
67%
Felt their organization does a good job of raising awareness of mental health in the workplace
79%
74%
Felt their workplace is psychologically healthy
74%
69%
Experienced "high" or "very high" levels of work-related stress
13%
19%
Felt emotionally drained after their workday
21%
28%
Experienced harassment in the workplace in the last 12 months
11%
10%
Experienced discrimination in the workplace in the last 12 months
11%
6%
East/Southeast Asian employees
In the 2022 PSES, 13,093 employees identified as East/Southeast Asian.
Question
Result for East/Southeast Asian employees
Result for all other employees
Got a sense of satisfaction from their work
81%
79%
Felt valued at work
79%
74%
Felt encouraged to be innovative
77%
73%
Felt supported to propose new ideas
67%
67%
Felt their organization does a good job of raising awareness of mental health in the workplace
76%
74%
Felt their workplace is psychologically healthy
75%
69%
Experienced "high" or "very high" levels of work-related stress
16%
19%
Felt emotionally drained after their workday
24%
28%
Experienced harassment in the workplace in the last 12 months
7%
10%
Experienced discrimination in the workplace in the last 12 months
6%
7%
Latino/Latina/Latinx employees
In the 2022 PSES, 3,273 employees identified as Latino/Latina/Latinx.
Question
Result for Latino/Latina/Latinx employees
Result for all other employees
Got a sense of satisfaction from their work
82%
79%
Felt valued at work
75%
74%
Felt encouraged to be innovative
71%
74%
Felt supported to propose new ideas
65%
67%
Felt their organization does a good job of raising awareness of mental health in the workplace
73%
74%
Felt their workplace is psychologically healthy
72%
70%
Experienced "high" or "very high" levels of work-related stress
18%
18%
Felt emotionally drained after their workday
24%
28%
Experienced harassment in the workplace in the last 12 months
10%
10%
Experienced discrimination in the workplace in the last 12 months
9%
7%
Middle Eastern employees
In the 2022 PSES, 4,910 employees identified as Middle Eastern.
Question
Result for Middle Eastern employees
Result for all other employees
Got a sense of satisfaction from their work
80%
79%
Felt valued at work
76%
74%
Felt encouraged to be innovative
75%
74%
Felt supported to propose new ideas
69%
67%
Felt their organization does a good job of raising awareness of mental health in the workplace
75%
74%
Felt their workplace is psychologically healthy
73%
70%
Experienced "high" or "very high" levels of work-related stress
20%
18%
Felt emotionally drained after their workday
27%
28%
Experienced harassment in the workplace in the last 12 months
10%
10%
Experienced discrimination in the workplace in the last 12 months
10%
7%
South Asian employees
In the 2022 PSES, 6,546 employees identified as South Asian.
Question
Result for South Asian employees
Result for all other employees
Got a sense of satisfaction from their work
82%
79%
Felt valued at work
78%
74%
Felt encouraged to be innovative
77%
73%
Felt supported to propose new ideas
68%
67%
Felt their organization does a good job of raising awareness of mental health in the workplace
77%
74%
Felt their workplace is psychologically healthy
75%
69%
Experienced "high" or "very high" levels of work-related stress
16%
18%
Felt emotionally drained after their workday
24%
28%
Experienced harassment in the workplace in the last 12 months
8%
10%
Experienced discrimination in the workplace in the last 12 months
7%
7%
White employees
In the 2022 PSES 124,382 employees identified as white.
Question
Result for white employees
Result for all other employees
Got a sense of satisfaction from their work
79%
81%
Felt valued at work
73%
76%
Felt encouraged to be innovative
73%
74%
Felt supported to propose new ideas
68%
66%
Felt their organization does a good job of raising awareness of mental health in the workplace
73%
76%
Felt their workplace is psychologically healthy
68%
73%
Experienced "high" or "very high" levels of work-related stress
19%
16%
Felt emotionally drained after their workday
29%
24%
Experienced harassment in the workplace in the last 12 months
10%
9%
Experienced discrimination in the workplace in the last 12 months
6%
9%
Comparative results by racial group
Figure 1: Results for racialized employees compared with results for all other employeesFigure 1 - Text version
Question
Racialized employees
Other employees
Felt that every employee in their work unit is accepted as an equal member
83%
82%
Felt their ideas and opinions are valued
85%
85%
Felt their organization treats them with respect
88%
85%
Felt individuals behave in a respectful manner in their work unit
89%
88%
Organization implemented anti-racism initiatives
66%
71%
Felt comfortable sharing concerns of racism with a person of authority
72%
84%
Figure 2: Results for Black employees compared with results for other employeesFigure 2 - Text version
Question
Black employees
Employees from all other racialized groups
All other employees
Felt that every employee in their work unit is accepted as an equal member
83%
83%
83%
Felt their ideas and opinions are valued
83%
85%
85%
Felt their organization treats them with respect
87%
88%
85%
Felt individuals behave in a respectful manner in their work unit
89%
89%
88%
Organization implemented anti-racism initiatives
61%
67%
70%
Felt comfortable sharing concerns of racism with a person of authority
64%
74%
82%
Figure 3: Results for East/Southeast Asian employees compared with results for other employeesFigure 3 - Text version
Question
East/Southeast Asian employees
Employees from all other racialized groups
All other employees
Felt that every employee in their work unit is accepted as an equal member
84%
83%
83%
Felt their ideas and opinions are valued
87%
84%
85%
Felt their organization treats them with respect
88%
87%
85%
Felt individuals behave in a respectful manner in their work unit
90%
89%
88%
Organization implemented anti-racism initiatives
66%
66%
70%
Felt comfortable sharing concerns of racism with a person of authority
75%
70%
81%
Figure 4: Results for Latino/Latina/Latinx employees compared with results for other employeesFigure 4 - Text version
Question
Latino/Latina/Latinx employees
Employees from all other racialized groups
All other employees
Felt that every employee in their work unit is accepted as an equal member
82%
83%
83%
Felt their ideas and opinions are valued
84%
85%
85%
Felt their organization treats them with respect
89%
87%
85%
Felt individuals behave in a respectful manner in their work unit
89%
89%
88%
Organization implemented anti-racism initiatives
66%
66%
70%
Felt comfortable sharing concerns of racism with a person of authority
75%
71%
81%
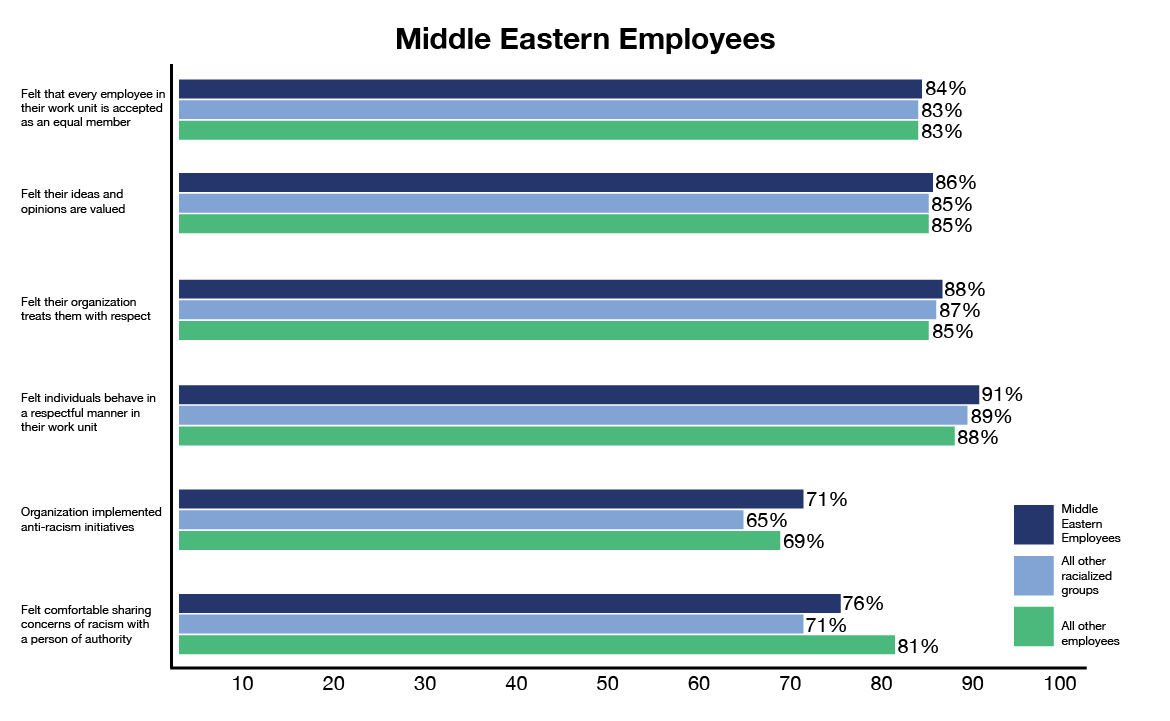
Figure 5: Results for Middle Eastern employees compared with results for other employeesFigure 5 - Text version
Question
Middle Eastern employees
Employees from all other racialized groups
All other employees
Felt that every employee in their work unit is accepted as an equal member
84%
83%
83%
Felt their ideas and opinions are valued
86%
85%
85%
Felt their organization treats them with respect
88%
87%
85%
Felt individuals behave in a respectful manner in their work unit
91%
89%
88%
Organization implemented anti-racism initiatives
71%
65%
69%
Felt comfortable sharing concerns of racism with a person of authority
76%
71%
81%
Figure 6: Results for South Asian employees compared with results for other employeesFigure 6 - Text version
Question
South Asian employees
Employees from all other racialized groups
All other employees
Felt that every employee in their work unit is accepted as an equal member
83%
83%
83%
Felt their ideas and opinions are valued
86%
85%
85%
Felt their organization treats them with respect
88%
87%
85%
Felt individuals behave in a respectful manner in their work unit
90%
89%
88%
Organization implemented anti-racism initiatives
69%
65%
70%
Felt comfortable sharing concerns of racism with a person of authority
74%
71%
81%
Figure 7: Results for white employees compared with results for employees from racialized groupsFigure 7 - Text version
Question
White employees
Employees from racialized groups
Felt that every employee in their work unit is accepted as an equal member
82%
83%
Felt their ideas and opinions are valued
85%
85%
Felt their organization treats them with respect
85%
88%
Felt individuals behave in a respectful manner in their work unit
88%
89%
Organization implemented anti-racism initiatives
71%
66%
Felt comfortable sharing concerns of racism with a person of authority