
Focus on Discrimination
The Focus series is a collection of reports that present the results of the 2014 Public Service Employee Survey (PSES), broken down by theme. Focus on Discrimination looks at results in the area of discrimination and examines how they relate to results for other aspects of the workplace. The information provided in this report is intended to help target efforts to improve people management practices in the public service.
Overall Results
The 2014 PSES contained seven questionsSee Footnote 1 relating to discrimination, including two new questions meant to obtain a clearer picture of discrimination in the workplace. These new questions deal with the actions taken to address the discrimination experienced and the reasons for not reporting the discrimination through official means (i.e., making a complaint or filing a grievance).
The response options for questions relating to the incidence, sources and types of discrimination were modified from previous surveys, so comparisons of the results over time are not possible.
Incidence of discrimination
In 2014, 8% of employees indicated that they had been the victim of discrimination on the job in the past two years (Q74).
Source(s) of the discrimination
Employees who indicated that they had been the victim of discrimination were asked to identify the source(s) of the discrimination (Q75). The results are as follows.
| Source(s) | % |
|---|---|
| Individuals with authority over them | 80 |
| Co-workers | 36 |
| Members of the public | 8 |
| Individuals from other departments or agencies | 7 |
| Individuals working for them | 3 |
| Individuals for whom they have custodial responsibility | 3 |
Type(s) of discrimination
Employees who indicated that they had been the victim of discrimination were asked to identify the type(s) of discrimination (Q76). The results are as follows.
| Nature of the discrimination | % |
|---|---|
| Sex | 24 |
| Age | 23 |
| Race | 20 |
| National or ethnic origin | 17 |
| Disability | 16 |
| Family status | 16 |
| Colour | 12 |
| Marital status | 7 |
| Religion | 5 |
| Sexual orientation | 3 |
| Pardoned conviction or suspended record | 1 |
Action(s) to address the discrimination
Of the 8% of employees who indicated that they had experienced discrimination, 7% filed a grievance or formal complaint and almost half (48%) took no action. Others took the following actions (Q77).
| Action(s) | % |
|---|---|
| Discussed the matter with their supervisor or senior manager | 29 |
| Contacted their union representative | 19 |
| Discussed the matter with the person(s) from whom they experienced discrimination | 16 |
| Resolved the matter informally on their own | 9 |
| Contacted a human resources advisor in my organization | 6 |
| Used an informal conflict resolution process | 6 |
Reasons for not filing a grievance or formal complaint
Employees who indicated that they did not file a grievance or formal complaint were asked to provide their reason(s) for not doing so (Q78). The results are as follows.
| Reason(s) | % |
|---|---|
| Did not believe it would make a difference | 65 |
| Afraid of reprisal | 44 |
| Concerns about the formal complaint process | 23 |
| Did not think the incident was serious enough | 11 |
| Too distraught | 10 |
| Advised against filing a complaint | 9 |
| Did not know what to do, where to go or whom to ask | 9 |
| Changed jobs | 7 |
| Issue was resolved | 6 |
| The individual left or changed jobs | 5 |
| Behaviour stopped | 4 |
| Management intervened | 3 |
| The individual apologized | 3 |
| Threat | 2 |
Organizational efforts to prevent and resolve discrimination
The 2014 PSES asked employees to indicate their impression of their organization’s response to discrimination and its efforts to prevent discrimination.
Fifty-five percent of all respondents agreed that they were satisfied with how matters related to discrimination are resolved in their organization (Q79). Nearly one third (31%) of employees responded that they didn’t know.
In 2014, employees were less likely to agree that their organization works hard to create a workplace that prevents discrimination (Q80) (70%) than they were in 2011 (77%). Fifteen per cent of employees responded that they didn’t know.
Demographic Findings
Occupational category
Incidence
The incidence of discrimination varies among occupational categories.See Footnote 2 Employees in the Operational category were the most likely (13%) and employees in the Executive category were the least likely (3%) to report having been the victim of discrimination on the job in the past two years.
Source(s)
When asked the source(s) of the discrimination, employees in all occupational categories most often indicated individuals with authority over them, although employees in the Scientific and professional category were slightly more likely than employees in other categories to cite that source (84% compared with 78% to 81%).
Employees in the Operational category were more likely than employees in other occupational categories to indicate the following as the source(s) of the discrimination:
- Individuals for whom they have a custodial responsibility: 12% compared with 0% to 1% for employees in other occupational categories
- Members of the public: 12% compared with 6% to 8% for employees in other occupational categories
- Individuals from other departments or agencies: 9% compared with 5% to 7% for employees in other occupational categories
Employees in the Executive category were more likely than employees in other occupational categories to indicate that they had been discriminated against by individuals working for them (14% compared with 3% to 4% for employees in other occupational categories) and less likely to indicate that they had been discriminated against by co-workers (23% compared with 32% to 42% for employees in other occupational categories).
Type(s)
When asked to indicate the type(s) of discrimination they had experienced, employees in the Executive category were more likely than employees in other occupational categories to indicate that they had experienced discrimination on the basis of sex (39% compared with 15% to 28%) and on the basis of age (34% compared with 20% to 24%).
Action(s) taken
Among employees who indicated that they had been the victim of discrimination, employees in the Executive category were the most likely to indicate they had taken no action to address it (58% compared with 45% to 53% for employees in other occupational categories). In particular, employees in the Executive category were less likely than employees in the other occupational categories to have contacted a human resources advisor in their organization (4% compared with 6% to 8%), to have used an informal conflict resolution process (3% compared with 5% to 7%) or to have filed a grievance or formal complaint (3% compared with 4% to 11%).
Reason(s) for not filing a grievance or formal complaint
Reasons for not filing a grievance or formal complaint were fairly similar among all occupational categories.
Organizational efforts to prevent and resolve discrimination
When asked about their organization’s efforts to resolve and prevent discrimination, employees in the Executive category expressed the most positive perceptions; employees in the Operational category, the least positive.
On the resolution side, 80% of all employees in the Executive category indicated that they are satisfied with how matters related to discrimination are resolved in their organization (Q79), compared with 46% of employees in the Operational category, and 52% to 57% for employees in other occupational categories.
On the prevention side, 87% of all employees in the Executive category indicated that their organization works hard to create a workplace that prevents discrimination (Q80), compared with 55% of employees in the Operational category, and 68% to 71% of employees in other occupational categories.
Employment equity groups
Persons with a disability
Incidence
One in four (26%) employees with a disability indicated that they had been the victim of discrimination on the job in the last two years, compared with 7% for other employees.
Source(s)
Among employees who indicated that they had been discriminated against, those with a disability were more likely than others to indicate that an individual with authority over them was the source of the discrimination (85% compared with 78%).
Type(s)
When asked to specify the type of discrimination they had experienced, 65% of employees with a disability indicated that they had experienced discrimination based on their disability, compared with 4% for other employees.
Action(s) taken
Employees with a disability were less likely than other employees to indicate that they had taken no action to address the discrimination they had experienced (38% compared with 51%).
Employees with a disability were more likely than other employees to have contacted their union representative (32% compared with 16%) and to have filed a grievance or formal complaint (12% compared with 6%).
Reason(s) for not filing a grievance or formal complaint
Employees with a disability who indicated that they had experienced discrimination but who did not file a grievance or formal complaint were more likely than other employees to indicate that they did not do so because they were afraid of reprisal (53% compared with 42%), because they had concerns about the formal complaint process (31% compared with 21%) or because they were too distraught (16% compared with 8%).
Organizational efforts to prevent and resolve discrimination
Employees with a disability were also less likely than other employees to agree that they are satisfied with how matters related to discrimination are resolved in their organization (41% compared with 56%, Q79) and that their organization works hard to create a workplace that prevents discrimination (56% compared with 71%, Q80).
Aboriginal people
Incidence
Employees who identified as Aboriginal were almost twice as likely as other employees to indicate they had been the victim of discrimination on the job in the past two years (15% compared with 8%).
Source(s)
Among employees who indicated that they had been discriminated against, those who identified as Aboriginal were more likely to indicate that the source of the discrimination had been a co-worker (47% compared with 35%).
Type(s)
When asked to specify the type of discrimination they had experienced, 36% of Aboriginal employees indicated that they had experienced discrimination based on race, compared with 19% for other employees.
Action(s) taken
Few differences were noted between Aboriginal and other employees in relation to the actions taken to address the discrimination they had experienced. Among employees who indicated that they had been discriminated against, similar proportions of Aboriginal and other employees indicated that they filed a grievance or formal complaint (8% and 7%, respectively).
Reason(s) for not filing a grievance or formal complaint
Among employees who indicated that they had experienced discrimination but did not file a grievance or formal complaint, Aboriginal employees were more likely than other employees to indicate that they did not file a grievance or formal complaint because they were afraid of reprisal (51% compared with 44%) and because they had concerns about the formal complaint process (28% compared with 23%).
Organizational efforts to prevent and resolve discrimination
Aboriginal employees were less likely than other employees to be satisfied with how matters related to discrimination are resolved in their organization (49% compared with 56%, Q79) and to believe that their organization works hard to create a workplace that prevents discrimination (62% compared with 70%, Q80).
Members of a visible minority group
Incidence
Employees who identified as members of a visible minority were almost twice as likely as other employees to indicate that they had been the victim of discrimination (13% compared with 7%).
Source(s)
Among employees who indicated that they had been the victim of discrimination, those who identified as members of a visible minority were more likely than other employees to indicate that they had experienced discrimination from co workers (42% compared with 35%) and from members of the public (12% compared with 6%).
Type(s)
When asked to specify the type of discrimination they had experienced, employees who identified as members of a visible minority were more likely than other employees to indicate that they had experienced discrimination based on race (50% compared with 11%), national or ethnic origin (38% compared with 10%), colour (32% compared with 5%) and religion (13% compared with 3%).
Action(s) taken
Among employees who indicated that they had been the victim of discrimination, those who identified as members of a visible minority were more likely than other employees to indicate that they took no action to address the discrimination (52% compared with 47%).
Employees who identified as members of a visible minority were less likely than other employees to have discussed the issue with their supervisor or a senior manager (25% compared with 30%) and to have contacted their union representative (16% compared with 20%). Similar proportions of employees who identified as members of a visible minority and other employees indicated that they filed a grievance or formal complaint (6% and 7%, respectively).
Reason(s) for not filing a grievance or formal complaint
The reasons given for not filing a grievance or formal complaint were similar for visible minority employees and other employees.
Organizational efforts to prevent and resolve discrimination
Employees who identified as members of a visible minority were slightly less likely than other employees to agree that they are satisfied with how matters related to discrimination are resolved in their organization (54% compared with 56%, Q79) and that their organization works hard to create a workplace that prevents discrimination (68% compared with 70%, Q80).
Women
Incidence
Identical proportions of women and men (8%) indicated that they had been the victim of discrimination on the job in the past two years.
Source(s)
Among employees who indicated that they had been discriminated against, women were more likely than men to indicate that a co worker was the source of the discrimination (39% compared with 33%).
Type(s)
When asked to specify the type of discrimination that they had experienced, 29% of women indicated that they had experienced discrimination based on sex, compared with 18% of men. Women were also more likely than men to indicate that they had experienced discrimination based on age (24% compared with 21%) and family status (20% compared to 11%), but less likely than men to indicate that they had experienced discrimination based on race (15% compared with 26%), national or ethnic origin (13% compared with 22%), colour (8% compared with 16%) and religion (4% compared with 7%).
Action(s) taken
Among employees who indicated that they had been discriminated against, women were less likely than men to have taken no action (45% compared with 51%). Women were more likely than men to have discussed the matter with their supervisor or a senior manager (31% compared with 26%) and to have discussed the matter with the person from whom they experienced the discrimination (17% compared with 14%). An identical proportion of women and men indicated that they filed a grievance or formal complaint (7%).
Organizational efforts to prevent and resolve discrimination
Only slight differences were noted between women and men in relation to the reasons for not filing a grievance or formal complaint. Women were slightly less likely than men to indicate that they did not file a grievance or complaint because they did not think it would make a difference (63% compared with 67%), but they were slightly more likely to indicate that they did not file a grievance or complaint because they thought the incident was not serious enough (12% compared with 9%), because they were too distraught (11% compared with 8%) or because they had changed jobs (9% compared with 6%).
Satisfaction with discrimination resolution and prevention
Similar proportions of women and men agreed that they are satisfied with how matters related to discrimination are resolved in their organization (55% compared with 56%, Q79) and that their organization works hard to create a workplace that prevents discrimination (70% compared with 69%, Q80).
Age
Incidence
Employees aged 24 years and under were about half as likely as employees in older age groups to report having been the victim of discrimination at work (4% compared with 7% to 9% for employees in older age groups).
Source(s)
Among employees who indicated that they had been discriminated against, employees aged 24 years and under were more likely than employees in older age groups to have been discriminated against by co-workers (52% compared with 48% for employees aged 25 to 29, and 33% to 37% for employees in older age groups) and by members of the public (27% compared with 5% to 13% for employees in older age groups). Employees aged 24 years and under who had experienced discrimination were less likely than employees in older age groups to indicate that the source of the discrimination was individuals with authority over them (54% compared with 67% for employees aged 25 to 29, and 79% to 83% for employees in older age groups).
Type(s)
Among employees who indicated that they had experienced discrimination, age was the most frequently cited type of discrimination experienced by those in the two youngest age groups (24 years and under and 25–29 years) and the two oldest age groups (55–59 years and 60 years and older) (see Figure 1). Family status was the most frequently cited type of discrimination among employees aged 35 to 39 years (28%) (see Figure 2).
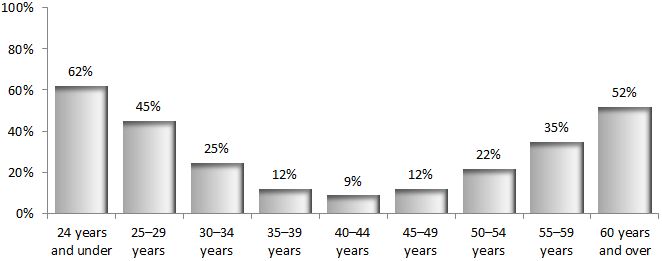
Figure 1 - Text version
Figure 1 illustrates the proportion of employees who selected the response option "age" to Q76 (Please indicate the type of discrimination you experienced) by age group. Q76 was asked only to employees who indicated that they have been the victim of discrimination (Q74).
| 24 years and under | 25-29 years | 30-34 years | 35-39 years | 40-44 years | 45 to 49 years | 50 to 54 years | 55-59 years | 60 years and over |
|---|---|---|---|---|---|---|---|---|
| 62% | 45% | 25% | 12% | 9% | 12% | 22% | 35% | 52% |
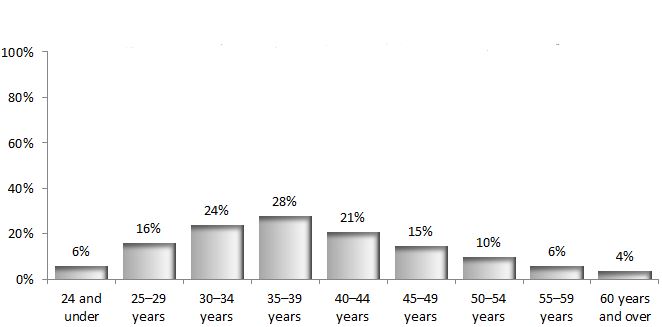
Figure 2 - Text version
Figure 2 illustrates the proportion of employees who selected the response option "family status" to Q76 (Please indicate the type of discrimination you experienced) by age group. Q76 was asked only to employees who indicated that they have been the victim of discrimination (Q74).
| 24 years and under | 25-29 years | 30-34 years | 35-39 years | 40-44 years | 45 to 49 years | 50 to 54 years | 55-59 years | 60 years and over |
|---|---|---|---|---|---|---|---|---|
| 6% | 16% | 24% | 28% | 21% | 15% | 10% | 6% | 4% |
Among employees who indicated that they had been discriminated against, the proportion who indicated that they had experienced discrimination based on sex decreased with age. For example, 35% of employees aged 29 and under indicated “sex” as the type of discrimination they experienced, compared with 13% of employees aged 60 years and over.
Action(s) taken
Among employees who indicated that they had been the victim of discrimination, younger employees were more likely than older employees to indicate that they took no action in response to the discrimination they experienced (62% of employees aged 24 years and under, compared with 56% for employees aged 25 to 29, and 43% to 51% for employees in older age groups).
Employees aged 24 years and under were less likely than employees in older age groups to have discussed the matter with their supervisor or a senior manager (20% compared with 25% to 31% for employees in older age groups), with the person from whom they experienced the discrimination (11% compared with 15% to 17% for employees in older age groups), or contacted their union representative (4% compared with 12% to 22% for employees in older age groups) or a human resources advisor in their organization (2% compared with 4% to 7% for employees in older age groups). Employees aged 24 years and under were also less likely to have filed a grievance or formal complaint (3% compared with 6% to 9% for employees in older age groups).
Reason(s) for not filing a grievance or formal complaint
Among employees who indicated that they had experienced discrimination, those in the younger age groups were more likely to indicate that they did not file a grievance or formal complaint because they did not think the incident was serious enough (39% of employees aged 24 years and under, 25% of employees aged 25–29 years, and 7% to 16% of employees in older age groups), or that they did not know what to do, where to go or whom to ask (21% of employees aged 24 years and under, 14% of employees aged 25–29 years, and 7% to 12% for employees in older age groups).
Organizational efforts to prevent and resolve discrimination
Employees aged 24 years and under were more likely than those in older age groups to agree that they are satisfied with how matters related to discrimination are resolved in their organization (78% compared with 53% to 63% of employees in older groups, Q79) and that their organization works hard to create a workplace that prevents discrimination (84% compared with 68% to 75% of employees in older age groups, Q80).
Key Observations
Discrimination linked to less positive perceptions of organizational efforts to prevent and resolve discrimination
Employees who reported that they had been the victim of discrimination on the job tended to hold less favourable views of efforts in their organization to prevent and deal with discrimination. For example, employees who indicated that they had been discriminated against were less likely than those who did not to agree that their organization works hard to create a workplace that prevents discrimination (21% compared with 74%, Q80) and that they are satisfied with how matters related to discrimination are resolved in their organization (12% compared with 61%, Q79).
Discrimination and organizational efforts to prevent and resolve discrimination linked to differences in opinions about the workplace
Satisfaction with the organization
Employees who indicated that they had experienced discrimination on the job tended to express lower levels of satisfaction with their organization than did employees who indicated that they had not experienced discrimination. For example, employees had been discriminated against were less likely than employees who had not to indicate that they are satisfied with their organization (31% compared with 67%, Q59) and that they would recommend their organization as a great place to work (31% compared with 66%, Q58).
Differences in levels of satisfaction with the organization were even greater between employees who have positive opinions about their organization’s efforts to prevent or resolve discrimination and those who did not. For example, employees who agreed that they are satisfied with how matters related to discrimination are resolved in their organization (Q79) were much more likely than those who disagreed to indicate that they are satisfied with their organization (81% compared with 21%, Q59) and that they would recommend their organization as a great place to work (81% compared with 22%, Q58).
Perceptions of respect and ethics in the workplace
Employees who had experienced discrimination were less likely than employees who had not to perceive their workplace as respectful and ethical. For example, employees who had been discriminated against were half as likely as other employees to feel that their organization treats them with respect (42% compared with 83%, Q57) and to think that their organization respects individual differences such as culture, work styles and ideas (42% compared with 81%, Q56). Employees who had experienced discrimination were also less likely than those who had not to be satisfied with how interpersonal issues are resolved in their work unit (34% compared with 67%, Q24), and to agree that they can initiate a formal recourse process such as a grievance, complaint or appeal without fear of reprisal (17% compared with 48%, Q50).
Differences in perceptions of respect and ethics in the workplace were greater between employees who held positive opinions of their organization’s efforts to prevent or resolve discrimination issues and those who did not. In particular, employees who agreed that their organization works hard to create a workplace that prevents discrimination (Q80) were more likely than those who disagreed to also feel that their organization treats them with respect (92% compared with 31%, Q57) and that their organization respects individual differences such as culture, work styles and ideas (91% compared with 30%, Q56). Further, employees who agreed that their organization works hard to create a workplace that prevents discrimination were more likely than those who disagreed to be satisfied with how interpersonal issues are resolved in their work unit (77% compared with 28%, Q24) and to agree that they can initiate a formal recourse process such as a grievance, complaint or appeal without fear of reprisal (60% compared with 12%, Q50).
Opinions about senior management
Employees who had been discriminated against tended to perceive their senior management in a less positive light than employees who had not been discriminated against, particularly in relation to the ethical nature of senior management’s behaviour. Victims of discrimination were less likely than other employees to believe that senior managers in their organization lead by example in ethical behaviour (30% compared with 65%, Q39).
Differences in opinions about senior management were even greater between employees who have positive opinions about their organization’s efforts to prevent or resolve discrimination and those who do not. For example, employees who agreed that their organization works hard to create a workplace that prevents discrimination (Q80) were much more likely than those who disagreed to believe that senior managers in their organization lead by example in ethical behaviour (77% compared with 19%, Q39).
Fairness of staffing processes
Employees who indicated that they had experienced discrimination were less likely than employees who did not to perceive the staffing processes in their work unit as fair. For example, victims of discrimination were less likely than other employees to agree that, in their work unit, the process for selecting a person for a position is done fairly (25% compared with 60%, Q27).
Differences in perceptions of fairness in staffing were greater between employees who believe that their organization strives to prevent or resolve discrimination and those who do not. For example, employees who agreed that they are satisfied with how matters related to discrimination are resolved in their organization (Q79) were more likely than those who disagreed to also indicate that, in their work unit, the process for selecting a person for a position is done fairly (72% compared with 19%, Q27).
Discrimination and harassment are closely linked
The 2014 results show that discrimination and harassment are closely related. Two thirds of employees (66%) who indicated that they had been discriminated against also indicated that they had been harassed; 15% of employees who did not indicate that they had experienced discrimination indicated that they had experienced harassment. In addition, 28% of employees who indicated that they had been harassed also indicated that they had been discriminated against; 3% of employees who indicated that they had not been harassed indicated that they had been discriminated against.
Methodological Notes
For the purposes of this report, results for the two most positive responses on the scale (e.g., "Strongly agree" and "Somewhat agree") were added together to create a single percentage total for positive responses. Similarly, results for the two most negative responses on the scale (e.g., "Strongly disagree" and "Somewhat disagree") were added together to create a single percentage total for negative responses. The totals used to calculate the percentages do not include the responses "Don't know" and "Not applicable."
The observations in this report do not necessarily indicate relationships of cause and effect, but they can provide insight into connections between different aspects of the workplace.
For additional results and for the distribution of respondents by demographic characteristics, consult the 2014 PSES website.
Appendix
| Occupational Category | Occupational Group |
|---|---|
| Executive | CI-EXC, DM, EC(CRA), EX, EXPCX, GR-EX, LC, MGT, PL, RLE |
| Scientific and Professional | AC, AG, AR, AP-AA, AP-PA, ASG-ITS-LA, AU, BI, CH, CI-SPC, DE, DS, EC, ED, EN, ES, FO, HR, LA, LP, LS, MA, MD, MT, ND, NU, OP, PC, PH, PM-MCO, PS, SE, SG, SI, SW, UT, VM |
| Administration and Foreign Services | AS, CO, CS, FI, FS, HR(CRA), IS, OM, PE, PG, PM, TR, WP |
| Technical | AI, AO, CIPTC, DD, EG, EL, EU, GT, PI, PY, RO, SO, TI |
| Administrative Support | CIASC, CM, CR, DA, OE, ST |
| Operational | CX, FB, FR, GA, GL, GS, HP, HS, IN, LI, PO-IMA, PO-TCO, PR, SC, SR |
| Other | AB, CIVIL, FT, Governor in Council, GR, IM, MDMDG, MG, NB, RE, REG, RM, SP(CRA), Student, UNI, Other |
Page details
- Date modified: