
Gender-based Analysis Plus implementation survey results 2022–2023
The 2022–2023 GBA Plus Implementation Survey collected insights from across the federal government, underscoring ongoing efforts to integrate GBA Plus principles into policies, programs, and initiatives.
Copyright information
© His Majesty the King in Right of Canada, as represented by the Minister of Women and Gender Equality, 2024
Cat No. SW1-21E-PDF
ISSN 2819-1870
Aussi disponible en français sous le titre : Résultats de l’Enquête sur la mise en œuvre de l’Analyse comparative entre les sexes Plus 2022-2023
Survey participation
Text version
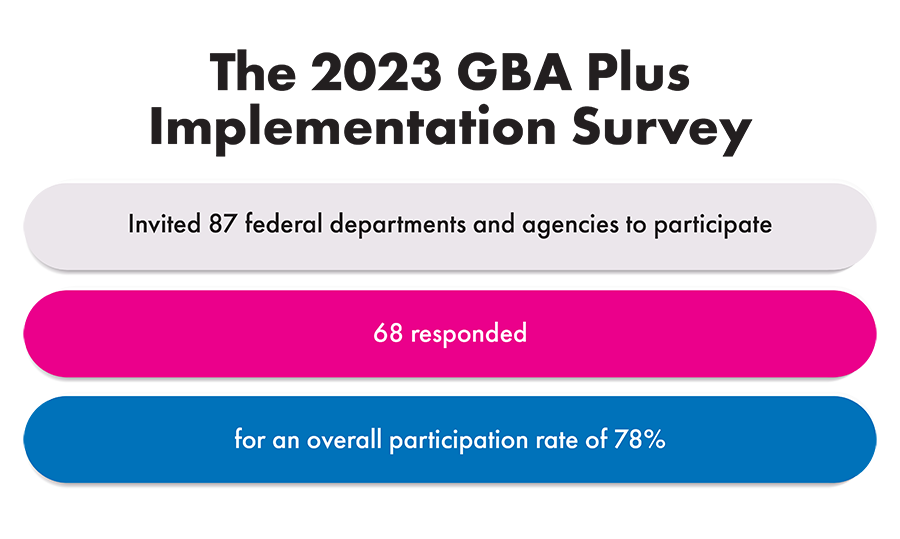
The 2023 GBA Plus Implementation Survey invited 87 federal departments and agencies to participate in the survey, of which 68 responded (for an overall participation rate of 78%).
The 87 federal departments and agencies represented 98% of Main Estimates* federal spending in 2022-23.
The survey was not conducted between 2020-2022 due to departmental priorities to respond the COVID-19 pandemic.
*Main Estimates describe the resources required by individual departments and agencies for an upcoming fiscal year. For more information on government spending, please visit Planned government spending.
Training and support

In 2023, 60% of surveyed departments and agencies had mandatory GBA Plus training in one or more functional areas*, versus 55% in 2021.
More public servants from different functional areas* reported having GBA Plus training in the 2023 survey compared to the 2021 survey.
Mandatory GBA Plus training is becoming more common
In 2021, Women and Gender Equality Canada (WAGE) developed a suite of tools including a new Step-by-Step Guide and a Compendium (which includes information and guidance concerning different identity factors) to support the application of GBA Plus.
More than 2/3 of surveyed departments and agencies used the Step-by-Step Guide.
Over 50% of surveyed departments and agencies used the Compendium.
*Functional areas represent areas of work or services and include the following: policy, evaluation, program design and delivery, program or frontline service delivery, research, human resources, financial management, information management/information technology services, and procurement.
Capacity

In 2023, 98% of departments and agencies had one or more elements of capacity* in place, compared to 95% in the 2021 survey.
74% of surveyed departments and agencies reported having 5 out of 8 or more key elements of capacity* of GBA Plus in place, compared with 68% in the 2021 survey.
The survey also showed that departments and agencies participated in existing interdisciplinary policy networks to support GBA Plus application at the working level and for senior management.
There are more Full-Time Equivalents (FTEs) in the federal government that are dedicated to GBA Plus implementation in 2023 compared to 2021, with a mean count of almost 5 FTEs per organization reported in 2023 versus 4 FTEs in 2021.
Recognizing the limited capacity and the reporting burden faced by small federal agencies, WAGE has begun to offer an alternative to the survey for these organizations. Going forward, the reporting on survey results will include a separate analysis from focus group sessions with those smaller federal agencies, to capture their progress on GBA Plus implementation, as well as the challenges they face.
*Key elements of capacity listed in the survey included: a departmental GBA Plus Steering Committee, a departmental GBA Plus implementation plan/action plan, a formal GBA Plus policy or statement of intent, an intra-departmental network or working-level group dedicated to GBA Plus, discussion of GBA Plus at senior management committees, resources dedicated to the development, delivery or promotion of GBA Plus training for employees, a GBA Plus Champion or other senior management representative to lead GBA Plus, and tools and resources to assist employees in applying GBA Plus to their work.
Application

In the 2023 survey, 51 departments and agencies provided a total of 111 examples of how GBA Plus was applied to various initiatives.
65% of the examples demonstrated an intersectional approach
51% of the examples were informed by qualitative data such as lived experiences
The integration of GBA Plus to different functional areas of work* in government is improving. In 2023, departments and agencies integrated GBA Plus into all 13 areas of work, with an increase in application in 11 of the 13 areas of work. The largest increase was seen with procurement: in 2023, 62% of surveyed departments and agencies integrated GBA Plus in procurement versus 44% in the 2021 survey.
To support the application of GBA Plus to different areas of work, the survey results showed that most departments and agencies used key WAGE resources, including the GBA Plus online course and the WAGE departmental website.
*Functional areas of work listed in the survey included: departmental results reports, departmental plans, departmental results frameworks, research, consultations, evaluation, program or front-line service delivery, human resource management, transfer payments, performance information profiles, development and design of training and professional development, procurement, information management/information technology services.
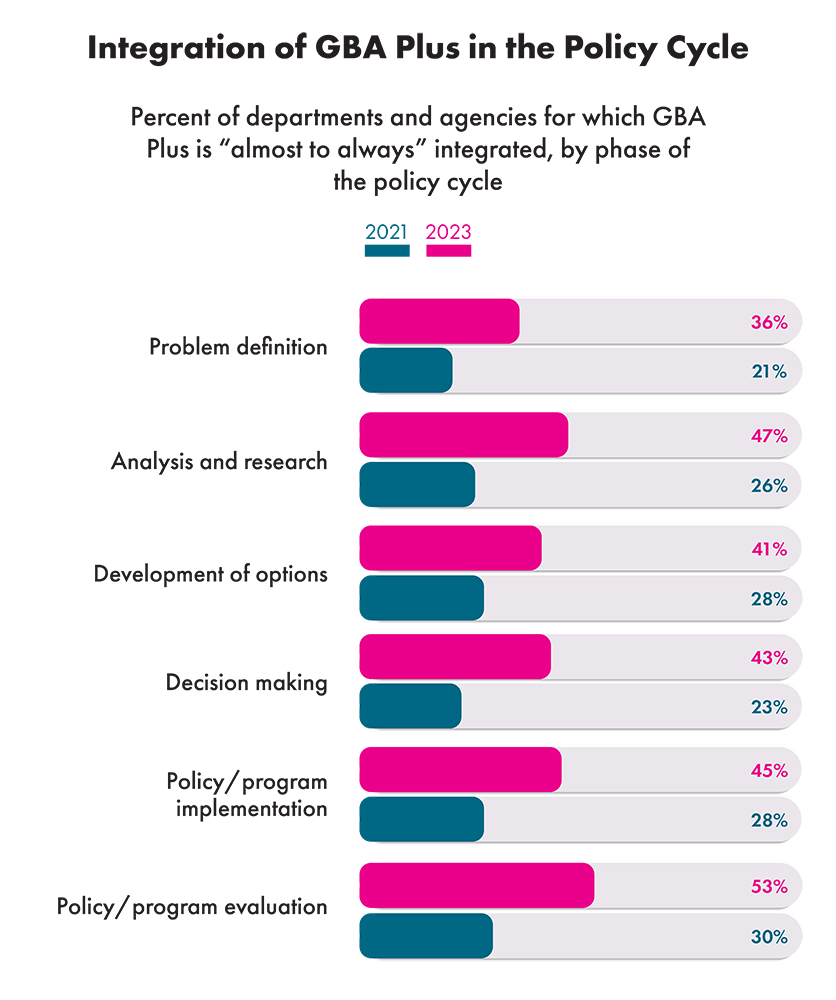
As shown in the graph below, the survey results suggest that progress has been made in the integration of GBA Plus across all phases of the policy development cycle, from “problem definition” to “policy/program evaluation.”
Text version
Integration of GBA Plus in the Policy Cycle:
- Percent of departments and agencies for which GBA Plus is “almost to always” integrated, by phase of the policy cycle
- Problem definition
- 2023: 36%
- 2021: 21%
- Analysis and research
- 2023: 47%
- 2021: 26%
- Development of options
- 2023: 41%
- 2021: 28%
- Decision making
- 2023: 43%
- 2021: 23%
- Policy/program implementation
- 2023: 45%
- 2021: 28%
- Policy/program evaluation
- 2023: 53%
- 2021: 30%
- Problem definition
Data
In 2023:
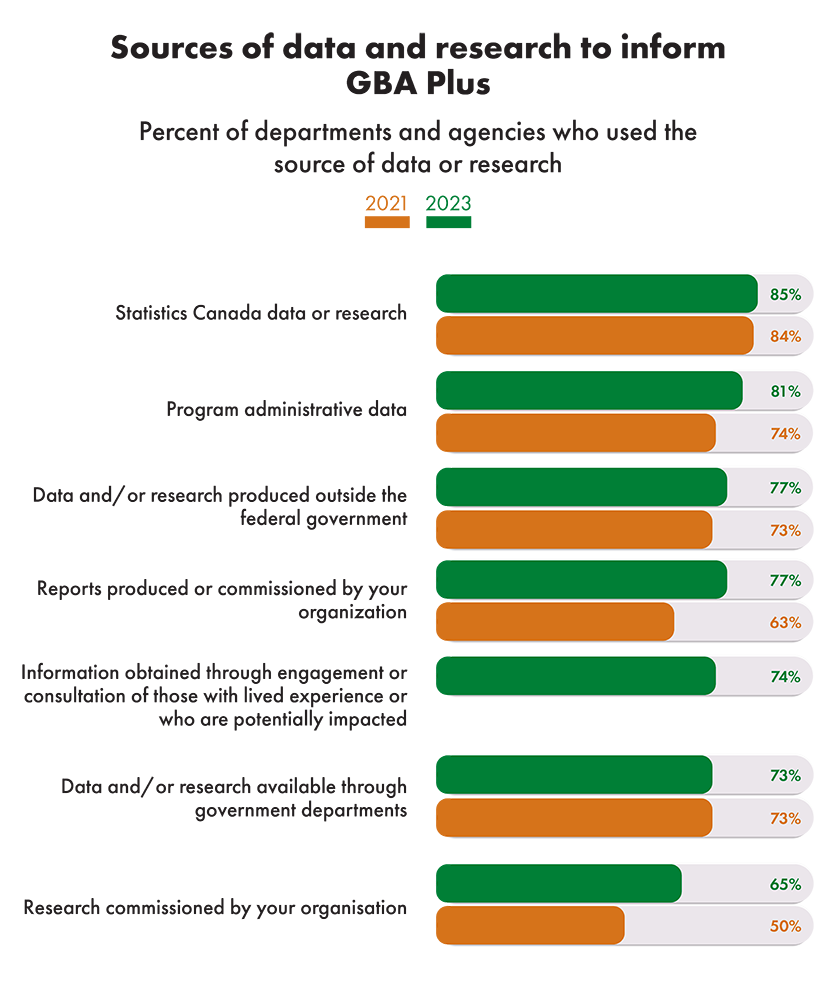
85%
of departments and agencies used Statistics Canada data or research to inform GBA Plus, up from 84% in 2021.
6 out of 7
most sources of data or research listed in the survey had more departments and agencies using them in 2023.
For the first time
the 2023 survey asked about information gathered through engagement and consultations of those with lived experience.
74%
of departments and agencies used engagement and consultations of those with lived experience to inform GBA Plus.
Text version
Sources of data and research to inform GBA Plus
- Percent of departments and agencies who used the source of data or research
- Statistics Canada data or research2023: 85%2021: 84%
- Program administrative data2023: 81%
- 2021: 74%
- Data and/or research produced outside the federal government
- 2023: 77%
- 2021: 73%
- Reports produced or commissioned by your organization
- 2023: 77%
- 2021: 63%
- Information obtained through engagement or consultation of those with lived experience or who are potentially impacted
- 2023: 74%
- Data and/or research available through government departments
- 2023: 73%
- 2021: 73%
- Research commissioned by your organisation
- 2023: 65%
- 2021: 50%
Areas for improvement
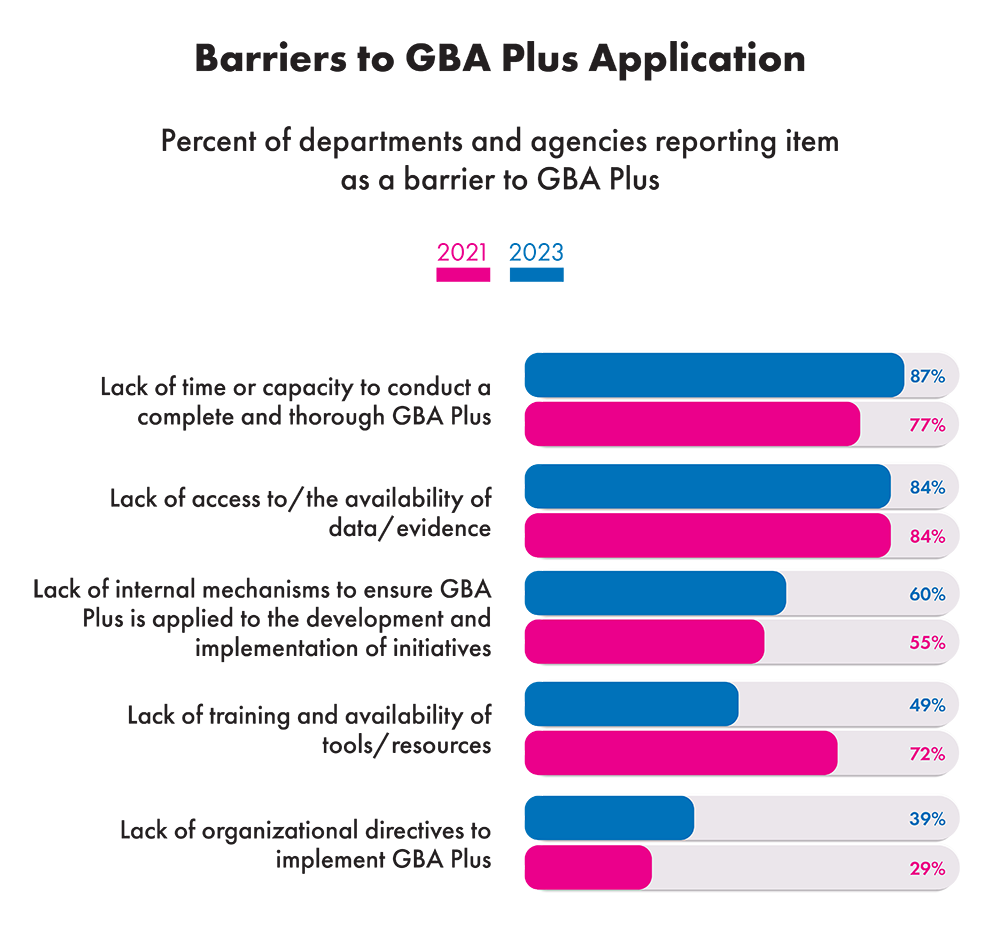
The survey asked departments and agencies about the barriers they encountered to applying GBA Plus. While there was progress in terms of availability of training and tools, there were greater barriers in most other areas listed in the survey compared to the 2021 survey.
A lack of time or capacity became the most prevalent barrier in the latest survey. In 2023, 87% of departments and agencies identified the lack of time or capacity as a barrier to GBA Plus application, up from 77% in the 2021 survey.

Text version
Barriers to GBA Plus Application:
- Percent of departments and agencies reporting item as a barrier to GBA Plus
- Lack of time or capacity to conduct a complete and thorough GBA Plus
- 2023: 87%
- 2021: 77%
- Lack of access to/the availability of data/evidence
- 2023: 84%
- 2021: 84%
- Lack of internal mechanisms to ensure GBA Plus is applied to the development and implementation of initiatives
- 2023: 60%
- 2021: 55%
- Lack of training and availability of tools/resources
- 2023: 49%
- 2021: 72%
- Lack of organizational directives to implement GBA Plus
- 2023: 39%
- 2021: 29%
- Lack of time or capacity to conduct a complete and thorough GBA Plus