
Annual Report 2022 to 2023: Building tomorrow’s public service today
Table of contents
- Message from the Commissioners
- Overall staffing trends
- A modernized staffing system
- Safeguarding the staffing system
- Looking forward
- Endnotes
- Annex 1: Employment equity group applicants to advertised processes and hires, compared to workforce availability
- Annex 2: Geographical distribution of public service hires and Public Service Employment Act population
- Annex 3: Employment equity group non-advertised appointments
Message from the Commissioners
Every year, the Public Service Commission of Canada reports to Parliament on the health and integrity of the staffing system and the non-partisanship of the federal public service. Our annual report provides a portrait of public service hiring, and some examples of the excellent work of departments and agencies in the 2022 to 2023 fiscal year.
This year, we want to recognize the efforts of departments and agencies as they prepared for the July 2023 implementation of amendments to the Public Service Employment Act. The amendments include a new requirement for hiring managers to remove or mitigate biases and barriers in assessment, and a new redress mechanism for those who face biases and barriers in hiring. As a whole, the amendments will help ensure fairness and inclusivity in public service hiring processes.
As we move to more inclusive hiring, we must be both thoughtful and bold in adopting emerging technologies and tools that can shift how we assess and hire. A shift to unsupervised second language testing on a more accessible platform was a starting point for our digital transformation, which should lead to more efficient hiring and fewer barriers, while ensuring merit is protected.
Finally, this year was marked by the departure of Commissioner Daniel Tucker. We would like to extend our heartfelt appreciation for his enormous contribution to the Public Service Commission of Canada. Daniel was instrumental in helping us navigate important initiatives and tough challenges over his 10-year tenure. His thoughtful feedback, decisiveness and dedicated service have left a lasting impact, setting a high standard of excellence for us all.
Stan Lee
Interim President
Fiona Spencer
Commissioner
Hélène Laurendeau
Commissioner
Overall staffing trends
Population and hiring
The federal public service population (indeterminate, term, casual and student) under the Public Service Employment Act continued to increase, rising by 6.5% (16 642 employees) to 274 219 employees between April 1, 2022, and March 31, 2023.Endnote1, Endnote2
Count of and year-over-year change in Public Service Employment Act population, March 31, 2023
Count of and year-over-year change in Public Service Employment Act population, March 31, 2023 - Text version
| Tenure | Population | Change in population |
|---|---|---|
| Indeterminate | 229 289 | +6.9% |
| Term | 28 024 | +10.2% |
| Casual | 9 234 | -10.4% |
| Student | 7 672 | +3.6% |
| Total | 274 219 | +6.5% |
This growth corresponds to an increase in hiring, with 71 200 external hires (hires from outside the federal public service) this year, an increase of 9.9% (6 404 more hires) when compared to the previous year.
| Tenure | Hiring activities | Year-over-year change in hiring activities |
|---|---|---|
| Indeterminate | 13 153 | +18.1% |
| Term | 21 610 | +12.6% |
| Casual | 21 506 | +1.3% |
| Student | 14 931 | +12.9% |
| Total | 71 200 | +9.9% |
This fiscal year, 58.1% of external hiring activities and promotions (indeterminate and term hires) were identified as non-advertised, increasing from 37.8% of non-advertised activities 4 years earlier (2018 to 2019 fiscal year). For more data on advertised and non-advertised appointments, refer to the Advanced statistics - hiring section of our staffing dashboard.
Median time to hire new public servants decreases
This year, the median time to hire new public servants was 220 days, a 3.1% decrease from the previous year.
Over the same period, internal staffing times increased by 7.1%, reaching 195 days.Endnote3
For more data on time to staff, refer to our time-to-staff interactive graphic.
This year, 5 occupational groups continued to have the most indeterminate and term hires.
| Occupational groups | External hiring activities |
|---|---|
| Program Administration (PM) | 21.9% |
| Clerical and Regulatory (CR) | 20.1% |
| Administrative Services (AS) | 14.5% |
| Economics and Social Science (EC) | 8.8% |
| Information Technology (IT) | 6.0% |
| All other groups | 28.7% |
The PM, AS and EC occupational groups have shown an upward trend in hiring activity over the past 10 years, while the CR group had a relatively stable share of hiring activity.
Collective cyber recruitment campaign
Last year, Shared Services Canada, the Canada Revenue Agency, the Canadian Radio-television and Telecommunications Commission, Correctional Service Canada, Health Canada, the Royal Canadian Mounted Police and the Treasury Board of Canada Secretariat worked together to run a cyber recruitment campaign to hire candidates. The campaign is part of the larger Digital Talent Pool, which gives federal departments and agencies access to qualified candidates with a variety of experience and skills.
In total, the campaign identified 187 qualified candidates. Of these qualified candidates, 53% self-declared as members of visible minorities, 23% self-declared as women and 4% self-declared as persons with disabilities.
As of March 31, 2023, over half of the Public Service Employment Act population worked outside the National Capital Region (52.2%).Endnote4
| 2019 | 2020 | 2021 | 2022 | 2023 | |
|---|---|---|---|---|---|
| National Capital Region | 46.7% | 46.9% | 46.8% | 47.5% | 47.6% |
| Outside the National Capital Region |
52.6% | 52.3% | 52.4% | 51.9% | 52.2% |
| Unknown | 0.6% | 0.8% | 0.8% | 0.6% | 0.1% |
Refer to our interactive graphic on regional representation for more information on employment equity representation by region.
Job applications
This year, there were 423 530 applicants to externally advertised federal public service positions (federal organizations under the Public Service Employment Act), representing a 3.2% decline from the previous year and an increase as compared to the year before the pandemic (there were 407 674 applicants in fiscal year 2019 to 2020).
| Employment equity groups | Applicants (2020 to 2021) |
Applicants (2021 to 2022) | Applicants (2022 to 2023) |
Workforce availability* |
|---|---|---|---|---|
| Indigenous Peoples | 2.9% | 3.2% | 3.0% | 3.8% |
| Persons with disabilities | 3.3% | 4.8% | 5.1% | 9.1% |
| Members of a visible minority | 25.0% | 29.4% | 30.6% | 17.2% |
| Women | 57.4% | 57.2% | 55.6% | 53.3% |
* As of the 2021 to 2022 fiscal year, the workforce availability is based on Canadian citizens and permanent residents. Previously, the workforce availability was only based on Canadian citizens.
There were more applications from people who self-declared they had a disability or were a member of a visible minority, while applications declined from people who self-declared they were Indigenous or a woman.Endnote5, Endnote7, Endnote9, Endnote11
We continue to observe gaps in applications from Indigenous Peoples and persons with disabilities when compared to their availability in the workforce. (See Annex 1 for detailed applicant data for employment equity groups and subgroups.)
Refer to our interactive employment equity dashboard for more data on hiring activities and applicants for employment equity groups and subgroups.Endnote6, Endnote8, Endnote10
Student and graduate hiring
This year, 8 919 students were hired through the Federal Student Work Experience Program, an increase of 17.4% as compared to 7 598 hires in the previous year.Endnote12 Hiring through the Post-Secondary Co-op Internship Program also increased, rising by 7.2% over the previous year, to 5 889 hires this year.
Count of external hiring activities, Federal Student Work Experience Program and Post-Secondary Co-op/Internship Program, by fiscal year - Text version
| 2018 to 2019 | 2019 to 2020 | 2020 to 2021 | 2021 to 2022 | 2022 to 2023 | |
|---|---|---|---|---|---|
| Federal Student Work Experience Program | 8 050 | 9 423 | 6 001 | 7 598 | 8 919 |
| Post-Secondary Co-op/Internship | 5 385 | 5 626 | 4 208 | 5 495 | 5 889 |
*In 2022 to 2023, the Research Affiliate Program saw 123 hires.
The increase in Federal Student Work Experience Program hires included increases in employment equity group members. Most notably, this fiscal year, 779 students who self-declared as a person with a disability were hired, rising by 36.0% over the previous year.
This year, the number of candidates hired that self-declared as a member of a visible minority also increased by 22.2% (total of 2 807 hires), and the number of hired students who had self-declared as Indigenous increased by 10.7% (total of 496 hires).
Finally, this fiscal year, 558 people joined the federal public service through the Post-Secondary Recruitment Program, a 36.8% increase over the previous year.
| Employment equity groups | Appointments* | Share of Federal Student Work Experience Program appointments |
|---|---|---|
| Indigenous Peoples | 496 | 5.6% |
| Persons with disabilities | 779 | 8.7% |
| Members of a visible minority | 2 807 | 31.5% |
| Women | 5 619 | 63.0% |
*People who self-declare in more than 1 designated employee equity group are included in the total count for each group identified (for example, an Indigenous woman is included in the total count for both women and Indigenous Peoples).
Connecting with Indigenous talent
To reach Indigenous students online and in their communities, the Public Service Commission of Canada co-created an outreach strategy with an Indigenous communications company.
The strategy used print and digital communications to establish connections within Indigenous communities and encourage Indigenous students to apply to public service student jobs.
Through this program, we were able to connect with potential candidates in 1 727 Indigenous communities across Canada.
Internal mobility
This fiscal year, 30.0% of public servants in an indeterminate or term position changed roles through a promotion, an acting appointment or a lateral move, a 1.6 percentage point increase over the previous year.Endnote13
The promotion, acting appointment and lateral movement rates are at their highest in 9 years (since fiscal year 2013 to 2014). Since then, the internal promotion rate rose from 5.1% to 13.0%.
Internal mobility rates, by fiscal year - Text version
| 2018 to 2019 | 2019 to 2020 | 2020 to 2021 | 2021 to 2022 | 2022 to 2023 | |
|---|---|---|---|---|---|
| Promotions | 12.5% | 12.6% | 10.9% | 12.3% | 13.0% |
| Acting appointments | 7.6% | 8.5% | 9.0% | 10.6% | 11.4% |
| Lateral movements | 11.7% | 11.5% | 10.6% | 12.1% | 12.5% |
Leveraging technology to enhance internal mobility
Last fiscal year, Statistics Canada launched an internal job platform, the Talent Bank, aimed at fostering employees’ professional development through experiential learning activities. The platform enables participants to showcase their skills and learning preferences to identify career advancement opportunities aligned with their goals.
To aid managers in identifying suitable candidates from the Talent Bank, a user-friendly “Talent Finder Tool” was developed. This Cloud-hosted application offers diverse search options, simplifying candidate discovery and capturing data to assess key metrics for workforce analysis and better understanding of business and human resources needs.
Priority entitlements and veteran hiring
In the federal public service, people with priority entitlements are appointed ahead of others to vacant positions if they meet the essential merit criteria and conditions of employment.Endnote14
People with priority entitlements are a valuable talent pool for hiring managers. As well, priority placements support public servants experiencing significant life changes, such as being laid off or returning from extended leave. They also help medically released Canadian Armed Forces veterans and medically discharged members of the Royal Canadian Mounted Police.
This year, there were 1 229 people with a priority entitlement, a 7% decline compared to the previous year. There were 385 appointments of people with priority entitlements, a 21% decrease compared to the previous year. Notably, 110 veterans with priority entitlements were appointed, reflecting a 28% decrease from the previous year.
Supporting people with priority entitlements
The Priority Career Hub supports a positive job search experience for people with priority entitlements. The hub provides:
- résumé-writing tools and resources
- tips for preparing for interviews
- links to job opportunities on jobs.gc.ca
- access to mental health and wellness resources
| Provision type | Number of appointments | Year-over-year change in appointments |
|---|---|---|
| Priority entitlement | 110 | -28.1% |
| Mobility | 86 | -6.5% |
| Preference | 45 | -47.1% |
| Total | 241 | -27.0% |
This year, there were 45 appointments under the preference provision and 86 appointments under the mobility provision of the Public Service Employment Act.Endnote15
Since the coming into force of the Veterans Hiring Act on July 1, 2015, which amended the Public Service Employment Act,there have been 685 appointments under the preference provision, 949 hires under the mobility provision and 1 339 appointments under the priority entitlement provision for veterans.
Recruiting a diverse and representative public service
We continued to work with departments and agencies to increase the representation of employment equity group members in the federal public service by collaborating in recruitment, and by addressing barriers to employment, career development and retention, while promoting inclusion and accessibility.
Focused national recruitment campaigns
This year we ran recruitment campaigns for students and other candidates focused on hiring persons with disabilities and Indigenous Peoples.
As part of the Accessibility Strategy for the Federal Public Service, we partnered with functional communities to launch recruitment campaigns for persons with disabilities, including for positions in these areas:
- policy and data analysts
- digital careers
- senior financial analysts
- biological sciences
We also administered the Indigenous Career Pathways tool for a second year, matching Indigenous job seekers and hiring managers. This year, the tool onboarded new Indigenous graduates and pre-qualified candidates, many of whom then found jobs in the public service.
Finally, in collaboration with Pilimmaksaivik, we operate the Inuksugait Resume Inventory to support hiring Nunavut Inuit to federal public service positions across the territory. This fiscal year, federal departments and agencies hired 5 Inuit candidates from this inventory.
Measuring progress
To inform decisions across the hiring system and support collective accountability, the Public Service Commission of Canada updated a series of studies related to employment equity:
- the Employment Equity Promotion Rate Study 3-year update looks at relative promotion rates for women, members of visible minorities, persons with disabilities and Indigenous Peoples
- Non-advertised Appointments by Employment Equity Group looks at trends in the representation of employment equity groups in non-advertised appointments
- Citizenship of Applicants and External Appointments examines how frequently non-citizens and permanent residents applied for, and were appointed to, jobs advertised to the public
Public Service Employment Act changes
The Public Service Employment Act sets out the authorities and rules for public service hiring. In 2021, the federal government introduced changes to the act to strengthen diversity and inclusion, and to remove or mitigate biases and barriers faced by equity-seeking groups.Endnote16
Expanded audit authority
One of the changes gave the Public Service Commission of Canada a new audit authority to look at biases and barriers in hiring. We launched 2 audits under this new authority this year:
- Audit on acting appointments: Acting appointments (temporary appointments to a higher level) provide valuable experience to employees seeking promotion. The audit will explore whether employment equity groups are proportionately represented in these appointments. It will also look at systems and practices to promote access to these opportunities.
- Audit on the pre-assessment phase of the hiring process: This audit will explore whether there are biases or barriers that disadvantage people in equity-seeking groups in job advertisements, in the qualifications identified for the job and in the questions that assess candidates on their experience.
Expanded investigative authority
Another change expands the scope of investigations to include errors, omissions or improper conduct resulting from biases and barriers that disadvantage people in equity-seeking groups in hiring processes. We helped departments prepare for these changes by:
- consulting with employee networks, bargaining agents and other stakeholders on key aspects of the process, such as corrective actions
- establishing practices and protocols for these types of investigations
- delivering information sessions and training
New requirement to evaluate assessment methods for biases and barriers
A new requirement for hiring managers to evaluate assessment methods for biases and barriers, and to take steps to remove or mitigate them, came into force in July 2023.
This change shifts hiring to an “inclusive by design” approach: hiring managers must consider ways to proactively address potential biases and barriers that disadvantage equity-seeking groups at each assessment stage, rather than reacting and adjusting once the process has begun.
We created a guide and tools for hiring managers to help them identify and address biases and barriers in interviews, written exams and reference checks. The guide and tools were developed through extensive consultations, including focus groups with managers, human resources specialists and employees from equity-seeking groups.
Permanent resident hires and applicants
One of the 2021 amendments to the Public Service Employment Act provided permanent residents with the same level of appointment preference as Canadian citizens for advertised job processes open to the public. Since the change was implemented, the federal public service hired 1 823 permanent residents, an increase over the previous year (776 hires).
This fiscal year, the share of applicants who were permanent residents (14.1%) increased by 3.1 percentage points over the previous year.
A modernized staffing system
Second language evaluation
This year, we launched new online unsupervised second language tests on the new Candidate Assessment Tool platform.
The platform enables departments and agencies to rapidly administer online tests of reading comprehension and written expression in a more inclusive and accessible manner. By using universal design principles, it reduces the need for people to request accommodation and simplifies providing accommodation measures. For example, candidates can select font size and the platform makes it easier to allocate extra time for the test session. As of March 31, 2023, over 50 000 tests were administered using the new platform.
We also began piloting a new approach that simplifies the assessment accommodation process and makes our second language tests more accessible. Once it is fully implemented, we expect this new approach to provide better services to human resources partners and to candidates requiring accommodation. These improvements have already significantly reduced processing times for the increased number of accommodation requests we received this fiscal year: from 97 days to 10 days (93% of the time).
We will continue to improve processes and tools to provide assessments and accommodation options that require fewer requests by human resources clients and candidates.
Innovation through analysis
In 2022, the Canada Border Services Agency analyzed 351 human resources professionals appointments made between April 1, 2020, and July 1, 2022.
The analysis helped the agency close the human resources skills gap, by identifying the skills they already have and providing clarity on the competencies and qualifications they need to meet current and future demands. This will help them deliver modern human resources products and services to their clients.
GC Jobs transformation
In the past fiscal year, we continued to explore a potential digital recruitment solution that meets the needs of job seekers, hiring managers and human resources professionals. This included designing a prototype and testing a solution with 10 departments, with diverse representation from employment equity groups.
This work shed light on gaps and on the changes we need to make to take advantage of best practices and offer a smooth and intuitive experience for job seekers, hiring managers and human resources professionals. It also clarified broader considerations for implementing a digital recruitment solution, including integration requirements with other human resources systems.
Safeguarding the staffing system
The Public Service Commission of Canada is mandated to promote and safeguard a merit-based, representative and non-partisan public service that serves all Canadians. Under this mandate, we conduct several oversight activities, including audits, surveys, studies and investigations.
Investigations
We investigate staffing irregularities and allegations of improper political activities by federal public service employees.
Data and trends
This fiscal year, we received 695 requests for investigations. Of these requests, 275 fell under our mandate.
These included:
- 22 requests by deputy heads to conduct investigations on their behalf, relating to errors, omissions or improper conduct in internal appointment processes
- 158 requests related to errors, omissions or improper conduct, or to merit not being met, in external appointment processes
- 71 requests related to fraud
- 24 requests related to improper political activities of public servants
We did not receive any investigation requests related to political influence in appointments.
Count of founded investigation cases, by fiscal year - Text version
| 2018 to 2019 | 2019 to 2020 | 2020 to 2021 | 2021 to 2022 | 2022 to 2023 | |
|---|---|---|---|---|---|
| Fraud | 17 | 19 | 9 | 10 | 14 |
| Error, omission or improper conduct in an external appointment process | 4 | 6 | 13 | 8 | 66 |
| Improper political activities | 7 | 20 | 7 | 16 | 29 |
This fiscal year, we completed 173 investigation files, a 188% increase over the previous year. We post some investigations summaries online to help Canadians understand the scope of our investigations and what constitutes a breach of the Public Service Employment Act.
Non-partisanship and political activities
Before seeking nomination as, or being, a candidate at the municipal, territorial, provincial or federal level, public servants must first request and obtain the permission of the Public Service Commission of Canada.
When deciding whether these activities could impair or be perceived as impairing an employee’s ability to perform their duties in a politically impartial manner, we consider factors such as:
- the level of the election
- the employee’s duties
- the level and visibility of their position
All permission requests received in this fiscal year were granted, as any risks to political impartiality were addressed by imposing mitigating conditions.
| Level | Number of elections where a request for candidacy permission was received | Number of candidacy permissions granted |
|---|---|---|
| Municipal | 115 | 96* |
| Provincial and territorial | 24 | 21** |
| Federal | 3 | 1*** |
| Total | 142 | 118 |
*At the municipal level, there were 18 “no decisions” for various reasons (withdrawal, acclamation before the decision, appointment process, timeliness), and 1 request carried forward to the next year.
** At the provincial and territorial level, there were 3 “no decisions” for various reasons (withdrawal, acclamation before the decision, appointment process, timeliness).
*** At the federal level, 2 candidacy permissions were carried forward to the following fiscal year.
We also support employees in understanding their rights and responsibilities related to political activities:
- we responded to almost 200 inquiries from public service employees, departments and agencies and members of the public on public servants’ legal rights and obligations regarding political activities.
- we held outreach sessions for over 900 participants
Looking forward
This coming year, the Public Service Commission of Canada will work with departments and agencies to implement the remaining amendments to the Public Service Employment Act. Adapting to these changes and creating the right conditions for success will take significant effort.
We will prioritize modernizing our programs and services to ensure we can support departments and agencies as they adapt to the evolving staffing environment.
Digital transformation will be a core part of our modernization efforts. We’ll look for ways to improve processes and our testing and accommodation services for hiring managers and human resources specialists, as well as for people applying to public service jobs. We’ll also continue to ensure our platforms are inclusive, accessible and user-friendly, and that they support increased data collection and analysis.
We will conduct another system-wide staffing audit to shed light on areas of relative strength and weakness in public service staffing, so that we can address any risks to the integrity of the staffing system.
We will continue to improve, innovate and work with departments and agencies to achieve our shared vision of a modern, diverse, inclusive and high-performing public service.
Annex 1: Employment equity group applicants to advertised processes and hires, compared to workforce availability
Indigenous Peoples: applicants and hires to external advertised processes, compared to workforce availability, by fiscal year - Text version
| 2017 to 2018 | 2018 to 2019 | 2019 to 2020 | 2020 to 2021 | 2021 to 2022 | 2022 to 2023 | |
|---|---|---|---|---|---|---|
| Applicants | 3.3% | 3.0% | 3.2% | 2.9% | 3.2% | 3.0% |
| Hires | 4.0% | 4.1% | 4.0% | 3.8% | 4.2% | |
| Workforce availability | 3.4% | 4.0% | 4.0% | 4.0% | 3.8% |
| Subgroup | Applicants to external advertised processes, 2021 to 2022 |
Hires, 2021 to 2022 |
Applicants to external advertised processes, 2022 to 2023 |
|---|---|---|---|
| Inuit | 4.5% | 3.7% | 5.0% |
| Métis | 40.8% | 41.3% | 39.2% |
| North American Indian / First Nation | 46.8% | 45.7% | 47.2% |
| Other | 8.0% | 9.8% | 8.5% |
Note: Some proportions in this table differ from numbers reported in previous versions of the Annual Report due to a change in the denominator used in the calculations.
Persons with disabilities: applicants and hires to advertised processes, compared to workforce availability, by fiscal year - Text version
| 2017 to 2018 | 2018 to 2019 | 2019 to 2020 | 2020 to 2021 | 2021 to 2022 | 2022 to 2023 | |
|---|---|---|---|---|---|---|
| Applicants | 2.9% | 2.7% | 3.0% | 3.3% | 4.8% | 5.1% |
| Hires | 3.6% | 3.7% | 3.9% | 4.4% | 5.5% | |
| Workforce availability | 4.4% | 9.0% | 9.0% | 9.0% | 9.1% |
| Subgroup | Applicants to external advertised processes, 2021 to 2022 |
Hires, 2021 to 2022 | Applicants to external advertised processes, 2022 to 2023 |
|---|---|---|---|
| Blind or visual impairment | 5.3% | 4.6% | 4.8% |
| Coordination or dexterity | 4.5% | 5.0% | 4.3% |
| Deaf or hard of hearing | 8.6% | 10.4% | 8.2% |
| Mobility | 13.5% | 12.4% | 13.7% |
| Other disability | 74.8% | 76.2% | 76.8% |
| Speech impairment | 1.9% | 2.3% | 1.8% |
Note: Some proportions in this table differ from numbers reported in previous versions of the Annual Report due to a change in the denominator used in the calculations.
Members of visible minorities: applicants and hires to advertised processes, compared to workforce availability, by fiscal year - Text version
| 2017 to 2018 | 2018 to 2019 | 2019 to 2020 | 2020 to 2021 | 2021 to 2022 | 2022 to 2023 | |
|---|---|---|---|---|---|---|
| Applicants | 22.2% | 22.3% | 24.3% | 25.0% | 29.4% | 30.6% |
| Hires | 17.7% | 19.3% | 21.3% | 21.3% | 23.2% | |
| Workforce availability | 13.0% | 15.3% | 15.3% | 15.3% | 17.2% |
| Visible minority subgroup | Applicants to external advertised processes, 2021 to 2022 |
Hires, 2021 to 2022 |
Applicants to external advertised processes, 2022 to 2023 |
|---|---|---|---|
| Black | 27.6% | 24.2% | 27.5% |
| Chinese | 10.8% | 12.3% | 10.5% |
| Filipino | 5.0% | 4.3% | 4.7% |
| Japanese | 0.5% | 0.4% | 0.4% |
| Korean | 1.6% | 1.7% | 1.4% |
| Non-white Latin American | 5.3% | 5.3% | 4.9% |
| Non-white West Asian, North African or Arab | 12.5% | 11.1% | 11.8% |
| Person of mixed origin | 5.3% | 9.3% | 4.8% |
| South Asian / East Indian | 26.8% | 20.6% | 29.9% |
| Southeast Asian | 3.1% | 4.0% | 2.9% |
| Other visible minority | 8.0% | 6.8% | 7.3% |
Note: Some proportions in this table differ from numbers reported in previous versions of the Annual Report due to a change in the denominator used in the calculations.
Women: applicants and hires to advertised processes, compared to workforce availability, by fiscal year - Text version
| 2017 to 2018 | 2018 to 2019 | 2019 to 2020 | 2020 to 2021 | 2021 to 2022 | 2022 to 2023 | |
|---|---|---|---|---|---|---|
| Applicants | 53.7% | 55.0% | 55.3% | 57.4% | 57.2% | 55.6% |
| Hires | 58.7% | 56.5% | 58.3% | 60.2% | 60.1% | |
| Workforce availability | 52.5% | 52.7% | 52.7% | 52.7% | 53.3% |
Annex 2: Geographical distribution of public service hires and Public Service Employment Act population
This map shows the geographical distribution of:
- hires that happened during fiscal year 2022 to 2023
- the population of people working for the federal public service who were appointed subject to the Public Service Employment Act as of March 31, 2023
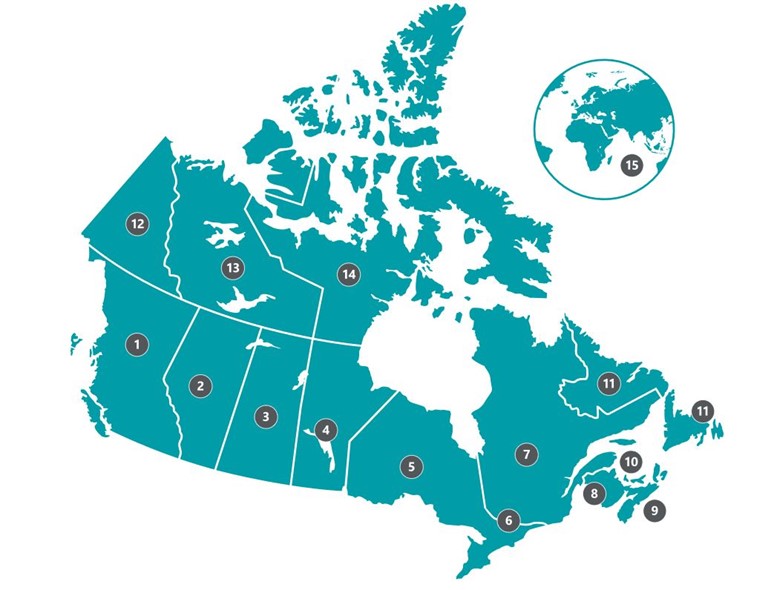
| Regions | Hires | Population as of March 31, 2023 |
|---|---|---|
| 1. British Columbia | 4 946 | 21 539 |
| 2. Alberta | 3 263 | 13 908 |
| 3. Saskatchewan | 1 224 | 5 526 |
| 4. Manitoba | 1 967 | 8 531 |
| 5. Ontario (except NCR) | 8 439 | 33 037 |
| 6. National Capital Region (NCR) | 34 380 | 130 611 |
| 7. Quebec (except NCR) | 7 830 | 28 841 |
| 8. New Brunswick | 2 705 | 10 863 |
| 9. Nova Scotia | 3 037 | 11 237 |
| 10. Prince Edward Island | 504 | 2 548 |
| 11. Newfoundland and Labrador | 986 | 4 479 |
| 12. Yukon | 108 | 390 |
| 13. Northwest Territories | 119 | 495 |
| 14. Nunavut | 70 | 300 |
| 15. International | 86 | 1 550 |
| Unknown | 1 536 | 364 |
Annex 3: Employment equity group non-advertised appointments
Non-advertised appointments in the charts in this annex include external hires, promotions, and acting appointments of 4 months or more.
Percentage of non-advertised appointments for people who self-identified as Indigenous Peoples compared to workforce availability, by fiscal year - Text version
| 2017 to 2018 | 2018 to 2019 | 2019 to 2020 | 2020 to 2021 | 2021 to 2022 | |
|---|---|---|---|---|---|
| Indigenous Peoples | 5.1% | 5.4% | 4.9% | 4.5% | 5.1% |
| Workforce availability | 3.4% | 4.0% | 4.0% | 4.0% | 3.8% |
Percentage of non-advertised appointments for people who self-identified as persons with disabilities compared to workforce availability, by fiscal year - Text version
| 2017 to 2018 | 2018 to 2019 | 2019 to 2020 | 2020 to 2021 | 2021 to 2022 | |
|---|---|---|---|---|---|
| Persons with disabilities | 4.1% | 4.2% | 4.3% | 4.6% | 5.7% |
| Workforce availability | 4.4% | 9.0% | 9.0% | 9.0% | 9.1% |
Percentage of non-advertised appointments for people who self-identified as members of visible minorities compared to workforce availability, by fiscal year - Text version
| 2017 to 2018 | 2018 to 2019 | 2019 to 2020 | 2020 to 2021 | 2021 to 2022 | |
|---|---|---|---|---|---|
| Members of visible minorities | 17.0% | 18.0% | 19.6% | 21.0% | 22.9% |
| Workforce availability | 13.0% | 15.3% | 15.3% | 15.3% | 17.2% |
Percentage of non-advertised appointments for people who self-identified as women compared to workforce availability, by fiscal year - Text version
| 2017 to 2018 | 2018 to 2019 | 2019 to 2020 | 2020 to 2021 | 2021 to 2022 | |
|---|---|---|---|---|---|
| Women | 61.4% | 61.8% | 63.3% | 62.1% | 64.2% |
| Workforce availability | 52.5% | 52.7% | 52.7% | 52.7% | 53.3% |
General note
Aussi disponible en français sous le titre : Rapport annuel 2022 à 2023.
Information contained in this publication or product may be reproduced, in part or in whole, and by any means, for personal or public non-commercial purposes without charge or further permission, unless otherwise specified. Commercial reproduction and distribution are prohibited except with written permission from the Public Service Commission of Canada.
For more information, contact
Public Service Commission of Canada
22 Eddy Street
Gatineau (Quebec) K1A 0M7
Email: cfp.infocom.psc@cfp-psc.gc.ca
Website of publisher: https://www.canada.ca/en/public-service-commission.html
© His Majesty the King in Right of Canada, as represented by the President of the Public Service Commission of Canada, 2023.
Cat. No. SC1E-PDF (Electronic PDF, English)
ISSN 1912-0842
Cat. No. SC1F-PDF (Electronic PDF, French)
ISSN 1912-0850

Page details
- Date modified: