
Section II: Expenditure overview
Official title: Employment and Social Development Canada 2015–2016 Departmental Performance Report
On this page
Actual expenditures
Budgetary financial resources (dollars)
2015–16 Main Estimates* |
2015–16 Planned Spending |
2015–16 Total Authorities Available for Use |
2015–16 Actual Spending (authorities used) |
2015–16 Difference |
|---|---|---|---|---|
54,265,536,116 |
116,790,417,713 |
123,042,060,755 |
122,843,712,094 |
6,053,294,381 |
* Employment Insurance and Canada Pension Plan benefits are excluded from the Department’s Main Estimates but included in Planned Spending, in the Total Authorities Available for Use and in the Actual Spending.
The difference between planned spending and actual spending is mainly attributable to the Universal Child Care Benefit ($5,907.4 million) and to Employment Insurance (EI) benefits ($1,288.3 million) being higher than planned spending 2015–16. These underestimations were partly offset by overestimations of both the OAS benefit payments ($-587.7 million) and the CPP benefit payments ($-879.9 million) as part of the planning process in 2015–16.
Human Resources (full-time equivalents – FTEs)
2015–16 Planned |
2015–16 Actual |
2015–16 Difference |
|---|---|---|
20,584 |
21,010 |
426 |
Budgetary performance summary
Programs and Internal Services |
2015–16 Main Estimates |
2015–16 Planned Spending |
2016–17 Planned Spending*** |
2017–18 Planned Spending |
2015–16 Total Authorities Available for Use |
2015–16 Actual Spending (authorities used) |
2014–15 Actual Spending (authorities used)*** |
2013–14 Actual Spending (authorities used)*** |
|---|---|---|---|---|---|---|---|---|
Strategic outcome 1: Government-wide service excellence |
||||||||
Program 1.1: |
63,199,999 |
63,199,999 |
59,958,885 |
59,958,885 |
56,681,863 |
55,566,034 |
55,744,363 |
56,155,311 |
Program 1.2: |
160,024,593 |
160,024,593 |
164,172,167 |
1,691,223 |
138,699,831 |
133,440,054 |
157,236,664 |
114,011,116 |
Strategic outcome 2: A skilled, adaptable and inclusive labour force and an efficient labour market |
||||||||
Program 2.1: Skills and Employment |
2,384,959,874 |
20,563,499,451 |
22,187,663,325 |
22,318,244,911 |
21,940,361,304 |
21,794,776,029 |
20,440,879,133 |
19,798,499,077 |
Program 2.2: Learning |
2,391,384,094 |
2,391,384,094 |
2,479,065,886 |
2,616,586,101 |
2,494,776,595 |
2,489,519,001 |
2,555,842,600 |
2,194,839,183 |
Strategic outcome 3: Safe, fair and productive workplaces and cooperative workplace relations |
||||||||
Program 3.1: Labour |
289,750,470 |
289,750,470 |
276,475,615 |
276,120,673 |
252,133,391 |
251,871,310 |
248,564,407 |
269,144,868 |
Strategic outcome 4: Income security, access to opportunities and well-being for individuals, families and communities |
||||||||
Program 4.1: Income Security |
46,817,095,262 |
88,450,510,738 |
92,909,168,672 |
97,980,126,626 |
87,045,040,493 |
87,042,524,292 |
83,569,177,338 |
79,787,670,175 |
Program 4.2: Social Development |
3,081,658,183 |
3,081,658,183 |
7,933,212,853 |
8,002,511,370 |
8,985,948,747 |
8,961,100,867 |
2,940,137,196 |
2,992,893,293 |
Support to achieve all Strategic Outcomes |
||||||||
Internal Services |
906,173,311 |
906,173,311 |
860,183,573 |
798,068,146 |
947,436,515 |
892,479,726 |
899,807,522 |
949,352,111 |
Other costs** |
- no data |
884,216,874 |
1,208,650,163 |
1,387,153,829 |
1,180,982,016 |
1,222,434,781 |
1,064,277,814 |
767,901,937 |
Adjustment*** |
no data | no data | no data | no data | no data | no data | no data | no data |
Total |
56,094,245,786 |
116,790,417,713 |
128,078,551,139 |
133,440,461,764 |
123,042,060,755 |
122,843,712,094 |
111,931,667,037 |
106,930,467,071 |
Vote netted revenues |
(1,828,709,670) |
no data | no data | no data | no data | no data | no data | no data |
Total at Net |
54,265,536,116 |
no data | no data | no data | no data | no data | no data | no data |
*Budgetary expenditures include respendable revenues since respendable revenues are mainly related to administrative costs charged to the Canada Pension Plan and Employment Insurance Operating Account which are part of ESDC operations.
**Other costs include administrative costs of other government departments charged to the Employment Insurance Operating Account and the Canada Pension Plan. It also includes Employment Insurance doubtful accounts and recoveries from other government departments, mainly related to Worker's Compensation Costs and Passport Services delivery.
***Actuals have been reinstated to be presented as per the Program Alignment Architecture 2015–16.
Budgetary performance summary for programs and internal services
The overall increase in spending of $26.5 billion from 2013–14 actual spending to 2017–18 planned spending can mainly be explained by increases to Canada Pension Plan (CPP) and Old Age Security benefits caused by the aging population and changes in the average monthly benefits. It is also attributable to the Universal Child Care Benefit (UCCB) enhancement which became effective in January 2015.
The significant reduction in planned spending from 2016–17 to 2017–18 for Delivery of Services for Other Government of Canada Programs is mainly explained by the need to renew agreements on passport services funding in 2016–17. The Department will have to request funding for 2017–18 and future years. As for the variance between planned spending for 2015–16 and actual spending for 2015–16, the difference is mainly due to the contingency reserve that was created for unexpected circumstances and not used. The unused funds remain in the non-lapsing Passport Revolving Fund.
Under Skills and Employment, the difference in financial resources from the 2015–16 planned spending to 2015–16 actual spending is mainly due to higher Employment Insurance benefits than originally forecasted due to increased unemployment.
Under the Learning program, the overall increase in spending from 2013–14 actual spending to 2017–18 planned spending is a result of increases to the Canada Loans and Grants for Students and Apprentices Program, including the Canada Education Savings Grant and the Canada Learning Bond.
The variances related to Labour are mostly attributable to changes in Wage Earner Protection Program and Federal Workers’ Compensation payments.
The overall increase under Income Security can be explained by increases in the number of beneficiaries and the average monthly benefits payments for Old Age Security ($9.3 billion) and the Canada Pension Plan ($8.7 billion).
In Social Development, the significant increase between Actual Spending 2013–14 and 2015–16 is mainly the result of the Budget 2015 enhancements to the Universal Child Care Benefit program that became effective in January 2015. The same reason applies for the variances that exist when comparing planned spending 2015–16 to actual spending 2015–16 as well as for the overall trend. Future plans were adjusted to reflect the impact of the new enhanced Universal Child Care Benefit.
The overall decrease for Internal Services can be mainly explained by: reductions in administrative overhead; improved operational efficiencies for better use of resources in the areas of human resources, finance and technology; and consolidation of research and policy functions to better align with government priorities.
The variance of $158.2 million in actual spending under Other Costs from fiscal year 2014–15 to 2015–16 is mainly related to increased charges to the CPP from Other Government Departments as well as an increase in Employment Insurance doubtful accounts.
Departmental spending trend
ESDC expenditures on programs and services total $122.8 billion, of which $117.1 billion, or more than 95 percent, directly benefits Canadians through Employment Insurance (EI), the Canada Pension Plan (CPP), Old Age Security (OAS), the Universal Child Care Benefit (UCCB) and other statutory transfer payment programs. Departmental expenditures were $1.6 billion in voted grants and contributions and $2.0 billion for Part II of the Employment Insurance Act.
Consolidated total: $122,843.7 M
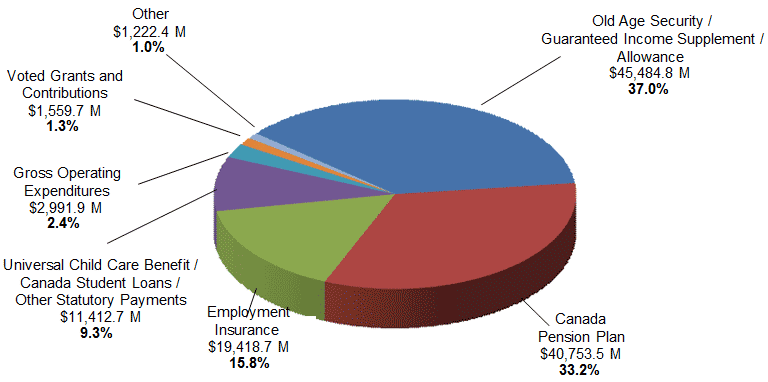
Text description of Employment and Social Development Canada 2014–15 Consolidated planned spending by category
Category |
2015–16 Actual Spending |
|
|---|---|---|
(in millions of dollars) |
Percentage |
|
Old Age Security / Guaranteed Income Supplement / Allowance |
45,484.8 |
37.0% |
Canada Pension Plan (CPP) |
40,753.5 |
33.2% |
Employment Insurance (EI) |
19,418.7 |
15.8% |
Universal Child Care / Canada Student Loans / Other Statutory Payments |
11,412.7 |
9.3% |
Gross Operating Expenditures |
2,991.9 |
2.4% |
Voted Grants and Contributions |
1,559.7 |
1.3% |
Other - Passport Services, Workers' Compensation and EI/CPP charges |
1,222.4 |
1.0% |
Consolidated Total |
122,843.7 |
100.0% |
Employment and Social Development Canada - Gross expenditures ($ millions)
Budgetary |
Sub-total |
Total |
|---|---|---|
Net Operating Costs |
1,166.0 |
|
Add Recoveries in relation to: |
||
Canada Pension Plan |
285.1 |
|
Employment Insurance Operating Account |
1,261.7 |
|
Workers' Compensation |
127.1 |
|
Passport Services |
145.2 |
|
Other |
6.8 |
1,825.9 |
Gross Operating Costs |
2,991.9 |
|
Voted Grants and Contributions |
1,559.7 |
|
Total Gross Expenditures |
4,551.6 | |
Other – Workers' Compensation and EI/CPP Charges and Recoveries |
1,222.4 |
Statutory transfer payments ($ millions)
Grants and Contributions: |
Sub-total |
Total |
Old Age Security |
35,050.5 |
|
Guaranteed Income Supplement |
9,921.7 |
|
Allowance |
512.6 |
|
Other Statutory Payments: |
||
Universal Child Care Benefit |
8,758.8 |
|
Canada Student Loans |
1,232.5 |
|
Canada Education Savings Grant |
820.6 |
|
Canada Disability Savings Program |
433.4 |
|
Canada Learning Bond |
118.9 |
|
Wage Earner Protection Program |
23.4 |
11,387.6 |
Sub-Total |
56,872.4 |
|
Canada Pension Plan Benefits |
40,753.5 |
|
Employment Insurance Benefits |
||
Part I |
17,368.3 |
|
Part II |
2,050.4 |
19,418.7 |
Other Specified Purpose Accounts |
25.1* |
|
Total Statutory Transfer Payments |
117,069.7 |
* This amount includes payments related to Government Annuities Account and the Civil Service Insurance Fund.
The figure below illustrates ESDC’s spending trend from 2013–14 to 2018–19. In the 2015–16 fiscal year, the Department spent $122.8 billion in achieving its expected results. Planned spending presented from fiscal year 2016–17 to 2018–19 corresponds to the forecasted planned spending presented in the 2016–17 Report on Plans and Priorities.
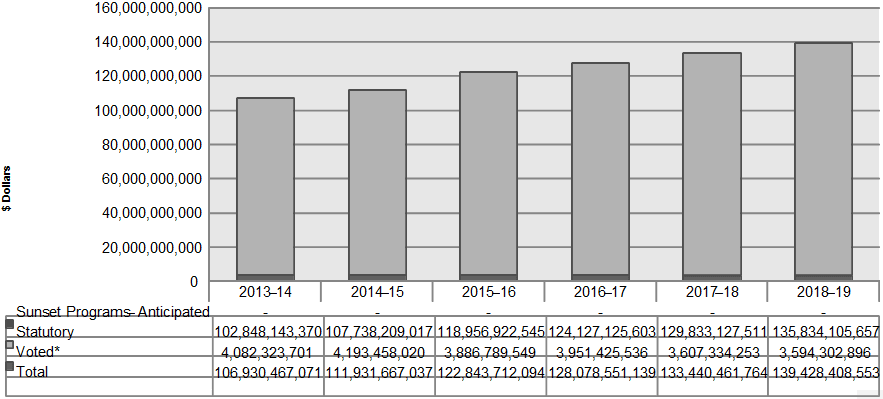
Text description of Departmental spending trend graph
Fiscal year |
Voted* |
Statutory |
Sunset Programs – Anticipated |
Total |
|---|---|---|---|---|
2013–14 |
4,082,323,701 |
102,848,143,370 |
- no data |
106,930,467,071 |
2014–15 |
4,193,458,020 |
107,738,209,017 |
- no data |
111,931,667,037 |
2015–16 |
3,886,789,549 |
118,956,922,545 |
- no data |
122,843,712,094 |
2016–17 |
3,951,425,536 |
124,127,125,603 |
- no data |
128,078,551,139 |
2017–18 |
3,607,334,253 |
129,833,127,511 |
- no data |
133,440,461,764 |
2018–19 |
3,594,302,896 |
135,834,105,657 |
- no data |
139,428,408,553 |
*Voted expenditures include vote-netted revenues.
In 2014–15, the actual expenditures were $5.0 billion or 4.7 percent higher than 2013–14. This increase can mainly be explained by an increase of $2.3 billion for OAS/GIS payments and $1.4 billion for CPP benefit payments, caused by the aging population and changes in average monthly benefits. It is also the result of $0.7 billion of increased EI benefits mainly due to an increase in the average weekly benefit paid for EI benefits, which was partially offset by a decrease in the unemployment rate. The average monthly rate for the OAS basic pension was $531.75; $9.59 more than the average rate from 2013–14. There was also an increase for the average number of beneficiaries from 5.3 million to 5.5 million for fiscal year 2014–15.
In 2015–16, the actual expenditures were $10.9 billion or 9.7 percent higher than 2014–15. This can mainly be explained by an increase of $6.0 billion in the UCCB. This $6.0 billion increase results from the adoption of the enhanced benefit that became effective in January 2015. The remaining $4.9 billion increase is explained by increases to OAS/GIS payments ($1.4 billion) and to CPP benefits ($2.0 billion). These are mainly caused by the aging population and the changes in average monthly benefits. The average monthly rate for the OAS basic pension was $540.63, $8.88 more than the average rate from 2014–15. There was also an increase in the average number of beneficiaries from 5.5 million to 5.6 million for fiscal year 2015–16. Another component responsible for the variance in spending between the two years is the increase in EI benefits paid ($1.4 billion). The reason for this increase is a greater number of eligible individuals establishing claims for EI benefits than in 2014–15 and higher average benefit rates.
Expenditures by vote
For information on Employment and Social Development Canada’s organizational voted and statutory expenditures, consult the Public Accounts of Canada 2016.Footnote 5
Alignment of spending with the Whole-of-Government Framework
Programs |
Spending Areas |
Government of Canada Outcomes |
2015–16 Actual Spending |
|---|---|---|---|
Program 1.1: |
Government Affairs |
A transparent, accountable and responsive federal government |
55,566,034 |
Program 1.2: Delivery of |
Government Affairs |
A transparent, accountable and responsive federal government |
133,440,054 |
Program 2.1: Skills and |
Economic Affairs |
Income security and employment for Canadians |
21,794,776,029 |
Program 2.2: Learning |
Economic Affairs |
An innovative and knowledge-based economy |
2,489,519,001 |
Program 3.1: Labour |
Economic Affairs |
A fair and secure marketplace |
251,871,310 |
Program 4.1: Income Security |
Economic Affairs |
Income security and employment for Canadians |
87,042,524,292 |
Program 4.2: Social |
Social Affairs |
A diverse society that promotes linguistic duality and social inclusion |
8,961,100,867 |
Spending Areas |
Total Planned Spending |
Total Actual Spending |
|---|---|---|
Economic Affairs |
111,695,144,753 |
111,578,690,632 |
Social Affairs |
3,081,658,183 |
8,961,100,867 |
Government Affairs |
223,224,592 |
189,006,088 |
Financial statements and financial statements highlights
Financial statement highlights
The financial highlights are intended to serve as a general overview of ESDC’s financial position and operations.
The following condensed consolidated financial statements are prepared in accordance with the Government’s accounting policies, which are based on Canadian public sector accounting standards and are therefore different from reporting on the use of authorities, reflected in Sections II and III of this report. Reconciliation between authorities used and the net cost of operations is set out in Note 3 of the Department’s consolidated financial statements.
These consolidated financial statements include the transactions of the EI Operating Account, a sub-entity under the control of ESDC. The accounts of this sub-entity have been consolidated with those of ESDC and all inter-organizational balances and transactions have been eliminated. The Canada Pension Plan (CPP) is excluded from ESDC’s reporting entity because changes to the CPP require the agreement of two-thirds of participating provinces and it is therefore not controlled by the Government.
The unaudited departmental financial statements can be found on ESDC’s website.Footnote 7
Financial Information |
2015–16 Planned Results* |
2015–16 Actual |
2014–15 Actual |
Difference (2015–16 actual minus 2015–16 planned) |
Difference (2015–16 actual minus 2014–15 actual) |
|---|---|---|---|---|---|
Total expenses |
74,803,819,611 |
80,006,506,641 |
73,217,126,794 |
5,202,687,030 |
6,789,379,847 |
Total revenues |
24,347,217,112 |
24,028,381,916 |
23,461,778,125 |
(318,835,196) |
566,603,791 |
Net cost of operations before government funding and transfers |
50,456,602,499 |
55,978,124,725 |
49,755,348,669 |
5,521,522,226 |
6,222,776,056 |
*The unaudited departmental future-oriented statement of operations can be found on ESDC’s website.Footnote 8
Expenses by major program activity
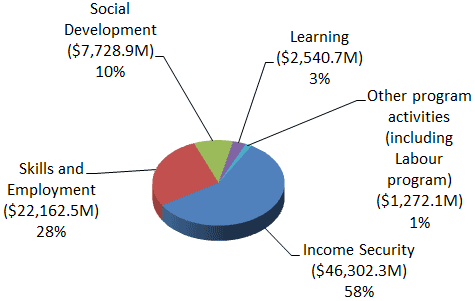
Text description of Expenses by major program activity chart
Program activities |
in dollars |
percentage |
|---|---|---|
Income Security |
46,302,293 |
57.87% |
Skills and Employment |
22,162,481 |
27.70% |
Social Development |
7,728,867 |
9.66% |
Learning ($2,540.7M) |
2,540,676 |
3.18% |
Other program activities (including Labour program) |
1,272,190 |
1.59% |
Total |
80,006,507 |
|
Actual over Planned
The 2015–16 expenses were $5,202.7 million higher than planned. The variance is mainly attributable to the enhancements to the UCCB program which were effective January 2015 and received parliamentary approval on June 23, 2015. In addition, EI benefits were higher than planned due to the higher than expected number of beneficiaries and to the higher average benefit rate.
Actual Year over Year
Total expenses for 2015–16 amounted to $80,006.5 million, an increase of $6,789.4 million over the previous year’s total expenses of $73,217.1 million. The increase in expenses is mostly attributable to:
- an increase of $3,596.1 million in Social Development expenses, mainly due to the enhancements to the UCCB program effective January 2015;
- an increase of $1,489.9 million in Skills and Employment expenses, mainly due to an increase in the average weekly benefit paid for EI regular and special benefits (including parental, maternity and sickness benefits), and an increase in the number of EI beneficiaries; and
- an increase of $1,489.5 million in Income Security expenses, mainly due to the increase in the eligible population for OAS caused by the growing aging population and the increase in the maximum monthly benefit amount.
Revenues by type
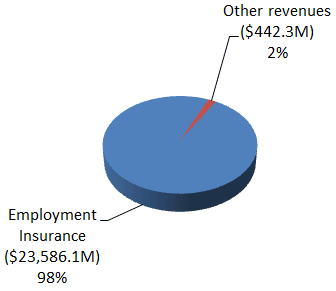
Text description of Revenues by type chart
Revenues |
in dollars |
percentage |
|---|---|---|
Employment Insurance |
23,586,111 |
98.16% |
Other revenues |
442,271 |
1.84% |
Total |
24,028,382 |
|
Actual over Planned
The 2015–16 revenues were $318.8 million lower than planned. The variance is mainly attributable to the total EI insurable earnings being lower than planned due to lower than expected growth in employment.
Actual Year over Year
Total revenues for 2015–16 amounted to $24,028.4 million, an increase of $566.6 million over the previous year's total revenues of $23,461.8 million. The majority of this increase can be explained by an increase in EI premiums related to employment, which went up by an average of 0.7% from 2014-15, as well as an increase in the maximum insurable earnings.
Financial Information |
2015–16 |
2014–15 |
Difference (2015–16 minus 2014–15) |
|---|---|---|---|
Total net financial assets |
19,224,961,665 |
18,242,951,865 |
982,009,800 |
Total net liabilities |
2,664,848,744 |
3,790,275,986 |
(1,125,427,242) |
Departmental net financial asset |
16,560,112,921 |
14,452,675,879 |
2,107,437,042 |
Total non-financial assets |
277,921,707 |
304,201,154 |
(26,279,447) |
Departmental net financial position |
16,838,034,628 |
14,756,877,033 |
2,081,157,595 |
Assets by type
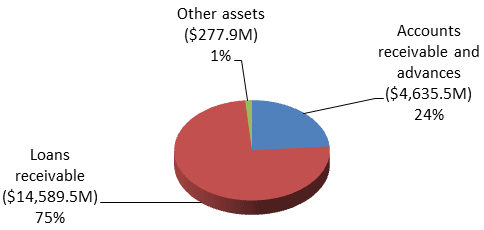
Text description of Assets by type chart
Assets |
in dollars |
percentage |
|---|---|---|
Accounts receivable and advances |
4,635,457 |
23.77% |
Loans receivable |
14,589,505 |
74.81% |
Other assets |
277,922 |
1.43% |
Total |
19,502,884 |
|
Total assets (including financial and non-financials assets) amounted to $19,502.9 million as at March 31, 2016, an increase of $955.7 million over the previous year's total assets of $18,547.2 million. The increase in assets is mainly attributable to:
- an increase of $703.1 million in the Canada Student Loans net balance mostly caused by an excess of new loans disbursed over the total amount of repayments received; and
- an increase of $278.9 million in accounts receivable and advances, mostly due to an increase in EI premiums receivable from Canada Revenue Agency (CRA) that is in line with the overall premiums revenue increase and an additional increase in the OAS and EI benefit repayments receivable from the CRA due to the increase in the number of beneficiaries who, upon income tax assessment by the CRA, have an assessed net income that exceeds the income recovery threshold.
Liabilities by type
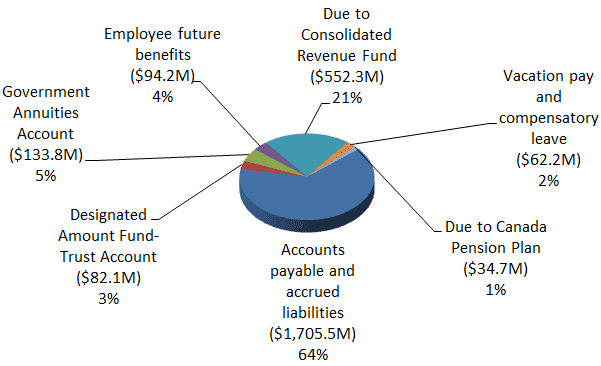
Text description of Liabilities by type chart
Liabilities |
in dollars |
percentage |
|---|---|---|
Accounts payable and accrued liabilities |
1,705,498 |
64.00% |
Designated Amount Fund-Trust Account |
82,151 |
3.08% |
Government Annuities Account |
133,820 |
5.02% |
Employee future benefits |
94,163 |
3.53% |
Due to Consolidated Revenue Fund |
552,326 |
20.73% |
Vacation pay and compensatory leave |
62,162 |
2.33% |
Due to Canada Pension Plan |
34,729 |
1.30% |
Total |
2,664,849 |
|
Total liabilities amounted to $2,664.8 million as at March 31, 2016, a decrease of $1,125.5 million over the previous year's total liabilities of $3,790.3 million. The decrease in liabilities is mainly due to the decrease of $1,155.2 million in the amount payable recorded as at March 31, 2015, related to the enhancements to the UCCB program which were effective January 2015 and received parliamentary approval on June 23, 2015. The remaining change in liabilities is due to timing of year-end payments for other liabilities.
Financial Statements
Refer to the complete Employment and Social Development Canada Financial Statements (Unaudited) for the Year Ended March 31, 2016,Footnote 9 which also includes an Annex to the Statement of Management Responsibility Including Internal Control Over Financial Reporting.