
Grouped Evaluation of Sport Canada Programs 2015-16 to 2019-20
Evaluation Services Directorate
October 25, 2021
On this page
- List of Tables
- List of acronyms and abbreviations
- Executive Summary
- 1. Introduction
- 2. Profile of SC Programs
- 3. Evaluation approach and methodology
- 4. Findings – Relevance
- 5. Findings – Effectiveness
- 6. Findings – Efficiency
- 7. Recommendations, management response and action plan
- Annex A – Logic Model for SC Programs (2011)
- Annex B – Evidence Matrix
- Annex C – Evaluation Methodology
- Annex D – Supplementary Tables
- Table D-1: Canada’s historic medal attainment at Olympic Games
- Table D-2: Canada’s historic medal attainment at Paralympic Games
- Table D-3: Canada’s 2006 to 2018 progression on the World Ranking Index – gold medals, all medals and top 8s (number and points) for winter, summer and combined
- Table D-4: planned versus actual spending and human resources
- Table D-5: performance of SC programs against service standards
- Annex E – References
List of Tables
- Table 1: SC target populations, stakeholders and delivery partners, by program
- Table 2: SC planned spending, by Vote and year, 2015-16 to 2019-20 ($)
- Table 3: SC actual spending, by Vote and year ($)
- Table 4: evaluation issues and questions
- Table 5: evaluation challenges and mitigation strategies
- Table 6: SSP funding by recipient type, 2015-16 to 2019-20 ($ thousands)
- Table 7: HP funding, 2015-16 to 2019-20, by recipient type ($ thousands)
- Table 8: level of importance of SSP funding to NSOs: “How important is SSP funding to your organization, for each of the following?”
- Table 9: number of doping control tests and anti-doping rules violations, by year
- Table 10: HP ISSE hosted events by NSOs, 2015-16 to 2019-20
- Table 11: HP ISSE applications and approvals, 2015-16 to 2019-20
- Table 12: Hosting Program’s contribution to participating in events in Canada – Q11: Thinking of the Canadian athletes, coaches and officials that your organization represents or interacts with, to what extent does the Hosting Program contribute to providing opportunities to participate in sport event in Canada, for each of the following groups?
- Table 13: progress of athletes through carding levels, by quadrennial
- Table 14: number of new cards awarded and average length of time at SR1 and SR2 levels, by year
- Table 15: recommendation 1 – action plan
- Table 16: recommendation 2 – action plan
- Table 17: recommendation 3 – action plan
- Table 18: evidence Matrix
Alternate format

Grouped Evaluation of Sport Canada Programs 2015-16 to 2019-20 [PDF version - 1.7 MB]
List of acronyms and abbreviations
- AAP
- Athlete Assistance Program
- AAPMIS
- Athlete Assistance Program Management Information System
- ASC
- Aboriginal Sport Circle
- CAC
- Coaching Association of Canada
- CADP
- Canadian Anti-Doping Program
- CCES
- Canadian Centre for Ethics in Sport
- CFLRI
- Canadian Fitness and Lifestyle Research Institute
- COC
- Canadian Olympic Committee
- COPSIN
- Canadian Olympic and Paralympic Sport Institute Network
- CPC
- Canadian Paralympic Committee
- CSC
- Canadian Sport Centre
- CSI
- Canadian Sport Institute
- CSP
- Canadian Sport Policy
- CWS
- Canadian Women & Sport
- DRR
- Departmental Results Report
- EBP
- Employee benefits and pensions
- ESD
- Evaluation Services Directorate
- FIFA
- Fédération Internationale de Football Association
- F-P/T
- Federal-Provincial/Territorial
- FTE
- Full-time equivalent
- GBA Plus
- Gender-based analysis plus
- GBV
- Gender-based violence
- GC
- Government of Canada
- GCIMS
- Grants and Contributions Information Management System
- GSS
- General Social Survey
- HP
- Hosting Program
- ILTDP
- Indigenous Long-Term Participant Development
- IMGAPPD
- International Major Games for Aboriginal Peoples and Persons with a Disability
- IMMG
- International Major Multi-Sport Games
- ISSE
- International Single Sport Event
- LTAD
- Long-Term Athlete Development
- MOU
- Memorandum of Understanding
- MSO
- Multisport Service Organization
- NAIG
- North American Indigenous Games
- NCCP
- National Coaching Certification Program
- NGO
- Non-governmental organization
- NSO
- National Sport Organization
- O&M
- Operations and maintenance
- OLMCs
- Official Language Minority Communities
- OSI
- Other Supporting Initiative
- OTP
- Own the Podium
- PASS
- Physical Activity, Sedentary Behaviour and Sleep (indicators)
- PCH
- Department of Canadian Heritage
- PHAC
- Public Health Agency of Canada
- PIP
- Performance Information Profile
- PMERS
- Performance Measurement, Evaluation and Risk Strategy
- PSO
- Provincial Sport Organization
- PTSO
- Provincial/Territorial Sport Organization
- SC
- Sport Canada
- SFAF
- Sport Funding and Accountability Framework
- SIRC
- Sport Information Research Centre
- SPARC
- Sport, Physical Activity and Recreation Council
- SPRI
- Sport Participation Research Initiative
- SSHRC
- Social Sciences and Humanities Research Council
- SSP
- Sport Support Program
- STATS
- Sport Tracking, Assessment, and Technical Statistics
- TB
- Treasury Board
- WADA
- World Anti-Doping Agency
Executive Summary
Program description
Sport Canada (SC) has three funding programs that focus on participation and exceling in sport. The Hosting Program (HP), the Sport Support Program (SSP), and the Athlete Assistance Program (AAP).
- The HP aims to enhance the development of sport excellence and the international profile of sport organizations by funding the hosting of international sport events in Canada and the hosting the Canada Games.
- The SSP is the primary funding vehicle for national level initiatives that have a direct impact on athletes and athlete development, and that provide children and youth with their first experience in sport.
- The AAP contributes to improve Canadian athlete performances at major international sporting events, enabling athletes to combine their sport and academic careers while training intensively in pursuit of world-class performances.
Evaluation approach and methodology
The evaluation was undertaken in accordance with the Departmental Evaluation Plan for 2019-20 to 2023-24, approved by the Deputy Minister, and covered a five-year period, from 2015-16 to 2019-20. The timeline for the delivery of the final report was delayed due to COVID-19.
The evaluation examined the core issues of relevance, effectiveness and efficiency. The methodology involved a review of the program’s administrative and performance data; a review of relevant documents; interviews with key stakeholders; six case studies; a survey with National Sport Organizations (NSOs); and a review of relevant literature.
Findings
Relevance
While SC’s programming appears to be designed appropriately to achieve the high performance objective of the Physical Activity and Sport Act, there are gaps in how it supports sport participation. SC devotes relatively little investment to promoting sport participation at the community (grassroots) level: about $11 million or about 7% of the SSP’s total funding of $157 million in 2018-19. SC is mainly focused on high performance sport while the Public Health Agency of Canada has the mandate for promoting physical activity. The Innovation Initiative component of the SSP is funding several interesting projects focused on promoting sport participation among under-represented groups.
SC funding is important for the existence and survival of the sport organizations it supports, particularly the smaller organizations. While the programming meets many financial needs, sports organizations are facing new and increased demands, including those related to emerging priorities and the COVID-19 pandemic.
The SC programming has made some progress in addressing such government priorities as gender equity, official languages, diversity and inclusion, reconciliation with Indigenous peoples, and accessibility. The evaluation found that several organizations are embracing the government’s objectives for gender equity in the sport system. However, the Report Card initiative (round one in 2019) gave generally low ratings in these areas and there was agreement among key informants that SC could do more to spur funded sport organizations to take action on gender equity, diversity and inclusion.
Effectiveness
Overall, the evaluation finds that the programming is achieving or contributing to most of its expected results. However, there are gaps in programming performance measurement that may impact the availability of clear data and reporting on all expected results.
Sport Support Program
SSP contributes to the development, dissemination, and promotion of the use of sport knowledge in decision-making and policy development. The SSP provides funding to SSHRC to administer the Sport Participation Research Initiative (SPRI) and research results are presented at an annual conference. There is some evidence that this research is used as input to policy development.
The programming contributes to providing Canadians with opportunities to participate in sport to a certain extent. The evaluation identifies the F-P/T bilateral agreements as effective vehicles for sport participation, particularly among under-represented groups, including Indigenous peoples, due to targeted supports.
However, participation in sport remains a challenge in Canada. The Statistics Canada General Social Survey (2016) revealed that 26.7% of Canadians aged 15 and older regularly participated in sport, the first increase in participation since 1992. The Indigenous population had a similar sport participation rate, while those who identify as visible minorities and recent immigrants were slightly less likely to participate in sport. The 2020 Rally Report found that the participation rate of children declined to under 60% from 74% in 2010-11; the rate for girls was much lower than for boys. Other research has found that new Canadians are less likely to participate in sports.
The evidence indicates that programming contributes to the advancement of Canadian interests, values and ethics in sport, both at home and abroad. Data on doping control tests provided by the Canadian Centre for Ethics Sports shows that there are very few anti-doping rules violations annually.
The SSP contributes to providing Canadian athletes with access to quality sport programming and services. The 2019-20 Status of the High Performance Athlete survey found that, similar to 2014, just over half of athletes say they have been able to access all the needed sport science and sport medicine services from their CSC.
Hosting Program
The HP provides funding that directly enables communities to bid for and host international sporting events as well as the Canada Games. The HP funded a total of 411 International Single Sport Events (ISSE) over the five-year evaluation period, with just over one half of NSOs holding an event each year. While the vast majority of ISSE applications from NSOs are approved each year, the program is not able to fully fund events. The amount of funding devoted to the ISSE component has not increased for many years.
The HP provides high-performance athletes, coaches, and officials opportunities to participate in sport events in Canada. The HP enables about 36% of carded athletes to compete in ISSE events each year; these events provide opportunities for even more non-carded athletes. High performance athletes are generally satisfied with both the amount and type of competition experiences. NSOs indicated that HP funding contributes to a moderate or great extent in providing opportunities for athletes, coaches and officials to participate in sport events in Canada.
Athlete Assistance Program
Through its targeted funding supports, the AAP helps Canadian athletes achieve higher levels of athletic performance. However, athletes continue to face financial pressures that could affect their ability to compete. With new funding provided to the AAP over the period of evaluation, it has made some progress in achieving its short-term outcome of alleviating the financial burdens faced by high performance athletes.
In 2019-20, the AAP payment covers 62% of an athlete’s sport-related expenses for carded athletes, below the 70% target set by SC. Athletes’ sport-related expenses have increased substantially over the past few years. The AAP’s payment to carded athletes was increased from $1,500 to $1,765 for Senior Cards following a 2017 Budget announcement.
The AAP provides funding to help some athletes with their education. The AAP stipend to cover the cost of tuition is $5,500, which covered 84% of the cost for post-secondary undergraduate tuition in 2020-21, close to the program’s target of 85%. The 2019-20 Status of the High Performance Athlete Survey found that less than half of athletes reported that the AAP is assisting (or has assisted) them in pursuing post-secondary education.
SC programming contributes to helping carded athletes progress through the high performance system, though the rate of progression has slowed since 2012. Eligible athletes hold Senior International Cards for about five years, which has remained constant for many years. SC key informants agreed that this outcome should be changed to focus on whether athletic performances are improving over time.
Canada’s medal success at the Summer Olympic Games has improved slightly since 2000, while success at the Winter Olympic Games has remained about the same. Canada’s performance at the Winter Paralympics has improved since 2010, with performance at the Summer Paralympics declining substantially in the last two events. Canada’s overall sport ranking internationally for Olympic sport, as well as for Paralympic sport, declined in 2018-19 and 2017-18.
While there is evidence of progress in achieving the short-term outcomes of the Gender Equality in Sport Initiative, the timeframe for achieving gender equity by 2035 will be challenging. There is a concern that the initiative’s funding will sunset in 2021-22 and that the momentum that has been built will dissipate.
Due to a lack of performance measurement data, it was not possible to assess the progress being made by the Next Generation initiative in achieving its short-term outcomes. There is anecdotal evidence that the Own the Podium (OTP) is seeing a positive trend in the performances of next generation athletes. However, the survey of NSOs revealed some concerns, with four in ten stating that their sport lacks a sufficient pool of next generation athletes and over half indicating that SSP financial support is not effective in developing this pool of athletes.
The Safe Sport initiative is making good progress in achieving two of its three short-term outcomes. Most NGOs have had over 75% of their staff, coaches and athletes complete training on harassment, abuse and discrimination; training of volunteers is slower. The Canadian Centre for Ethics and Sport indicated that all high performance athletes have completed their e-learning anti-doping course. As of June 2018, 73% of NSOs had implemented concussion identification protocols that are harmonized with the Canadian Guidelines on Concussion in Sport. However, the 2019 SC Report Card initiative gave funded sport organizations a marginal rating for their implementation of a Concussion Return-to-Play Protocol.
Limited progress has been made in achieving the short-term outcomes of the Indigenous Youth in Sport initiative, due to organizational challenges and a lack of performance data on the short-term indicators.
Status of Performance Measurement
The SC logic model and performance measurement framework are out-of-date; several expected outcomes are not meaningful and there is an extensive list of indicators. Current data on many of the performance indicators are not available. There is no feedback loop that uses performance information as an input into program planning or decision-making.
Efficiency
Overall, evidence suggests that SC delivers the three programs in an efficiency manner, with relatively low administrative costs compared to the amounts of funding delivered and good compliance with service standards. There are opportunities to improve the timeliness of funding decisions and reduce the burden of application and reporting processes.
Recommendations
The ADM, Sport, Major Events and Commemorations, should:
- Build upon the findings of this evaluation to develop an overall vision and clear roles and priorities, with particular attention on sport participation and social development objectives.
- Build upon the findings of this evaluation to assess the effectiveness of the Next Generation initiative.
- Update the Sport Canada logic model and performance measurement framework, and develop a methodology for gathering and reporting program results annually.
1. Introduction
This report presents the findings, conclusions and recommendations resulting from the Grouped Evaluation of Sport Canada (SC) Programs. The evaluation examined three SC programs: Sport Support Program (SSP), Athlete Assistance Program (AAP) and Hosting Program (HP). It builds on the findings of the previous evaluation completed in 2016, which was also grouped.
The evaluation covered the five-year period from April 1, 2015 to March 31, 2020, and examined targeted issues related to relevance, effectiveness, and efficiency.
The study was undertaken by the Evaluation Services Directorate (ESD) with support from a consulting firm. It was conducted in accordance with the requirements of the Financial Administration Act (FAA), the Treasury Board Policy on Results (2016), commitments made to Treasury Board through several submissions for targeted funding, and the Canadian Heritage (PCH) Departmental Evaluation Plan 2019-20 to 2023-24.
This report describes the program, evaluation scope, methodology and evaluation questions, and presents the evaluation findings, conclusions and recommendations.
2. Profile of SC Programs
2.1. Background
The Sport Canada (SC) Branch within the Department of Canadian Heritage (PCH) provides financial support to sport organizations, athletes and coaches through the Sport Support Program (SSP), the Athlete Assistance Program (AAP), and the Hosting Program (HP). These three programs collectively enhance the Canadian high performance sport system through supporting athletes and Canadian sport organizations, advancing the 2012 Canadian Sport Policy (CSP) and helping sport organizations to host international and national sporting events.
The three programs contribute to the departmental Strategic Outcome that “Canadians participate and excel in sport,” as well as the Program’s outcomeFootnote 1, which aims to achieve that:
- Canadian athletes succeed at the highest levels of competition.
- Canadian children and youth are enrolled in a sport activity.
- Canadians, regardless of gender, physical ability and cultural background, who participate in sport activities, are satisfied with the manner in which the activity is provided.
SC works closely with athletes and a variety of other stakeholders to support the development and delivery of quality sport programs for Canadians from “playground to podium”. Key collaborators include: national sport organizations (NSOs); multiservice sport organizations (MSOs); Canadian Sport Centres (CSCs) and Canadian Sport Institutes (CSIs) that make up the Canadian Olympic and Paralympic Sport Institute Network (COPSIN); provinces and territories; and other stakeholders at the national level.
SC fulfills a significant and essential role in the Canadian sport system, in accordance with the Physical Activity and Sport Act (2003) and the Department of Canadian Heritage Act (1995). It is consistent with the CSP, which defines a common, pan-Canadian vision for sport in Canada. This vision aims for a dynamic and innovative culture that promotes and celebrates participation and excellence in sport. The CSP was renewed in 2012 to set a direction for the period 2012-22 for all governments, institutions and organizations committed to realizing the positive impacts of sport on individuals, communities and society.
SC and external stakeholders in the sport community are currently undertaking an evaluation of the CSP, and data collection was conducted in parallel to this evaluation. As at the time the current evaluation report was completed, the CSP evaluation report had not been finalized and thus its findings are not reflected herein.
2.2. Program description
The three SC funding programs, the HP, the SSP and the AAP, are briefly described below.
Hosting Program
This program aims to enhance the development of sport excellence and the international profile of sport organizations by providing assistance for the hosting primarily of international sport events in Canada, and for hosting the Canada Games.
The objectives of the HPFootnote 2 are:
- To strengthen the sport excellence and sport development impacts of bidding and hosting the Canada Games and targeted international sport events.
- To increase access and equity for designated under-represented groups through contributions to international bidding and hosting events.
- To strengthen the associated economic, social, cultural and community impacts of supported bidding and hosting projects, in keeping with the Government of Canada interests and priorities.
SC makes funding contributions to events in the following four categories:
- International Major Multi-Sport Games: These events are large multi-sport games, governed by an international sport franchise holder with links to sports’ international federations. They have a qualification process and entry restrictions. They contribute to the Sport Excellence Strategy and to the Canadian High Performance Strategy with a focus for the National Sport Organizations’ high-performance plans and long-term athlete development. These events include the Summer and Winter Olympic and Paralympic Games, the Commonwealth Games, and the Pan American Games.
- International Single Sport Events: These single-sport events are governed by a sport’s international federation (or the regional/continental counterpart) and have a qualification process and entry restrictions. Such events include the World Championships, Olympic or Paralympic qualification events and World Cups. This category includes events which may range in size and complexity from small to large.
- International Major Games for Aboriginal Peoples and Persons with a Disability: These events are multi-sport games that provide quality competition opportunities for designated under-represented groups that face systemic barriers to sport participation. They may be awarded to Canada on a rotational basis (for example, the North American Indigenous Games and the Arctic Winter Games) or may require a bid (for example, the Special Olympics World Summer Games and the Deaflympics). Those requiring a bid are identified as an International Major Multi-Sport Games event for the purposes of determining the number and type of event to be hosted in any given ten-year period.
- Canada Games: Annual contributions are made to host societies and the Canada Games Council to support these events, which are held every second year, alternating between summer and winter. SC collaborates with the host society and the host municipal and provincial/territorial governments to financially support each edition of the Games.
Sport Support Program
This program is the primary funding vehicle for national level initiatives. PCH provides SSP funding to eligible organizations to deliver programs and services that have a direct impact on athletes and athlete development, and that provide children and youth with their first experience in sport.
Specific objectives of the SSPFootnote 3 are to:
- increase the opportunities to participate in quality sport activities for all Canadians, including under-represented groups;
- increase the capacity of the Canadian sport system to systematically achieve world class results at the highest international competitions;
- contribute to the provision of technical sport leadership within the Canadian Sport System; and
- advance Canadian interests, values and ethics in sport at home and abroad.
Over the period of this evaluation, the SSP was used to deliver strategic investments through the following Treasury Board Submissions that were approved between 2017-18 and 2019-20:
- Funding for Gender Equality in Sport: Budget 2018 announced an investment of $30 million over three years to achieve gender equity in all facets of sport by 2035. Subsequently, the Minister of Finance approved a request to re-profile the funding over the next four fiscal years, starting in 2018-19 to 2021-22.
- Supporting the Next Generation of Canadian Olympic and Paralympic athletes: Budget 2017 proposed to invest $25 million over five years to support Olympic and Paralympic athletes who have demonstrated medal potential for the subsequent Olympic or Paralympic Games. The Department is working with the Canadian Olympic Committee (COC), the Canadian Paralympic Committee (CPC) and their respective foundations, to provide a total of up to $10 million ($5 million from the Government of Canada, $4 million from the COC and $1 million from the CPC) in ongoing, annual funding, starting in 2017-18.
- Ensuring a Safe and Healthy Sport System: Budget 2019 announced an investment of $30 million over five years, starting in 2019-20, to enable Canadian sport organizations to ensure a safe and healthy sport environment.
Athlete Assistance Program
This program contributes to improving Canadian athlete performances at major international sporting events, enabling athletes to combine their sport and academic careers while training intensively in pursuit of world-class performances. To this end, the program identifies and supports athletes already at, or having the potential to be in the top sixteen in the world in their sport. Footnote 4
Athletes who are approved for funding and are financially supported through the AAP are referred to as “carded” athletes. AAP support is referred to as “carding.”
The objectives of the AAPFootnote 5 are to:
- financially support Canadian athletes identified by NSOs using criteria established by SC and the respective sport organization as performing at or having the greatest potential to achieve top sixteen (16) results at Olympic/Paralympic Games and World Championships;
- assist Canada’s carded athletes in preparing to engage in post competitive full- or part-time career activities; and
- enable Canada’s carded athletes to participate in year-round national training and competition regimes to further their athletic goals.
During the period of this evaluation, SC received additional funding for the AAP, through a Treasury Board Submission that was announced in Budget 2017:
- Support for High Performance Athletes: New funding of $25 million over five years (2017-18 to 2021-22), and then $5 million ongoing.
2.3. Investments in Indigenous Youth and Sport
SC received additional funding of $18.9 million over five years, following a Budget 2017 announcement for the Indigenous Youth and Sport Investment initiative. Building on existing initiatives funded through SC’s SSP and HP, it aims to strengthen the established roles and leadership of Canadian sport system partners such as the Aboriginal Sport Circle (ASC), the P/Ts, NSOs, and MSOs.
The approach to the investment was designed in collaboration with the ASC to address the Truth and Reconciliation Commission’s (TRC) Calls to Action relating to Sport and Physical Activity (#87-91). The initiative consists of four components, described below.
Indigenous Sport Leadership
The first component of the investment seeks to increase Indigenous sport leadership. It provides contribution funding to the ASC over four years: $0.3 million in 2017-18, $0.5 million in 2018-19, $0.8 million in 2019-20, $1.0 million in 2020-2021, and $1.3 million in 2021-22. Funding is disbursed annually through the existing terms and conditions of the SSP.
Culturally Relevant Sport Programming
The second component of the investment seeks to increase the offering of culturally relevant sport programming. Funds under this component is directed to provinces and territories, through the bilateral agreements, in the amounts of $1.0 million in 2017-18, $1.3 million in 2018-19, $1.5 million in 2019-20, $1.8 million in 2020-21, and $2.0 million in 2021-22. Other national sport organizations also receive funding under this component to deliver culturally relevant sport programing. Funding is delivered through the SSP under the current contribution agreement procedures.
North American Indigenous Games (NAIG)
The third component of the investment provides contribution funding to host societies for the NAIG in the amount of $3.5 million, on a four-year cycle starting in 2019-20, which coincides with the frequency of the Games. The intent is to ensure that the Games are held on a consistent basis every four years, starting in 2020 (postponed due to COVID-19), and offer an appropriate standard of event for Indigenous youth. Once host societies are determined, this funding will be provided through the HP on an ongoing basis.
SC’s Data and Research
The fourth and final component of the investment provides operating funding of $0.42 million annually starting in 2017-18 to increase SC’s research and data capacity. The funding is ongoing to allow SC to hire a full-time employee and to monitor and assess the current state of Indigenous sport.
2.4. Target population, stakeholders and delivery partners
The target populations, stakeholders and delivery partners for the three programs are listed in Table 1.
| Hosting Program | Sport Support Program | Athlete Assistance Program | |
|---|---|---|---|
| Target populations |
|
|
|
| Key stakeholders |
|
|
|
| Delivery partners |
|
|
|
Source: PCH, Sport Development and High Performance: Performance Information Profile, November 2019
2.5. Governance and implementation
The three SC funding programs contribute to the departmental Strategic Outcome, that “Canadians participate and excel in sport,” and the Program Expected Result that “Canada has a sport system where high performance athletes and Canadians can participate and excel in sport within a technically sound and ethical support structure.”
The Assistant Deputy Minister, Sport, Major Events and Commemorations, has responsibility for the administration and management of SC’s three funding programs. The Director General of SP oversees the planning, implementation and performance of sport programs and policies as well as the day-to-day operations of the Branch. The DG of SC has delegated lead roles to directors responsible for the following divisions: High Performance and Major Games, Policy and Planning, Programs, and Multilateral.
2.6. Resources
Total planned expenditures were $1.1 billion over the five years of the evaluation period, an average of $220.7 million per year (Table 2). Vote 1 consists of operating expenditures (salaries and O&M) and Vote 5 is grants and contributions. Gs&Cs accounted for the vast majority (94%) of planned spending.
The largest of the three programs is the SSP. Annual planned spending increased over the five years due to additional funding provided by several Treasury Board submissions described earlier. Planned spending for the HP was the highest in the first year, due to the 2015 Pan American Games held in Toronto.
Table 3 presents actual expenditures.
| Vote | 2015-16 | 2016-17 | 2017-18 | 2018-19 | 2019-20 | Total |
|---|---|---|---|---|---|---|
| Vote 1 (operating expenditures): SalariesTable 2 note * |
11,666,202 | 10,787,741 | 11,269,758 | 10,580,018 | 10,376,143 | 54,679,862 |
| Vote 1 (operating expenditures): O&M |
1,270,459 | 1,279,046 | 631,062 | 2,023,936 | 2,142,651 | 7,347,154 |
| Total Vote 1 | 12,936,661 | 12,066,787 | 11,900,820 | 12,603,954 | 12,518,794 | 62,027,016 |
| Vote 5 (grants and contributions): Athlete Assistance Program |
28,000,000 | 28,000,000 | 33,000,000 | 33,000,000 | 33,000,000 | 155,000,000 |
| Vote 5 (grants and contributions): Sport Support Program |
146,115,064 | 146,315,064 | 146,615,064 | 150,405,064 | 162,211,064 | 751,661,320 |
| Vote 5 (grants and contributions): Hosting Program |
56,825,790 | 19,865,000 | 19,865,000 | 19,865,000 | 23,386,765 | 139,807,555 |
| Total Vote 5 | 230,940,854 | 194,180,064 | 194,480,064 | 203,270,064 | 218,597,829 | 1,046,468,875 |
| Total Program | 243,877,515 | 206,246,851 | 206,380,884 | 215,874,018 | 231,116,623 | 1,108,495,891 |
Source: GCIMS
Table 2 notes
- Table 2 note *
-
Salaries include employee benefits and pensions (EBP)
| Vote | 2015-16 | 2016-17 | 2017-18 | 2018-19 | 2019-20 | Total |
|---|---|---|---|---|---|---|
| Vote 1 (operating expenditures): SalariesTable 3 note * |
10,930,096 | 9,686,659 | 10,518,042 | 11,264,376 | 11,067,096 | 53,466,268 |
| Vote 1 (operating expenditures): O&M |
1,622,089 | 2,889,695 | 2,155,725 | 2,065,123 | 1,037,057 | 9,769,688 |
| Total Vote 1 | 12,552,185 | 12,576,353 | 12,673,766 | 13,329,499 | 12,104,152 | 63,235,956 |
| Vote 5 (grants and contributions): Athlete Assistance Program |
27,680,000 | 27,998,926 | 32,998,500 | 32,098,389 | 31,424,968 | 152,200,783 |
| Vote 5 (grants and contributions): Sport Support Program |
148,895,558 | 146,856,428 | 154,016,129 | 156,919,195 | 179,975,740 | 786,663,050 |
| Vote 5 (grants and contributions): Hosting Program |
30,549,231 | 23,219,000 | 19,753,493 | 25,714,604 | 19,609,323 | 118,845,651 |
| Total Vote 5 | 207,124,789 | 198,074,354 | 206,768,122 | 214,732,188 | 231,010,031 | 1,057,709,484 |
| Total Program | 219,676,974 | 210,650,707 | 219,441,888 | 228,061,687 | 243,114,183 | 1,120,945,439 |
Source: GCIMS
Table 3 notes
- Table 3 note *
-
Salaries include employee benefits and pensions (EBP)
2.7. Results of the previous evaluation
The previous evaluation was completed in 2015-16 and covered the period from 2010-11 to 2014-15. Twelve recommendations were made to the ADM of Sport, Major Events and Commemorations:
- Clarifying the role of SC in sport participation.
- Clarifying the role of OTP and others in targeted excellence.
- Reviewing direct support to athletes.
- Assessing policies related to under-represented groups.
- Maintaining a sufficient pool of athletes with podium potential.
- Continuing efforts to promote ethical sport.
- Further supporting LTAD implementation.
- Measuring the economic and social impacts of hosting.
- Responsibility for monitoring legacies.
- Measuring the medium to long-term impacts of legacies from hosted events.
- Aligning policy and program research and accountability requirements.
- Coaches and the Canadian Sport System.
The majority of these recommendations have been implemented except for twoFootnote 6:
- #1 – Clarifying the role of SC in sport participation – This required revising the SSP’s Terms and Conditions (originally scheduled to occur during 2019-20). Furthermore, the scoping interviews found that there continue to be concerns about declining sport participation rates among Canadians, and the absence of a consolidated approach for gathering data on participation numbers. There also continues to be a lack of clarity concerning the definition of participation and the roles and responsibilities of SC and the Public Health Agency of Canada, among others.
- #6 – Continuing to promote ethical sport. This required developing data collection tools on the state of ethical issues in Canadian sport (e.g., public opinion research for coaches and the general public, etc.). This deliverable was scheduled to be completed by June 2020.
3. Evaluation approach and methodology
This evaluation was conducted by ESD in accordance with the requirements of the Treasury Board Secretariat Policy on Results (2016) and the PCH Departmental Evaluation Plan, 2019-20 to 2023-24. It included multiple methodologies to gather quantitative as well as qualitative data and triangulate findings.
Given the complexity and broad scope of the three SC programs, and their associated funding initiatives, the timeline, scope and approach of the evaluation were calibrated to reflect critical information needs, as outlined in the following sections.
3.1. Evaluation scope
The evaluation covers a five-year period, from 2015-16 to 2019-20.
Scoping interviews were held with program representatives to determine their specific information needs, to refine the evaluation scope, and to help develop the methodological approach.
The evaluation does not include a specific assessment of the CSP (2012). The CSP is the subject of a summative evaluation being led by SC; the timeline for the delivery of the final report has been delayed due to COVID-19.
3.2. Calibration
Calibration refers to the process of adjusting how evaluations are conducted, based on a number of different factors, in ways that produce quality evaluations cost effectively and within timelines. Depending on the particular evaluation, calibration can involve adjustments that increase or decrease the required level of effort, scope or depth of analysis. It enables the evaluation team to validate data across a number of sources, and to increase the legitimacy of the results of the evaluation.
The evaluation team calibrated in terms of both timing and scope based on consultations with stakeholders, resource allocations, extent of changes to programming over the period, and risks. At the request of the program, the evaluation was launched later than scheduled. The scoping phase was completed in March 2020 just as the COVID-19 pandemic forced the shut down of the economy. The original planned completion date of December 2020 was extended to June 2021 due to the pandemic and related issues that effected the ability of the evaluation team to conduct the project within original timelines.
In addition to the key priorities for information and analysis identified through consultations, the following factors were considered in calibrating the scope of the evaluation:
- Though the basic structure of the SSP has remained the same over the years (funding provided to the NSOs, MSOs and CSCs/CSIs and to the P/Ts through bilateral agreements), it does deliver the bulk of contributions and it was used as the mechanism to deliver new activities funded through the TB submissions described earlier. Therefore, the evaluation focused more attention on SSP compared to the other programs and includes specific questions related to the achievement of the expected results of these recent TB submissions.
- The AAP has remained fairly stable and this program was thoroughly reviewed by the previous evaluation and other means. The main change over the period was an increase in funding. Beginning in 2017-18, carded athletes began receiving additional funding to help offset the costs of living and training. In addition, SC undertook a review of the Targeted Excellence approach (SC, 2013), including an assessment of the OTP recommendations. Therefore, the present evaluation drew upon readily available performance data, including from the recent Status of the High Performance Athlete Survey conducted by SC (Canadian Heritage, 2020d).
- The HP also remained fairly stable. The main issue of interest to program officials was assessing whether the Hosting Policy is responsive to stakeholder needs while remaining aligned with federal roles and responsibilities. While this was identified as outside the scope of this evaluation, it did gather feedback on the design of the HP, which could contribute to a full review of the policy.
- The issue of the programs’ relevance was thoroughly examined in the previous evaluation. Therefore, the relevance questions were targeted to the needs of SC management, which included assessing the role of SC in supporting sport participation.
3.3. Evaluation issues and questions
Based on consultations and preliminary research, the questions addressed by this evaluation are listed in Table 4. Further details on the indicators, data sources and data collection methods associated with these questions can be found in the evaluation framework (Annex B).
| Issues | Evaluation questions |
|---|---|
| Relevance |
|
| Effectiveness |
|
| Efficiency |
|
| Other |
|
With respect to the first question under Effectiveness, the evaluation examined the performance of the program in achieving what are perceived to be the key intended outcomes of the logic model (Annex A).
3.4. Methodology
The methodology involved the design and conduct of a combination of qualitative and quantitative data collection methods and relied on both primary and secondary sources of information. The data collection methods were as follows:
- Document review: A review of relevant programs and Government of Canada documents.
- Literature review: A targeted literature review.
- Review of administrative and performance data: Extraction of data contained in the PCH/Program’s administrative, financial and performance databases.
- Key Informant interviews (n=50): Interviews with representatives of SC and other branches of PCH, other federal departments and agencies, provincial/territorial governments, sport organizations (mainly MSOs) and academics.
- Case studies (n=6): Consisting of three case studies focused on participation in selected sports (swimming and artistic swimming, basketball and wheelchair basketball and hockey) and two case studies focused on the F-P/T bilateral agreements (Nova Scotia and the Northwest Territories).
- Survey (n=58): An online survey of the population of NSOs that receive SC funding.
Each of the proposed data collection methods is described in Annex C.
3.5. Evaluation limitations
The main limitations for this evaluation were related to the COVID-19 pandemic, performance measurement gaps, respondent burden and attribution. Table 5 provides a more detailed overview of these challenges and the corresponding mitigation strategies.
| Challenges | Mitigation Strategies |
|---|---|
| The COVID-19 pandemic affected the timelines of both this evaluation and the concurrent evaluation of the CSP. | Data collection for this evaluation was delayed; interviews, case studies and NSO survey commenced in December 2020. This strategy proved successful, as the response rates to the interviews and NSO survey were high. |
| The SC Performance Information Profile (PIP) and a PIP tracking spreadsheet presented some gaps in data needed to support some of the indicators. | Wherever possible, the evaluation team attempted to obtain performance data from SC managers directly and from funding recipients (e.g., the Canadian Centre for Ethics in Sport provided data on the number of doping control tests; Canadian Women & Sport provided data on the number of gender equity audits completed). |
| The NSO survey may potentially be a high burden on sport organizations especially in light of a range of other parallel data collection activities, which might reduce the response rate. | Funded organizations are typically responsive to evaluation requirements. PRG sent out two email reminders to survey non-respondents, and the evaluation team telephoned non-respondents as a final step. These steps yielded a high survey response rate. |
| It might be difficult to attribute any changes in the program’s longer-term outcomes to the activities and outputs of the program. | The previous evaluation found that it was not possible to attribute changes in the program’s longer-term outcomes to the programs. However, each evaluation question was addressed by more than one line of evidence which helped to triangulate the findings. Any reservations regarding attribution are noted where appropriate. |
4. Findings – Relevance
This section presents the findings on the evaluation issue of relevance, organized by evaluation question and indicator. A summary of the findings on each evaluation question is provided at the beginning of each sub-section.
4.1. Design of the SC programs in supporting participation
Evaluation Question: Is SC’s programming designed appropriately to achieve the objectives of the Physical Activity and Sport Act (2003) with respect to participation in sport?
While SC’s programming is designed appropriately to achieve the high performance objective of the Physical Activity and Sport Act, there are gaps in how it supports sport participation. SC’s SSP devotes relatively little investment to promoting sport participation at the community (grassroots) level: about $11 million or about 7% of the SSP’s total funding of $157 million in 2018-19. SC is mainly focused on high performance sport while the Public Health Agency of Canada has the mandate for promoting physical activity. The F-P/T bilateral agreements appear to be effective mechanisms for promoting sport participation, particularly in remote and Indigenous communities. The Innovation Initiative component of the SSP is funding several interesting projects focused on promoting sport participation among under-represented groups.
Definition of sport participation
While there is a commonly-held definition among key informants, SC lacks a vision and strategy to fully guide its role and priorities in sport participation.
Canada’s Physical Activity and Sport Act (2003) is meant to encourage, promote and develop physical activity and sport in Canada. Its objectives with respect to sport policy are to:
- Increase participation in the practice of sport and support the pursuit of excellence in sport.
- Build capacity in the Canadian sport system.Footnote 7
The evaluation asked key informants whether they believe there is a common definition of sport participation. The concept of sport participation is generally defined as physical activities that usually involve competition and rules and develop specific skills. Key informants who are familiar with the research on sport participation and physical activity stated that the term sport participation is well defined and well understood. Similarly, key informants representing the P/Ts stated that the definitions are clear in the context of the F-P/T bilateral agreements.
SC key informants noted that priorities for high performance sport have been clearly articulated in the Canadian High Performance Sport Strategy (2019). This strategy has helped staff working on the HP determine how hosting can best support the objectives of this strategy.
In contrast, key informants within SC stated that there is a lack of a shared vision for sport participation within the Branch. It was noted that when the term sport participation is used in meetings, it tends to be interpreted as supporting sport at the grassroots level, which some view as being outside of SC’s mandate. It was suggested that SC needs to develop a sport participation strategy. For example, it was noted that the lack of a participation strategy makes it difficult for the HP to determine whether to support “participation-type” events.
Level of investment by the Government of Canada and other stakeholders in sport participation
No data are available on the level of investment by stakeholders (governments, not-for-profit sector, private sector) in supporting sport participation in Canada. The F-P/T bilateral agreements are viewed as an effective mechanism for promoting sport participation, particularly in remote and rural communities. SC devotes relatively little funding to promoting sport participation at the grassroots level.
Two of the SC programs, the SSP and HP, support sport participation. Details on funding are described below.
Sport Support Program
SSP funding totaled $787 million over the evaluation period, ranging from a low of $147 million in 2016-17 to a high $180 million in 2019-20 (Table 6). NSOs receive the majority of SSP funding, accounting for 62%. MSOs account for just under 20% and the CSCs/CSIs about 9%. The rest of the SSP funds go to “other NGOs” (5%) and to the P/Ts (4%) via the F-P/T bilateral agreements.
The level of funding increased to all recipient types over the five years. The most notable variation in funding is for the category “other NGOs”, which includes “Other Supporting Initiatives” (OSIs) and the contribution to the World Anti-Doping Agency (WADA). The organizations classified as OSIs include Own The Podium (OTP), the Canadian Centre for Ethics in Sport (CCES) and Canadian Fitness and Life Research Institute (CFLRI).
Total SSP funding increased slightly over the evaluation period compared to the previous five years, growing by 16%, from $151 million in 2013-14 to $180 million in 2019-20. The increase was due in part to additional funding for several initiatives, as follows:
- Gender Equity in Sport: $30 million over four years, from 2018-19 to 2021-22.
- Supporting the Next Generation of Canadian Olympic and Paralympic Athletes: $5 million annually and ongoing, beginning in 2017-18.
- Investing in Indigenous Youth and Sport: $12.9 million over five years, beginning in 2017-18.
- Ensuring a Safe and Healthy Sport System: $6 million over five years, beginning in 2019-20.
SC does not track or report on the amount of funding devoted to participation. The evaluation estimates it was about $11.0 million in 2018-19. This represents only about 7% of total SSP funding. The previous evaluation estimated that 8% of SSP funding was devoted to participationFootnote 8, indicating there has been little change in recent years.
Key informants agreed that the main vehicle for supporting sport participation are the F-P/T bilateral agreements, which totalled $6.5 million in SSP funding in 2018-19 (Table 7). This includes funding provided by the Indigenous Youth in Sport Investment initiative for culturally relevant programming. At one time, SC had a funding envelope devoted to participation, but this envelope was combined with the core funding envelope beginning in April 2013.Footnote 9
Several MSOs focus on participation at the community level, including Canadian Tire JumpStart, KidSport, Go, Le Grand Défi, Motivate Canada and ParticipACTION. SC reported that the total amount of SSP funding to these organizations was $3.3 million in 2018-19.
Finally, the Innovation Initiative, which is a component of the SSP, has a focus on participation, particularly among under-represented groups, including girls and women, youth facing barriers and racialized communities. Its budget was $1.0 million in 2018-19.
The evaluation was not able to estimate the total investment made by governments, not-for-profit organizations, and the private sector in supporting sport participation and physical activity.
| Recipient type | 2015-16 | 2016-17 | 2017-18 | 2018-19 | 2019-20 |
|---|---|---|---|---|---|
| NSO | 92,330 | 91,283 | 99,149 | 97,033 | 103,071 |
| MSO | 30,758 | 31,151 | 31,946 | 32,913 | 36,392 |
| CSC | 15,472 | 13,742 | 13,506 | 13,728 | 13,844 |
| Other NGOsTable 6 note * | 5,085 | 5,613 | 6,057 | 7,119 | 20,828 |
| P/Ts | 5,275 | 4,975 | 5,665 | 6,585 | 6,477 |
| Total SSP | 148,921 | 146,766 | 156,325 | 157,378 | 180,612 |
Source: GCIMS
Table 6 notes
- Table 6 note *
-
“Other NGOs” included Other Supporting Initiatives and the contribution to the World Anti-Doping Agency (WADA)
Hosting Program
The HP provides NSOs with funding to host international sport events (ISSEs) in Canada, which give athletes, coaches and officials opportunities to participate in sport events.
HP funding totalled $117 million over the five-year evaluation period, ranging between $19 million to just over $30 million annually (Table 7). Funding to the ISSEs accounted for almost half of the total funds, with 39% for ISSE Tier II events (over $250K) and 9% for ISSE Tier I events (under $250K).
One third of funds are devoted to the Canada Games (30%), followed by the International Major Multisport Games (IMMG) and the International Multisport Games for Aboriginal Peoples and Persons with a Disability (IMGAPPD), which accounted for 14% and 8%, respectfully. Note that about 1% of HP funding supported the bid for the Fédération Internationale de Football Association (FIFA) Men’s World Cup in 2026, which was awarded in 2018 to the united bid from the U.S., Canada and Mexico. Beginning in 2019-20, the HP received a further $3.5 million of ongoing funding (for four years) to stabilize the North American Indigenous Games, through the Investing in Indigenous Youth and Sport initiative.
HP funding over the evaluation period decreased by 76% compared to the previous five years, from $502 million for the period 2010-11 to 2014-15 to $117 million for the period 2015-16 to 2019-20. This decrease is due to the funding to the Toronto 2015 Pan American and Parapan American Games. IMMG has had a significant decrease in funding, dropping from $343 million in the previous evaluation period (2010-11 to 2014-15) to $15.8 million for the period 2015-16 to 2019-20. Another notable variance was the 50% increase in IMGAPPD funding over the last ten years, from $4.2 million (2010-11 to 2014-15) to almost $9 million in the last five years.
| Recipient type | 2015-16 | 2016-17 | 2017-18 | 2018-19 | 2019-20 |
|---|---|---|---|---|---|
| ISSE Tier I (<$250K) | 1,800 | 2,406 | 2,360 | 2,377 | 1,909 |
| ISSE Tier II (>$250K) | 13,956 | 8,479 | 6,140 | 7,293 | 9,908 |
| IMMG | 11,418 | 0 | 0 | 4,438 | 0 |
| IMGAPPD | 0 | 1,100 | 4,084 | 1,005 | 2,650 |
| Canada Games | 3,470 | 11,225 | 6,418 | 9,506 | 4,320 |
| FIFA 2016 | - | - | - | 90 | 821 |
| Totals | 30,644 | 23,210 | 19,003 | 24,711 | 19,609 |
Source: GCIMS
Roles of other federal partners and other stakeholders in promoting sport participation and physical activity
The Public Health Agency of Canada has the mandate for promoting physical activity, mainly via a grant and contribution program that invests about $20 million annually (matched by the private sector) in projects that promote innovative approaches to encourage behaviour change. This program funds ParticipACTION (as does SC’s SSP). SC and PHAC are working to increase their level of collaboration. The federal government, along with the provinces and territories, have implemented what is regarded as an effective governance structure for sport, recreation and physical activity.
Public Health Agency of Canada
Within the Government of Canada, the Public Health Agency of Canada (PHAC) has the core mandate for promoting physical activity. According to the report, A Common Vision for Increasing Physical Activity and Reducing Sedentary Living in Canada: Let’s Get Moving (2018), PHAC views physical activity as a means to good overall health and to preventing chronic disease.
PHAC’s major program for promoting sport physical activity is the Multi-Sectoral Partnerships to Promote Healthy Living and Prevent Chronic Disease Program.Footnote 10 This program is based on the premise that chronic diseases such as cancer, diabetes and cardiovascular disease are among the leading causes of death and reduced quality of life. Several common risk factors that contribute to chronic disease include physical inactivity and/or sedentary behaviour, unhealthy eating, and smoking. PHAC invests about $20 million annually in projects that test or scale innovative ideas to encourage behaviour changes that will improve the health of Canadians. PHAC’s investment in each project is matched by other stakeholders, other levels of government and/or the private and not-for-profit sectors.
While a total of 31 projects are currently being funded, the main PHAC participation initiative is “Let’s Get Moving”, which is carried out by ParticipACTION. Budget 2018 provided $25 million over five years to the organization to increase daily physical activity among Canadians. The total budget of the project is $48,542,508 over five years (July 2018 to March 2023).
The evaluation found that some of the funded sport organizations, including MSOs, had generally little awareness of this PHAC program.
Collaboration between PCH and PHAC is important because both play an important role in achieving the objectives of the Physical Activity and Sport Act. Key informants within SC and PHAC agreed that collaboration has increased in recent years and that efforts, particularly at the working level, need to be continued and enhanced. An example of the closer working relationship was the collaboration on safety protocols associated with holding the World Junior Hockey Championships in Alberta in December 2020 and January 2021 during the COVID-19 pandemic. Hockey Canada, an NSO, leads Canada’s involvement in this annual tournament.
One area where SC and PHAC could collaborate more is on improving access to sport participation data and research via the PHAC portal. This portal provides data on a variety of Physical Activity, Sedentary Behaviour and Sleep (PASS) indicators.Footnote 11 Several SC key informants noted that the SC website does not provide access to sport participation data available, for example, through the Canadian Fitness and Lifestyle Research Institute (CFLRI), Statistics Canada surveys, or research funded in partnership with the Social Sciences and Humanities Research Council (discussed later). Key informants representing sport organizations noted it is difficult to access all of the sport participation and physical activity data available in Canada.
F-P/T Governance
Overall, it appears that the federal government along with the provinces and territories have implemented an effective governance structure for sport, recreation and physical activity. The Sport, Physical Activity and Recreation Council (SPARC) is the minister-led intergovernmental forum for collective action on issues of national and international concern. Its secretariat has recently been established as a not-for-profit corporation. Key informants were highly positive of the work of the F-P/T governance structures as an effective mechanism for coordinating efforts focused on sport, recreation and physical activity.
Appropriateness of the design of the programs in supporting participation
The SSP as currently designed has a limited role in supporting sport participation at the community level, mainly via the F-P/T bilateral agreements. An important question is whether SC should be doing more in this area, given the major concerns about declining sport participation rates among children and youth, particularly girls.
As noted earlier, the F-P/T bilateral agreements are the main mechanism devoted to supporting sport participation at the community (grassroots) level. Most key informants indicated that these agreements are working effectively to promote sport participation, particularly among such under-represented groups as Indigenous peoples.
Key informants had widely varying views on whether the NSOs are effective at promoting sport participation. The case studies also revealed diverging views on their effectiveness. Larger NSOs are viewed to be more effective at promoting sport participation, as they have the capacity and the partnerships to develop programs that can be delivered by their provincial and territorial organizations.
In responding to the NSO survey, several organizations commented that SC had a sport development envelope at one time which was discontinued several years ago (as noted earlier). They indicated that they would like to do more in the area of sport development but lack the resources to do so. Further research would be required to assess the potential role of NSOs as a vehicle for promoting sport participation at the grassroots level.
Some informants noted the importance of not-for-profit sector partners, including the Coaching Association of Canada and Sport for Life in promoting sport participation. Some also pointed to the importance of the private sector in promoting sport participation and in developing elite athletes (i.e., a prime example being in basketball, which is discussed in Chapter 5, Section 5.1).
Finally, several key informants noted that the Innovation component of the SSP has funded several interesting experimental projects focused on promoting participation among under-represented groups. Funding is being provided to non-traditional organizations, i.e., organizations other than the NSOs and MSOs. One example is a pilot project undertaken by Canadian Women & Sport in partnership with MLSE Entertainment in Toronto. This project engaged a group of girls 14-18 years old who are currently participating in sport but are facing barriers to participation and are at risk of leaving. A strength of the project is that it has a built-in evaluative component, which found that the vast majority of participants reported that the program increased their desire and ability to be a leader in sport.Footnote 12
4.2. To what extent is the SSP meeting the needs of sport organizations?
Evaluation Question: To what extent is the SSP meeting the needs of sport organizations to support their operations, provide programming and to achieve the goals of the program?
SC programming is important for the existence and survival of the sport organizations that it funds, particularly the smaller organizations. While the SSP is meeting many financial needs of these organizations, there are new and increased demands and priorities, including those caused by the COVID-19 pandemic, which NSOs are not able to address with current financial support.
Importance of SSP funding to sport organizations
Most of the MSOs, NSOs and CSCs are highly reliant on SSP funding, particularly the smaller organizations. Some NSOs likely would not survive without this funding. The main issue raised by NSOs is that their core SSP funding has not increased in many years.
Financial information, the NSO survey, and key informant interview data suggest that SSP provides important supports to sport organizations in Canada. A review of publicly available information from organization websites and the Charity Listings on the Canada Revenue Agency website for a sample of MSOs, NSOs and CSCs/CSIs indicates that most are highly dependent on funding via the SSP. According to key informants and case studies, funding from SC is particularly important to smaller sport organizations. Several of the smaller NSOs noted that they might not exist without SC support. In contrast, some of the large NSOs, such as Hockey Canada, generate substantial income from hosting events and thus their financial support from the SSP makes up a small proportion of their total revenues.
Similarly, the Canadian Sport Centres/Institutes are highly dependent on SSP funding, as they have a limited ability to generate fee for service revenue. For example, the annual report of the Canadian Sport Institute-Pacific indicates the organizations had total revenues of $7.5 million in 2020, of which $5 million (67%) was from SC.
Publicly available financial information from MSOs shows that their level of dependence on SSP funding varies considerably. This sample of MSO information includes financial support from SSP ranging from a low of under 1% to a high of 59% of total revenues:
- Canadian Tire JumpStart – Total revenues of $32M in 2019, of which $232K (under 1%) was from the SSP.
- KidSport – Total revenues of $693K in 2019, of which $201K (29%) was from the SSP.
- Motivate Canada – Total revenues of $483K in 2020, of which $287K (59%) was from the SSP.
- ParticipACTION – Total revenues of $11.3M in 2019-20, of which $1.99M (18%) was from the SSP.
- Physical and Health Education Canada (PHE Canada) – Total revenues of $1.4M in 2019-20, of which $414K (30%) was from the SSP.
The NSO survey found that SSP funding is very important to their organizations in terms of their overall budget and in supporting their high-performance activities (Table 8). NSOs indicated that SSP funding was slightly less important in providing their coaches with training and development opportunities compared to other components: 72% rated SSP funding as very important for this area, a decline from 90% in the previous evaluation.
| Question | Not at all important | Not very important | Somewhat important | Very important | Total (%) | n |
|---|---|---|---|---|---|---|
| As a component of your organization's overall programming and services budget | 0.0 | 0.0 | 10.4 | 89.6 | 100 | 48 |
| To support your organization's high-performance programs/national team | 0.0 | 2.1 | 6.3 | 91.7 | 100 | 48 |
| To provide your athletes with competitive opportunities | 0.0 | 4.2 | 10.4 | 85.4 | 100 | 48 |
| To provide your coaches with training and development opportunities | 2.1 | 8.5 | 17.0 | 72.3 | 100 | 46 |
Finally, the impact of COVID-19 on the Canadian sport system was a central theme of many of the key informant interviews. NSOs that generate revenue from hosting events and merchandise sales have been decimated during 2020 and into 2021. They were appreciative of the emergency funding provided by the federal government to the sport sector.
Suggested improvements to the SSP
The main issue concerning the SSP is that its level of core funding has not changed in many years. The COVID-19 pandemic has prevented NSOs from hosting events and many have had an almost total loss of revenues. Most funded organizations are supportive of SC’s Report Card initiative.
Key informants offered a range of suggestions for the improvement of the SSP. The main issue raised by most of the NSOs, MSOs and CSCs is that the amount of core funding received via the SSP has remained constant for many years, because the Sport Funding Accountability Framework (SFAF) has not been updated. The COVID-19 pandemic has exacerbated this issue in 2020 and 2021, with the almost total loss of NSO revenues related to hosting sporting events.
Several of the funded organizations stated that they would like SC to use multi-year funding agreements, which would greatly reduce the burden associated with preparing annual SSP funding applications. SC key informants indicated this option is being considered as part of the new funding framework.
The funded organizations also urgently called on SC to release the new funding framework.
Most organizations are supportive of SC’s Report Card initiative. This is a multi-phase initiative that is monitoring the performance of funded organizations in three areas: culture, people and systems (Canadian Heritage, 2020c). Round one was completed in 2019 and examined culture, consisting of sport integrity and good governance. Organizations were required to submit documentation and were rated against a set of criteria, based on a maturity model methodology (ratings on a six-point scale, from “no progress” to “excellent”).
Some key informants raised an issue with the current taxonomy used by SC to classify MSOs. There are two different categories of MSOs: those that provide services to the sport community (e.g., Coaching Association of Canada) and those that provide sports-related programming (e.g., KidSport). The suggestion was made that SC could create two categories of MSOs and apply a different accountability framework to each. Some of the Report Card criteria, such as safe sport policies and gender equity targets for members, are applicable to organizations with broad-based memberships (e.g., many of the NSOs) but are less relevant to organizations whose members are solely members of their governing boards.
4.3. Does the program support government priorities?
Evaluation Question: To what extent does the program support government priorities?
The SC programming has made some progress in addressing such government priorities as gender equity, official languages, diversity and inclusion, reconciliation with Indigenous peoples, and accessibility. While the Report Card initiative (round one in 2019) gave generally low ratings of the performance of NSOs, MSOs and CSCs/CSIs in these areas, the evaluation found that several of organizations are embracing the government’s objectives for gender equity in the sport system. The overall view of key informants is that SC could do more to spur funded sport organizations to take action with respect to gender equity, diversity and inclusion.
To varying degrees, the SC programming is supporting key government priorities of gender equity, official languages, diversity, reconciliation and accessibility.
Gender equity
SC programming promotes gender equity, especially through the Gender Equality in Sport Initiative that was launched in 2018-19 (this initiative is discussed further in Section 5.4).
Canadian Women & Sport is conducting gender equity audits and is seeing encouraging progress. The Report Card initiative (fall of 2019) assessed the performance of NSOs, MSOs and COPSIN by examining gender equity of the board of directors, leadership, technical experts and staff in the organizations. The lowest rating was for the technical experts associated with NSOs. Several of the MSOs and NSOs interviewed noted that their boards of directors are highly interested in achieving gender equity at all levels of their organizations, from the board to staff to athletes and support personnel.
One key informant from an NSO dedicated to para sport noted the difficulty in recruiting and retaining female participants to its sport and welcomed the SC’s focus on gender equity.
SC indicated that the gender breakdown of carded athletes receiving assistance through the AAP in 2017 was approximately 50/50; however, many more male than female athletes with a disability were receiving funding.
SC noted that the HP strives for gender equity in high visibility events, funding men’s and women’s sports.
Official languages
SC programming places emphasis on supporting both official languages, although there are challenges.
The Report Card examined the quality of official languages policies in the sport organizations. A low rating of “insufficient” was given to the sport system (i.e., across all of the NSOs, MSOs and COPSIN). This poor result has prompted the funded organizations to improve their practices, e.g., by ensuring all policy documents are available in both official languages on their websites. Key informants noted that the SSP has earmarked funding for the translation of materials by the funded sport organizations.
SC key informants noted that the HP has explicit requirements in its ISSE funding applications requiring NSOs to reach out to official language minority communities (OLMCs), e.g., to include volunteers representing OLMCs at events. Funded recipients are expected to comply with the official languages requirements set out in their application and funding agreement.Footnote 13
According to the 2019-20 Status of the High Performance Athlete Survey, high performance athletes are reasonably satisfied with their access to services in their language of choice. Nearly two in three (64%) rated themselves as highly satisfied with the access to services in the official language of their choice from their Canadian Sport Centre/Canadian Sport institute, while six in ten (59%) rated themselves as highly satisfied with the services they receive from their NSO. According to key informants, providing services in both official languages has been challenging for some NSOs.
Key informants representing the P/Ts noted that little is being done at the provincial or territorial level to encourage greater participation by OLMCs. Among the reasons given were a lack of resources, small official language communities in some provinces, and in one case, because jurisdiction over official language communities resides within a different ministry. It was noted that the Canadian territories are home to multiple Indigenous language groups as well as official language minority groups.
Diversity and Inclusion
The Report Card examined the quality of the diversity and inclusion policies of funded sport organizations. The sport system received a low rating of “insufficient”. Several of the key informants representing sport organizations commented that their boards of directors are taking action to promote diversity in the workplace, for example, by conducting diversity audits. They suggested that SC could take a leadership position in mandating all funded sport organizations to take action in this area and to publish diversity statistics for all funded sport organizations.
Reconciliation
The Indigenous Youth in Sport initiative was developed to address several of the Truth and Reconciliation Commission’s Calls to Action. Budget 2017 announced investments to support Indigenous children and youth sport initiatives at the community level. Overall, the four-point approach of the investment was designed in collaboration with the Aboriginal Sport Circle (ASC), and captures the essence of the Truth and Reconciliation Commission’s (TRC) Calls to Action relating to Sport and Physical Activity (#87-91). It is addressed in more detail in the effectiveness section of this report.
Accessibility
SC issued a Policy on Support for Persons with a Disability in 2006. Several of the funded sport organizations have taken actions to ensure their services are accessible to persons with a disability and have published a policy on accessibility on their websites. In the area of anti-doping, it was noted that the Canadian Anti-Doping Policy (CADP) reflects the World Anti-Doping Agency's International Standard for Testing and Investigations (ISTI), Annex 6B: Modifications for Athletes with Impairments. Canadian Tire JumpStart has a national program to install new playground infrastructure in Canadian communities that are fully accessible.
5. Findings – Effectiveness
This section presents the findings of the evaluation on the evaluation issue of effectiveness. The findings are organized by the three SC programs and their outcomes (immediate, intermediate and ultimate) that are contained in the Grouped Sport logic model (Annex A), followed by the five separately funded TB initiatives.
5.1. Achievement of SSP outcomes
Evaluation Question: To what extent is sport knowledge funded by the SSP developed, disseminated and used?
SSP funds specific initiatives to develop, disseminate and promote the use of sport knowledge in decision-making and policy development. The SSP provides funding to SSHRC to administer the Sport Participation Research Initiative (SPRI), which funds academic researchers focused on enhancing sport participation. The results of this research are presented at an annual conference hosted by the SIRC. There is some evidence that this research is used as input to policy development.
Level of awareness and usage of funded knowledge products
The SSP provides $665K annually to SSHRC to administer the Sport Participation Research Initiative (SPRI), which funds academic researchers focused on enhancing sport participation. Most key informants were familiar with the annual conference hosted by SIRC at which the results of the funded research are presented. This conference serves to build connections between the organizations and the research community, which can lead to future research projects targeted to the needs of these organizations. While there is some evidence that this research is used as input to policy development, key informants noted that one can rarely draw a clear connection between research and policy.
The primary mechanism that the programming uses to develop, disseminate and promote the use of sport research is through the Sport Participation Research Initiative (SPRI), a joint initiative of SC and SSHRC.Footnote 14 Since its inception in 2005-06 to 2018-19, the SSP has provided a total of $8.648 million in funding, an average of $665K per year. The average grant is about $49K.
This initiative supports the objectives of the Canadian Sport Policy by funding academic researchers focused on enhancing participation in sport in Canada. These researchers are expected to participate in an annual SPRI conference, organized by the Sport Information Research Centre (SIRC). The researchers must prepare a short paper targeted at the sport policy and practitioner communities, summarizing the key findings of their research. A total of 178 research papers have been produced from 2006-07 to 2018-19, with 55 produced between 2015-16 and 2018-19. Key informants noted that the results of this research are not available on the SC website.
Most key informants representing the MSOs and NSOs were familiar with the annual research conference. Several stated they had attended the conference in recent years and had a positive experience. They indicated that the main benefit of the conference is to build connections between the funded organizations and researchers, which can lead to future research oriented to the interests of the NSOs.
Key informants from academic fields noted that it is difficult to make a direct link between academic research and policy changes. This perspective was echoed by the SSHRC. Some specific examples of the linkages between research and policy were identified through interviews and these related to the governance of NSOs and MSOs, the impacts of the Olympics, and sport over-competitiveness in youth.
Evaluation Question: To what extent do Canadians, including identified under-represented groups, have opportunities to participate in sport?
SC programming contributes to providing Canadians with opportunities to participate in sport to a certain extent. The Statistics Canada General Social Survey (2016) revealed that 26.7% of Canadians aged 15 and older regularly participated in sport, the first increase in participation since 1992. The Indigenous population had a similar sport participation rate, while those who identify as visible minorities and recent immigrants were slightly less likely to participate. The 2020 Rally Report found that the participation rate of children declined from 74% in 2010-11 to under 60%, with the rate for girls being much lower than for boys. Other research has found that new Canadians are less likely to participate in sports. The barriers to participation are well known in the sport community. The case studies of the F-P/T bilateral agreements in Nova Scotia and the NWT indicate that these agreements are an effective vehicle for sport participation, particularly among under-represented groups, including Indigenous peoples, due to the targeted support via these bilateral agreements.
Availability of data on sport participation
Most key informants agreed that considerable data is available on the level of participation of Canadians in sport and physical activity, but that there are some gaps and much of the data is dated. Several of the funded NSOs and MSOs stated that more frequent data collection would be helpful so that they have better information to support program planning and design.
The main sources of data on sport participation and physical activity are Statistics Canada, via the periodic General Social Survey and the various surveys and studies carried out by the CFLRI. ParticipACTION’s Report Card was also noted (Canadian Heritage, 2020b).
The Statistics Canada General Social Survey (GSS) has been conducted intermittently since 1992, with the most recent survey conducted in 2016. It captures data on sport participation for Canadians ages 15 and above. There reportedly has been little communication between SC and Statistics Canada on how the GSS could best measure sport participation.
The CFLRI is focused on the surveillance and monitoring of physical activity, sport and recreation. The organization provides annual sport participation data to SC on the adult population. The CFLRI used to conduct a separate survey every four years focused on children and youth, called CAN PLAY, but this has been cancelled. Instead, a parent survey will be conducted every two to three years, which will provide a proxy on children/youth participation.
The World Health Organization has rated Canada’s sport and physical activity surveillance system as one of the best in the world. The CFLRI’s research strategy is guided by the F-P/T Sport, Physical Activity and Recreation Council (SPARC). Those key informants who were familiar with the CFLRI’s work commented that they trust this research.
While the data provided by Statistics Canada and CLFRI are not directly comparable due to methodological differences, they do present similar trends. Chapter 5 presents information on trends in sport participation.
Several SC key informants indicated that a long-standing issue is that it is not possible to obtain accurate data on the number of sport registrations, meaning the number of Canadians who are registered with a NSO or PTSO. This is because there is no standardized methodology used by sport organizations to capture this data. Even if each NSO could collect participation data in the same way, it would be difficult to aggregate this data across organizations, due to double counting of individuals who compete in multiple sports. SC key informants stated that data on sport registrations has not been collected from the NSOs for several years, due to the fact that the Sport Funding Accountability Framework (SFAF) has not been revised. Going forward, SC indicated that it plans to change the frequency of data collection from every four years to every two years.
Adding to the complexity of sport participation reporting is the emergence in recent years of private sport organizations that offer children and youth the opportunity to participate in such sports as gymnastics, 3X3 hockey and 3X3 basketball, and climbing. These activities have reportedly skyrocketed during the COVID-19 pandemic, as the organized sport system was shut down and parents searched for safe sport options for their children. Thus, individuals who access these private sector programs would be participating in sport but would not be included in the registration statistics maintained by the NSOs. This topic is discussed further in Chapter 7 on trends and issues facing the sports community.
Several key informants stated that there is a major gap with respect to data on under-represented groups, particularly on youth with disabilities, racialized communities, Indigenous Peoples, and new Canadians. The availability of data related to Indigenous peoples are improving. There is an emerging body of research on the level of involvement of Indigenous people in sport and physical activity, led by such organizations as the Aboriginal Sport Circle (categorized by SC as an “Other Supporting Initiative”) and the First Nations Governance Centre (not funded by SC). Data on participation by gender are said to be available: a prime example being the 2020 Rally Report commissioned by Canadian Women & Sport which examined trends in sport participation among women and girls.
Finally, key informants also noted there is a gap regarding accurate data on the number of coaches at each level of the sport system.
Trends in sport participation rates among Canadians
Available data and key informants point to relatively stable participation in sport overall, but with key differences based on gender and other factors.
The GSS 2016, Canadians at Work and Home, revealed that 26.7% of Canadians aged 15 years and older regularly participated in sport, the first increase in participation reported since 1992. The Indigenous population had a similar sport participation rate (26.1%) to that of the average Canadian. Canadians who identify as visible minorities and recent immigrants were slightly less likely to participate in sport on a regular basis, with respective participation rates of 25.2% and 24.7%. Established immigrants showed lower sport participation rates (16.8%). Participation in tournaments was highest among those aged 15 to 24.
While men were still more likely than women to participate in sports, women’s participation increased from 16.4% in 2010 to 19.7% in 2016. The sport participation rate of French-speaking Canadians increased from 20.4% to 26.1% over the same period, while that of English-speaking Canadians remained fairly stable (29.1%).
According to GSS data, participation was highly concentrated in a few sports in 2016, led by golf (1.3 million adult participants), and ice hockey (1.1 million participants). Other popular sports included soccer (844,383), basketball (661,670) and running (336,437). Soccer was the most played sport by Canadian children, followed by swimming and ice hockey. All of these sports showed increases in participation rates.
Since 2010, there has not been a notable increase in the number of Canadians who are involved in amateur sports as coaches, referees or administrators. The number of spectators decreased slightly, from 40% in 2010 to 38.5% in 2016. Twice as many men as women were involved in amateur coaching, though among 15 to 24 year-olds, female coaches outnumbered male coaches.
Barriers to participation
A variety of factors affect sport participation, which are well known within the Canadian sport system.
According to research, key barriers to more participation in sport include lack of time, cost, availability of facilities, and an aging population. One study of sport participation, based on Statistics Canada data, found that “lack of time” was cited as the most common reason for not participating in sport on a regular basis (29%). The study noted that this could be partly explained by the decreasing amount of leisure time available to Canadians over the last few decades. Footnote 15
According to the GSS survey mentioned above, higher levels of education and higher household incomes correlate to greater rates of regular participation in sport as athletes and coaches. As Canadians age, their rate of participation in sport declines. The case studies revealed that cost poses a significant barrier to participation in sport, even sports not typically associated with high costs, such as basketball. For example, travel to practise and events pose an extra cost; athletes living in remote communities may face higher transportation costs to participate in competitions.
The key informant interviews and the case studies also pointed to the fragile state of sport infrastructure. It was noted that while Infrastructure Canada provides funding to municipalities for infrastructure, this funding is often used for purposes other than sport facilities. Remote communities face even higher challenges with fewer sport facilities such as swimming pools suitable for training and competitions. The lack of access to facilities was said to be limiting the presence of some sports in the Northwest Territories and the growth of some sports such as hockey, overall. There is a need to update many facilities across the country to make them more accessible for such sports as wheelchair basketball, and to accommodate hosting for sports such as swimming. The lack of access to facilities can increase costs of local sport clubs, which are passed on to athletes and their families.
Several key informants commented on the impact of COVID-19 on sport participation. From a high-performance perspective, there is a concern that children and youth have not been participating in organized sports since the pandemic began in March 2020. This could negatively affect their development, and some could turn to other leisure activities. This could result in a gap in the number of high-performance athletes competing in a decade or so from now.
Participation among underrepresented groups
Key informants expressed concern with the declining level of sport participation among children and youth, particularly girls. NSOs interviewed as part of the case studies reported that they are increasing their efforts to introduce new Canadians to sport. Canadians living with a disability face many barriers in sport participation.
The 2020 Rally Report commissioned by Canadian Women & Sport which focused on sport participation by girls ages 6-18, states that fewer Canadian youth are participating in sport. In 2010-11, parents reported 74% of children and youth participated in sport. Based on research conducted in 2020, the study reports that this rate has fallen by at least 14% over the past decade, as under 60% of boys and girls participate in sport now, and the rate is much lower for girls: 57% of young girls aged 6-12, 47% of girls aged 13-15 and 38% of girls aged 16-18 participate in sport. According to the GSS survey, participation rates are higher for children when either one or both parents are involved in sport.Footnote 16
The Institute for Canadian Citizenship published a study in 2014 (Playing Together - New citizens, sports and belonging), which found that a lack of familiarity with information on sports leagues or sports infrastructures discourages participation by new Canadians in organized sports. As a result, new Canadians tend to prefer individual sports. NSOs included in the case studies confirmed this finding and related that they are putting in measures to make their sports easier to discover and understand for new Canadians.
According to Canadian Tire Jumpstart’s 2017 report, Sport as a Tool for Social Change, for many Canadians living with a disability, participation in sport is hampered by a lack of accessible facilities and programs, higher costs for specialized equipment and a lack of coaches able to train persons with disabilities. The case studies revealed that many outdated facilities may not be accessible for athletes with a disability.
Contribution of the F-P/T bilateral agreements to participation
The F-P/T bilateral agreements appear to be a positive mechanism for supporting participation.
The case studies suggest that the agreements and related collaborations encourage greater sport participation by under-represented groups, particularly at the earlier stages of the Long-Term Athlete Development (LTAD) model. SC key informants noted the importance of having targeted resources provided by the Investing in Indigenous Youth and Sport initiative, which provides resources through the F-P/T bilateral agreements for culturally relevant sport programming for Indigenous athletes. Provincial and territorial key informants also noted that sport participation was contributing to increased health and well-being of participants, in communities where this is a challenge.
The bilateral agreement with the Northwest Territories resulted in increased participation among youth in isolated communities, and among youth who are more engaged after having been introduced to new sports they do not usually participate in, including culturally relevant traditional Indigenous games. A key success of the bilateral agreement with the Northwest Territories was said to be the involvement of local community members, which resulted in skills building across the community. The high cost of travel was said to be a constant barrier to participation in the Northwest Territories, for which funding provided through the bilateral agreement was said to be critical to the delivery of sport programs.
The bilateral agreement with Nova Scotia has increased sport participation rates in under-represented and marginalized communities through programs for Canadians, African Nova Scotians, low income families and Indigenous youth. This agreement has contributed to building sport capacity in Indigenous and remote communities. It is also assisting with overcoming the challenges associated with limited sport capacity in Mi’kmaw communities, where turnover of personnel is high, and with the lack of proximity to sport facilities in these communities.
Views of NSOs on the contribution of the SSP to participation
Survey data and case studies on participation demonstrate that the SSP contributes to sport participation in Canada. The greatest impact on sport participation is among women and girls, while the impact on participation by Indigenous peoples and by persons with a disability is much lower.
When asked about the contribution of the SSP to sport participation, 81% of NSOs surveyed indicated that this program has had the greatest impact on women and girls (81% selected to a moderate or great extent), followed by children and youth (70%) and the general public (52%). The impact on participation by Indigenous peoples and by persons with a disability was much lower.
The results of the survey of NSOs conducted by the evaluation show that almost all (96%) reported providing opportunities for participation in sport for women to a great or moderate extent, followed by girls (90%), men (87%), boys (85%) and persons with a disability (62%). However, while the survey results indicate that NSOs are providing opportunities for participation, this does necessarily translate into increased sport participation by these sub-populations.
The case studies of participation in five sports provided information on how the NSOs have worked to increase participation, summarized below.
Hockey Canada promotes the role of women, diverse Canadians and people with a disability in hockey. This NSO works with existing audiences, new audiences and audiences representing diversity and inclusion to recruit and retain hockey players across the country. Its initiatives include Esso Fun Days, providing an introduction to hockey for girls and women, the First Shift program, designed to ensure an accessible and affordable experience for new-to-hockey families, and Try Hockey, a school-based program. The “Dreams Come True” program provides opportunities to participate in hockey to families with financial needs. These programs have attracted over 50,000 new players since 1998. Para hockey programs are offered by all 13 PTSO members of Hockey Canada.
In addition to targeted programs, Hockey Canada is reviewing how it delivers its programs to make them more accessible and thereby encourage greater participation. As it seeks to engage new Canadians, Hockey Canada is making changes to its programs to make them easier to understand. For example, it is renaming its division categories to be simply by age group, as opposed to the traditional peewee and bantam levels. It is also introducing greater flexibility to accommodate the needs of families.
Swimming Canada partners with the YMCA, the Red Cross and the Lifesaving Society to deliver swimming lessons, which results in 2.5 million Canadians participating in swimming annually. The Swimming Canada coach and swimming teacher development system provides professional training, evaluation and development opportunities for members working with swimmers at every stage of development, guided by the Swimming Canada long-term swimmer development model. The Swimming Canada coach and swimming teacher education program is delivered through a multi-partner effort, including provincial swimming organizations, Canadian Red Cross Water Safety and the Lifesaving Society.
Canada Artistic Swimming has developed a program, called AquaGO!, to increase participation in swimming activities. The program introduces children to swimming, builds aquatic literacy and physical literacy, and encourages 5 – 9-year-old girls and boys to develop the fundamental skills to enable participation in aquatic-based activities through their teen and adult years. The organization has been increasing adoption of the program by clubs and municipalities since 2016. The program has been revised to meet the needs of Indigenous communities and new Canadians. Canada Artistic Swimming’s Star Program, which is delivered by local clubs, teaches artistic swimming skills to people of different ages and abilities.
Canada Basketball offers the Jr. NBA Youth Basketball Program, developed in partnership with the NBA, which aims to empower local organizations in more than 300 communities across Canada to provide boys and girls ages 5 - 12 with more opportunities to play basketball. There are currently 20,000 athletes and 1,500 coaches reached through Basketball Canada’s Jr. NBA Youth Basketball program, representing a growth of 33% over the previous year. Basketball Canada also has 11,000 members enrolled in the Game Plan program for coaches and officials.
Wheelchair Basketball promotes participation in wheelchair basketball as well as development of athletes through clubs across the country. The NSO has 2,500 members, up from 1,500 at the time of the previous evaluation in 2015. Growth is occurring among players under 23 years of age, driven by funding for the Canada Games.
Evaluation Question: To what extent are Canadian interests, values and ethics being advanced at home and abroad?
The evidence indicates that SC programming contributes to the advancement of Canadian interests, values and ethics in sport, both at home and abroad. Data on doping control tests provided by the Canadian Centre for Ethics in Sport shows that there are very few anti-doping rules violations annually.
Trends and contribution of SC in doping infractions
Data on doping control tests provided by the Canadian Centre for Ethics in Sport show that there are very few anti-doping rules violations in Canada annually.
Doping infractions in sport provide an indication over time of the extent that values and ethics are being addressed in sport. The Canadian Centre for Ethics in Sport (CCES) administers the Canadian Anti-Doping Program (CADP). The CCES publishes annual statistics on the number of doping control tests completed and the number of athletes who have been sanctioned for anti-doping rules violations.
As shown in Table 9, the CCES performs CADP tests as well as fee-for-service tests conducted on behalf of international sports federations that hold events in Canada. There were 26,352 tests over the five years, an average of 5,306 per year. The number of CADP tests averaged 3,412 per year, which is below the target of 4,000 set by SC to be achieved by June 2021. It is not clear why there was a slight downward trend in the number of tests completed over the five years.
There was a total of 94 anti-doping rule violations over this period, an average of 18.8 per year. The number ranged from a low of 13 in 2016-17 to 31 in 2017-18. Approximately 0.4% of doping control tests resulted in violations. The CCES noted that most of the violations stemmed from fee-for-service tests.
| Number of tests and violations | 2015-16 | 2016-17 | 2017-18 | 2018-19 | 2019-20 | Total |
|---|---|---|---|---|---|---|
| Doping Control tests: # of CADP tests |
3,682 | 3,338 | 3,547 | 3,334 | 3,161 | 17,062 |
| Doping Control tests: # of fee-for-service tests |
1,924 | 1,981 | 1,770 | 2,010 | 1,605 | 9,290 |
| Doping Control tests: total |
5,606 | 5,319 | 5,317 | 5,344 | 4,766 | 26,352 |
| Anti-Doping Rules ViolationsTable 9 note *: # of athletes |
21 | 13 | 31 | 16 | 13 | 94 |
Source: CCES anti-doping control statistics
Table 9 notes
- Table 9 note *
-
Number of violations and sanctions reported during the fiscal year
The CCES statistics also list the number of tests completed for each sport and the number of violations. SC key informants noted that two of the problem sports are university football and bodybuilding. The published statistics do not provide the number of high-performance athletes tested each year, which is a possible gap.
The CCES statistics on tests and infractions do not provide a comprehensive picture of the extent of anti-doping rules violations, because results of tests conducted by other anti-doping testing agencies at some events are not reflected in the CCES statistics. Three of the main global testing providers are: Professional Worldwide Controls (PWC), based in Germany; International Testing Agency (ITA), based in Switzerland; and IDTM, based in Sweden. Key informants noted that these other suppliers may be preferred by some of the international sports federations because they can negotiate a lower price for bulk tests that are conducted in many countries.
The NSO survey asked respondents (n=47) to indicate the extent to which the three SC programs advance a variety of Canadian interests, values and ethics. Overall, the results indicate that SC programming contributes to the advancement of Canadian interests, values and ethics. Respondents agreed (to a great or moderate extent) that the programming: provides a doping free Canadian sport environment (95%); provides a respectful Canadian sport environment, free of harassment and abuse (91%); promotes and generates Canadians’ pride in their athletes and Canadian sport (89%); promotes the values of fair play and respect in sport programs for children and youth (87%); and promotes Canada’s anti-doping position to other countries (80%).
Evaluation Question: To what extent does funding provided through Sport Canada contribute to providing Canadians with access to quality sport programs and services?
The SSP contributes to providing Canadian athletes with access to quality sport programming and services. The evaluation examined the extent to which high performance athletes are being well served by the Canadian Sport Centres/Institutes across Canada. The 2019-20 Status of the High Performance Athlete survey found that, similar to 2014, just over half of athletes say they have been able to access all the needed sport science and sport medicine services from their CSC.
Quality of services provided to athletes
About two thirds of high-performance athletes believe they are being adequately supported in terms of the training support they are provided. Just over one half are able to access all of the necessary sport science and medicine services from their CSC.
According to the 2019-20 high performance athlete survey, the majority of athletes (two out of three) feel that they are adequately supported in terms of the training experience and quality of training. Six in ten (61%) rate the adequacy of access to training facilities high, an increase from 54% in 2014.
Similar to 2014, just over half of athletes say they have been able to access all the needed sport science and sport medicine services from their CSC. CSC sport science services rated most important by both athletes and coaches surveyed are strength and conditioning, nutrition, and sport psychology. The importance of skill and technique analysis increased to 66% from 57% in 2014.
Coaches largely place a higher importance on each service, particularly strength and conditioning, and sport psychology. When asked about services in need of improvement, as with 2014, there is a diverse response across a range of services, with no one or two standing out strongly. Among coaches, far fewer identify the need to improve sport psychology as reported in 2014.
Athletes report that of the sport medicine services provided by CSCs, massage and physiotherapy are the most highly valued.
5.2. Achievement of HP outcomes
Evaluation Question: Extent to which the Hosting Program enables communities to bid for and host international sport events and Canada Games.
The HP provides funding that directly enables communities to bid for and host international sporting events as well as the Canada Games. SC has demonstrated flexibility with its funding for the Canada Games. The HP is well designed with a few issues that could be examined.
Successful and unsuccessful bids supported by the Hosting Program
The HP supported seven organizations with their bids for hosting sport events over the evaluation period. SC has demonstrated flexibility with its funding formula for the Canada Games.
Of the seven bids, three were successful and the events have since been held: the 2017 North American Indigenous Games (NAIG) held in Toronto; the 2018 South Slave Arctic Winter Games; and the 2018 United bid from the U.S., Canada and Mexico for the 2026 FIFA World Cup.
Two of the bids were successful but the events have been postponed due to the COVID-19 pandemic: the 2020 NAIG in Kjipuktuk (Halifax) and Millbrook, Nova Scotia and the Whitehorse 2020 Arctic Winter Games.
The Calgary bid for the 2026 Olympic Winter Games was not successful following a plebiscite in Calgary held in November 2018. Finally, the 2021 Francophonie Games were awarded to Moncton-Dieppe but were subsequently cancelled by the New Brunswick Government due to increased costs.
The Canada Games have been held every two years since 1967, alternating between the Canada Winter Games and the Summer Winter Games (the 2021 Canada Winter Games have been moved to 2022 due to the pandemic). The Canada Games are not covered by the Hosting Policy. SC key informants indicated that a graduated funding formula has been put in place, to enable the Government of Canada to provide a greater level of support for events hosted by smaller provinces. Key informants complimented SC for being flexible with its funding formula.
Sport Canada is working on a national hosting strategy with stakeholders, including a results and data model, in order to determine the information that should be gathered to inform decision-making and funding.
Suggested improvements to the Hosting Program
The HP is viewed as being well designed, with a few issues could be examined.
The Federal Policy for Hosting International Sport Events (Hosting Policy), last updated in 2008, provides a framework for the delivery of the HP. SC key informants shared a view that the Hosting Policy is well designed, but certain elements restrict the ability of the HP to support events that could advance sport participation for Canadians.
Internal key informants indicated that the Hosting Policy is overly prescriptive in terms of specifying eligible events for funding as well as its funding formula. The Hosting Policy specifies targets for the number of events to be held in Canada, as follows:
- Two International Major Multisport Games every ten years.
- One large International Single Sport Event every two years.
- Thirty or more small International Single Sport Events each year.
- International Multisport Games for Aboriginal Peoples and Persons with a Disability (Arctic Winter Games, North American Indigenous Games, the Deaflympics and the Special Olympics World Games).
Through the HP, SC is unable to support other large-scale international events. One example of a more recent event that is excluded from consideration is the World Indigenous Games. Another is the Invictus Games, an international multi-sport event in which wounded, injured or sick armed services personnel and their associated veterans take part in many sports, including wheelchair basketball, sitting volleyball and indoor rowing.
Because SC lacks a sport participation strategy, it is not clear whether the Hosting Policy and HP should be revised to permit the support of events that may not target excellence and high-performance athletes, but which may support SC’s sport participation objective.
The HP also prescribes a funding formula. For funding over $250,000, the Government of Canada’s contribution is limited to a maximum of 35% of total event costs and will not exceed 50% of the total public sector contribution to event.
A design issue with the HP is that all funded ISSE events must be governed by an NSO. This prevents the program from supporting events hosted by other organizations, such as the X Games, which are hosted by ESPN and are very popular among the Gen X and Y demographic. SC is considering de-linking the SSP and the HP, in order to support organizations other than NSOs to host events.
The HP’s budget has remained stagnant for several years, despite an increasing volume of applications from NSOs and increasing costs of hosting sport events. Once events are held again following the pandemic, facility costs will increase as they will likely need to be designed to comply with new health and safety protocols. Revenues may also be constrained, as in person attendance may be restricted for some time and associated participation events in the community may be scaled back.
SC key informants also noted that the HP has always had a funding pressure under the F-P/T commitment to solely fund participant travel for the Canada Games, which continues to be an unfunded pressure for the HP.
Evaluation Question: Extent to which the funded organizations provide sport development and competitive opportunities.
The HP funded a total of 411 ISSE events over the five-year evaluation period, with just over one half of NSOs holding an ISSE each year. The vast majority of ISSE applications from NSOs are approved each year. The amount of funding devoted to the ISSE component has remained constant for many years.
ISSE events hosted by NSOs
The HP funded a total of 411 ISSE events over the five-year evaluation period, with just over one half of NSOs holding an ISSE each year. The vast majority of ISSE applications from NSOs are approved each year.
The HP’s ISSE component provides funding to the NSOs to host competitive events. A total of 411 sport events were funded through the HP ISSE component over the five years (Table 10). The number of funded events ranged from a low of 71 in 2015-16 to a high of 96 in 2018-19. The number of NSOs that host ISSEs has remained fairly stable, averaging 33 per year. This represents on average of 57% of the total number of NSOs (58).
| Hosting Year | Number of Funded ISSEs | Number of NSOs hosting ISSEs | Percentage of NSOs that host ISSEsTable 10 note * |
|---|---|---|---|
| 2015-16 | 71 | 32 | 55% |
| 2016-17 | 81 | 33 | 57% |
| 2017-18 | 89 | 35 | 60% |
| 2018-19 | 96 | 34 | 59% |
| 2019-20 | 74 | 31 | 53% |
| Total/Average | 411 | 165 | 57% |
Source: HP program.
Table 10 notes
- Table 10 note *
-
SC funds approximately 58 NSOs.
SC key informants stated the HP faces funding pressures to fully meet its objectives and that they are not able to fully fund events. Because additional funding is being devoted to the Canada Games, this is reducing the amount of funding to major ISSE events. There is a belief within SC that NSOs view ISSEs to be more important than the Canada Games in terms of preparing elite athletes to compete at the Olympics.
A large majority of ISSE applications (88%) were approved for funding over the five years, although the percentage of approved ISSE applications has declined over the period, ranging from 94% in 2015-16 to 80% in 2019-20 (Table 11).
| Hosting Year | # of ISSE Applications | Approved (#) | Approved (%) | Rejected (#) | Rejected (%) |
|---|---|---|---|---|---|
| 2015-16 | 79 | 74 | 94% | 5 | 6% |
| 2016-17 | 93 | 83 | 89% | 10 | 11% |
| 2017-18 | 108 | 95 | 88% | 13 | 12% |
| 2018-19 | 110 | 100 | 91% | 10 | 9% |
| 2019-20 | 95 | 76 | 80% | 19 | 20% |
| Total | 485 | 428 | 88% | 57 | 12% |
Source: HP program
Because the numbers of ISSE applications and approvals have increased while the program’s budget has remained constant, the amount of funding requests per event has declined. For example, from 2017-18 to 2019-20, only 29% of applications with requests greater than $50K were fully funded. Clients were advised that, for mid-tier events where the funding cap is $250K, they could expect to receive only between $100K and $200K on average. Consequently, SC key informants stated that NSOs are now applying for smaller amounts and these applications are still not being fully funded.
Evaluation Question: To what extent do Canadian athletes, coaches and officials have opportunities to participate in sport events in Canada, funded by SC?
Overall, the evidence indicates that the HP provides high performance athletes, coaches and officials opportunities to participate in sport events in Canada. High performance athletes are generally satisfied with both the amount and type of competition experience they are getting; coaches were somewhat less satisfied. The HP enables about 36% of carded athletes to compete in ISSE events each year; these events provide opportunities for even more non-carded athletes. NSOs indicated that HP funding contributes to a moderate or great extent in providing opportunities for athletes, coaches and officials to participate in sport events in Canada. They indicated fewer opportunities are provided for Indigenous athletes.
Participation by athletes in ISSEs
The HP collects data from NSOs on the number of carded and non-carded athletes participating in ISSE events. Over the evaluation period, just under 700 (696) carded athletes participated in ISSE events each year on average, which represented roughly 36% of the total of 1,955 carded athletesFootnote 17.
Many more non-carded athletes participated in ISSE events. Over the evaluation period, over 2,800 (2,853) non-carded athletes participated in these events each year on average. No figures are available on the total number of non-carded athletes.
SC key informants indicated that ISSE events are important for providing elite athletes with the opportunity to go on to win medals at the Olympics and Paralympics. It is important to note that NSOs can only host so many events, as the number of events hosted in Canada is subject to predetermined competitive circuits, as international competitions typically rotate from country to country.
The 2019-20 Status of the High-Performance Athletes survey asked athletes to rate the adequacy of the amount and type of competition experience they are getting. The results were positive: 64% rated the adequacy of competition experience as high (6 or 7 on the 7-point scale) and 63% rated the type of competition experience as high.
However, the survey found that coaches were less positive than athletes: 38% rated the amount of competition experience and 49% rated the type of competition experience they are getting as high.
Contribution of the HP to participation
The NSO survey asked respondents to rate the extent to which the HP contributes to providing opportunities for athletes, coaches and officials to participate in sport events in Canada.
As shown in Table 12, virtually all NSOs (98%) indicated that HP funding contributes to a moderate or great extent for high performance athletes, with the same percentage for female athletes. Next were coaches (95%), followed by developing athletes (80%) and athletes with a disability (64%). The HP was viewed as providing fewer opportunities for Indigenous athletes (19%); however, 17 of the NSOs did not answer this question, indicating they do not host events for this group of athletes.
| Group | Not at all | To a small extent | To a moderate extent | To a great extent | Total (%) | n |
|---|---|---|---|---|---|---|
| Developing athletes | 2.4 | 17.1 | 24.4 | 51.6 | 100 | 41 |
| High-performance athletes | 0.0 | 2.4 | 9.8 | 87.8 | 100 | 41 |
| Female athletes | 0.0 | 2.5 | 17.5 | 80.0 | 100 | 40 |
| Athletes with a disability | 27.3 | 9.1 | 21.2 | 42.4 | 100 | 33 |
| Indigenous athletes | 29 | 51.6 | 16.1 | 3.2 | 100 | 31 |
| Coaches | 0.0 | 4.9 | 36.6 | 58.5 | 100 | 41 |
| Officials | 0.0 | 5.0 | 22.5 | 72.5 | 100 | 40 |
5.3. Achievement of AAP outcomes
Evaluation Question: What portion of the incremental cost of training and competition is offset for carded athletes?
The AAP payment covers 62% of an athlete’s sport-related expenses for carded athletes, which is below the 70% target set by SC. The AAP’s payment to carded athletes was increased from $1,500 to $1,765 monthly for Senior Cards following a 2017 Budget announcement. Athletes’ sport-related expenses have increased substantially over the past few years.
The AAP provides funding to carded athletes to offset the costs of training and competition. The monthly stipend increased to $1,765 in 2017-18 from $1500 that had been in place since 2004.
The AAP payment covered 67% of their sport-related expenses in 2014. The 2014 Status of the High-Performance Athlete Survey found that the average annual income of AAP athletes was $25,616, of which $11,746 was provided by the AAP, and their average annual sport-related expenses were $17,520.
The program set a target of 70% to be achieved by June 2021 (Canadian Heritage, 2019, p. 99). The AAP payment dropped to 62% of sport-related expenses in 2019-20, which is below the target. The 2019-20 Status of the High Performance Athlete Survey found that athletes reported an average annual income of $25,858 for 2018. Sport-related expenses have increased substantially in the past few years and were at $22,216 in 2018.
Evaluation Question: To what extent do athletes receive sufficient financial support to pursue academic opportunities?
The AAP provides funding to help some athletes with their education. The AAP stipend to cover the cost of tuition is $5,500, which covered 84% of the cost for post-secondary undergraduate tuition in 2020-21. This is very close to the program’s target of 85% to be achieved by June 2021. The 2019-20 Status of the High Performance Athlete Survey found that less than half of athletes reported that the AAP is assisting (or has assisted) them in pursuing post-secondary education.
The AAP provides tuition support to help carded athletes obtain a post-secondary education. Tuition support is provided in two forms: tuition for carded athletes and deferred tuition support for athletes who are no longer carded. Deferred tuition funding assists athletes who were unable to pursue full-time post-secondary education while they were carded because of their involvement in high performance sport.
Stemming from Budget 2017, the total AAP budget devoted to tuition support increased from $2.5 million to $2.75 million, to represent just over 8% of the total budget. The program set a target of 9% to be achieved by June 2021.
The AAP funding level for tuition increased from $5,000 to $5,500 per year in 2017. This $5,500 stipend covered 86% of the average tuition fees for undergraduate programs in 2016-17 when the average fees were $6,375. In 2020-21, when fees rose to $6,580 Footnote 18, the AAP support for tuition covered 83.6% of the cost. This is slightly below the target of 85% set by the program to be achieved by June 2021. The lifetime maximum of $25, 000 was also increased in 2017 by $500, and will continue to increase each year until the lifetime maximum reaches $27,500.Footnote 19
The 2019-20 Status of the High Performance Athlete Survey found that less than half of athletes reported that the AAP is assisting (or has assisted) them in pursuing post-secondary education (note that this survey does not poll retired athletes).
Evaluation Question: To what extent are athletes progressing through the carding system?
SC programming contributes to helping carded athletes progress through the high performance system. The rate of progression has slowed since 2012 although it is not possible to provide an explanation. Eligible athletes hold Senior International Cards for about five years, which has remained constant for many years. SC key informants agreed that this outcome should be changed to focus on whether athletic performances are improving over time.
Progression of athletes through the carding system
While the evidence indicates that high performance athletes progress through the carding system, the rate of progression has slowed. Athletes that are at the Senior International Card levels hold their cards for about five years, which has not changed compared to the period covered by the previous evaluation. SC key informants agreed that these indicators are not good measures of athlete progression.
The AAP identifies and supports athletes who are already at, or have the potential to be in, the top 16 in the world in their sport. These athletes are categorized by awarding cards as follows:
- Development Cards (D Cards).
- Senior National Cards (SR and C1 Cards).
- Senior International Cards (SR1 and SR2 Cards).
All athletes that are carded (funded) must meet minimum standards every year, and they are expected to improve each year.
Table 13 presents data indicating that progress through the carding system has slowed over time. For example, 28.0% of athletes carded in the first quadrennial (2012 to 2015) had progressed to the next level by the end of this quadrennial, which declined to 20.6% in the last quadrennial (2015 to 2018). The previous evaluation also noted a downward trend from the 2008 to 2011 quadrennial to the 2011 to 2014 quadrennial (Canadian Heritage, 2016, pp. 61-62) but no explanation was provided.
| Quadrennial | # of athletes first carded in that period | # of athletes that progress to next level | % of athletes that progress to next level | # of athletes that start at SR1 in that period | # of athletes that were first carded in that period & that eventually progress to SR1 | % of athletes that were first carded in that period & that eventually progress to SR1 |
|---|---|---|---|---|---|---|
| 2012-15 | 1,852 | 519 | 28.0 | 37 | 272 | 14.7 |
| 2013-16 | 1,882 | 506 | 26.9 | 35 | 233 | 12.4 |
| 2014-17 | 1,844 | 440 | 23.9 | 28 | 185 | 10.0 |
| 2015-18 | 1,834 | 377 | 20.6 | 28 | 134 | 7.3 |
Source: Custom report from AAPMIS provided by SC
As shown in Table 14, athletes at the Senior International Card levels (SR1 and SR2) hold that level for about 5 years, which is the same as the figure reported by the previous evaluation for the period 2011-12 to 2013-14.
| Card elements | 2014-15 | 2015-16 | 2016-17 | 2017-18 | 2018-19 |
|---|---|---|---|---|---|
| Development | 427 | 382 | 365 | 400 | 373 |
| Senior | 177 | 250 | 150 | 171 | 155 |
| Total | 604 | 632 | 515 | 571 | 528 |
| Avg. # of years SR1 and SR2 carded athletes held this level | 4.89 | 4.65 | 4.68 | 4.66 | 5.1 |
Source: Custom report from AAPMIS provided by SC
There is evidence that this expected outcome and indicator for the programming may be weak and do not reflect the complexity of athlete performance. SC key informants as well as one of the NSOs commented that the outcome and indicator should be revised because athletes typically do progress from a Developmental Card to a Senior National Card to a Senior International Card. An athlete who enters at the D Card level is expected to meet certain standards in order to progress; if this does not occur, the athlete is dropped. Some athletes come in at the top level but do not stay there and drop a level. Others may come in at a D level and retire and thus never progress.
Evaluation Question: Extent to which Canadian athletes have improved performances at the Olympics, Paralympics and Senior World Championships
Canada’s medal success at the Summer Olympic Games has improved slightly since 2000, while success at the Winter Olympic Games has remained about the same. Canada’s performance at the Winter Paralympics has improved since 2010; performance at the Summer Paralympics has declined substantially in the last two events (2012 and 2016). Canada’s overall sport ranking internationally for Olympic sport declined in 2018-19 and 2017-18, as did Canada’s ranking for Paralympic sport.
Medals success at the Olympics and Paralympics
Canada’s performance at the Summer Games has improved slightly since 2000, while performance at the Winter Games has remained about the same. Canada’s performance at the Summer Paralympics has declined substantially since 2010.
The total number of medals, the medals rank and the total medal points have all improved. Canada’s performance at the Winter Games has remained stable. Refer to Table D-1 in Annex D for further data on Canada’s historic medal performance at the Winter and Summer Olympic Games.
While Canada’s performance at the Winter Paralympics improved from a third-place finish in 2010 and 2014 to a second-place finish in 2018, Canada’s performance at the Summer Paralympics has declined substantially in the last two events. Table C-2 presents Canada’s medal performance at the Paralympic Games.
Canada’s overall sport ranking internationally
Canada’s overall sport ranking internationally for Olympic sports declined in 2018-19 and 2017-18, as did the country’s ranking for Paralympic sport.
SC tracks Canada’s performance internationally, based on the results of all nations across all Olympic events at the Olympic Games and Senior World Championships. The following metrics are tracked: number of gold medals and all medals, number of top 8s, and number of top 8 points.Footnote 20 These metrics are tallied at the end of each calendar year, and the results are aggregated with the results over the previous three years to produce a comprehensive four-year cycle of results. Comparable results are not prepared for Paralympic sport performance.
Canada’s ranking in 2018-19 and in 2017-18 was lower as compared to 2016-17. Canada’s ranking relative to other countries in the Combined Ranking Index for Olympic Sport was ninth in 2018-19 and also in 2017-18, while in 2016-2017, Canada ranked seventh on this index. The full data are presented in Table C-3.
Canada’s ranking relative to other countries in the Combined Ranking Index for Paralympic Sport was fourteenth in 2018-19 and in 2017-18, a drop from 2016-2017 when Canada ranked seventh on this index.
Evaluation Question: To what extent do Canadian athletes have the resources to achieve higher levels of athletic performances?
Through its targeted funding supports, the AAP helps Canadian athletes achieve higher levels of athletic performance. However, athletes continue to face financial pressures that could affect their ability to compete.
Contribution of the AAP to athletic performances
The 2019-20 Status of the High Performance Athlete Survey found that over four in five athletes (83%) agree that the AAP has made it possible to achieve higher levels of athletic performance.
This is very close to the target of 85% set by the program to be achieved by June 2021.
Coaches were in relatively similar agreement at 86%.
AAP’s coverage of athletes’ expenses
Because athletes’ living and sport-related expenses have increased substantially in recent years, athletes are facing a deficit of about $1,800 per month, or close to $22,000 per year. This is a considerable increase compared to the deficit reported in the previous 2013-14 survey.
Although athletes are operating in the red, they reported that money is typically not a large barrier to accessing most of the basic necessities and other things they need to concentrate on and excel in sport.
The 2019-20 Status of the Athlete Survey reported that carded athletes had an average annual income of $28,858 for 2018. The largest proportion of this income was derived from federal and/or provincial athlete assistance programs. The average is $13,613 annually from SC’s AAP and $3,689 from Provincial Assistance.
Expenses were close to $4,400 per month and have increased more than 15% since 2013-14. In particular, shelter costs increased considerably (over 35%), followed by both living expenses and sport-related expenses, which have gone up by about 15% since 2013-14.
Overall, athletes were spending over $600 a month more in 2018 than they were in 2013-14.
This picture of increasing expenses but stable income leaves athletes facing a deficit of $1,800 per month, or close to $22,000 a year. This is a considerable increase in the deficit athletes reported in 2013-2014 ($15,300 in 2019 constant dollars).
Although athletes are operating in the red, money is typically not a large barrier to accessing most of the basic necessities and things that athletes need to concentrate on and excel in their sport. That being said, some athletes (about one in five) see money as a strong barrier to international competitions and sport medicine services.
5.4. Achievement of short-term outcomes of TB investments
Evaluation Question: What progress has been made in achieving the short-term outcomes of the Support for High Performance Athletes Initiative?
With new funding provided to the AAP over the period of evaluation, this program has made some progress in achieving its short-term outcome of alleviating the financial burdens faced by high performance athletes. However, ever-rising costs present challenges for the program to keep pace.
As described in Section 2, Budget 2017 announced an additional $5 million in ongoing funding for the AAP to ensure that the program adequately supports high performance athletes by alleviating their financial burden. This increased AAP’s budget from $28 million to $33 million annually. Beginning in 2017-18, the monthly living and training allowance paid to athletes was increased from $1,500 to $1,765 for Senior Cards (SR1, SR2, SR) and from $900 to $1,060 for Development Cards (D). The monthly stipend had not been increased since 2004.
The periodic Status of the High Performance Athlete Survey asks questions pertaining to financial hardship. The 2014 survey found that about one in three athletes (35%) agreed that the funding provided by the AAP was sufficient to meet their living and training needs. The 2019-20 survey found that 41% of athletes agreed, constituting a small improvement in this metric, suggesting that the increase in the stipend is having a small but measurable impact on alleviating the financial burden. This percentage exceeded the target of 40% set by SC.
Key informants both within and outside SC commented that the increase in the AAP’s budget and the resulting rise in the stipend paid to high performance athletes was long overdue and has helped to alleviate their financial burden. Several key informants both within and outside SC recommended that the stipend should be increased every few years to account for inflation and the ever-increasing costs related to training and competitions.
Evaluation Question: What progress has been made in achieving the short-term outcomes of the Gender Equality in Sport initiative?
Progress is being made in achieving the short-term outcomes of the Gender Equality in Sport Initiative. Key informants expressed strong support for SC’s leadership, although some stated that the timeframe for achieving gender equity by 2035 should be advanced. Key informants recommended that SC publish statistics on the progress made by funded organizations. There is a concern that the initiative’s funding will sunset in 2021-22 and that the momentum that has been built will dissipate.
As described in Section 2, Budget 2018 announced an investment of $30 million over three years (ending in 2021-22) with the goal of achieving gender equity in all facets of sport by 2035. The four-pronged strategy focuses on:
- Increasing women in coaching, officiating, and leadership positions in sport.
- Delivering measures to increase the participation of girls and women in sport.
- Addressing gender-based violence (GBV) in sport.
- Improving the availability of research and data to support evidence-based decision-making.
Overall, key informants from the NSOs and MSOs expressed strong support for the Gender Equality in Sport Initiative. Some stated that the Government’s goal to achieve gender equity by 2035 is too long a timeframe. A suggestion was made that SC should reduce the level of SSP funding to the NSOs and MSOs that are not making sufficient progress in implementing gender equity on their boards, at their management levels and among their athlete support personnel (coaches, officials, etc.). The suggestion was also made that SC should be publishing data on the status of gender equity in all funded sport organizations.
Finally, several key informants expressed concern that funding for the initiative sunsets in 2021-22. One interviewee from an MSO noted that there is currently significant momentum because of funding and political will but that this could change when the targeted funding disappears.
The findings on each of the short-term outcomes of the Gender Equality in Sport Initiative are summarized below and are based on the interviews conducted with Canadian Women & Sport (CWS) and with a sample of NSOs and MSOs. SC has not yet compiled any data on these performance indicators.
Gender equity audits by Canadian Women & Sport
The Gender Equality in Sport Initiative set a target that 20% of NSOs and MSOs would be audited by the CWS by April 2020. This target was not achieved, as the CWS was only ramping up its audit program in late 2020 and into 2021. As of December 2020, the CWS reported that 30 organizations had been scheduled for an audit in 2020-21, with a few having been completed or in progress at the time of our interviews. Evidence suggests that this target will be achieved during the next two years.
Most key informants from the Canadian sport system were unaware of these audits, likely due to the fact that they had not yet been contacted by the CWS to schedule the audit. This low level of awareness may be due to the fact that the CWS has recently ramped up the audit program.
The CWS has some anecdotal evidence of positive impacts resulting from these audits, with organizations approaching the CWS with action plans and asking for assistance with their implementation.
GBA Plus training by sport organizations
The Gender Equality in Sport Initiative set a target that 40% of NSOs and MSOs would complete GBA Plus training by April 2020. While this target was not achieved, it appears progress will continue into 2021-22. Funding was provided to the CWS to develop a GBA Plus training module. As of December 2020, there had been 1,800 purchases, mostly at the national level of the sport system, and several hundred individuals had completed the module. Those organizations selected by the CWS to be audited are provided with access to the online tutorial in advance. Thus, by embedding the e-module in the audit, this ensures all Board members and employees will complete the training in advance of the audit.
However, few key informants representing sport organizations were familiar with the GBA Plus training module and some were not familiar with the GBA Plus concept.
Provision of GBV training by sport organizations
The initiative set a target that 100% of NSOs and MSOs would complete gender-based violence (GBV) training by April 2020. SC indicated that the CWS would be providing a system-wide report card on this indicator. This data has not yet been provided.
Addressing harassment and abuse cases
The initiative set a target that 100% of funded sport organizations would establish a contract with an independent third party to address harassment and abuse cases by April 2019. Several of the NSOs and MSOs interviewed stated they had contracted with a third party to handle any harassment and abuse cases. SC key informants noted that this requirement is being made mandatory in all 2021-22 contribution agreements. A system wide report card on this indicator has not yet been prepared.
A research strategy informed by data gaps to guide investments is in place
This part of the initiative called on SC to partner with such organizations as the CFLRI to undertake more research on sport participation by women and girls. As discussed earlier, while some data exists, there are gaps. For example, the Statistics Canada General Social Survey captures data on those aged 15 years and above and this survey is not conducted regularly. Other surveys collect data on physical activity levels and not on sport participation.
The CFLRI reported that several research studies are underway, including a parent survey, which collects information on the experiences, attitudes, barriers and participation of girls in sport. The CFLRI is also conducting secondary analysis of national data sets to examine physical activity and sport experiences of women and girls. Both projects were scheduled to be completed in 2020. A review of the CFLRI website indicates that the research reports for these studies have not yet been published.
On December 20, 2020, the Minister of Canadian Heritage announced the official launch of the Research Hub for Gender+ Equity in Sport, which is being administered by E-Alliance and directed by Gretchen Kerr (University of Toronto), Guylaine Demers (Laval University) and Ann Pegoraro (University of Guelph).Footnote 21
Evaluation Question: What progress has been made in achieving the short-term outcomes of the Next Generation initiative?
It was not possible to assess the progress being made by the Next Generation initiative in achieving its short-term outcomes, as little performance information was available. The performance indicators developed for this initiative need to be revised. There is anecdotal evidence that OTP is seeing a positive trend in the performances of next generation athletes. The survey of NSOs revealed some concerns, with four in ten stating that their sport lacks a sufficient pool of next generation athletes and over half indicating that SSP financial support is not effective in developing this pool of athletes.
The Next Generation initiative supports the next generation of athletes who are five to eight years away from potentially medalling at the Olympic or Paralympic Games. It represents an investment of $25 million over its first 5 years and $5 million of ongoing funding, beginning in 2017-18. This funding is matched by the private sector. The Canadian Olympic Committee (COC) and the Canadian Paralympic Committee (CPC) both committed to matching the funding.
Key informants within SC stated that the 60-70 projects being funded by the Next Generation initiative are on track. However, they also stated that the performance indicators identified for this initiative are not useful (one example is “number of athletes selected by NSOs to engage in Next Generation projects”), and that work is underway in collaboration with OTP to develop a more appropriate set of indicators, such as the percentage of next generation athletes that progress to the Targeted Excellence level.
OTP monitors the performance of the next generation group of athletes and is seeing improvement, in that the top 5 and top 8 results of this group are improving over time. This data is not publicly available.
The periodic SC high performance athlete survey does not cover next generation athletes, so no data is available on the views of this group regarding the athlete support services they receive.
The NSO survey results show that while 61% of respondents somewhat or strongly agreed that their sport has a sufficient pool of next generation athletes, 37% either somewhat or strongly disagreed. In addition, a majority (57%) of NSOs disagreed that the financial support provided by the SSP is effective in terms of developing the pool of next generation athletes.
SC key informants indicated that the relatively small amount of funding devoted to the Next Generation initiative means that many NSOs are provided with little funding to develop these athletes.
Evaluation Question: What progress has been made in achieving the short-term outcomes of the Safe Sport initiative?
The evidence indicates that the Safe Sport initiative is making good progress in achieving two of its three short-term outcomes. The NSO survey found that most have had over 75% of their staff, coaches and athletes complete training on harassment, abuse and discrimination, while progress in training volunteers is much slower. The Canadian Centre for Ethics in Sport indicated that all high performance athletes have completed their e-learning anti-doping course. SC data shows that, as of June 2018, 73% of NSOs had implemented concussion identification protocols that are harmonized with the Canadian Guidelines on Concussion in Sport. In 2019, the SC Report Card initiative gave funded sport organizations a marginal rating for their implementation of a Concussion Return-to-Protocol.
As described previously, Budget 2019 announced an investment of $30 million over five years, starting in 2019-20, to enable Canadian sport organizations to ensure a safe and healthy sport environment. This initiative, referred to as “Safe Sport”, has three areas of focus: 1) support measures to eliminate harassment, abuse and discrimination in sport; 2) improve anti-doping efforts; and 3) address concussions in sport. Because this initiative began in the final year of the evaluation period (2019-20), the evaluation focused on assessing the progress achieved to date in each of these areas. The findings are presented in turn below.
Training on harassment, abuse and discrimination in sport
The intended short-term outcome is for funded sport organizations to promote an environment free of harassment, abuse and discrimination (HAD) through mandatory training. The associated performance indicator is the percentage of the members of funded organizations that have completed HAD training, with a target of 100% by December 2019. “Members” are defined as including athletes, coaches, officials, athlete support personnel, employees and volunteers.
The NSO survey found that almost all NSOs (94%) indicated that over 75% of their staff had been trained, while 79% indicated that over 75% of their coaches have been trained, 64% indicated that over 75% of their athletes have been trained, and only 35% stated that over 75% of their volunteers have been trained. Several key informants from the sport organizations confirmed that they have complied with the HAD training requirement.
SC indicated that a HAD training requirement was added to each NSO’s contribution agreement. SC was not able to verify that all NSOs had ensured that all of their members had completed this training.
At the time of evaluation interviews in early 2021, it was reported that a third party may be engaged by SC to manage the HAD file and to verify that all NSOs have complied with HAD requirements. When implemented, this process would be similar to the approach taken for anti-doping whereby a third party, the CCES, has control over doping control tests, or for coaching certification, where coaches are certified by the Coaching Association of Canada when they have completed the National Coaching Certification Program (NCCP).Footnote 22
Awareness of the risks associated with doping in sport
A second intended outcome of this initiative was for athletes and support personnel to become more aware of the risks associated with doping. Funding was provided to the CCES to develop and implement an e-learning anti-doping platform. The target was 100% coverage of athletes and support personnel by April 2020.
According to the CCES and SC key informants, 100% of high-performance athletes receiving AAP funding have now completed this training. However, the target was not achieved for support personnel such as coaches and high performance directors, with 83% completing the training as of January 2021.
Prevention, detection and management of concussions
The indicator for this outcome is the percentage of NSOs that have concussion identification protocols harmonized with the Canadian Guidelines on Concussion in Sport (2017). Funding was provided via the SSP to NSOs and selected MSOs to put in place a policy that includes protocols harmonized with the Canadian Guidelines on Concussion in Sport.
The target was for 100% of NSOs to have completed this requirement by April 2020. The Report Card (round one in 2019) collected data from sport organizations on whether they had implemented a Concussion Return-to-Sport (RTS) protocol. The Report Card gave an overall rating of “marginal” (2.5 out of 5) to the NSOs, which was defined as having submitted a draft protocol to SC but that it had not been formally approved and shared via their website.
SC data shows that, as of June 2018, 73% of NSOs had implemented concussion identification protocols that are harmonized with the Canadian Guidelines on Concussion in Sport. SC plans to update this indicator in 2021-22.
Evaluation Question: What progress has been made in achieving the short-term outcomes of Indigenous Youth in Sport Investment initiative?
Limited progress has been made in achieving the short-term outcomes of this initiative due to the organizational challenges experienced by the ASC and a lack of performance data on the short-term indicators.
Budget 2017 announced investments of $18.9 million over five years, starting in 2017-18, and ongoing funding totalling $5.5 million every four years thereafter, to support Indigenous children and youth and sport initiatives at the community level. Overall, the four-point approach of the investment was designed in collaboration with the Aboriginal Sport Circle (ASC), and captures the essence of the Truth and Reconciliation Commission’s (TRC) Calls to Action relating to Sport and Physical Activity (#87-91).
The four-point approach of the investment is designed to address barriers that prevent Indigenous children and youth (0-24) from participating in sport by investing in the following areas:
- Indigenous sport leadership
- Culturally relevant sport programming for Indigenous youth and children
- The North American Indigenous Games (NAIG)
- Sport Canada’s data and research.
The evaluation examined the progress that has been made in achieving the short-term outcomes of this initiative. A key data source for activities 1, 2, and 4 was a satisfaction survey co-developed by SC and the ASC. The survey had not yet been developed at the time of our data collection. However, the evaluation team was able to use other lines of evidence to examine activity 1. Activities 2 and 4 will require examination in the next evaluation cycle, and activity 3, the North American Indigenous Games (NAIG), was not applicable, as the games were cancelled due to the pandemic.
The intended short-term outcome for activity 1 of this initiative relates to increasing the capacity of the Aboriginal Sport Circle (ASC) and ensuring stakeholders align their programming with the Indigenous Long-Term Participant Development (ILTPD) Pathway. The short-term outcome is as follows:
- The ASC has the capacity to assume and maintain a national leadership role on Indigenous sport; P/TASBs, NSOs and MSOs align their existing programming with the ALTPD Pathway; and, in collaboration with the ASC, a data strategy is developed.
The ASC has experienced challenges regarding organizational capacity, which has limited its ability to implement the activities related to this initiative. Issues were related to governance, personnel turnover, and leadership. Despite this, from 2017-18 to 2018-19, outcomes were at least partially achieved. As well, ongoing efforts in hiring, in communications with other organizations and in the elaboration of business and operational plans and strategy were made by the ASC to better serve the Indigenous sport community in Canada. The ASC has recently begun to develop an organizational strategy for moving forward in their role as a national leader for Indigenous sport.
The evaluation’s NSO survey also collected information on the state of implementation of this initiative. About one third (35%) of NSOs indicated they are involved in Indigenous sport. Of this group, three quarters (75%) had worked with the Aboriginal Sport Circle and almost all (93%) had worked with Sport for Life.
Those who had worked with the ASC were asked to rate their level of satisfaction with the services provided by the ASC. This group were divided in their views. About one third (36%) were somewhat or very satisfied, while the same percentage were somewhat or very dissatisfied, and 27% were neither satisfied nor dissatisfied.
There was no data strategy available for this evaluation. Further data collection and research will need to be undertaken by SC to determine the progress of this initiative, and to capture the medium and long-term outcomes, as well as the short-term outcomes which were unable to be assessed in this evaluation.
5.5. State of performance measurement
Evaluation Question: What is the state of performance measurement?
The SC logic model and performance measurement framework have not been updated in many years. Since the preparation of the last performance measurement framework, the sports system environment has changed considerably. Current data on many of the performance indicators are not available, which put the onus on the evaluation to fill in gaps where possible. While several SC managers noted they try to provide data in support of the PIP, it is not clear how this information is used or reported. There is no feedback loop that uses performance information as an input into program planning and decision-making.
Several SC key informants commented that SC’s logic model and performance measurement framework need to be totally redesigned. The program’s logic model has not been updated since 2011. Most managers are unfamiliar with the program logic model. It is not being used a tool for program planning and decision-making.
An example of a major gap in the logic model is the Report Card: this is a major data collection initiative that provides important data on the state of Canada’s sport system but the indicators being tracked are not reflected in either the program logic model outcomes or in the PIP.
It was suggested that in redesigning the SC logic model, it could be organized by theme rather than by program, which is the approach taken by the Canadian High Performance Sport Strategy. Thus, a logic model could be developed for SC as a whole, organized by theme, and supported by individual logic models for the themes and programs.
The PIP is extremely lengthy: over 100 pages and some of the indicators are not meaningful, as noted throughout this report. The HP has a project underway to develop a new set of outcome indicators in collaboration with stakeholders. The SC Oversight unit has had a project underway for some time to review the PIP, although this project has been on hold during the pandemic.
Several key informants representing the three programs stated that they provide data to support the indicators in the PIP, but do not know how this data is used or reported. The exception would be the data supplied to support the high-level indicators reported in the annual Departmental Results Report.
Finally, several key informants noted that SC does not have a strategic plan which would identify the strategic priorities for the next few years. Thus, there is no feedback loop between performance measurement and strategic and operational planning and decision-making. Several SC key informants called on management to design and implement a strategic planning process.
6. Findings – Efficiency
This section presents the findings on the evaluation issue of efficiency. The focus was on assessing operational efficiency. A summary of the findings on each evaluation question is provided at the beginning of each sub-section.
Evaluation Question: Are the programs being delivered efficiently?
The evidence indicates that SC delivers the three programs in an efficiency manner, with relatively low administrative costs compared to the amounts of funding delivered and good compliance with service standards. There are opportunities to improve the timeliness of funding decisions and reduce the burden of application and reporting processes.
6.1. Administrative cost ratio
The overall administrative cost ratio for the three programs was 2.8% over the evaluation period, with the HP having the highest ratio.
As outlined in Section 2, a total of $1.1 billion was spent over the five years by the three programs, consisting of $1.0 billion in grants and contributions and $63 million in operating costs. The administrative cost ratio (Vote 1 / Vote 5) remained relatively consistent across the five years, averaging 6% across programming. Administrative costs for the three programs are as follows:
- AAP’s hovered around 2.6% over the evaluation period; this ratio decreased by one half, from 4% in 2015-16 to 2016-17 to 2% in 2019-20.
- SSP’s was 2.8% on average over the five years and it also declined in half in 2017-18, to a low of 2% for the last three years of the period.
- HP had the highest administrative cost ratio of the three programs, ranging from 19% in 2015-16 to a peak of 47% in 2017-18.
6.2. Comparison of planned vs. actual spending
Actual spending was closely aligned with planned spending over the evaluation period, with the overall variance ranging between 5% and 10%.
A comparison of planned and actual spending and human resources is provided in Annex D, Table D-4. The data are drawn from the annual Departmental Results Reports (DRRs). Overall, actual spending and human resources over the evaluation period aligned closely with planned spending and resources for the three programs. The overall variance in G&C and O&M expenditures ranged between 5% and 10%. Only in 2015-16 was there a major lapse of funds of about 10% ($24.2 million). This was attributed mainly to the unused funds as part of the Toronto 2015 Pan American and Parapan American Games.
6.3. Views of NSOs on efficiency
The NSO survey shows a high overall satisfaction rating with the SC programs with 77% somewhat or very satisfied.
NSOs rated most aspects of SC programming highly in terms of efficiency. The elements receiving the highest ratings were as follows: assistance received in completing SSP application/reporting (88% somewhat or very satisfied); timeliness of receiving SSP funding following approval (81%); the funding application process for the AAP (81%); application process for the HP (74%); and the reporting process for the HP (74%).
Two items received relatively lower ratings: the timeliness of funding decisions by the HP (24% were dissatisfied); and the effort required to complete the annual SSP application (19% dissatisfied).
Refer to Annex D, Table D-5 for more information.
6.4. Views of key informants on efficiency
Administration of the SSP is complex and labour intensive, but there appear to be no “quick fixes.” The AAP is widely viewed as being administered efficiently. An issue with the HP is the delegation of signing authority.
- SSP
- The main efficiency issue raised by SC key informants is that the administration of the contribution agreements with each funded sport organization is complex and labour intensive. They noted that in addition to the core funding that is provided, several TB submissions have separate funding envelopes that must be tracked separately. Furthermore, each contribution agreement may have one or more amendments during the funding cycle, a particular issue for Targeted Excellence funding.
- AAP
- Key informants both within and outside of SC agreed that this program is delivered in an efficient fashion. There are 8 FTEs devoted to administering this program, which involves disbursing a total of $33 million in grants to over 1,900 carded athletes, entailing 22,000 direct payment deposits annually. The number of FTEs was not increased following the $5 million increase in the program’s budget beginning in 2018-19. The program is in the process of developing an upgraded database and application process which will further increase efficiency. A proof-of-concept has been developed but this IT project has been delayed due to COVID-19.
- HP
- The main issue raised by SC key informants relates to delegation of signing authority. In the past, funding decisions under $250K were signed off by the SC Director General, while higher amounts were signed off by the Minister of Canadian Heritage. For the latter decisions, there is a requirement to prepare briefing documents, which adds to the length of time to complete the process. However, under new rules, all amounts requested over $100K require Ministerial approval. This has added to the administrative burden and lengthened the turnaround time.
6.5. Performance against service standards
The three SC programs are meeting most of their service standards.
Canadian Heritage establishes service standards to ensure the timely delivery of its funding programs for three transactions: acknowledgement of receipt of application, funding decision and issuance of payments. Service standard results are published every year to ensure accountability to Canadians.Footnote 23 PCH’s goal is that 80% of the applications received by the Department will meet the published service standards for each program and/or program component.
The Department commits to acknowledge the receipt of application forms within two weeks of the date of receipt. The first payment is issued no later than four weeks after the successful fulfillment of the payment conditions. The Department will issue written notification of the funding decision within the program specific timeline: SSP: 20 weeks, AAP: 14 weeks and HP: 26 weeks for all the components.
As shown in Table D-6 in Annex D, while the service standard for acknowledging receipt of applications was met over 80% of the time for all of the SSP, AAP and all HP components except for the IMGAPD in 2018-19 when it was at 50%, this is a standard that should be met 100% of the time.
The funding decision standard was met to a high degree by the programs over most years of the evaluation period (82% to 100%), except for SSP in 2019-20 (66%) and HP ISSE <$50K in 2017-18 (74%). Finally, the service standard for issuance of payments was met to a high degree with no exceptions (92% to 100%) by all three programs.Footnote 24
7. Recommendations, management response and action plan
While Sport Canada has a high-performance strategy, its vision and priorities in other areas, including sport participation, are less clear.
The evaluation found that there is not a common vision for Sport Canada’s role and particularly for broader sport participation. There is a recognition that Sport Canada can – and should – play a wider leadership role in promoting such social development objectives as gender equity, inclusion, and diversity in sport.
Recommendation 1
The ADM, Sport, Major Events and Commemorations, should build upon the findings of this evaluation to develop an overall vision and clear roles and priorities, with particular attention on sport participation and social development objectives.
Management response - Recommendation 1
Recommendation accepted
Sport Canada acknowledges a need for a clear overall vision, roles, and priorities, and has made efforts to establish a link to sport performance as well as to social development objectives. Sport participation exists on a continuum ranging from introduction to sport to high performance sport. Sport Canada acknowledges that where and how it should direct its attention and resources on that continuum should be clarified.
Sport Canada has developed a vision and mission statement, and the 2012 Canadian Sport Policy endorsed by Federal, Provincial, and Territorial Ministers responsible for sport, physical activity, and recreation includes a definition of sport participation. However, clarity must be sought to determine how current programs and potential shifts in priorities address those guiding principles.
Strategies to consult the sport sector and general population are currently being developed in the context of Canadian Sport Policy renewal and will focus on increasing the number and diversity of Canadians participating in sport over the next ten years.
In 2021-2022, Sport Canada is moving forward with the development of a consultation plan on equity, diversity and inclusion in sport, as well as participation in all facets of sport. Funding has been allocated to bring an equity, diversity, and inclusion lens to Sport Canada activities through the active involvement of stakeholders and the Canadian public.
| Action Plan Item | Deliverables | Timeline | ResponsibleTable 15 note * |
|---|---|---|---|
| 1. Revise the Sport Canada mission and vision statement to include clear roles and priorities for the three legislated Sport policy objectives, with particular attention to sport participation. | 1.1 Conduct foresight exercise consultations with internal stakeholders to establish a forward-looking agenda. | April 30, 2022 | Lead: Policy and Planning directorate |
| 1.2 Consultation plan on equity, diversity and inclusion and participation is drafted and implemented. | June 30, 2022 | Lead: Policy and Planning directorate | |
| 1.3 A Sport Canada mission and vision, which align with activities of each funding program, are drafted/revised and approved by the Sport Canada Executive Committee. | August 30, 2022 | Lead: Policy and Planning directorate | |
| 1.4 Sport Canada website is revised to reflect updated mission and vision. | October 31, 2022 | Lead: Policy and Planning directorate in consultation with PCH Communications | |
| 2. Validate or revise current definition of sport participation, including vision, goals, priorities, and roles of current programs. | 2.1 A Sport Canada Participation Strategy is drafted/revised and approved by Sport Canada Executive Committee. | April 30, 2023 | Lead: Policy and Planning directorate |
| 2.2 A Sport Canada Participation Action Plan is drafted and approved by Sport Canada Executive Committee. | October 31, 2023 | Lead: Policy and Planning directorate |
Full implementation date: October 31, 2023
Table 15 notes
- Table 15 note *
-
Policy and Planning directorate has been identified as the Sport Canada lead in the action plan. To ensure successful implementation of the action plan Policy and Planning will work in collaboration with the Sports Programs directorates.
There appear to be issues with the Next Generation Initiative which require further examination.
The evaluation identified potential issues with the Next Generation Initiative that may interfere with developing the next generation of high-performance athletes, which require further examination. In addition, the Next Generation Initiative has a complex and lengthy funding allocation process in relation to its financial resources.
Recommendation 2
The ADM, Sport, Major Events and Commemorations, should build upon the findings of this evaluation to assess the effectiveness of the Next Generation initiative.
Management response - Recommendation 2
Recommendation accepted.
Budget 2017 provided $25 million in matching funding over five years to support athletes who have demonstrated medal potential for the subsequent Olympic or Paralympic Games. The Canadian Olympic Committee (COC), the Canadian Paralympic Committee (CPC), and their respective foundations ($4 million from the COC and $1 million from the CPC) are providing the matching funding from the private sector, from 2017-18 until 2021-22. Over this five-year period, $50 million will be invested in the Next Generation initiative between all funding partners. The funding is now ongoing, as long as it is matched by the private sector.
Sport Canada acknowledges that the Next Generation initiative requires clearer performance indicators to better evaluate the effects of this initiative in developing a pool of next generation athletes and supporting their development towards future international competitions.
To determine the success of the Next Generation initiative, Sport Canada will review the current performance indicators and assess results following the Paris 2024 Olympic and Paralympic Games where results are expected.
| Action Plan Item | Deliverables | Timeline | ResponsibleTable 16 note * |
|---|---|---|---|
| 1. Review and revise Next Generation indicators to align with and better report on objectives. | 1.1 Revised list of indicators is developed and approved by Sport Canada Executive committee. Connects to Recommendation 3. | June 30, 2024 | Lead: Policy and Planning directorate |
| 2. Assess results of the Next Generation initiative. | 2.1 Results of the review, including a list of recommendations, will be presented and approved by Sport Canada Executive committee. | April 30, 2025 | Lead: Policy and Planning directorate |
Full implementation date: April 2025
Table 16 notes
- Table 16 note *
-
Policy and Planning directorate has been identified as the Sport Canada lead in the action plan. To ensure successful implementation of the action plan Policy and Planning will work in collaboration with the Sports Programs directorates.
There are gaps in performance measurement that impact the availability of information for decision-making, and the reporting of results to Canadians.
The current logic model is out of date and is not being used for program planning or performance reporting. Further, logic models for the individual programs and initiatives, together with aligned measurement frameworks, would assist with the tracking and reporting of data. Insufficient data are available across programs and initiatives to fully assess the achievement of results. The indicators for some programs and initiatives, such as the Hosting Program and the Next Generation initiative, are not meaningful and are difficult to track.
Recommendation 3
The ADM, Sport, Major Events and Commemorations should update the Sport Canada logic model and performance measurement framework, and develop a methodology for gathering and reporting program results annually.
Management response - Recommendation 3
Recommendation accepted.
The Sport Canada logic model and performance measurement framework have not been updated in many years, and some of the outcomes in the logic model are not meaningful. As performance indicators and data collection are not aligned, gaps result and tracked indicators may not be reflected in the logic model. As a result, the logic model is not being used for program planning or performance reporting.
Sport Canada is committed to updating the logic model, identifying gaps in the current performance measurement framework, collecting appropriate data to evaluate programs, and determining how to better report results to Canadians.
Sport Canada has a number of strategies and matrices that can be consulted to improve upon how programs report results and measure performance. The Sport Canada Working Group on Indicators will renew its work in consultation with the Sport Canada Data Strategy Work Group, Sport Canada Indigenous Matrix, and bilateral agreements with provinces and territories in order to identify gaps in the current performance measurement framework and determine how Sport Canada can better report results in a meaningful way to Canadians.
Through the Sport Canada Data Strategy Work Group, the branch has started to address issues by working towards having more efficient processes to access, extract and manipulate data. This has included projects such as the integration and centralization of Sport Canada databases using the Office365 platform, optimization of program data via PDF applications (e.g. Sport for Social Development in Indigenous Communities (SSDIC) and Innovation Fund), data clean up of historical funding data from paper into Excel datasets that can be used for trend analysis and historical profiles, and a targeted introduction to data science course for all staff in Fall 2021.
| Action Plan Item | Deliverables | Timeline | ResponsibleTable 17 note * |
|---|---|---|---|
| 1. Review and update overall logic model and ensure that appropriate measures are in place to assess results. | 1.1 Updated and relevant logic model for Sport Canada Branch is developed and approved by Sport Canada Executive Committee. | October 31, 2023 | Lead: Policy and Planning directorate |
| 2. Review and update performance measurement framework. | 2.1 Performance measurement framework is revised and approved by Sport Canada Executive committee. | June 30, 2024 | Lead: Policy and Planning directorate |
| 3. Develop a methodology for gathering and reporting data. | 3.1 Document that outlines, within current systemic constraints, appropriate methods for data gathering, stewardship, and sharing is developed and approved by Sport Canada Executive committee. | October 31, 2024 | Lead: Policy and Planning directorate |
| 3.2 Sport Canada website is revised to provide meaningful reporting that is accessible to Canadians. | December 31, 2024 | Lead: Policy and Planning directorate in collaboration with PCH Communications. | |
| 4. Training for staff on revised logic model and performance measurements. | 4.1 Training sessions to educate staff on the revised logic model/ performance measurements and their roles and responsibilities in receiving data/providing this information for departmental reporting | Logic Model training: April 30, 2024 PMF Training: November 30, 2024 Logic model refresher: December 31, 2024 |
Lead: Policy and Planning directorate |
Full implementation date: December 31, 2024
Table 17 notes
- Table 17 note *
-
Policy and Planning directorate has been identified as the Sport Canada lead in the action plan. To ensure successful implementation of the action plan Policy and Planning will work in collaboration with the Sports Programs directorates.
Annex A – Logic Model for SC Programs (2011)
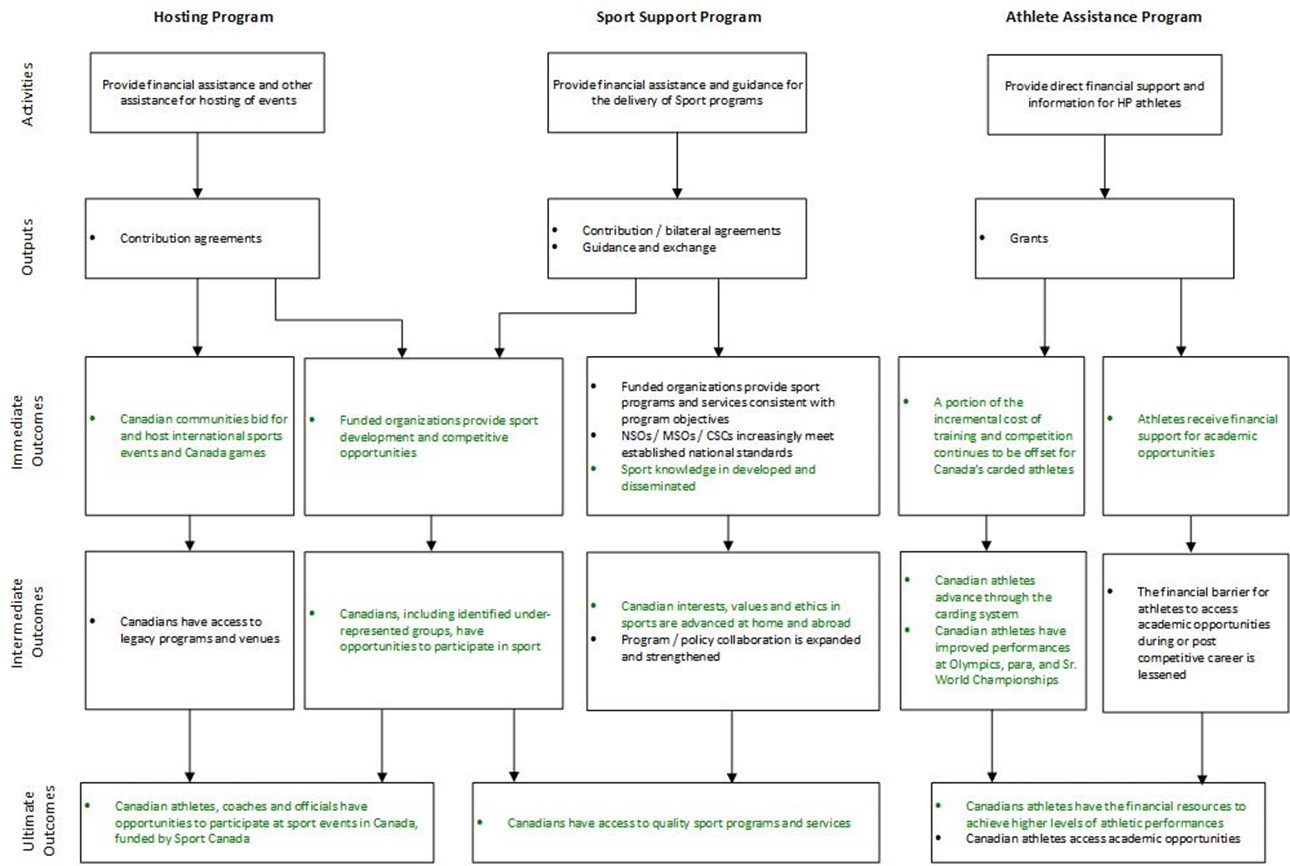
Note: The green text indicates the areas that were examined during the evaluation.
Annex A – Logic Model for SC Programs (2011) – text version
| Hosting Program | Sport Support Program | Athlete Assistance Program | |
|---|---|---|---|
| Activities |
|
|
|
| Ouputs |
|
|
|
| Immediate Outcomes |
|
|
|
| Intermediate Outcomes |
|
|
|
| Ultimate Outcomes |
|
|
|
Annex B – Evidence Matrix
The evidence matrix below presents the evaluation questions and indicators that guided the development of the various data collection tools.
Table 18: evidence Matrix
| Indicators | Document Review | Literature Review | File and Database Review | Key Informant Interviews | Case Studies | Survey of Sports Organizations | Expert Panel (optional) |
|---|---|---|---|---|---|---|---|
| Level of investment of GC and external stakeholder groups in promoting sport participation (1.1.1) | Yes | Yes | Yes | Yes | Yes | - | - |
| Current roles of GC and external stakeholders in sport participation and physical activity (1.1.2) | Yes | Yes | Yes | Yes | Yes | Yes | - |
| Trends in sport participation and in physical activity in Canada by sport and socio-demographic group (1.1.3) | Yes | Yes | Yes | Yes | Yes | Yes | - |
| Views of key informants on appropriateness of the design of the programs in supporting sport participation (1.1.4) | - | - | - | Yes | Yes | - | - |
| Indicators | Document Review | Literature Review | File and Database Review | Key Informant Interviews | Case Studies | Survey of Sports Organizations | Expert Panel (optional) |
|---|---|---|---|---|---|---|---|
| Proportion of funding of sports organizations from SSP (1.2.1) | Yes | - | Yes | Yes | - | - | - |
| Views of sports organizations on importance of program funding (1.2.2) | - | - | - | Yes | Yes | Yes | - |
| Suggested improvements to SSP (1.2.3) | - | - | - | Yes | - | Yes | - |
| Indicators | Document Review | Literature Review | File and Database Review | Key Informant Interviews | Case Studies | Survey of Sports Organizations | Expert Panel (optional) |
|---|---|---|---|---|---|---|---|
| Number of contribution agreements pertaining to priority groups (1.3.1) | - | - | - | Yes | - | Yes | - |
| Views of key informants on extent to which program is responding to Government priorities (1.3.2) | Yes | - | Yes | Yes | - | - | - |
| Extent to which program guidelines, forms and reporting reflects priority groups (1.3.3) | - | - | - | Yes | - | - | - |
| Indicators | Document Review | Literature Review | File and Database Review | Key Informant Interviews | Case Studies | Survey of Sports Organizations | Expert Panel (optional) |
|---|---|---|---|---|---|---|---|
| Number of products developed per year (2.1.1) | Yes | Yes | Yes | Yes | - | - | - |
| Level of awareness of products among target audiences (2.1.2) | Yes | - | Yes | Yes | - | Yes | - |
| Usage of funded products (e.g., number of citations) (2.1.3) | Yes | Yes | Yes | Yes | - | - | - |
| Indicators | Document Review | Literature Review | File and Database Review | Key Informant Interviews | Case Studies | Survey of Sports Organizations | Expert Panel (optional) |
|---|---|---|---|---|---|---|---|
| Number of successful bids with federal funding per year (2.2.1) | Yes | Yes | Yes | Yes | - | - | - |
| Number of unsuccessful bids by communities and reasons (2.2.2) | Yes | Yes | Yes | Yes | - | - | - |
| Strengths and weaknesses of the Hosting Policy (2.2.3) | Yes | Yes | - | Yes | - | - | - |
| Indicators | Document Review | Literature Review | File and Database Review | Key Informant Interviews | Case Studies | Survey of Sports Organizations | Expert Panel (optional) |
|---|---|---|---|---|---|---|---|
| Percentage of athlete expenses covered by the AAP (2.3.1) | Yes | - | Yes | Yes | - | - | - |
| Indicators | Document Review | Literature Review | File and Database Review | Key Informant Interviews | Case Studies | Survey of Sports Organizations | Expert Panel (optional) |
|---|---|---|---|---|---|---|---|
| Percentage of AAP budget allocated to tuition and deferred tuition (2.4.1) | Yes | - | Yes | - | - | - | - |
| Indicators | Document Review | Literature Review | File and Database Review | Key Informant Interviews | Case Studies | Survey of Sports Organizations | Expert Panel (optional) |
|---|---|---|---|---|---|---|---|
| Trends in sport participation rates, by sport and socio-demographic groups, and factors affecting trends (3.1.1) | Yes | Yes | Yes | Yes | Yes | Yes | - |
| Views of funded sports organizations on extent to which the Sport Support Program has provided opportunities for Canadians to participate in sport (3.1.2) | Yes | - | Yes | Yes | Yes | Yes | - |
| Indicators | Document Review | Literature Review | File and Database Review | Key Informant Interviews | Case Studies | Survey of Sports Organizations | Expert Panel (optional) |
|---|---|---|---|---|---|---|---|
| Trends in the number of Canadian athletes who have tested positive for a doping infraction (3.2.1) | Yes | Yes | Yes | Yes | Yes | Yes | - |
| Percentage of members of funded organizations who have completed training on harassment, abuse and discrimination in sport (3.2.2) | Yes | - | Yes | Yes | Yes | Yes | - |
| Indicators | Document Review | Literature Review | File and Database Review | Key Informant Interviews | Case Studies | Survey of Sports Organizations | Expert Panel (optional) |
|---|---|---|---|---|---|---|---|
| Number of HP ISSE applications and approvals, by year (3.3.1) | Yes | - | Yes | - | - | - | - |
| Percentage of NSOs that host an ISSE, by year (3.3.2) | Yes | - | Yes | - | - | Yes | - |
| Number of carded and non-carded athletes who participate in ISSEs, by years (3.3.3) | Yes | - | Yes | - | - | - | - |
| Indicators | Document Review | Literature Review | File and Database Review | Key Informant Interviews | Case Studies | Survey of Sports Organizations | Expert Panel (optional) |
|---|---|---|---|---|---|---|---|
| Trends in the number of athletes first carded 8 years ago who have progressed to the next carding level (3.4.1) | Yes | - | Yes | Yes | - | Yes | - |
| Indicators | Document Review | Literature Review | File and Database Review | Key Informant Interviews | Case Studies | Survey of Sports Organizations | Expert Panel (optional) |
|---|---|---|---|---|---|---|---|
| Number of HP ISSE applications and approvals, by year (4.1.1) | Yes | - | Yes | - | - | Yes | - |
| Percentage of NSOs that host an ISSE, by year (4.1.2) | Yes | - | Yes | - | - | - | - |
| Percentage of NSOs agreeing with “the HP creates sufficient opportunities to participate in sport events in Canada (for high performance athletes, developmental athletes, female athletes, athletes with a disability, Aboriginal athletes, coaches, officials) (4.1.4) | - | - | - | Yes | - | Yes | - |
| Percentage of NSOs stating that the number of opportunities to participate in ISSEs has increased, decreased or stayed about the same over the past five years (for high performance athletes, developing athletes, female athletes, athletes with a disability, Aboriginal athletes, coaches) (4.1.5) | - | - | - | Yes | - | Yes | - |
| Indicators | Document Review | Literature Review | File and Database Review | Key Informant Interviews | Case Studies | Survey of Sports Organizations | Expert Panel (optional) |
|---|---|---|---|---|---|---|---|
| Percentage of athletes who agree that the AAP has made it possible to achieve higher levels of athletic performance (4.2.1) | Yes | Yes | - | Yes | - | - | - |
| Trends in percentage of athletes’ expenses covered by AAP (4.2.2) | Yes | Yes | - | - | - | - | - |
| Indicators | Document Review | Literature Review | File and Database Review | Key Informant Interviews | Case Studies | Survey of Sports Organizations | Expert Panel (optional) |
|---|---|---|---|---|---|---|---|
| Extent to which athletes are receiving quality programming and services from the CSCs (4.3.1) | - | - | - | Yes | - | Yes | - |
| Indicators | Document Review | Literature Review | File and Database Review | Key Informant Interviews | Case Studies | Survey of Sports Organizations | Expert Panel (optional) |
|---|---|---|---|---|---|---|---|
| Trends in the level of financial hardship faced by carded athletes (5.1.1) | Yes | - | Yes | Yes | - | - | - |
| Indicators | Document Review | Literature Review | File and Database Review | Key Informant Interviews | Case Studies | Survey of Sports Organizations | Expert Panel (optional) |
|---|---|---|---|---|---|---|---|
| Percentage of NSOs and MSOs that have been audited by the CAAWS (5.2.1) | Yes | - | Yes | Yes | - | - | - |
| Percentage of NSOs and MSOs that have completed GBA Plus training (5.2.2) | Yes | - | Yes | Yes | - | - | - |
| Percentage of funded organizations that provide GBA Plus training (5.2.3) | Yes | - | Yes | Yes | - | - | - |
| Percentage of funded sports organizations using an independent third party to address harassment and abuse cases (5.2.4) | Yes | - | Yes | Yes | - | - | - |
| A research strategy informed by data gaps to guide investments is in place (5.2.5) | Yes | - | Yes | Yes | - | - | - |
| Indicators | Document Review | Literature Review | File and Database Review | Key Informant Interviews | Case Studies | Survey of Sports Organizations | Expert Panel (optional) |
|---|---|---|---|---|---|---|---|
| Level of agreement of NSOs with “my sport currently has a sufficient pool of next generation athletes” (5.3.1) | - | - | - | - | - | Yes | - |
| Level of agreement of NSOs with “the financial support provided by the SSP is effective in terms of developing the pool of next generation athletes (5.3.2) | - | - | - | - | - | Yes | - |
| Number of athletes selected by NSOs to engage in funded Next Generation projects (5.3.3) | Yes | - | Yes | Yes | - | - | - |
| Percentage of funded Next Generation projects providing full-time coaching to engaged Next Generation athletes (5.3.4) | Yes | - | Yes | Yes | - | - | - |
| Percentage of funded Next Generation projects ensuring engaged Next Generation athletes are provided with a daily training environment that meets high performance standards (5.3.5) | Yes | - | Yes | Yes | - | - | - |
| Percentage of funded Next Generation projects increasing access to Sport Science and Sport Medicine services to engaged Next Generation athletes (5.3.6) | Yes | - | Yes | Yes | - | - | - |
| Indicators | Document Review | Literature Review | File and Database Review | Key Informant Interviews | Case Studies | Survey of Sports Organizations | Expert Panel (optional) |
|---|---|---|---|---|---|---|---|
| Evidence that members of funded organizations that have completed training on harassment, abuse and discrimination in sport (5.4.1) | Yes | - | Yes | Yes | - | Yes | - |
| Indicators | Document Review | Literature Review | File and Database Review | Key Informant Interviews | Case Studies | Survey of Sports Organizations | Expert Panel (optional) |
|---|---|---|---|---|---|---|---|
| Extent to which the ASC has provided expertise and guidance to stakeholder organizations (5.5.1) | Yes | - | Yes | Yes | Yes | - | - |
| Indicators | Document Review | Literature Review | File and Database Review | Key Informant Interviews | Case Studies | Survey of Sports Organizations | Expert Panel (optional) |
|---|---|---|---|---|---|---|---|
| Administrative cost per unit of output (e.g., vote 1 resources, number of contribution agreements, $ value of Gs&Cs) (6.1.1) | Yes | - | Yes | Yes | - | - | - |
| Trends in planned vs. actual resources (6.1.2) | Yes | - | Yes | Yes | - | - | - |
| Views of key informants on efficiency (6.1.3) | Yes | - | - | Yes | Yes | - | - |
| Percentage of funded organizations who agree that the programs are administered efficiently (6.1.4) | - | - | - | - | - | Yes | - |
| Extent to which the programs’ service standards are being met (6.1.5) | Yes | - | Yes | Yes | Yes | Yes | - |
| Indicators | Document Review | Literature Review | File and Database Review | Key Informant Interviews | Case Studies | Survey of Sports Organizations | Expert Panel (optional) |
|---|---|---|---|---|---|---|---|
| Views of key informants, funded sports organizations (7.1.1) | - | - | - | Yes | Yes | Yes | - |
| Findings of document and literature reviews (7.1.2) | Yes | Yes | - | - | - | - | - |
Annex C – Evaluation Methodology
A planning phase was carried out which involved developing the evaluation methodology. The data collection methods are described below.
Document review
A considerable amount of documentation was available on the three programs, including the following:
- Sport-related legislation
- Sport-related policies and strategies (e.g., the Canadian Sports Policy)
- Memoranda to Cabinet and Treasury Board submissions
- Program descriptions, application and contribution guidelines, terms and conditions, etc.
- F-P/T bilateral agreements
- Research reports, including the periodic Status of the High Performance Athlete Survey
- Previous evaluations
Literature review
The targeted literature review was undertaken by ESD. An online search was conducted of external studies, commentary, articles, websites, statistical data, etc. Examples of some of the topics that were covered by the literature review are the following:
- Trends in the rates of sport participation in Canada and the factors influencing such trends
- Trends in the application of government priorities in sport, such as GBA Plus and accessibility
- Approaches to promoting sport participation in other jurisdictions internationally
- Progress made by Canadian sports organizations to promote safe sports, workplaces free of harassment, abuse and discrimination
The review covered both the domestic and international literature. Key informants were also asked to identify additional sources.
Review of administrative and performance data
The administrative review extracted data from the key PCH and SC information systems, including financial databases and information systems for tracking the applications, processing, decisions, disbursements, activities and reporting for the three programs. The specific databases consulted were targeted to best respond to the evaluation’s questions. The evaluation team relied on data from the Athlete Assistance Program Management Information System (AAPMIS), the Sport Tracking, Assessment and Technical Statistics (STATS) system and the PCH Grants and Contributions Information Management System (GCIMS).
SC developed a Performance Information Profile (PIP) for the three programs, which lists all of the intended outcomes, including the outcomes associated with various special initiatives funded by recent TB submissions. SC also provided the evaluation team with a copy of an Excel spreadsheet, called the PIP tracker, which contains available data in support of the various indicators, organized by program.
Key informant interviews
A total of 50 interviews were completed, involving 53 individuals. The breakdown by segment is provided in Table C-1. The OGDs interviewed were the Public Health Agency of Canada (PHAC) and the Social Sciences and Humanities Research Council (SSHRC). Within the provinces and territories, interviews were conducted with the individuals responsible for the bilateral agreements with SC. A combination of National Sport Organizations (NSOs) and Multi-Sport Service Organizations (MSOs) were interviewed. The MSOs consisted of two types: those that focus on promoting sport participation and physical activity (e.g., Canadian Tire JumpStart, ParticipACTION, KidSport) and those that provide services to the sports community (e.g., Own The Podium, Coaching Association of Canada, Canadian Centre for Ethics in Sport).
Structured interview guides were prepared for the various categories of key informants, containing mainly open-ended questions. Each interview was conducted in the official language of choice of the respondent. Interviews were recorded with the permission of respondents.
| Segment | # in Sample | # of Interviews Completed | # of Interviewees |
|---|---|---|---|
| SC | 21 | 20 | 21 |
| Other PCH | 1 | 1 | 1 |
| OGDs | 5 | 3 | 3 |
| Provinces/Territories | 11 | 8 | 8 |
| NSOs and MSOs | 15 | 13 | 15 |
| Canadian Sport Centres | 2 | 1 | 1 |
| Academics | 6 | 4 | 4 |
| Totals | 61 | 50 | 53 |
Case studies on sport participation
The scoping interviews with SC representatives revealed that the case studies conducted by the previous evaluation were very useful in understanding the contributions made by the NSOs, MSOs and CSCs/CSIs to achieving the intended results of the three programs and in identifying program delivery improvement opportunities.
The present evaluation conducted six case studies with a focus on sport participation, consisting of the following:
- Participation trends and issues in a sample of sports (n=3): Case studies were conducted of a sample of sports to examine trends in participation rates, the factors affecting them, and the roles and responsibilities of stakeholders (including SC, P/Ts, NSOs, PSOs, private sector, etc.).
A mix of sports with increasing and declining participation rates were selected. Interviews were conducted with the NSOs, the PSOs and the provincial governments in selected provinces.
A total of five sports were examined: hockey, basketball and wheelchair basketball, and swimming and artistic swimming. - Sport participation in Indigenous communities (n=1): This case study focused on the funding provided to the Aboriginal Sports Circle and the progress being achieved in promoting sport participation in Indigenous communities. Interviews were conducted with representatives of the Aboriginal Sports Circle (ASC) and with a sample of organizations that receive guidance from the ASC (e.g., Aboriginal Sports Bodies, NSOs, MSOs, and Indigenous communities that are implementing the Aboriginal Long-Term Participant Development (ALTPD) Pathway.
- F-P/T bilateral agreements and sport participation (n=2): These case studies investigated the effectiveness of the F-P/T bilateral agreements in fostering sport participation at the community level. Case studies of one province (Nova Scotia) and one territory (NWT) were conducted. Within each jurisdiction interviews were conducted with representatives of the provincial or territorial government and with a sample of PTSOs.
Finally, a case study focused on sport participation in Indigenous communities was conducted, focused on assessing the progress in implementing the Indigenous Youth in Sport initiative.
Survey of sports organizations
The objective of this survey was to obtain feedback from all of the NSOs that received SC funding regarding the relevance, effectiveness and efficiency of the three programs. The survey fieldwork was carried out by the PCH Policy Research Group.
A total of 58 NSOs were invited to complete the survey and 48 responded, for an excellent response rate of 83%.
The survey repeated many of the questions posed by the survey conducted by the previous evaluation so that trends could be analyzed.
The evaluation did not conduct a survey of high performance athletes as SC recently completed a survey of carded athletes: the Status of the High Performance Athlete Survey. This survey is conducted every few years and the most recent iteration was completed in late 2020.
Annex D – Supplementary Tables
Table D-1: Canada’s historic medal attainment at Olympic Games
| Year | Number of Countries medallingTable 71 note * | Number of Gold medals | Number of Total medals | % of total medalsTable 71 note ** | Medals rank | Medal pointsTable 71 note *** |
|---|---|---|---|---|---|---|
| 1976 | 16 | 1 | 3 | 3% | 11 | 9 |
| 1980 | 19 | - | 2 | 2% | 13 | 4 |
| 1984 | 17 | 2 | 4 | 3% | 9 | 14 |
| 1988 | 17 | - | 5 | 4% | 12 | 9 |
| 1992 | 20 | 2 | 7 | 4% | 9 | 21 |
| 1994 | 22 | 3 | 13 | 7% | 6 | 37 |
| 1998 | 24 | 6 | 15 | 7% | 5 | 49 |
| 2002 | 24 | 7 | 17 | 7% | 4 | 51 |
| 2006 | 26 | 7 | 24 | 9% | 3 | 72 |
| 2010 | 26 | 14 | 26 | 10% | 3 | 96 |
| 2014 | 26 | 10 | 25 | 8% | 4 | 85 |
| 2018 | 30 | 11 | 29 | 9% | 3 | 89 |
The number of events and the number of participating countries in a given year influence medal counts and rankings.
Sources: For 1976 to 2014: Canadian Heritage, Grouped Evaluation of SC Programs, 2010-11 to 2015; for Winter 2018 and Summer 2016: OTP
Table 71 notes
- Table 71 note *
-
Countries medalling is the total number of countries that received at least one medal.
- Table 71 note **
-
% of total medals is calculated as the total medals divided by the total number of medals distributed across all countries for the Olympic Games in that year.
- Table 71 note ***
-
Medal points are calculated based on calculations used for SC’s Annual Olympic Ranking Index of Nations (calculated as a sum of five points for each gold, three points for each silver, and one point for each bronze).
| Year | Number of Countries medallingTable 72 note * | Number of Gold medals | Number of Total medals | % of total medalsTable 72 note ** | Medals rank | Medal pointsTable 72 note *** |
|---|---|---|---|---|---|---|
| 1972 | 48 | 0 | 5 | <1% | 22 | 9 |
| 1976 | 41 | 0 | 11 | 3% | 13 | 21 |
| 1980 | 36 | - | - | - | - | - |
| 1984 | 47 | 10 | 44 | 6% | 4 | 120 |
| 1988 | 51 | 3 | 10 | 1% | 19 | 26 |
| 1992 | 65 | 7 | 18 | 2% | 15 | 54 |
| 1996 | 77 | 3 | 22 | 3% | 11 | 56 |
| 2000 | 80 | 3 | 14 | 2% | 18 | 32 |
| 2004 | 73 | 3 | 12 | 1% | 19 | 36 |
| 2008 | 87 | 3 | 19 | 2% | 13 | 49 |
| 2012 | 79 | 1 | 18 | 2% | 13 | 32 |
| 2016 | 87 | 4 | 22 | 2% | 10 | 44 |
The number of events and the number of participating countries in a given year influence medal counts and rankings.
Sources: For 1976 to 2014: Canadian Heritage, Grouped Evaluation of SC Programs, 2010-11 to 2015; for Winter 2018 and Summer 2016: OTP
Table 72 notes
- Table 72 note *
-
Countries medalling is the total number of countries that received at least one medal.
- Table 72 note **
-
% of total medals is calculated as the total medals divided by the total number of medals distributed across all countries for the Olympic Games in that year.
- Table 72 note ***
-
Medal points are calculated based on calculations used for SC’s Annual Olympic Ranking Index of Nations (calculated as a sum of five points for each gold, three points for each silver, and one point for each bronze).
Table D-2: Canada’s historic medal attainment at Paralympic Games
| Year | Number of Countries medalling | Number of Gold medals | Number of Total medals | % of total medalsTable 73 note * | Medals rank | Medal pointsTable 73 note ** |
|---|---|---|---|---|---|---|
| 1976 | 2 | - | 2 | 4 | 9 | 12 |
| 1980 | 2 | 3 | 1 | 6 | 8 | 20 |
| 1984 | 2 | 8 | 4 | 14 | 10 | 38 |
| 1988 | 5 | 3 | 5 | 13 | 8 | 39 |
| 1992 | 2 | 4 | 6 | 12 | 9 | 28 |
| 1994 | 1 | 2 | 5 | 8 | 14 | 16 |
| 1998 | 1 | 9 | 5 | 15 | 15 | 37 |
| 2002 | 6 | 4 | 5 | 15 | 6 | 47 |
| 2006 | 5 | 3 | 5 | 13 | 6 | 39 |
| 2010 | 10 | 5 | 4 | 19 | 3 | 69 |
| 2014 | 7 | 2 | 7 | 16 | 3 | 48 |
| 2018 | 8 | 4 | 16 | 28 | 2 | 68 |
Sources: For 1976 to 2014: Canadian Heritage, Grouped Evaluation of SC Programs, 2010-11 to 2015; for Winter 2018 and Summer 2016: OTP
Table 73 notes
- Table 73 note *
-
Medals rank is based on the number of gold medals, which is a common ranking method for Paralympics.
- Table 73 note **
-
Medal points are calculated based on calculations used for SC’s Annual Olympic Ranking Index of Nations (calculated as a sum of five points for each gold, three points for each silver, and one point for each bronze).
| Year | Number of Countries medalling | Number of Gold medals | Number of Total medals | % of total medalsTable 74 note * | Medals rank | Medal pointsTable 74 note ** |
|---|---|---|---|---|---|---|
| 1968 | 6 | 6 | 7 | 19 | 12 | 55 |
| 1972 | 5 | 6 | 8 | 20 | 13 | 51 |
| 1976 | 25 | 26 | 26 | 77 | 6 | 229 |
| 1980 | 64 | 35 | 31 | 130 | 4 | 456 |
| 1984 | 87 | 82 | 69 | 238 | 3 | 750 |
| 1988 | 54 | 42 | 55 | 151 | 4 | 451 |
| 1992 | 28 | 21 | 26 | 75 | 6 | 229 |
| 1996 | 24 | 22 | 24 | 70 | 7 | 210 |
| 2000 | 38 | 33 | 25 | 96 | 3 | 314 |
| 2004 | 28 | 19 | 25 | 72 | 3 | 222 |
| 2008 | 19 | 10 | 21 | 50 | 7 | 146 |
| 2012 | 7 | 15 | 9 | 31 | 20 | 89 |
Sources: For 1976 to 2014: Canadian Heritage, Grouped Evaluation of SC Programs, 2010-11 to 2015; for Winter 2018 and Summer 2016: OTP
Table 74 notes
- Table 74 note *
-
Medals rank is based on the number of gold medals, which is a common ranking method for Paralympics.
- Table 74 note **
-
Medal points are calculated based on calculations used for SC’s Annual Olympic Ranking Index of Nations (calculated as a sum of five points for each gold, three points for each silver, and one point for each bronze).
Table D-3: Canada’s 2006 to 2018 progression on the World Ranking Index – gold medals, all medals and top 8s (number and points) for winter, summer and combined
| Four-year cycle ending | # of gold medals | Rank | # of all medals | Rank | Number top 8s | Rank | Top 8s points | Rank |
|---|---|---|---|---|---|---|---|---|
| 2006 | 31 | 2 | 88 | 2 | 206 | 3 | 1,094 | 2 |
| 2007 | 33 | 2 | 94 | 2 | 216 | 3 | 1,141 | 2 |
| 2008 | 32 | 2 | 101 | 2 | 230 | 2 | 1,216 | 2 |
| 2009 | 28 | 3 | 102 | 2 | 232 | 2 | 1,209 | 2 |
| 2010 | 34 | 2 | 103 | 2 | 243 | 2 | 1,250 | 2 |
| 2011 | 39 | 2 | 109 | 2 | 253 | 2 | 1,317 | 2 |
| 2012 | 43 | 1 | 106 | 2 | 246 | 2 | 1,301 | 2 |
| 2013 | 44 | 2 | 106 | 2 | 251 | 2 | 1,318 | 2 |
| 2014 | 40 | 2 | 105 | 1 | 236 | 4 | 1,249 | 2 |
| 2015 | 30 | 4 | 97 | 2 | 231 | 4 | 1,202 | 3 |
| 2016 | 26 | 5 | 96 | 3 | 231 | 4 | 1,176 | 4 |
| 2017 | 25 | 6 | 98 | 3 | 247 | 3 | 1,232 | 3 |
| 2018 | 26 | 5 | 98 | 3 | 250 | 3 | 1,239 | 3 |
Notes: The Annual Olympic Ranking of Nations is based on results per nation across all Olympic events at Olympic Games and Senior World Championships (Gold medal total per nation, medal total per nation, medal point total per nation, top 8 total per nation, top 8 point total per nation). Top 8 points scored as follows: 1st – 10 points; 2nd – 8 points; 3rd to 8th – 6 to 1 points, respectively.
Source: SC, Olympic Ranking Index, prepared annually for quadrennial cycle.
| Four-year cycle ending | # of gold medals | Rank | # of all medals | Rank | Number top 8s | Rank | Top 8s points | Rank |
|---|---|---|---|---|---|---|---|---|
| 2006 | 13 | 18 | 61 | 17 | 210 | 13 | 901 | 15 |
| 2007 | 9 | 21 | 53 | 17 | 194 | 13 | 806 | 16 |
| 2008 | 9 | 22 | 59 | 16 | 195 | 13 | 825 | 15 |
| 2009 | 8 | 26 | 55 | 18 | 196 | 13 | 799 | 14 |
| 2010 | 9 | 24 | 53 | 18 | 194 | 13 | 790 | 15 |
| 2011 | 9 | 22 | 56 | 16 | 193 | 13 | 806 | 14 |
| 2012 | 7 | 28 | 56 | 16 | 190 | 12 | 769 | 14 |
| 2013 | 8 | 25 | 61 | 17 | 191 | 11 | 781 | 15 |
| 2014 | 7 | 26 | 64 | 16 | 194 | 11 | 802 | 13 |
| 2015 | 7 | 31 | 68 | 12 | 206 | 10 | 850 | 13 |
| 2016 | 14 | 19 | 84 | 12 | 244 | 10 | 1,057 | 10 |
| 2017 | 14 | 18 | 68 | 14 | 242 | 10 | 993 | 11 |
| 2018 | 16 | 17 | 69 | 12 | 249 | 11 | 1,021 | 11 |
Notes: The Annual Olympic Ranking of Nations is based on results per nation across all Olympic events at Olympic Games and Senior World Championships (Gold medal total per nation, medal total per nation, medal point total per nation, top 8 total per nation, top 8 point total per nation). Top 8 points scored as follows: 1st – 10 points; 2nd – 8 points; 3rd to 8th – 6 to 1 points, respectively.
Source: SC, Olympic Ranking Index, prepared annually for quadrennial cycle.
| Four-year cycle ending | # of gold medals | Rank | # of all medals | Rank | Number top 8s | Rank | Top 8s points | Rank |
|---|---|---|---|---|---|---|---|---|
| 2006 | 44 | 8 | 149 | 7 | 416 | 6 | 1,995 | 6 |
| 2007 | 42 | 8 | 147 | 8 | 410 | 7 | 1,946 | 7 |
| 2008 | 41 | 10 | 160 | 6 | 425 | 6 | 2,041 | 7 |
| 2009 | 36 | 11 | 156 | 6 | 428 | 6 | 2,007 | 7 |
| 2010 | 43 | 9 | 156 | 7 | 437 | 6 | 2,040 | 7 |
| 2011 | 48 | 7 | 165 | 7 | 446 | 7 | 2,123 | 7 |
| 2012 | 50 | 7 | 162 | 7 | 436 | 7 | 2,070 | 7 |
| 2013 | 52 | 7 | 167 | 7 | 442 | 7 | 2,099 | 7 |
| 2014 | 47 | 9 | 169 | 7 | 430 | 7 | 2,051 | 7 |
| 2015 | 37 | 11 | 165 | 7 | 437 | 7 | 2,051 | 7 |
| 2016 | 40 | 11 | 180 | 7 | 475 | 7 | 2,233 | 7 |
| 2017 | 39 | 11 | 166 | 9 | 489 | 7 | 2,224 | 8 |
| 2018 | 42 | 11 | 167 | 9 | 449 | 7 | 2260 | 8 |
Notes: The Annual Olympic Ranking of Nations is based on results per nation across all Olympic events at Olympic Games and Senior World Championships (Gold medal total per nation, medal total per nation, medal point total per nation, top 8 total per nation, top 8 point total per nation). Top 8 points scored as follows: 1st – 10 points; 2nd – 8 points; 3rd to 8th – 6 to 1 points, respectively.
Source: SC, Olympic Ranking Index, prepared annually for quadrennial cycle.
Table D-4: planned versus actual spending and human resources
| Fiscal year | Planned Spending ($M) | Actual Spending ($M) | Actual/Planned Spending ($M) | Planned (FTE) | Actual (FTE) | Actual/ Planned (FTE) |
|---|---|---|---|---|---|---|
| 2015-16 | 62.6 | 36.2 | 58% | 55.0 | 49.2 | 89% |
| 2016-17 | 24.2 | 28.6 | 118% | 48.3 | 43.1 | 89% |
| 2017-18 | 26 | 29.1 | 112% | 53.2 | 69.6 | 131% |
| 2018-19 | 26.4 | 35.2 | 133% | 71.2 | 77.6 | 109% |
| 2019-20 | 32.4 | 27.8 | 86% | 39.4 | 71.9 | 182% |
Source: PCH Finance data
| Fiscal year | Planned Spending ($M) | Actual Spending ($M) | Actual/Planned Spending ($M) | Planned (FTE) | Actual (FTE) | Actual/ Planned (FTE) |
|---|---|---|---|---|---|---|
| 2015-16 | 29.6 | 28.7 | 97% | 8.6 | 8.2 | 95% |
| 2016-17 | 29.7 | 29.2 | 98% | 8.1 | 7.8 | 96% |
| 2017-18 | 28.7 | 33.4 | 116% | 4 | 3 | 75% |
| 2018-19 | 33.7 | 32.6 | 97% | 5.2 | 3.4 | 65% |
| 2019-20 | 33.5 | 31.9 | 95% | 14.3 | 3.4 | 24% |
Source: PCH Finance data
| Fiscal year | Planned Spending ($M) | Actual Spending ($M) | Actual/Planned Spending ($M) | Planned (FTE) | Actual (FTE) | Actual/ Planned (FTE) |
|---|---|---|---|---|---|---|
| 2015-16 | 151.7 | 154.7 | 102% | 57.4 | 52.5 | 91% |
| 2016-17 | 152.4 | 152.9 | 100% | 51.7 | 44.5 | 86% |
| 2017-18 | 151.7 | 156.9 | 103% | 41.7 | 21.3 | 51% |
| 2018-19 | 155.8 | 160.3 | 103% | 29 | 23.8 | 82% |
| 2019-20 | 165.3 | 183.4 | 111% | 68.5 | 28.2 | 41% |
Source: PCH Finance data
| Fiscal year | Planned Spending ($M) | Actual Spending ($M) | Actual/Planned Spending ($M) | Planned (FTE) | Actual (FTE) | Actual/ Planned (FTE) |
|---|---|---|---|---|---|---|
| 2015-16 | 243.9 | 219.7 | 90% | 121.0 | 109.9 | 91% |
| 2016-17 | 206.2 | 210.7 | 102% | 108.1 | 95.4 | 88% |
| 2017-18 | 206.4 | 219.4 | 106% | 98.9 | 93.9 | 95% |
| 2018-19 | 215.9 | 228.1 | 106% | 105.4 | 104.8 | 99% |
| 2019-20 | 231.1 | 243.1 | 105% | 122.2 | 103.5 | 85% |
Source: PCH Finance data
Table D-5: performance of SC programs against service standards
| Fiscal Year | Acknowledgement of receipt of application Apps (Volume) | Acknowledgement of receipt of application Standard (Weeks) | Acknowledgement of receipt of application % Met | Funding Decision Apps (Volume) | Funding Decision Standard (Weeks) | Funding Decision % Met | Issuance of Payments Apps (Volume) | Issuance of Payments Standard (Weeks) | Issuance of Payment % Met |
|---|---|---|---|---|---|---|---|---|---|
| 2015-16 | 227 | 2 | 82% | 227 | 20 | 89% | - | - | - |
| 2016-17 | 132 | 2 | 96% | 117 | 20 | 91% | 95 | 4 | 92% |
| 2017-18 | 238 | 2 | 92% | 181 | 20 | 96% | 129 | 4 | 98% |
| 2018-19 | 95 | 2 | 96% | 202 | 20 | 85% | 64 | 4 | 100% |
| 2019-20 | 463 | 2 | 81% | 449 | 20 | 66% | 58 | 4 | 98% |
| Fiscal Year | Acknowledgement of receipt of application Apps (Volume) | Acknowledgement of receipt of application Standard (Weeks) | Acknowledgement of receipt of application % Met | Funding Decision Apps (Volume) | Funding Decision Standard (Weeks) | Funding Decision % Met | Issuance of Payments Apps (Volume) | Issuance of Payments Standard (Weeks) | Issuance of Payment % Met |
|---|---|---|---|---|---|---|---|---|---|
| 2015-16 | - | - | - | - | - | - | - | - | - |
| 2016-17 | - | - | - | - | - | - | - | - | - |
| 2017-18 | - | - | - | - | - | - | - | - | - |
| 2018-19 | 1897 | 2 | 100% | 1897 | 14 | 99% | 1897 | 4 | 98% |
| 2019-20 | 1908 | 2 | 100% | 1908 | 14 | 88% | 1908 | 4 | 98% |
| Fiscal Year | Acknowledgement of receipt of application Apps (Volume) | Acknowledgement of receipt of application Standard (Weeks) | Acknowledgement of receipt of application % Met | Funding Decision Apps (Volume) | Funding Decision Standard (Weeks) | Funding Decision % Met | Issuance of Payments Apps (Volume) | Issuance of Payments Standard (Weeks) | Issuance of Payment % Met |
|---|---|---|---|---|---|---|---|---|---|
| 2015-16 | 45 | 2 | 98% | 45 | 28 | 87% | - | - | - |
| 2016-17 | 34 | 2 | 97% | 27 | 28 | 85% | 11 | 4 | 100% |
| 2017-18 | 27 | 2 | 100% | 30 | 28 | 93% | 20 | 4 | 100% |
| 2018-19 | 36 | 2 | 94% | - | - | - | 25 | 4 | 100% |
| 2019-20 | - | - | - | - | - | - | - | - | - |
| Fiscal Year | Acknowledgement of receipt of application Apps (Volume) | Acknowledgement of receipt of application Standard (Weeks) | Acknowledgement of receipt of application % Met | Funding Decision Apps (Volume) | Funding Decision Standard (Weeks) | Funding Decision % Met | Issuance of Payments Apps (Volume) | Issuance of Payments Standard (Weeks) | Issuance of Payment % Met |
|---|---|---|---|---|---|---|---|---|---|
| 2015-16 | 39 | 2 | 97% | 39 | 20 | 82% | - | - | - |
| 2016-17 | 57 | 2 | 100% | 51 | 20 | 96% | 46 | 4 | 98% |
| 2017-18 | 62 | 2 | 94% | 61 | 20 | 74% | 50 | 4 | 98% |
| 2018-19 | 61 | 2 | 92% | - | - | - | 56 | 4 | 96% |
| 2019-20 | - | - | - | - | - | - | - | - | - |
| Fiscal Year | Acknowledgement of receipt of application Apps (Volume) | Acknowledgement of receipt of application Standard (Weeks) | Acknowledgement of receipt of application % Met | Funding Decision Apps (Volume) | Funding Decision Standard (Weeks) | Funding Decision % Met | Issuance of Payments Apps (Volume) | Issuance of Payments Standard (Weeks) | Issuance of Payment % Met |
|---|---|---|---|---|---|---|---|---|---|
| 2015-16 | - | - | - | - | - | - | - | - | - |
| 2016-17 | - | - | - | - | - | - | - | - | - |
| 2017-18 | - | - | - | - | - | - | - | - | - |
| 2018-19 | 4 | 2 | 100% | - | - | - | 5 | 4 | 100% |
| 2019-20 | - | - | - | - | - | - | - | - | - |
| Fiscal Year | Acknowledgement of receipt of application Apps (Volume) | Acknowledgement of receipt of application Standard (Weeks) | Acknowledgement of receipt of application % Met | Funding Decision Apps (Volume) | Funding Decision Standard (Weeks) | Funding Decision % Met | Issuance of Payments Apps (Volume) | Issuance of Payments Standard (Weeks) | Issuance of Payment % Met |
|---|---|---|---|---|---|---|---|---|---|
| 2015-16 | - | - | - | - | - | - | - | - | - |
| 2016-17 | - | - | - | - | - | - | - | - | - |
| 2017-18 | - | - | - | - | - | - | - | - | - |
| 2018-19 | - | - | - | 1 | 26 | 100% | - | - | - |
| 2019-20 | 2 | 2 | 100% | 1 | 26 | 100% | - | - | - |
| Fiscal Year | Acknowledgement of receipt of application Apps (Volume) | Acknowledgement of receipt of application Standard (Weeks) | Acknowledgement of receipt of application % Met | Funding Decision Apps (Volume) | Funding Decision Standard (Weeks) | Funding Decision % Met | Issuance of Payments Apps (Volume) | Issuance of Payments Standard (Weeks) | Issuance of Payment % Met |
|---|---|---|---|---|---|---|---|---|---|
| 2015-16 | - | - | - | - | - | - | - | - | - |
| 2016-17 | - | - | - | - | - | - | - | - | - |
| 2017-18 | - | - | - | - | - | - | - | - | - |
| 2018-19 | - | - | - | 2 | 26 | 100% | - | - | - |
| 2019-20 | 1 | 2 | 100% | - | - | - | - | - | - |
| Fiscal Year | Acknowledgement of receipt of application Apps (Volume) | Acknowledgement of receipt of application Standard (Weeks) | Acknowledgement of receipt of application % Met | Funding Decision Apps (Volume) | Funding Decision Standard (Weeks) | Funding Decision % Met | Issuance of Payments Apps (Volume) | Issuance of Payments Standard (Weeks) | Issuance of Payment % Met |
|---|---|---|---|---|---|---|---|---|---|
| 2015-16 | - | - | - | - | - | - | - | - | - |
| 2016-17 | - | - | - | - | - | - | - | - | - |
| 2017-18 | - | - | - | - | - | - | - | - | - |
| 2018-19 | 2 | 2 | 50% | 2 | 26 | 100% | - | - | - |
| 2019-20 | 1 | 2 | 100% | 1 | 26 | 100% | - | - | - |
| Fiscal Year | Acknowledgement of receipt of application Apps (Volume) | Acknowledgement of receipt of application Standard (Weeks) | Acknowledgement of receipt of application % Met | Funding Decision Apps (Volume) | Funding Decision Standard (Weeks) | Funding Decision % Met | Issuance of Payments Apps (Volume) | Issuance of Payments Standard (Weeks) | Issuance of Payment % Met |
|---|---|---|---|---|---|---|---|---|---|
| 2015-16 | - | - | - | - | - | - | - | - | - |
| 2016-17 | - | - | - | - | - | - | - | - | - |
| 2017-18 | - | - | - | - | - | - | - | - | - |
| 2018-19 | - | - | - | 121 | 26 | 91% | - | - | - |
| 2019-20 | 92 | 2 | 91% | 77 | 26 | 84% | 76 | 4 | 96% |
Annex E – References
- Canadian Heritage. (2011). SC Hosting Program, Sport Support Program, Athlete Assistance Program: Umbrella Performance Measurement, Evaluation and Risk Strategy
- Canadian Heritage. (2016). Grouped Evaluation of SC Programs: Sport Support Program, Hosting Program, Athlete Assistance Program, 2010-11 to 2014-15 And Review of the Federal Government Investment in the Toronto 2015 Pan and Parapan American Games (PDF format).
- Canadian Heritage. (2018). Departmental Results Framework and Program Inventory 2018-19: Results.
- Canadian Heritage. (2019). Sport Participation 2016: Research Paper.
- Canadian Heritage. (2020a). Departmental Results Report 2019-20.
- Canadian Heritage. (2020b). SC, Insight Unit. Fact Sheet: 2020 ParticipACTION Report Card on Physical Activity for Children and Youth
- Canadian Heritage. (2020c). “Report Card Briefing”
- Canadian Heritage. (2020d). 2019-20 Status of the High Performance Athlete Survey. Prepared by Ekos Research Associates for SC.
- Canadian Tire JumpStart. (2017). “Sport as a Tool for Social Change.” Presentation at 2017 Sport For Life Summit (PDF format).
- Canadian Women & Sport. (2020). The Rally Report: Encouraging Action to Improve Sport for Women and Girls.
- Government of Canada. (2003). Physical Activity and Sport Act, S.C. 2003, c. 2.
- Government of Canada. (2008). Federal policy for hosting international sport events.
- Government of Canada. (2012). Canadian Sport Policy.
- Government of Canada. Budget 2017 (PDF format).
- Government of Canada. Budget 2018.
- Government of Canada. Budget 2019.
- Government of Canada. (2019). 2019 Canadian High Performance Sport Strategy (PDF format).
- Government of Canada. The Federal Policy for Hosting International Sport Events (PDF format).
- Institute for Canadian Citizenship. (2014). Playing Together – New citizens, sports and belonging (PDF format).
- Library of Parliament, (2013). SC and the Public Policy Framework for Participation and Excellence in Sport.
- ParticipACTION. (2020). Family Influence: The 2020 ParticipACTION Report Card on Physical Activity for Children and Youth.
- Public Health Agency of Canada. (2018). A Common Vision for increasing physical activity and reducing sedentary living in Canada: Let’s Get Moving.
- SC. (2013). Review of SC’s Targeted Excellence Approach. Prepared by Goss Gilroy Inc.
- SC, (2017). Review of SC’s Targeted Excellence Approach: Final Report (PDF format).
- Statistics Canada, General Social Survey (Time Use), 1992, 2010, as reported in Canadian Heritage (2019), Sport Participation 2016.
- Statistics Canada. General Social Survey (Canadians at Work and at home), 2016.
- Statistics Canada. Sports for fun and fitness. Infographic (PDF format).
- Statistics Canada. Regular participation in sports by sex and other demographic characteristics.
©Her Majesty the Queen in Right of Canada, 2022
Catalogue number: CH7-37/1-2022E-PDF
ISBN: 978-0-660-41196-5