
The Economic Impact of Canada’s Copyright-Based Industries
On this page
- List of figures
- List of tables
- List of acronyms
- Executive summary
- Introduction
- Limitations
- Section 1: Economic contribution of the copyright-based industries
- Industry-specific trends (2009 to 2019)
- Publishing industries (excluding Internet)
- Broadcasting industry (excluding Internet)
- Other information services
- Motion picture and sound recording industries
- Computer systems design and related services
- Advertising, public relations, and related services
- Performing arts, spectator sports, and heritage institutions
- Section 2: Contribution to employment in Canada
- Industry-specific trends (2009 to 2019)
- Publishing industries (excluding Internet)
- Broadcasting industry (excluding Internet)
- Other information services
- Motion picture and sound recording industries
- Computer systems design and related services
- Advertising, public relations, and related services
- Performing arts and related industries, and heritage institutions
- Section 3: Contribution to international trade
- Commercial services category-specific trends (2009 to 2019)
- Conclusion
- Appendix 1: Data comparability
List of figures
- Figure 1 – Economic contribution of copyright-based industries (2009-2019)
- Figure 2 – Annual change in core copyright-based industries and total Canadian GDP (2009-2019)
- Figure 3 – GDP by NAICS sector (annual monthly average for 2019)
- Figure 4 – Annual GDP of core copyright-based industries (2009-2019)
- Figure 5 – Annual GDP of publishing industries (except Internet) (2009-2019)
- Figure 6 – Annual GDP of broadcasting industry (except Internet) (2009-2019)
- Figure 7 – Annual GDP of other information services (2009-2019)
- Figure 8 – Annual GDP of motion picture and sound recording industries (2009-2019)
- Figure 9 – Annual GDP of computer systems design and related services (2009-2019)
- Figure 10 – Annual GDP of advertising, public relations and related services (2009-2019)
- Figure 11 – Annual GDP of performing arts, spectator sports and related industries, and heritage institutions (2009-2019)
- Figure 12 – Employment in core copyright-cased industries (2009-2019)
- Figure 13 – Annual change in employment (2009-2019), core copyright-based industries vs total Canadian employment
- Figure 14 – Employment by NAICS sector (2019)
- Figure 15 – Annual employment in core copyright-based industries (2009-2019)
- Figure 16 – Annual employment in publishing industries (except Internet) (2009-2019)
- Figure 17 – Annual employment in broadcasting industry (except Internet) (2009-2019)
- Figure 18 – Annual employment in other information services (2009-2019)
- Figure 19 – Annual employment in motion picture and sound recording industries (2009-2019)
- Figure 20 – Annual employment in computer systems design and related services (2009-2019)
- Figure 21 – Annual employment in advertising, public relations and related services (2009-2019)
- Figure 22 – Annual employment in performing arts and related industries, and heritage institutions (2009-2019)
- Figure 23 – International transactions in copyright-related services (2009-2019)
- Figure 24 – International transactions in computer and information services (2009-2019)
- Figure 25 – International transactions in copyright and related rights (2009-2019)
- Figure 26 – International transactions in software and other royalties (2009-2019)
- Figure 27 – International transactions in advertising and related services (2009-2019)
- Figure 28 – International transactions in audio-visual services (2009-2019)
- Figure 29 – International transactions in other personal, cultural and recreational services (2009-2019)
List of tables
- Table 1 – Estimated contributions of the copyright-based industries to the Canadian economy (2019)
- Table 2 – Culture domains and sub-domains of the Canadian Framework for Culture Statistics (2011)
List of acronyms
- CAGR
- Compound Annual Growth Rate
- CFCS
- Canadian Framework for Culture Statistics
- COVID-19
- Coronavirus Disease of 2019
- CSA
- Canadian Culture Satellite Account
- GDP
- Gross Domestic Product
- NAICS
- North American Industry Classification System
- NAPCS
- North American Product Classification System
- SCCR
- Standing Committee on Copyright and Related Rights
- SEPH
- Survey of Employment, Payrolls and Hours
- WIPO
- World Intellectual Property Organization
Executive summary
Industries which rely on copyright and related rights contribute significantly to Canada’s economy. Copyright-based industries contributed $95.6 billion to Canada’s GDP and accounted for 4.9% of Canada's overall GDP in 2019. The copyright-based industries are engaged in the creation, production manufacture, performance, broadcasting, communication and exhibition, or distribution and sale of copyrighted works and other protected subject matter.
This report assesses the economic impact of Canada’s copyright-based industries. It presents current data on the contributions of the copyright-based industries to the national economy between 2009 and 2019 in three thematic sections:
- gross domestic product (GDP);
- employment; and
- international trade.
This timeframe presents a portrait of the state of these industries prior to the COVID-19 outbreak, which was declared a pandemic by the World Health Organization in March 2020. The pandemic is significantly impacting the Canadian population and economy. These impacts will be assessed in subsequent reports.
Consistent with international practice, the report adopts a methodology established by the World Intellectual Property Organization (WIPO). It uses data from the System of National Accounts measured by Statistics Canada, and the most recent version of the North American Industry Classification System (NAICS) for GDP and employment data, and the North American Product Classification System (NAPCS) for international trade data.
Key findings in the report include:
- Effects from the 2008 financial crisis impacted the copyright-based industries for several years.
- Since 2012, the core copyright-based industries increased their GDP output by more than a third (35%), and more than doubled the growth rate of the total Canadian economy.
- The core copyright-based industries account for a growing share of total Canadian employment, amounting to 614,950 employed in 2019, which represents an increase of 31.5% from 2009.
- Despite significant growth in terms of occupied positions, much remains unknown about the nature of this employment and the future of work in an evolving industry context.
- Canada has exported more copyright-related services than it has imported, maintaining a trade balance surplus from 2009 ($2.5 billion) to 2019 ($5.6 billion).
- Computer Systems Design and Related Services was the largest subsector, accounting for almost half of the core copyright-based industries’ economic impact in terms of both GDP ($32.7 billion in 2019) and employment (261,285 occupied positions in 2019); it also accounted for the largest share of international transactions and maintained a trade surplus from 2009 to 2019.
- Audio-Visual Services was the second largest contributor to Canada's international transactions related to the copyright-based industries, more than doubling its trade volume from 2009 to 2019.
- Digital disruption, new technology and internet prominence are transforming the copyright-based industries, and raising issues on how their economic impacts are classified and measured.
- Despite common trends across the aggregated copyright-based industries, variation exists between subsectors in terms of trade, employment and output over time.
Introduction
There is widespread recognition in international research and policy spheres of the increasing importance of the economic contribution of copyright-based industries. This is true for many countries, including Canada. Estimating the contribution of the copyright-based industries provides a starting point for developing a picture of the importance of these industries and the related copyrights to the Canadian economy. Undertaken by the Department of Canadian Heritage, this study assesses the economic importance of the copyright-based industries in Canada, in terms of gross domestic product, employment, and international trade.
Internationally, the contribution of the copyright and related rights sector to economic, social, and cultural growth became a larger focus for the World Intellectual Property Organization (WIPO) in the early 2000s. At that time, the Standing Committee on Copyright and Related Rights (SCCR) recognized that understanding the economic contribution of activities based on copyright protection would facilitate policy development to support the relevant industries and activities. As many prior international studies focused on the economic contribution of this sector to a specific national economy, they often differed in methodologies, practices, and objectives, making it difficult to compare the findings.
To assist countries in quantifying the economic contribution of creative activities, the SCCR Secretariat undertook a project to develop a Guide on Surveying the Economic Contribution of the Copyright-Based Industries. Supported by the Government of Finland, WIPO started by convening an international Working Group of Experts in 2002, consisting of economists with experience in studying or conducting economic research on the copyright-based industries. They also sought input from several international non-governmental organizations active in the copyright-based industries.
The result was an established basis for comparison and a shared framework for national studies built on reliable data and common methodologies. Several WIPO member states have produced national reports on the economic impact of the copyright-based industries to their respective economies. Canada produced and shared a national study in 2004; this report provides an update to that prior work.
It is generally understood that some industries are more closely linked to copyright than others. Some industries exist entirely in order to produce copyrighted materials for consumption, some exist primarily to distribute copyrighted materials, and others exist to both produce and distribute copyrighted materials.
Based on its experience, this shared approach was codified by WIPO, which updated its guidelines and published a 2015 Revised Edition of its Guide on Surveying the Economic Contribution of the Copyright Industries. It recommends the following nine groups be included in any survey of the economic impact of the core copyright-based industries:
- Press and literature;
- Music, theatrical productions, operas;
- Motion picture and video;
- Radio television;
- Photography;
- Software, databases, and computer games;
- Visual and graphic arts;
- Advertising services; and
- Copyright collective management societies.
WIPO also recommends that the national industrial classification systems and the System of National Accounts within a country are perhaps the best sources of statistics for the copyright-based industries. In Canada, the System of National Accounts is measured by Statistics Canada using the North American Industry Classification System (NAICS). The current version, NAICS 2017 (v.3.0), is a system of codes developed by the statistical agencies of Canada, Mexico and the United States, used to classify industries according to the products and/or services that the industries produce and/or sell. Using Statistics Canada data, this study employs a methodological approach that is consistent with the classification of the copyright-based industries suggested by WIPO.
Core copyright-based industries
Following the publication of the first WIPO Guide in 2003, it has become general practice to refer to the collection of industries that directly involve copyrightable goods and services as core copyright industries. WIPO defines the core copyright-based industries as industries which are wholly engaged in the creation, production and manufacture, performance, broadcasting, communication and exhibition, or distribution and sale of works and other protected subject matter. As such, the mapping of Canada’s copyright-based industries relied on the following NAICS codes:
- 511 – Publishing industries (except Internet)
- Publishing newspapers, periodicals, books, databases, software and other works that are characterized by the intellectual creativity required in their development and are usually protected by copyright. Publishers distribute or arrange for the distribution of copies of these works.
- 512 – Motion picture and sound recording industries
- Producing and distributing video and audio recordings or providing related services, such as post-production services, exhibition services, and motion picture processing and developing services. Sound recording studios are also included.
- 515 – Broadcasting (except Internet)
- Operation of radio and television broadcasting studios and facilities for the transmission of a variety of radio and television broadcasts.
- 519 – Other information services
- Establishments primarily engaged in providing other information services including news syndicates, libraries and archives, internet publishing and broadcasting, and web search portals not classified to any other industry.
- 5415 – Computer systems design and related services
- Expertise in the field of information technologies through one or more activities, such as writing, modifying, testing, and supporting software to meet the needs of a particular customer, including custom video design and development, among other services.
- 5418 – Advertising, public relations, and related services
- Creation of mass-media advertising or public relation campaigns; placing advertising in media; selling media time or space; creating and implementing display advertising campaigns; creating and implementing direct advertising campaigns; and providing related services.
- 71[x] – Arts, entertainment, and recreation (except [713] Amusement, gambling, and recreation industries)
- By removing [713] Amusement, Gambling, and Recreation Industries, the remaining elements of [71] Arts, Entertainment, and Recreation (referred to here as 71[x]) refers to the production, or organization and promotion, of live presentations that involve performances of actors and actresses, singers, dancers, musical groups and artists, athletes, and other entertainers. It also includes independent (freelance) entertainers and artists and the establishments that manage their careers. It recognizes four basic processes: producing events, organizing and promoting events, managing and representing entertainers, and providing the artistic, creative and technical skills necessary for the production of artistic products and live performances. This category also captures the preservation and exhibition of objects, sites and natural wonders of historical, cultural and educational value. Due to the structure of the NAICS codes, the contribution of spectator sports could not be removed.
WIPO finds that the above industries could not exist or would be significantly different without the existence of copyright to protect works or other subject matter. Therefore, the entirety of the value added by these industries is the contribution of copyright to the national economy. This is applied for the methods used in this report.
The core copyright-based industries are the focus of this study. However, they only include industries that are exclusively copyright-based, and exclude interdependent, partial, and non-dedicated copyright industries, which have a functional relationship to the core-copyright based industries. These excluded industries will be described in detail in the Limitations section of this report.
In determining the total contribution of the copyright-based industries to the Canadian economy, the estimate needs to go beyond the core copyright-based industries and include the contribution of the interdependent, partial, and non-dedicated support industries (collectively referred to as non-core). Canada’s national study in 2004 relied on the premise, estimated by a 2001 Industry Canada study, that the contribution of the non-core copyright-based industries is approximately equal to 35% of the size of the core copyright-based industries in terms of GDP.Footnote 1 The role of the copyright-based industries in the Canadian economy have since changed and the methodologies used to study it have evolved, but estimating the exact portion of the economic contribution of these industries in Canada remains a challenge. In fact, there is no satisfactory means of estimating the economic size of these industries based on currently available Statistics Canada data, and the time and resource constraints of this study precluded gathering more specific data.
WIPO’s 2015 guide explains that, in the absence of data, international comparisons can be a valid source of information to establish copyright factors, if it can be established that the countries have similar legal frameworks, industry structures, working conditions, or other economically significant factors. Therefore, this study uses comparable international data to assess the size of Canada’s non-core copyright-based industries. Among the 50 other countries that published economic performance reports on WIPO’s website, the United States, Finland, and Australia are considered as possible comparisons to Canada. The most recent American publication found that the GDP of the non-core copyright-based industries equal 70% of the GDP of the core copyright-based industries,Footnote 2 while the Finnish analysis show that proportion at an average of 20%,Footnote 3 and the Australian data show that proportion at 38%.Footnote 4 The American non-core copyright-based industries seem to make up such a large percentage of its core copyright-based industries that it would reasonably represent the upper limit of the possible scenario in Canada. In addition, the overall US economy and copyright-based industries differ substantially in scale and composition, that it does not provide an ideal basis for comparison to Canada. Finland’s percentage also seems too dissimilar to Canada’s to justify a comparison, and the overall Finnish economy and copyright-based industries are so smaller than Canada’s that a comparison would prove difficult. Australia seems to be a more reasonable and justifiable comparison – Australia’s proportion is 38%, which is similar to Canada’s 35% factor from 2004, and the two countries bear other similarities in terms of key economic indicators. Factors such as territory, population, economic growth, and employment indicators tend to justify international comparisons between Canada and Australia.
In addition to similarities in terms of overall economic indicators, Australia’s copyright economy seems to be fairly comparable to Canada’s. Australia’s 2017 report found that the core copyright-based industries generated AU$89.2 billion in 2016 (5.4% of the country’s total GDP),Footnote 5 while this study reveals that Canada’s core copyright-based industries generated CA$61.3 billion in the same year (3.3% of total GDP). Similar comparability is observed when looking at the 2016 figures for each country’s employment data. Despite some discrepancies, which are explicable given that we are comparing two different countries with distinct copyright industries and structures, the Australian and Canadian copyright economies seem to exist on a scale that is comparable and meaningful for our purposes. Consequently, this study relies on the assumption that the economic size of Canada’s copyright-based industries is somewhat comparable to the economic size of Australia’s copyright-based industries.
In the Australian report, data that was collected and analyzed specifically for the study show that the GDP of the country’s non-core copyright-based industries makes up 38% of the GDP of the country’s core copyright-based industries. Therefore, this study employs the assumption that the contribution of Canada’s non-core copyright-based industries could be approximately equal to 38% of the size of Canada’s core copyright-based industries in terms of GDP. The same logic applies for estimating similar totals for employment. The Australian data show that the country’s non-core copyright-based employment accounts for 52% of the core copyright-based employment, which informs this study’s assumption that the contribution of Canada’s non-core copyright-based employment accounts for a similar percentage of Canada’s copyright-based employment.
| Copyright industries | Description | GDP (CA$ million) | Employment (number of occupied positions) |
|---|---|---|---|
| Core | Primarily involved in the creation, manufacture, production, broadcast and distribution of copyrighted works and have a substantial level of copyright activities. These are industries that would not be in existence if not for the copyright subject or matter. | 69,296 | 614,950 |
| Non-core | - | 26,333 | 319,774 |
| Interdependent | Involved in the manufacture, performance, broadcast and communication of copyright material, in order to support and facilitate the creation of copyrighted works and other protected subject matter. | 14,869 | 157,426 |
| Partial copyright | Industries where a portion of activities which are related to copyright through manufacture, performance, exhibition, broadcast, communication or distribution and sales. | 5,260 | 70,414 |
| Non-dedicated support | Industries in which a portion of the activities are related to facilitating broadcast, communication, distribution or sales of works and other protected subject matter, and whose activities have not been included in the core copyright industries. | 6,204 | 91,934 |
| All copyright industries | - | 95,629 | 934,724 |
Source: Statistics on the contribution of the core copyright-based industries to the Canadian GDP and employment are based on Statistics Canada data. Statistics on the contribution of the non-core copyright-based industries, including the interdependent, partial copyright and non-dedicated support industries, are based on author’s calculations of Statistics Canada data using international comparable factors relating to the Australian 2017 report.
Table 1 provides a breakdown of the estimated contribution of the core and non-core copyright-based industries to the Canadian GDP and employment. We should note that the breakdown of the non-core copyright-based industries data are based on the factors shown in the Australian report. Table 1 does not provide estimates relating to international trade data, because significant differences in trade numbers and context make international comparisons less reliable. Even though reasonable comparisons were drawn between Australia and Canada’s GDP and employment numbers, trade numbers are so different between the two countries that we cannot draw an accurate comparison. In addition, qualitative factors that highly affect copyright-related trade differ greatly, such as trade volume, imports and exports, trade partners and the context of copyright-related trade. We plan to include a more in-depth examination of Canada’s copyright-related trade of interdependent, partial and non-dedicated support industries in future iterations of this report.
Limitations
The report has limitations in terms of the data used to analyze the economic impact of the copyright-based industries and the classification of the subsectors that comprise these industries.
NAICS codes
The main limitation regarding the NAICS codes is the disaggregation level of the publicly available data provided by Statistics Canada. The available data limits the possibility for detailed analysis specifically in certain subsectors. Notably, the data relating to the GDP of the Arts, Entertainment, and Recreation sector are only published at the subsector level which combines the data of the Performing Arts, Spectator Sports and Related Industries and Heritage Institutions subsectors, making it impossible to separate the impact of Spectator Sports and that of Performing Arts and Related Industries, and Heritage Institutions. As such, even though the data used in this study are structured using the latest NAICS version, the source surveys may not collect data below a certain NAICS level and the data tables may include custom aggregations of NAICS codes featured by Statistics Canada. This limits the level to which we were able to breakdown the industries and subsectors of the copyright-based industries to analyze specific trends.
Another limitation regarding the NAICS codes is the analysis of the data on emerging technologies and digital content in the copyright-based industries. The Other Information Services subsector consists of information-related establishments that have not yet been classified to any other industry. For instance, GDP and employment data related to internet broadcasting and internet publishing are included in the subsector Other Information Services, which also includes news syndicates, libraries and archives, and web search portals. As a result, this limits the analysis of the respective digital trends in the publishing and broadcasting industries, and it limits the comparison of the economic impacts of digital content and more traditional content in these industries. Finally, while including this category is consistent with current NAICS classification, the results are therefore not entirely comparable to previous iterations of this study.
Non-core copyright-based industries
This report focuses on the core copyright-based industries due to limitations in the disaggregation level of the data provided by Statistics Canada. In addition to the core copyright industries, other industries are significantly related to the production and distribution of copyrighted materials, while not being exclusively copyright-based industries. WIPO defines these industries in three categories: interdependent copyright industries, partial copyright industries, and non-dedicated support industries. These categories are explained in more detail below. Although these industries are functionally related to the core copy-right based industries, they fall outside the scope of this study.
In cases where the absence or unavailability of data make it difficult to fully represent the reality of national copyright-based industries, WIPO’s 2015 guidelines suggest that “assumptions or estimates can be used, although, inevitably, this method can affect reliability.”Footnote 6 Although filling data gaps would be preferable – and remains a possibility for future iterations of this study – the assumptions used in this report are evidence-based and reasonably modeled after a comparable peer country’s economic structure for determining multiplier impacts on GDP and employment. While this poses caveats, it nonetheless reflects the broad reality of Canada’s copyright-based industries, given constraints at this time.
Interdependent copyright industries
These are industries engaged in the production, manufacture and sale, and renting or leasing of equipment. Their function is wholly or primarily to facilitate the creation, production, or use of works and other protected subject matter.
These industries are often referred to as copyright-related and operate as complements to the core copyright industries. Essentially, the outputs of these industries are consumed jointly with those of the core industries in a way that is dependent on the availability of copyrighted works. For example, television programs cannot be watched without a television, and video games cannot be played without some kind of device (e.g. console, mobile devices). Although these industries do not themselves deal with copyrighted works, they significantly facilitate the use of copyrighted works.
Partial copyright industries
These are industries in which a portion of the activities is related to works and other protected subject matter and may involve creation, production and manufacture, performance, broadcasting, communication and exhibition, and distribution and sales.
This category includes industries where only the portion that is attributable to copyrighted works and other protected subject matter should be included. For example, a portion of the activities of the apparel, textiles and footwear industries involve the creation, production and manufacture, exhibition, and distribution and sales of copyrighted works and other protected subject matter. For instance, copyrighted artwork may be used in the design of clothing apparel. Among others, additional partial copyright industries include jewelry and coins; other crafts; furniture; architecture, engineering, surveying; and interior design.
Non-dedicated support industries
These are industries in which a portion of the activities is related to facilitating broadcast communication and the distribution or sale of works and other protected subject matter whose activities have not been included in the core copyright industries.
This category generally includes a number of industries that benefit from spillover effects of the copyright industries but are not directly related to the copyright industries themselves. The non-dedicated support industries include general wholesale and retail, general transportation, and information and communication. These industries generally refer to business services and delivery modes that may facilitate the communication, distribution and sale of copyrighted works and other protected subject matter. Because the non-dedicated support industries share some functions with other industries, some portions would ideally be taken into account for the purpose of measuring the economic impact of the copyright-based industries; however, dividing up the impact of these industries remains a challenge as enterprises do not usually track this data separately and statistical agencies do not typically measure to this level of detail.
Data comparability
It is important to note that the methodology used in this study draws from different data aggregations and categories than the Canadian Culture Satellite Account (CSA). The CSA is an accounting framework – or, simply stated, a statistical tool – developed by Statistics Canada to measure the economic importance of culture, the arts, heritage and sport to the Canadian economy. There is a substantive degree of overlap between the core copyright-based industries used for this study and the culture sub-domains used by the CSA. However, there are also important differences between what the two represent. In this sense, the CSA and the Economic Impact of Canada’s Copyright-Based Industries study provide different – though complementary – views of the Canadian economy. See Annex 1 for additional information about the CSA.
Broader limitations
The absence of data from 2020, and thus analysis related to the COVID-19 pandemic’s impact on the economic performance of the copyright-based industries in Canada, represents a limitation of the report. However, the report presents an updated portrait of the economic impact of the core copyright-based industries in Canada over the last 10 years, and offers a solid basis for comparison for future reports. Future reports have important potential for presenting data from 2020 onwards and analyzing the ramifications of the pandemic on the GDP, employment, and international transactions of Canada’s copyright-based industries.
The analysis contained in this report relies primarily on data provided by Statistics Canada. The data used in this report are structured using the latest NAICS version (for GDP and employment) and NAPCS (for international trade), and were retrieved from Statistics Canada’s website in November and December of 2020. Footnote 7 The data tables used in this report are inclusive of custom aggregations made by Statistics Canada and are therefore not entirely comparable to previous iterations of this study.
Section 1: Economic contribution of the copyright-based industries
Contribution to Canada’s Gross Domestic Product (GDP)
For the purposes of calculating the contribution of the copyright-based industries to Canada’s gross domestic product, the study focuses on the NAICS codes and methodology described in the previous section.Footnote 8
One significant change to the methodology for calculating the economic contribution is that it now includes Other Information Services [519]. Other Information Services includes news syndicates, libraries and archives, internet publishing and broadcasting, and web search portals. This NAICS code includes establishments that are primarily engaged in the production or distribution of copyrighted works or subject matter and should be included whenever data is available.
Source of Data: Statistics Canada. Table 36-10-0434-01 Gross domestic product (GDP) at basic prices, by industry, monthly (x 1,000,000).
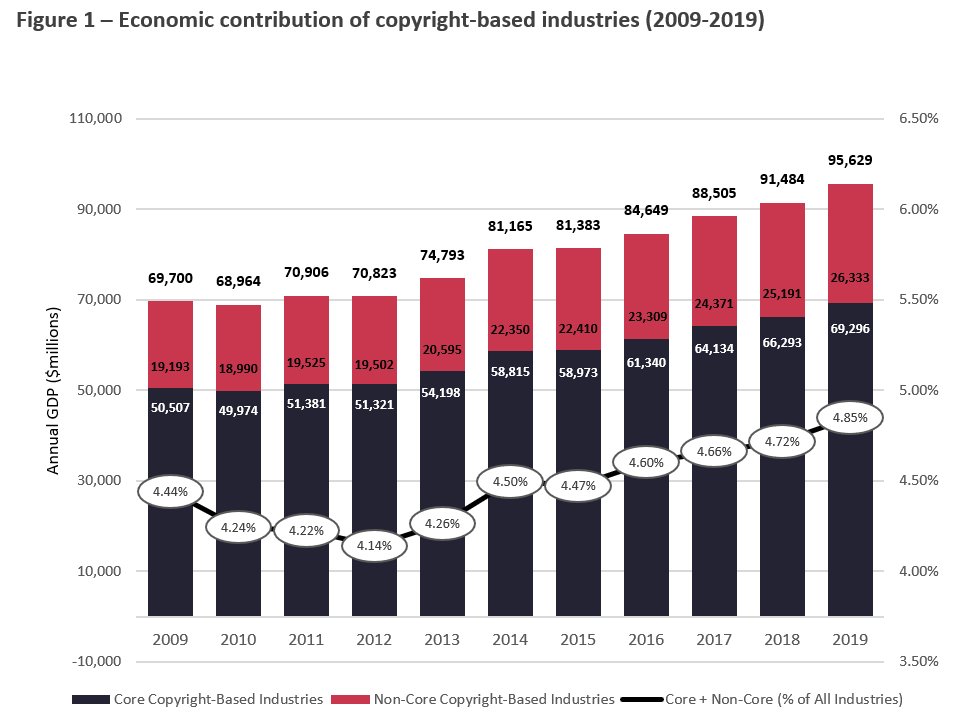
Figure 1 – Economic contribution of the copyright-based industries (2009-2019) – text version
| 2009 | 2010 | 2011 | 2012 | 2013 | 2014 | 2015 | 2016 | 2017 | 2018 | 2019 | |
|---|---|---|---|---|---|---|---|---|---|---|---|
| Core + non-core copyright-cased industries | 69,700 | 68,964 | 70,906 | 70,823 | 74,793 | 81,165 | 81,383 | 84,649 | 88,505 | 91,484 | 95,629 |
| Core copyright-based industries | 50,507 | 49,974 | 51,381 | 51,321 | 54,198 | 58,815 | 58,973 | 61,340 | 64,134 | 66,293 | 69,296 |
| Non-core copyright-based industries | 19,193 | 18,990 | 19,525 | 19,502 | 20,595 | 22,350 | 22,410 | 23,309 | 24,371 | 25,191 | 26,333 |
| Core + con-core as a % of all industries | 4.44% | 4.24% | 4.22% | 4.14% | 4.26% | 4.50% | 4.47% | 4.60% | 4.66% | 4.72% | 4.85% |
Figure 1 illustrates the total economic contribution of the copyright-based industries, including both core and non-core copyright-based industries, from 2009 to 2019. For a more detailed breakdown of the contribution of the non-core copyright-based industries to Canada’s GDP in 2019, refer to Table 1. As shown above, the copyright-based industries consistently contribute between four to five percent of Canada’s total GDP in the past decade. In both real terms and as a proportion of the national economy, the copyright-based industries have also been growing in recent years. This analysis begins at an interesting point Canada’s recent economic history, in the wake of the 2008 global financial crisis.
Following the financial crisis, it is not surprising that the overall Canadian economy declined. Based on author calculations using the same Statistics Canada data source, Canada’s overall GDP fell by 3.2% from 2008 to 2009. By contrast, the copyright-based industries did not decline to the same degree, falling instead by 1.2% that same year. While the overall economy bounced back rapidly in 2009, experiencing 3.5% growth, the copyright-based industries continued their decline, falling by another 1%, before stabilizing. The copyright-based industries increased significantly from 2013 to 2019, a growth of $20.8 billion or 27.9%. By 2019, the copyright-based industries had grown to $95.6 billion, accounting for 4.9% of the Canadian economy.
Source of Data: Statistics Canada. Table 36-10-0434-01 Gross domestic product (GDP) at basic prices, by industry, monthly (x 1,000,000).
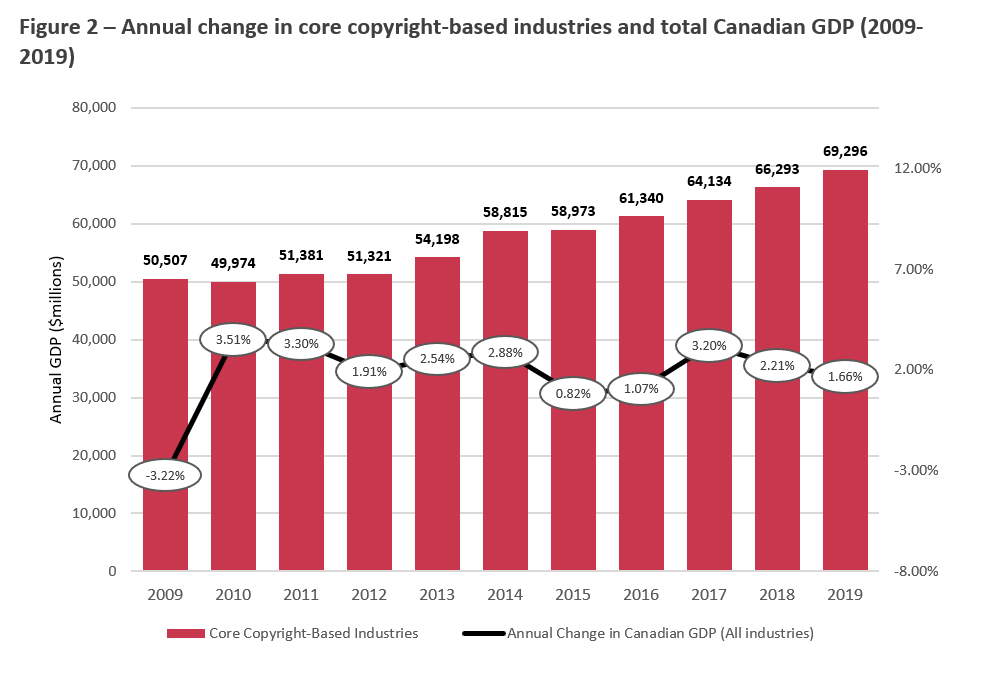
Figure 2 – Annual change in core copyright-based industries and total Canadian GDP (2009-2019) – text version
| 2009 | 2010 | 2011 | 2012 | 2013 | 2014 | 2015 | 2016 | 2017 | 2018 | 2019 | |
|---|---|---|---|---|---|---|---|---|---|---|---|
| Core copyright-based industries | 50,507 | 49,974 | 51,381 | 51,321 | 54,198 | 58,815 | 58,973 | 61,340 | 64,134 | 66,293 | 69,296 |
| Annual change in Canadian GDP | -3.22% | 3.51% | 3.30% | 1.91% | 2.54% | 2.88% | 0.82% | 1.07% | 3.20% | 2.21% | 1.66% |
Figure 2 shows the contribution level of the core copyright-based industries over time, as well as the annual growth rates of the overall Canadian economy in terms of Gross Domestic Product (GDP). The Canadian economy has grown at a relatively stable rate during the past decade (2009 to 2019), growing by a compound annual growth rate (CAGR) of 2.3% per year.
Based on these data, author calculations find that the economic downturn in 2008 resulted in the core copyright-based industries experiencing a slight period of decline that was less pronounced but longer lasting when compared to the drop of 3.2% for the overall Canadian economy from 2008 to 2009. Following a brief dip and recovery, the rate of GDP growth in the core copyright-based industries started outpacing the growth of Canada’s overall GDP. Since 2012, the core copyright-based industries grew at a CAGR of approximately 4.4% per year, compared to 2.1% per year for the overall Canadian economy for the same post-2012 period. This growth will be further explored in the following section, where the data is analyzed for specific sectors.
NAICS sector ranking
The North American Industry Classification System (NAICS) groups economic activity into 20 sectors according to “similarity in the production processes used to produce goods and services”.Footnote 9 In the most recent version of NAICS, each sector has its own group of subsectors (total of 102), industry groups (total of 324), industries (total of 710), and Canadian industries (total of 928).Footnote 10 Before exploring the GDP contribution and trends within the copyright-based industries, the following figure situates the contribution of this sector in context.
Source of Data: Statistics Canada. Table 36-10-0434-01 Gross domestic product (GDP) at basic prices, by industry, monthly (x 1,000,000).
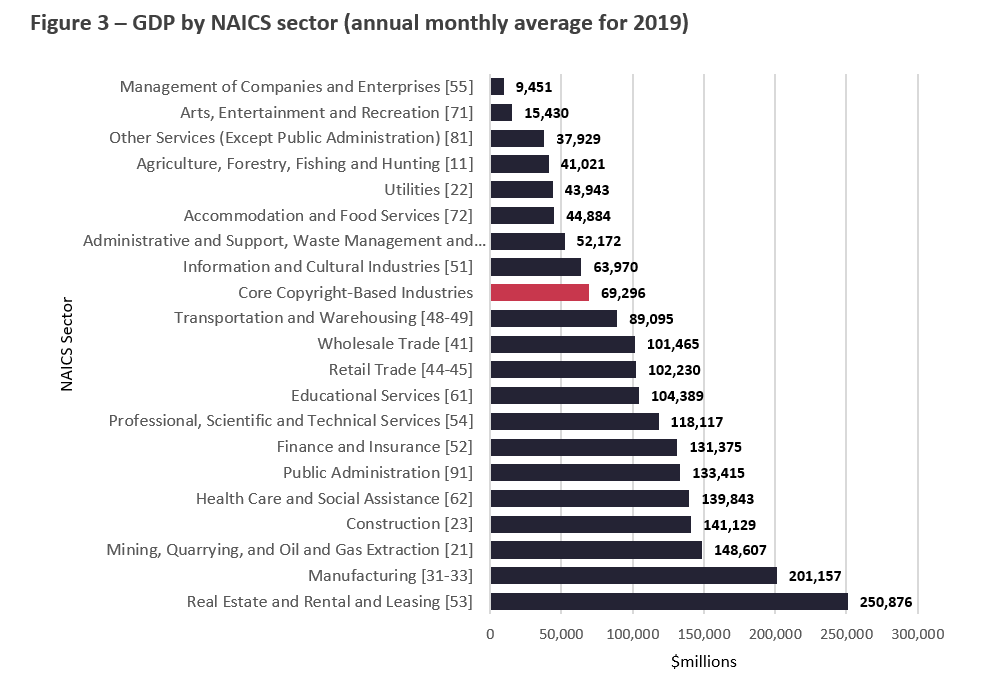
Figure 3 – GDP by NAICS sector (annual monthly average for 2019) – text version
| 2019 | |
|---|---|
| Real estate and rental and leasing | 250,876 |
| Manufacturing | 201,157 |
| Mining, quarrying, and oil and gas extraction | 148,607 |
| Construction | 141,129 |
| Health care and social assistance | 139,843 |
| Public administration | 133,415 |
| Finance and insurance | 131,375 |
| Professional, scientific and technical services | 118,117 |
| Educational services | 104,389 |
| Retail trade | 102,230 |
| Wholesale trade | 101,465 |
| Transportation and warehousing | 89,095 |
| Core copyright-based industries | 69,296 |
| Information and cultural industries | 63,970 |
| Administrative and support, waste management and remediation services | 52,172 |
| Accommodation and food services | 44,884 |
| Utilities | 43,943 |
| Agriculture, forestry, fishing and hunting | 41,021 |
| Other services (except public administration) | 37,929 |
| Arts, entertainment and recreation | 15,430 |
| Management of companies and enterprises | 9,451 |
Figure 3 compares the core copyright-based industries to the 20 sectors, ranking them by the size of their contribution to the Canadian economy, based on each sector’s annual monthly average contribution to national GDP in 2019. As defined earlier, the estimate for the core copyright-based industries comprises components from three different sectors, including Information and Cultural Industries [51], Professional, Scientific and Technical Services [54], and Arts, Entertainment and Recreation [71]. These sectors are also individually included in Figure 3 for comparison purposes.
Statistics Canada estimates that the core copyright-based industries contributed $69.3 billion to the Canadian economy in 2019. This compares favourably to a number of sectors of the Canadian economy, ranking at slightly below the midpoint among NAICS sectors in terms of their GDP contributions. This means that copyright-based industries are a significant driver of the Canadian economy, contributing value in terms of goods and services to the overall economy. It is also a high-growth sector. At an increase of 37.2% from 2009 to 2019, the core copyright-based industries grew faster than the overall Canadian economy (25.6% in the same time period).
Breakdown of core copyright-based industries
As outlined in the introduction, the core copyright-based industries are reflected in seven NAICS code groupings. They are:
- Publishing industries (except internet) [511];
- Motion picture and sound recording industries [512];
- Broadcasting (except internet) [515];
- Other information services [519] (which include, among other things, internet publishing and internet broadcasting);
- Computer systems design and related services [5415];
- Advertising, public relations, and related services [5418]; and
- Arts, Entertainment, and Recreation [71x] (excluding Amusement, gambling, and recreation industries [713]).
This last category can also be referred to as Performing arts, spectator sports and related industries, and heritage institutions [71A]. These seven industries make up the core copyright-based sector and are explored below in more depth in Figures 4 through 11.
Source of Data: Statistics Canada. Table 36-10-0434-01 Gross domestic product (GDP) at basic prices, by industry, monthly (x 1,000,000).
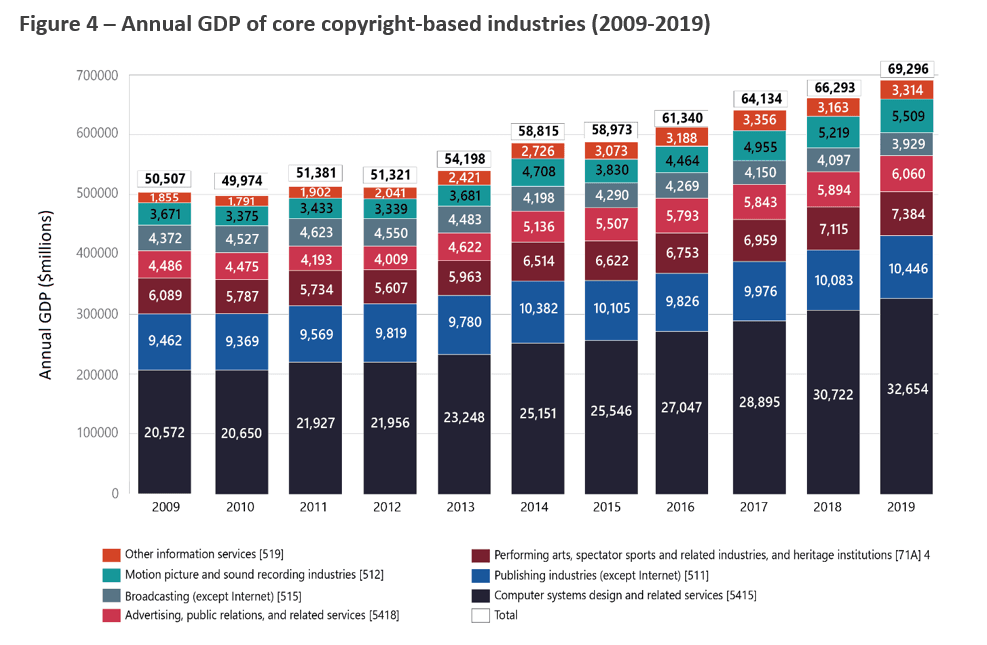
Figure 4 – Annual GDP of core copyright-based industries (2009-2019) – text version
| 2009 | 2010 | 2011 | 2012 | 2013 | 2014 | 2015 | 2016 | 2017 | 2018 | 2019 | |
|---|---|---|---|---|---|---|---|---|---|---|---|
| Core copyright-based industries | 50,507 | 49,974 | 51,381 | 51,321 | 54,198 | 58,815 | 58,973 | 61,340 | 64,134 | 66,293 | 69,296 |
| Computer systems design and related Services [5415] | 20,572 | 20,650 | 21,927 | 21,956 | 23,248 | 25,151 | 25,546 | 27,047 | 28,895 | 30,722 | 32,654 |
| Publishing industries (except Internet) [511] | 9,462 | 9,369 | 9,569 | 9,819 | 9,780 | 10,382 | 10,105 | 9,826 | 9,976 | 10,083 | 10,446 |
| Performing arts, spectator sports and related industries, and heritage institutions [71A] | 6,089 | 5,787 | 5,734 | 5,607 | 5,963 | 6,514 | 6,622 | 6,753 | 6,959 | 7,115 | 7,384 |
| Advertising, public relations, and related services [5418] | 4,486 | 4,475 | 4,193 | 4,009 | 4,622 | 5,136 | 5,507 | 5,793 | 5,843 | 5,894 | 6,060 |
| Broadcasting (except Internet) [515] | 4,372 | 4,527 | 4,623 | 4,550 | 4,483 | 4,198 | 4,290 | 4,269 | 4,150 | 4,097 | 3,929 |
| Motion picture and sound recording industries [512] | 3,671 | 3,375 | 3,433 | 3,339 | 3,681 | 4,708 | 3,830 | 4,464 | 4,955 | 5,219 | 5,509 |
| Other information services [519] | 1,855 | 1,791 | 1,902 | 2,041 | 2,421 | 2,726 | 3,073 | 3,188 | 3,356 | 3,163 | 3,314 |
Figure 4 provides the annual GDP contribution of the core copyright-based industries, from 2009 to 2019, broken down by the different subsector and industry group components. Of these components, the Computer Systems Design and Related Services [5415] subsector contributed the largest share of the core copyright-based industries. At $32.7 billion in 2019, it accounts for almost half of the total contribution of the core industries ($69.3 billion). This is a high-growth subsector, which has seen gains of 27.8% between 2015 and 2019. At nearly $10.5 billion, the Publishing Industries (Except Internet) [511] contributed the second largest share.
Industry-specific trends (2009 to 2019)
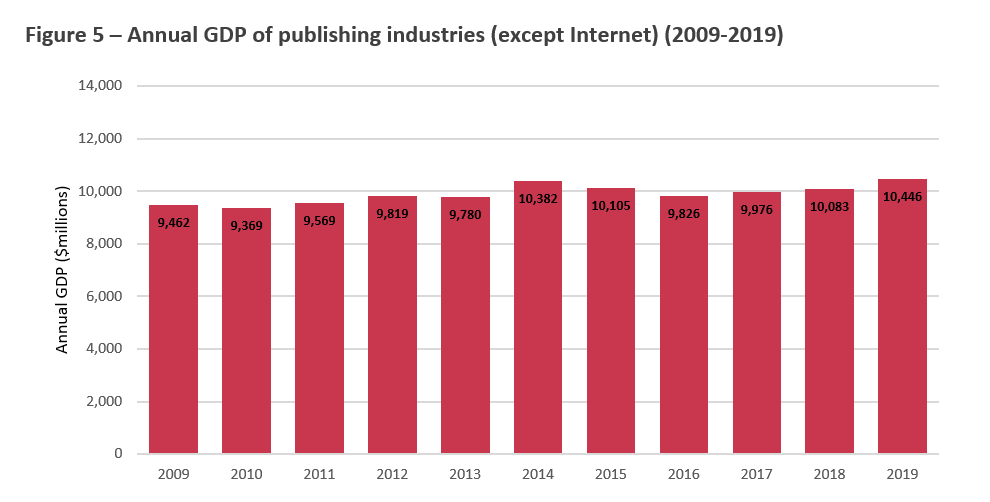
Publishing industries (excluding Internet)
The NAICS classification code for the broader publishing industries excludes internet publishing. Instead, internet publishing is captured with Other Information Services but not at a level that can be separated out from internet broadcasting. As a result, this section focuses on the publishing industry excluding internet activities.
Source of Data: Statistics Canada. Table 36-10-0434-01 Gross domestic product (GDP) at basic prices, by industry, monthly (x 1,000,000).
Figure 5 – Annual GDP of publishing industries (except Internet) (2009-2019) – text version
| 2009 | 2010 | 2011 | 2012 | 2013 | 2014 | 2015 | 2016 | 2017 | 2018 | 2019 | |
|---|---|---|---|---|---|---|---|---|---|---|---|
| Publishing industries (except Internet) [511] | 9,462 | 9,369 | 9,569 | 9,819 | 9,780 | 10,382 | 10,105 | 9,826 | 9,976 | 10,083 | 10,446 |
Like many other industries, the financial crisis had a significant and immediate impact on publishing. As shown in Figure 5, the GDP of the publishing industries contracted by 10.2% in one year, from $10.5 billion in 2008 to $9.5 billion in 2009. At this time, several factors may have contributed to this decline, as many publishing institutions downsized, merged, or closed their operations. At the same time, technology was also having a transformative effect on the industry. The introduction of e-reading technologies and an increasing move towards digital and self-publishing meant that publishers needed to adapt to evolving business models.
In the years that followed, starting in 2010 the industry experienced a gradual recovery of approximately 2.6% per year to attain a GDP value of nearly $10.4 billion in 2014. Since then, the industry has contracted slightly and recovered. Over the past decade, the general trend despite slight fluctuations has been modest growth. In 2019, the publishing industries (except internet) contributed $10.5 billion to the Canadian economy.
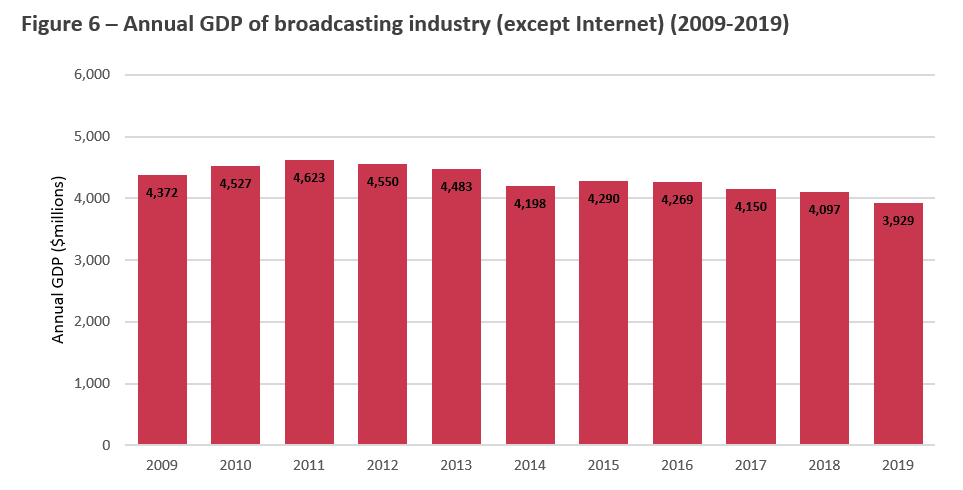
Broadcasting industry (excluding Internet)
The NAICS code for broadcasting excludes internet broadcasting, which is captured with internet publishing in Other Information Services. This section focuses on the non-internet based broadcasting industry, which includes establishments primarily engaged in operating radio and television broadcasting enterprises. This category encompasses radio and television that is “terrestrial” in that it is transmitted by radio signal to an antenna, and “pay and specialty,” which includes cable and satellite services.
Source of Data: Statistics Canada. Table 36-10-0434-01 Gross domestic product (GDP) at basic prices, by industry, monthly (x 1,000,000).
Figure 6 – Annual GDP of broadcasting industry (except Internet) (2009-2019) – text version
| 2009 | 2010 | 2011 | 2012 | 2013 | 2014 | 2015 | 2016 | 2017 | 2018 | 2019 | |
|---|---|---|---|---|---|---|---|---|---|---|---|
| Broadcasting (except Internet) [515] | 4,372 | 4,527 | 4,623 | 4,550 | 4,483 | 4,198 | 4,290 | 4,269 | 4,150 | 4,097 | 3,929 |
Figure 6 illustrates that from 2009 to 2011, the industry showed positive signs of growth (2.8% per year), peaking with an economic contribution to the Canadian economy of $4.6 billion in 2011. In this initial period, it is possible that as costs declined and the internet continued to provide new opportunities for content creators, content production was increasing significantly. However, since 2011, broadcasting has experienced a general decline of approximately 2% per year to $3.9 billion in 2019. This observed 15% drop from 2011 to 2019 in GDP contribution by non-internet broadcasting is at least partially attributable to trends in consumer preferences, which have shifted toward consuming content on multinational internet-based digital media services such as streaming and social media platforms.
Broadcasting is one area where Statistics Canada has published data at the industry group level, from which basis economic impact can be distinguished between terrestrial radio and television broadcasting and pay and specialty. Author calculations find that both industry groups have been in decline for several years (since 2011 for terrestrial radio and television, since 2013 for pay and specialty television). In each case, the industry group economic contribution was down from its 2009 levels by 10.7% and 8.5%, for terrestrial radio and television broadcasting, and for pay and specialty television, respectively.
Other information services
The Other Information Services subsector consists of information-related establishments that have not yet been classified to any other industry. The main components include news syndicates, libraries and archives, internet publishing and broadcasting, and web search portals.

Source of Data: Statistics Canada. Table 36-10-0434-01 Gross domestic product (GDP) at basic prices, by industry, monthly (x 1,000,000).
Figure 7 – Annual GDP of other information services (2009-2019) – text version
| 2009 | 2010 | 2011 | 2012 | 2013 | 2014 | 2015 | 2016 | 2017 | 2018 | 2019 | |
|---|---|---|---|---|---|---|---|---|---|---|---|
| Other information services [519] | 1,855 | 1,791 | 1,902 | 2,041 | 2,421 | 2,726 | 3,073 | 3,188 | 3,356 | 3,163 | 3,314 |
As shown in Figure 7, from 2009 to 2019, Other Information Services grew significantly, at a pace that accelerated before leveling off after 2016. Reaching nearly $3.4 billion in 2017, this industry sub-sector had almost doubled in less than 10 years. It has since experienced a slight dip and recovery, contributing over $3.3 billion to Canada’s GDP in 2019. Overall, the GDP of Other Information Services grew at a compound annual growth rate (CAGR) of almost 6% in the ten-year period from 2009 to 2019.
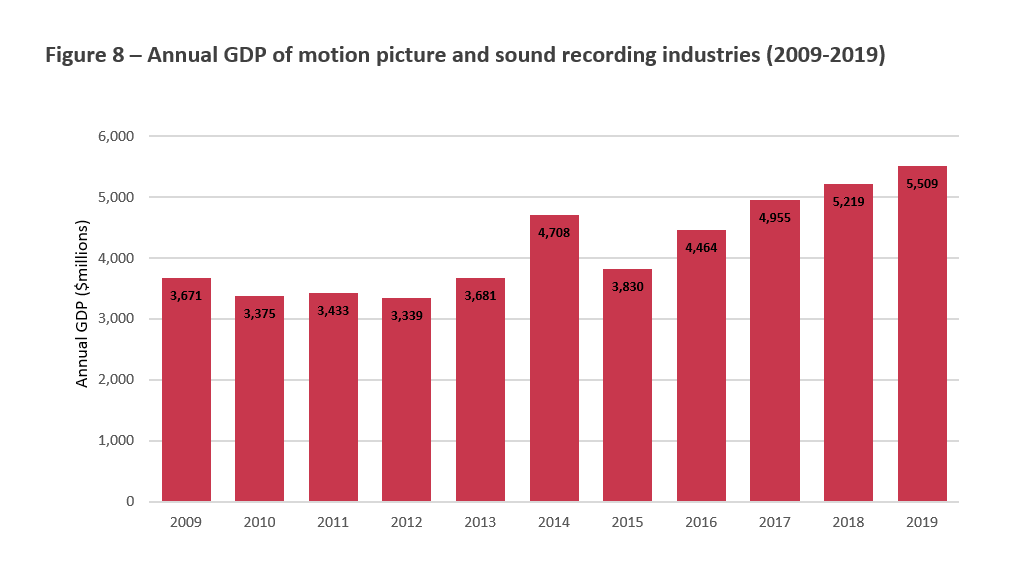
Motion picture and sound recording industries
Both motion picture and sound recording industries experienced disruptions in their financing and distribution business models with pronounced effects on their observed economic performance. Unfortunately, data is not available to separate the economic contribution of the motion picture industry from that of the sound recording industry. Sector specific studies and analysis can help more fully explore these factors.
Source of Data: Statistics Canada. Table 36-10-0434-01 Gross domestic product (GDP) at basic prices, by industry, monthly (x 1,000,000).
Figure 8 – Annual GDP of motion picture and sound recording industries (2009-2019) – text version
| 2009 | 2010 | 2011 | 2012 | 2013 | 2014 | 2015 | 2016 | 2017 | 2018 | 2019 | |
|---|---|---|---|---|---|---|---|---|---|---|---|
| Motion picture and sound recording industries [512] | 3,671 | 3,375 | 3,433 | 3,339 | 3,681 | 4,708 | 3,830 | 4,464 | 4,955 | 5,219 | 5,509 |
As illustrated in Figure 8, the motion picture and sound recording industries contributed $3.3 billion to the Canadian economy in 2012, which represents its lowest level in the decade under review, and a 9% drop from its contribution of $3.7 billion in 2009. In 2013, the subsector began to recover, growing over the next years despite a decrease in 2015, peaking in 2019. In 2019, these industries contributed $5.5 billion to the Canadian economy, which is 65% higher than its contribution in 2012, and reflects a CAGR of 7.4%.
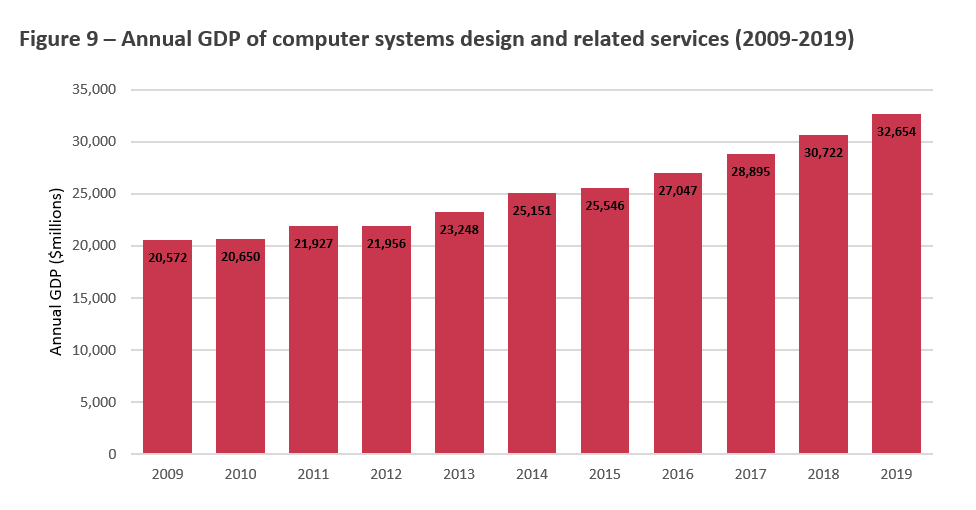
Computer systems design and related services
As an industry group, Computer Systems Design and Related Services consists of establishments involved in a variety of activities, including custom video game design and development services; writing, modifying, testing and supporting software, including internet webpage development; and planning and designing computer systems that integrate hardware, software and communication technologies.
As previously illustrated in Figure 4, the economic contribution of the core copyright-based industries was approximately $69.3 billion in 2019; that is $18.8 billion more than in its 2009 level of $50.5 billion. Roughly a quarter of the growth in the annual GDP of the core copyright-based industries is attributable to the Computer Systems Design and Related Services industry group, over the past decade.
Source of Data: Statistics Canada. Table 36-10-0434-01 Gross domestic product (GDP) at basic prices, by industry, monthly (x 1,000,000).
Figure 9 – Annual GDP of computer systems design and related services (2009-2019) – text version
| 2009 | 2010 | 2011 | 2012 | 2013 | 2014 | 2015 | 2016 | 2017 | 2018 | 2019 | |
|---|---|---|---|---|---|---|---|---|---|---|---|
| Computer systems design and related services [5415] | 20,572 | 20,650 | 21,927 | 21,956 | 23,248 | 25,151 | 25,546 | 27,047 | 28,895 | 30,722 | 32,654 |
Figure 9 shows that this segment of the Canadian economy has increased each year in terms of GDP contribution over the past decade. During that time, the GDP contribution of Computer Systems Design and Related Services increased from $20.6 billion in 2009 to $32.7 billion in 2019. This accounts for growth of $12.1 billion or 58.7%. Initially this industry group grew relatively modestly, averaging growth of approximately 2.2% per year from 2009 to 2012. However, the economic contribution of this industry group has grown much faster during the last six years (2013 to 2019), averaging an annual growth rate of approximately 5.8% per year in that period.
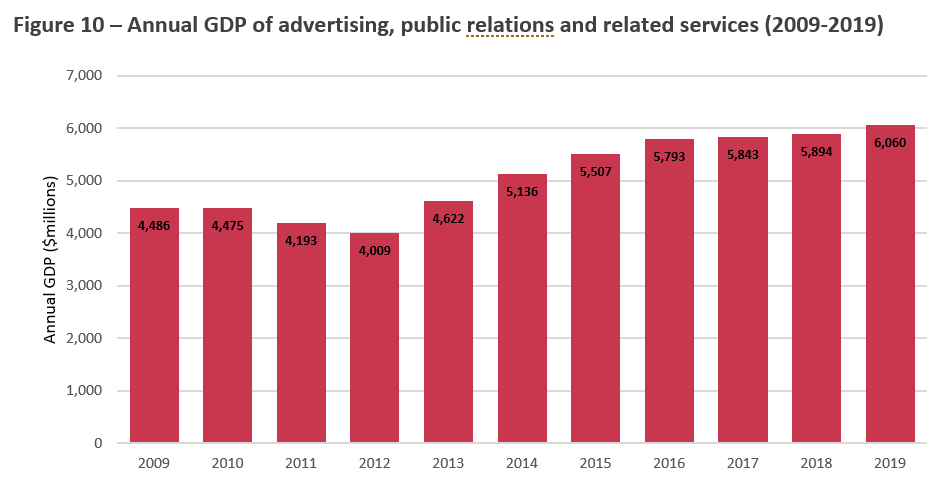
Advertising, public relations, and related services
The Advertising, Public Relations, and Related Services industry group generally captures the creation and dissemination of mass-media advertising and public relations campaigns. As previously illustrated in Figure 4, it is a relatively important subsector, consistently accounting for nearly 9% of the core copyright-based industries throughout the ten-year period from 2009 to 2019. Out of the seven subsectors that constitute the copyright-based industries, this industry group is the fourth largest in terms of economic contribution to the copyright-based industries.
Source of Data: Statistics Canada. Table 36-10-0434-01 Gross domestic product (GDP) at basic prices, by industry, monthly (x 1,000,000).
Figure 10 – Annual GDP of advertising, public relations and related services (2009-2019) – text version
| 2009 | 2010 | 2011 | 2012 | 2013 | 2014 | 2015 | 2016 | 2017 | 2018 | 2019 | |
|---|---|---|---|---|---|---|---|---|---|---|---|
| Advertising, public relations, and related services [5418] | 4,486 | 4,475 | 4,193 | 4,009 | 4,622 | 5,136 | 5,507 | 5,793 | 5,843 | 5,894 | 6,060 |
According to Statistics Canada, the economic contribution of the Advertising, Public Relations, and Related Services increased steadily during the early 2000s. Economic downturns particularly affect this industry group as advertising budgets tend to be cut when times get difficult, and its recovery tends to lag the overall economy. As shown in Figure 10, this is evident in the data, as the economic contribution of Advertising, Public Relations, and Related Services declined for several years after the 2008 financial crisis, reaching a low of $4 billion in 2012 (down 10.6% from $4.5 billion in 2009). While many industries recovered much sooner, it was 2013 before advertising recovered. This recovery led into exceptional growth as its economic contribution reached $5.5 billion in 2015 (up 37.4% from 2012). Since 2015, the economic contribution of this industry group has remained relatively stable, growing at a compound annual rate of 2.4%, reaching almost $6.1 billion in 2019.
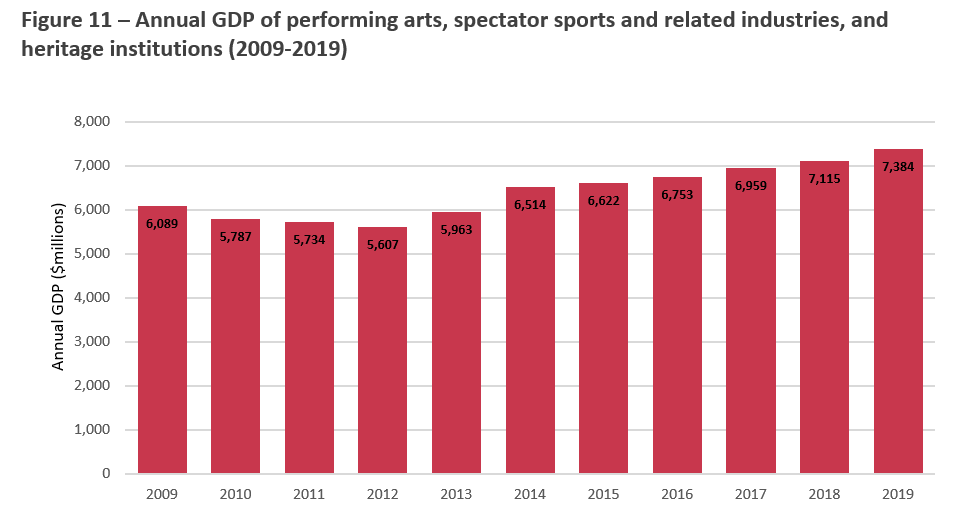
Performing arts, spectator sports, and heritage institutions
It should be noted that available data limits the possibility for detailed analysis beyond simply measuring the economic contribution of the Arts, Entertainment, and Recreation sector. Statistics Canada only publishes data at the subsector level, and only for the combined output of the Performing Arts, Spectator Sports and Related Industries and Heritage Institutions subsectors.
As such, it is not possible to separate the impact of Spectator Sports from the other four industry groups within the Performing Arts, Spectator Sports and Related Industries subsector (Performing arts companies, Promoters/Presenters of performing arts, sports and similar events; Agents and managers for artists, athletes, entertainers, and other public figures; and Independent artists, writers, and performers).
Source of Data: Statistics Canada. Table 36-10-0434-01 Gross domestic product (GDP) at basic prices, by industry, monthly (x 1,000,000).
Figure 11 – Annual GDP of performing arts, spectator sports and related industries, and heritage institutions (2009-2019) – text version
| 2009 | 2010 | 2011 | 2012 | 2013 | 2014 | 2015 | 2016 | 2017 | 2018 | 2019 | |
|---|---|---|---|---|---|---|---|---|---|---|---|
| Performing arts, spectator sports and related industries, and heritage institutions [71A] | 6,089 | 5,787 | 5,734 | 5,607 | 5,963 | 6,514 | 6,622 | 6,753 | 6,959 | 7,115 | 7,384 |
Despite this data limitation, a clear pattern emerges of a gradual dip and subsequent recovery. As shown in Figure 11, over the first three years studied, the Performing Arts, Spectator Sports and Related Industries, and Heritage Institutions subsector contracted slightly but steadily, decreasing to $5.6 billion in 2012. This was a decrease of 7.9% compared to 2009; however, after its 2012 low, the subsector grew steadily by nearly a third, reaching $7.4 billion in 2019. At the end of the decade in 2019, this subsector had grown by 21.3% overall compared since 2009 at a compound annual rate of almost 2%.
Section 2: Contribution to employment in Canada
Contribution to Canadian employment
Another meaningful way to measure the contributions that certain industries or subsectors make to the national economy is by considering the jobs they create. This section focuses on employment opportunities created by the core copyright-based industries between 2009 and 2019. For a more detailed breakdown of the contribution of the non-core copyright-based industries to Canada’s employment in 2019, refer to Table 1.
For the purposes of calculating the contribution of the copyright-based industries to employment in Canada, this study focuses on the results of Statistics Canada’s Survey of Employment, Payrolls and Hours (SEPH), which provides annual estimates for the number of occupied positions, and categorizes employment based on the NAICS codes. The methodology for measuring the contribution of the copyright-based industries to employment is the same as the previous section, and the same NAICS categories are used in its reporting. It is important to again note that the employment numbers used below reflect the inclusion of a new category in the methodology (Other Information Services [519]) and are therefore not entirely comparable to previous iterations of this study.
It is important to note that SEPH measures employment in terms of occupied positions. This means that employment data and the discussion in this section reflects employment counts only. The data on occupied positions do not necessarily equate to the number of people employed, since some individuals may hold multiple jobs. As well, the employment counts do not necessarily provide context on the nature of those positions (e.g. full time, part time, permanent, contract, etc.) or the quality of those jobs (e.g. pay rate, work environment, etc.).
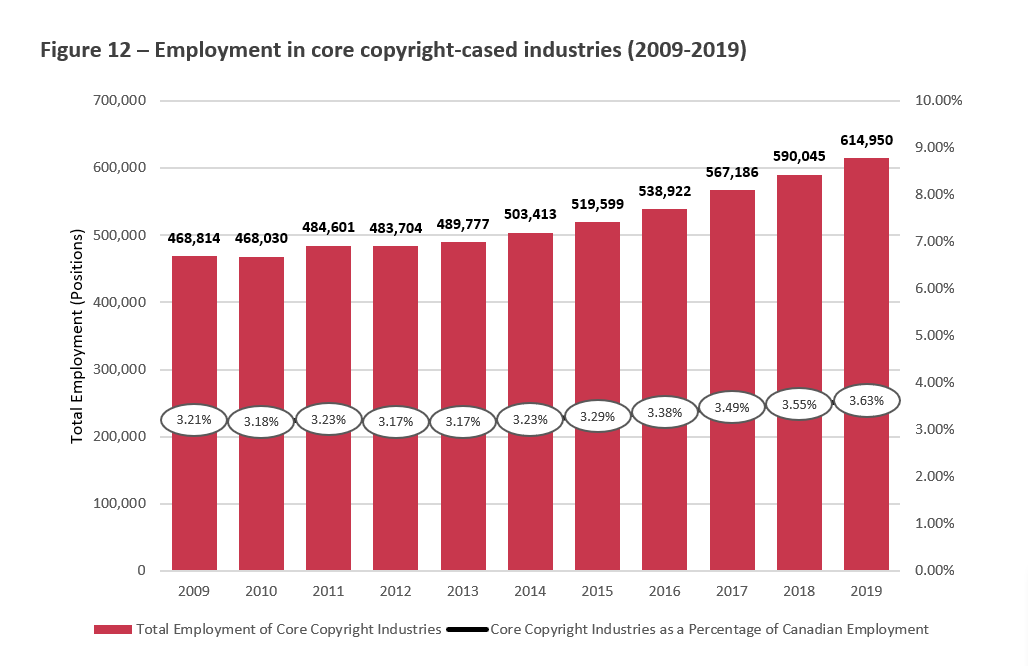
Source of Data: Statistics Canada. Table 14-10-0202-01 Employment by industry, annual.
Figure 12 – Employment in core copyright-based industries (2009-2019) – text version
| 2009 | 2010 | 2011 | 2012 | 2013 | 2014 | 2015 | 2016 | 2017 | 2018 | 2019 | |
|---|---|---|---|---|---|---|---|---|---|---|---|
| Core copyright industries | 468,814 | 468,030 | 484,601 | 483,704 | 489,777 | 503,413 | 519,599 | 538,922 | 567,186 | 590,045 | 614,950 |
| Core copyright ind. as a % of total | 3.21% | 3.18% | 3.23% | 3.17% | 3.17% | 3.23% | 3.29% | 3.38% | 3.49% | 3.55% | 3.63% |
Figure 12 illustrates annual employment in the core copyright-based industries, both in aggregate and as a proportion of overall Canadian employment. Statistics Canada estimates that the industrial aggregate of Canadian employment was nearly 17 million in 2019 (16,962,603).Footnote 11 Of this total workforce, the core copyright-based industries employed people in 614,950 positions in 2019; this represents 146,136 more than in 2009. In relative terms, employment in the core copyright-based industries has grown more rapidly than Canadian employment across the total economy. With a CAGR of approximately 2.8% per year from 2009 to 2019, the core copyright-based industries employment growth outpaced total Canadian employment, which grew at a CAGR of 1.5% per year during the same period. Because of this faster growth, the core copyright-based industries’ share of overall Canadian employment has also gradually increased, from 3.2% in 2009 to 3.6% in 2019. This data considers only the core copyright-based industries. Estimating the contribution of the core and non-core copyright-based industries to Canadian employment, based on the Australian case as previously discussed, finds that total core and non-core copyright-based industries employment accounts for 5.5% of total Canadian employment in 2019.Footnote 12
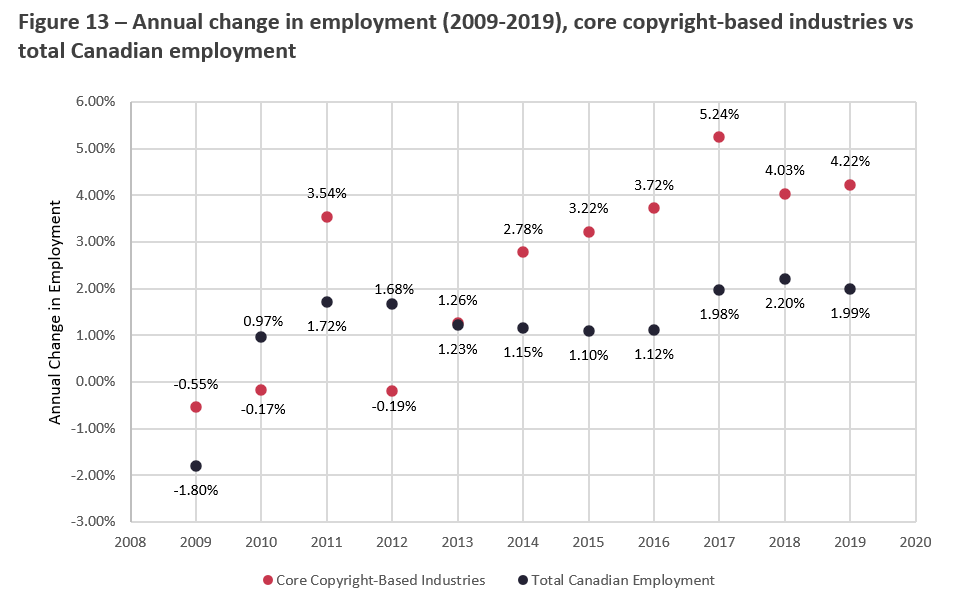
Source of Data: Statistics Canada. Table 14-10-0202-01 Employment by industry, annual.
Figure 13 – Annual change in employment (2009-2019), core copyright-based industries vs total Canadian employment– text version
| 2009 | 2010 | 2011 | 2012 | 2013 | 2014 | 2015 | 2016 | 2017 | 2018 | 2019 | |
|---|---|---|---|---|---|---|---|---|---|---|---|
| Core copyright-based industries | -0.55% | -0.17% | 3.54% | -0.19% | 1.26% | 2.78% | 3.22% | 3.72% | 5.24% | 4.03% | 4.22% |
| Total Canadian employment | -1.80% | 0.97% | 1.72% | 1.68% | 1.23% | 1.15% | 1.10% | 1.12% | 1.98% | 2.20% | 1.99% |
As shown in Figure 13, comparing the year-to-year growth rates finds that employment growth in the core copyright-based industries tended to outperform the growth in total Canadian employment from 2009 to 2019. This trend is not driven by just one or two strong years. While total employment grew at a relatively stable rate of approximately one to two percent after 2010, employment in the core copyright-based industries typically grew at a higher rate, especially from 2014 onward. Job growth in the core copyright-based industries was also more variable, ranging from a low of -0.6% to a high of 5.2%.
Focusing on the data for 2009 suggests some resiliency in employment in the core copyright-based industries. In the wake of the 2008 financial crisis, the Canadian economy experienced a downturn that affected many industries. Total Canadian employment in 2009 was 1.8% lower than in 2008, reflecting a decrease of 268,018 jobs. However, in that same year, employment in the core copyright-based industries decreased by proportionately less. It was down just 0.6%, reflecting a decrease of 2,575 jobs. The relative stability at a time where the rest of the economy was experiencing mounting job losses suggests some resiliency in core copyright-based industries’ occupations.
There were two years where the growth of total employment exceeded the growth of core copyright-based industries’ employment. The first instance of this occurred in 2010, when employment levels had increased from the previous year in both the subsector and overall economy; however, total employment increased at a relatively higher rate. This may be the result of a more pronounced downturn (and subsequent recovery) in total employment, compared to more modest job losses and gains in the copyright-based industries at this time.
The second instance of this occurred in 2012, when employment in the core copyright-based industries decreased slightly from the previous year (down 0.2%), while the overall Canadian workforce increased by almost 1.7%. While employment did increase for a number of core copyright subsectors in 2012, this was outweighed by decreased employment in several key copyright-based industries, including: Broadcasting [515] (down 1.5%), Computer Systems Design and Related Services [5415] (down 0.7%), Advertising, Public Relations, and Related Services [5418] (down 0.4%), Performing Arts, Spectator Sports and Related Industries [711] (down 4.2%), and Heritage Institutions [712, 7121] (down 2.6%).
NAICS sector ranking
As previously stated, the North American Industry Classification System (NAICS) groups economic activity into 20 sectors. Before exploring the employment contribution and trends within the copyright-based industries, the following figure puts the contribution of this sector in context.
Source of Data: Statistics Canada. Table 14-10-0202-01 Employment by industry, annual.
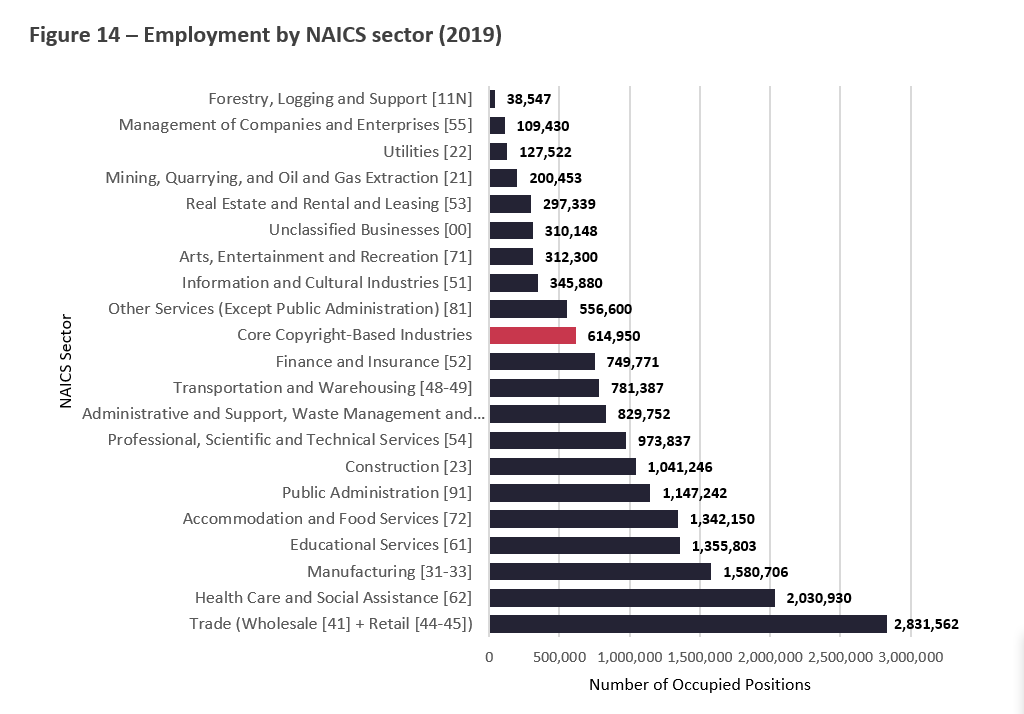
Figure 14 – Employment by NAICS sector (2019) – text version
| 2019 | |
|---|---|
| Trade (wholesale + retail) | 2,831,562 |
| Health care and social assistance | 2,030,930 |
| Manufacturing | 1,580,706 |
| Educational services | 1,355,803 |
| Accommodation and food services | 1,342,150 |
| Public administration | 1,147,242 |
| Construction | 1,041,246 |
| Professional, scientific and technical services | 973,837 |
| Administrative and support, waste management and remediation services | 829,752 |
| Transportation and warehousing | 781,387 |
| Finance and insurance | 749,771 |
| Core copyright-based industries | 614,950 |
| Other services (except public administration) | 556,600 |
| Information and cultural industries | 345,880 |
| Arts, entertainment and recreation | 312,300 |
| Unclassified businesses | 310,148 |
| Real estate and rental and leasing | 297,339 |
| Mining, quarrying, and oil and gas extraction | 200,453 |
| Utilities | 127,522 |
| Management of companies and enterprises | 109,430 |
| Forestry, logging and support | 38,547 |
Figure 14 illustrates how the core copyright-based industries compare to the other 20 primary sectors included in the NAICS, ranking them in terms of employment in each sector. As was the case for the GDP rankings, the estimated employment for the core copyright-based industries is comprised of components from three different sectors, including: [51] Information and Cultural Industries, [54] Professional, Scientific and Technical Services, and [71] Arts, Entertainment and Recreation. These three sectors are also individually included in Figure 14 for comparison purposes.
According to Statistics Canada estimates, the core copyright-based industries employed people in 614,950 positions in 2019, which compares favourably to several sectors that are important to the Canadian economy. The core copyright-based industries rank immediately after Finance and Insurance [52], near the halfway point of all industries in terms of the employment they generate for the Canadian economy.Footnote 13
Breakdown of core copyright-based industries
The core copyright-based industries are the focus of this study. However, as previously described, they only include industries that are exclusively copyright-based, and exclude interdependent, partial, and non-dedicated copyright-based industries. The core copyright-based industries are reflected in seven NAICS code groupings. The contribution to employment of these seven subsectors is explored below in more depth in Figures 15 through 22.
Source of Data: Statistics Canada. Table 14-10-0202-01 Employment by industry, annual.
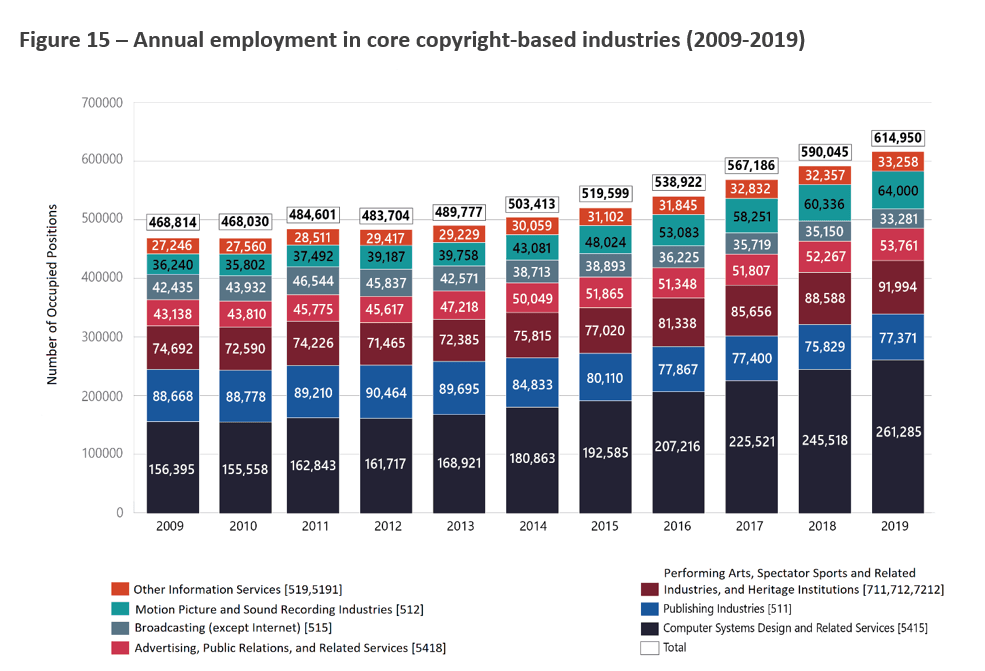
Figure 15 – Annual employment in core copyright-based industries (2009-2019) – text version
| 2009 | 2010 | 2011 | 2012 | 2013 | 2014 | 2015 | 2016 | 2017 | 2018 | 2019 | |
|---|---|---|---|---|---|---|---|---|---|---|---|
| Core copyright-based industries | 468,814 | 468,030 | 484,601 | 483,704 | 489,777 | 503,413 | 519,599 | 538,922 | 567,186 | 590,045 | 614,950 |
| Computer systems design and related services [5415] | 156,395 | 155,558 | 162,843 | 161,717 | 168,921 | 180,863 | 192,585 | 207,216 | 225,521 | 245,518 | 261,285 |
| Publishing industries [511] | 88,668 | 88,778 | 89,210 | 90,464 | 89,695 | 84,833 | 80,110 | 77,867 | 77,400 | 75,829 | 77,371 |
| Performing arts, spectator sports and related industries, and heritage institutions [711, 712, 7121] | 74,692 | 72,590 | 74,226 | 71,465 | 72,385 | 75,815 | 77,020 | 81,338 | 85,656 | 88,588 | 91,994 |
| Advertising, public relations, and related services [5418] | 43,138 | 43,810 | 45,775 | 45,617 | 47,218 | 50,049 | 51,865 | 51,348 | 51,807 | 52,267 | 53,761 |
| Broadcasting (except Internet) [515] | 42,435 | 43,932 | 46,544 | 45,837 | 42,571 | 38,713 | 38,893 | 36,225 | 35,719 | 35,150 | 33,281 |
| Motion picture and sound recording industries [512] | 36,240 | 35,802 | 37,492 | 39,187 | 39,758 | 43,081 | 48,024 | 53,083 | 58,251 | 60,336 | 64,000 |
| Other information services [519, 5191] | 27,246 | 27,560 | 28,511 | 29,417 | 29,229 | 30,059 | 31,102 | 31,845 | 32,832 | 32,357 | 33,258 |
Figure 15 provides the annual contribution of the core copyright-based industries to Canadian employment, from 2009 to 2019, broken down by the different subsector and industry group components. Of these components, as was the case for GDP, the largest share of employment was contributed by Computer Systems Design and Related Services subsector. During this ten-year period, employment in this subsector grew significantly, up by 67.1% from 2009 to 2019, with particularly rapid growth observed after 2012. By 2019, there were 261,285 positions in this subsector, accounting for 42.5% of total employment in the core copyright-based industries. For comparison, in 2009, Computer Systems Design and Related Services accounted for 31.9% of employment in the core copyright industries. With 77,371 positions in 2019, the Publishing Industries (excluding internet) contributed the third-largest share of employment in the core copyright industries, after Performing Arts, Spectator Sports and Heritage Institutions.Footnote 14
Due to the size of the Computer Systems Design and Related Services industry group, the annual change in employment for this industry group tends to dictate the annual change in employment for the entirety of the core copyright-based industries. Removing this industry group reveals a very different story of modest employment growth; from 2009 to 2019, employment in the core copyright-based industries excluding Computer Systems Design and Related Services increased by a CAGR of 1.3% per year.
Industry-specific trends (2009 to 2019)
Publishing industries (excluding Internet)
The onset of the financial crisis had a significant and immediate impact on the publishing industries, leading to a decrease in GDP and in employment in 2009. From an economic perspective, the industry was able to recover in subsequent years and, more recently, has appeared to stabilize albeit at a lower level of employment. The compounding effect of the economic downturn and emerging technologies had a transformative effect on employment in the non-internet publishing industries.
Source of Data: Statistics Canada. Table 14-10-0202-01 Employment by industry, annual.
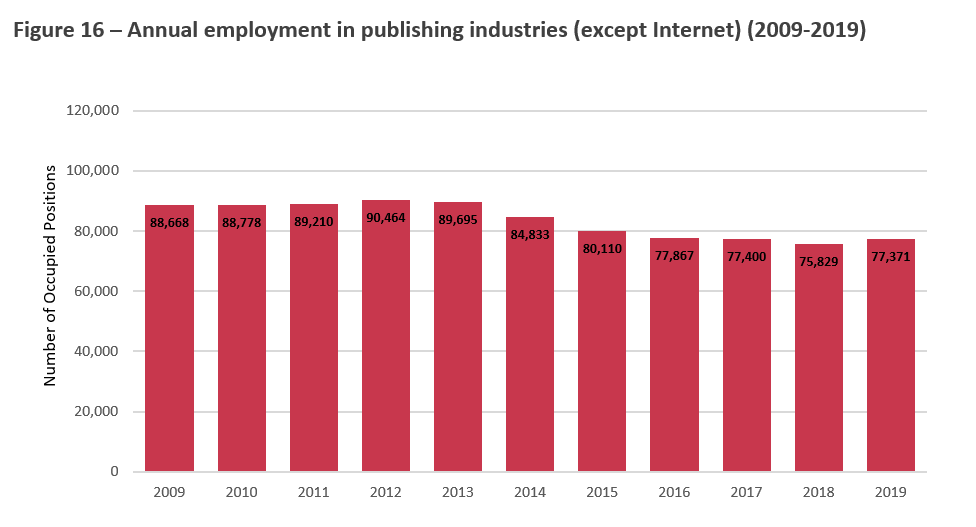
Figure 16 – Annual employment in publishing industries (except Internet) (2009-2019) – text version
| 2009 | 2010 | 2011 | 2012 | 2013 | 2014 | 2015 | 2016 | 2017 | 2018 | 2019 | |
|---|---|---|---|---|---|---|---|---|---|---|---|
| Publishing industries [511] | 88,668 | 88,778 | 89,210 | 90,464 | 89,695 | 84,833 | 80,110 | 77,867 | 77,400 | 75,829 | 77,371 |
Despite modest recovery in employment numbers from 2009 to 2012, Figure 16 shows that employment has been in gradual decline since 2013. Employment in traditional publishing has been decreasing by a CAGR of 1.4% between 2009 and 2019. In 2019, employment in the publishing industries was 12.7% lower than in 2009, and the industry now accounts for 12.6% of employment in the core copyright-based industries, as compared to 18.9% of core copyright-based industry employment in 2009. While some employment is likely to have shifted from traditional to internet publishing activities, the data is not available to determine the significance of this shift; data limitations resulting from the NAICS classifications are discussed in the introduction of the report. As well, these data do not shed light on how digital disruption may be transforming the nature of work within this industry.
Broadcasting industry (excluding Internet)
Source of Data: Statistics Canada. Table 14-10-0202-01 Employment by industry, annual.
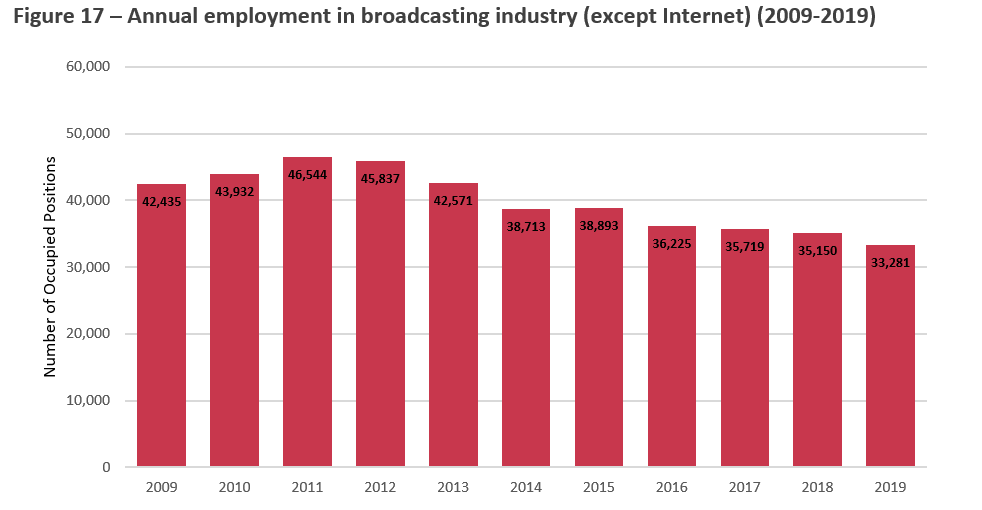
Figure 17 – Annual employment in broadcasting industry (except Internet) (2009-2019) – text version
| 2009 | 2010 | 2011 | 2012 | 2013 | 2014 | 2015 | 2016 | 2017 | 2018 | 2019 | |
|---|---|---|---|---|---|---|---|---|---|---|---|
| Broadcasting [515] | 42,435 | 43,932 | 46,544 | 45,837 | 42,571 | 38,713 | 38,893 | 36,225 | 35,719 | 35,150 | 33,281 |
As shown in Figure 17, over the past 10 years, the non-internet broadcasting industry has seen a steady decline in employment, with the exception of a slight bump around 2011. From 2009 to 2011, employment in the broadcasting industry increased with a CAGR of 4.7% per year. At its peak in 2011, the broadcasting industry accounted for 9.6% of employment in the core copyright-based industries. However, since peaking in 2011, employment in the broadcasting industry has declined steadily. This trend is in step with observed patterns in the annual GDP of the industry, discussed in the previous section of this report. Since 2011, employment in this subsector decreased by approximately 4.1% per year, reaching a ten-year low of approximately 33,000 positions in 2019.
Since 2009, employment in broadcasting has fallen by 21.6%, and accounts for 5.4% less of the share of employment within the core copyright-based industries. As outlined in the previous section, this industry was significantly affected by the transition to multinational internet-based services.
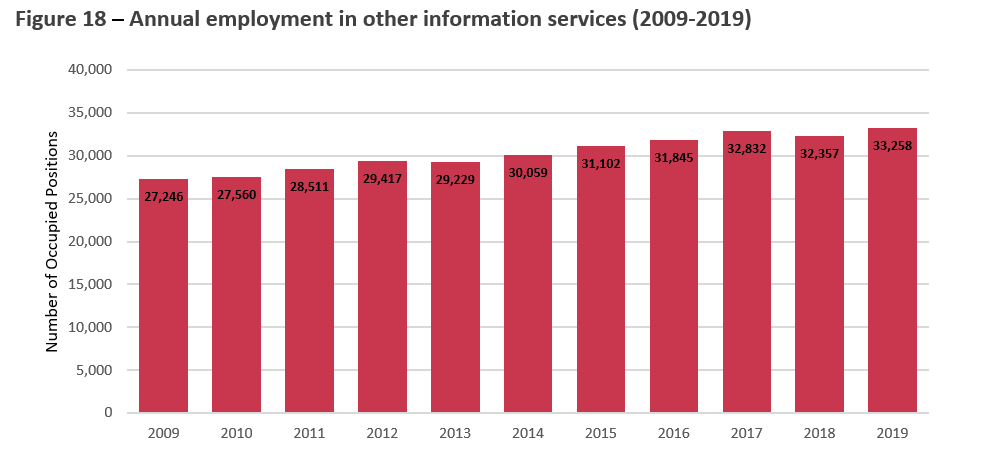
Other information services
Source of Data: Statistics Canada. Table 14-10-0202-01 Employment by industry, annual.
Figure 18 – Annual employment in other information services (2009-2019) – text version
| 2009 | 2010 | 2011 | 2012 | 2013 | 2014 | 2015 | 2016 | 2017 | 2018 | 2019 | |
|---|---|---|---|---|---|---|---|---|---|---|---|
| Other information services [519, 5191] | 27,246 | 27,560 | 28,511 | 29,417 | 29,229 | 30,059 | 31,102 | 31,845 | 32,832 | 32,357 | 33,258 |
Figure 18 illustrates the growth in employment in the Other Information Services subsector from 2009 to 2019. As was the case for many other industries, there was an immediate decrease in occupied positions in response to the financial crisis and economic downturn. While the growth in employment was not as rapid as the growth in the subsector’s annual contribution to GDP, the industry did grow steadily. From 2009 to 2019, employment increased by approximately 2% per year, reaching a high of 33,258 occupied positions in 2019 (22.1% higher than in 2009).
As some of the production in the publishing and broadcasting sectors may have shifted towards online content delivery, it is possible that some of the employment has shifted from the NAICS codes for those two sectors to Other Information Services. However, the increase in employment for this subsector (up 6,012 occupied positions from 2009 to 2019), does not offset the combined decrease in employment in publishing and broadcasting (down 20,451 occupied positions from 2009 to 2019).
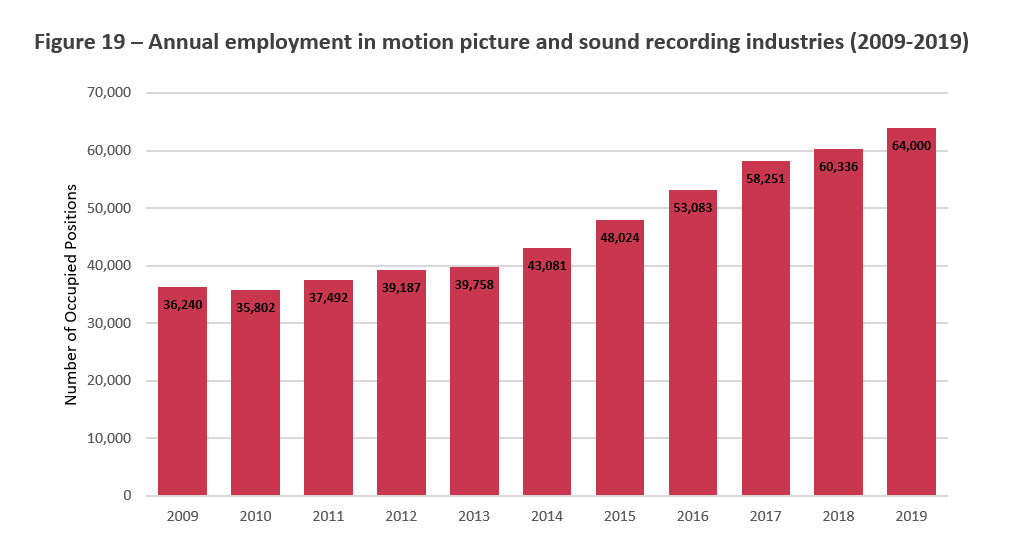
Motion picture and sound recording industries
As was the case in the previous section on economic output in terms of GDP, the data is not available to separate the economic contribution towards employment of the motion picture industry from that of the sound recording industry. However, both industries experienced disruptions in their financing and distribution models with pronounced effects on their observed economic performance.
Source of Data: Statistics Canada. Table 14-10-0202-01 Employment by industry, annual.
Figure 19 – Annual employment in motion picture and sound recording industries (2009-2019) – text version
| 2009 | 2010 | 2011 | 2012 | 2013 | 2014 | 2015 | 2016 | 2017 | 2018 | 2019 | |
|---|---|---|---|---|---|---|---|---|---|---|---|
| Motion picture and sound recording industries [512] | 36,240 | 35,802 | 37,492 | 39,187 | 39,758 | 43,081 | 48,024 | 53,083 | 58,251 | 60,336 | 64,000 |
Figure 19 illustrates the year-to-year level of employment in the Motion Picture and Sound Recording Industries. After a slight decrease from 2009 to 2010, employment in this category increased steadily. As the motion picture and sound recording industries rely on labour input to produce content, both economic output (GDP) and employment have a strong positive correlation. Thus, as GDP grew rapidly, employment increased as well, at an accelerating pace of 5.9% between 2009 and 2019. In 2019, the motion picture and sound recording industries reached a high of 64,000 occupied positions, which is 76% higher than in 2009. The underlying trends that contribute to this substantial employment growth merit further exploration.
Computer systems design and related services
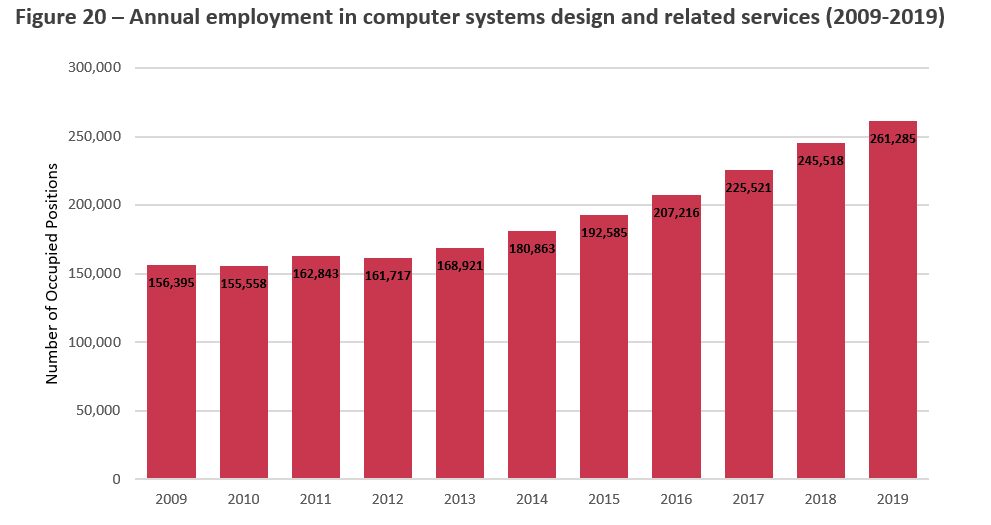
Source of Data: Statistics Canada. Table 14-10-0202-01 Employment by industry, annual.
Figure 20 – Annual employment in computer systems design and related services (2009-2019) – text version
| 2009 | 2010 | 2011 | 2012 | 2013 | 2014 | 2015 | 2016 | 2017 | 2018 | 2019 | |
|---|---|---|---|---|---|---|---|---|---|---|---|
| Computer systems design and related services [5415] | 156,395 | 155,558 | 162,843 | 161,717 | 168,921 | 180,863 | 192,585 | 207,216 | 225,521 | 245,518 | 261,285 |
Of the core copyright-based industries, the Computer Systems Design and Related Services industry group was the largest contributor to the Canadian economy throughout the observed ten-year period, both in terms of production output (40.7% of core copyright-based industries GDP in 2009 and 47.1% in 2019) and employment (33.4% of core copyright-based industries employment in 2009 and 42.5% in 2019).
As shown in Figure 20, in the immediate aftermath of the economic downturn, employment decreased slightly by 1.3%, from 157,618 in 2008 to 155,558 in 2010. However, despite slight fluctuations early on, employment in this industry group began increasing in 2013 by a CAGR of 7.5% per year, which is almost the same rate as its economic contribution to GDP. In 2019, employment reached a new high of 261,285 occupied positions, representing an increase of 67.1%, or 104,890 positions, since 2009. This is a substantial increase and driver of employment growth in the core copyright-based industries.
Advertising, public relations, and related services

Source of Data: Statistics Canada. Table 14-10-0202-01 Employment by industry, annual.
Figure 21 – Annual employment in advertising, public relations and related services (2009-2019) – text version
| 2009 | 2010 | 2011 | 2012 | 2013 | 2014 | 2015 | 2016 | 2017 | 2018 | 2019 | |
|---|---|---|---|---|---|---|---|---|---|---|---|
| Advertising, public relations, and related services [5418] | 43,138 | 43,810 | 45,775 | 45,617 | 47,218 | 50,049 | 51,865 | 51,348 | 51,807 | 52,267 | 53,761 |
For the Advertising, Public Relations, and Related Services industry group, the financial crisis had a significant and immediate impact on employment, which decreased by 5% in 2009 during the economic downturn. Compared to the decrease in the economic output of the industry group, which saw GDP steadily decline through 2012, employment decreased more immediately, but to a lesser degree. Employment also began to recover almost immediately, growing by a CAGR of 3.1% per year from 2009 to 2015, as shown in Figure 21. In 2015, employment accounted for 51,865 positions in this industry group, which reflects growth of 20.2%, or 8,727 occupied positions, compared to 2009. Over the past five years, employment has remained relatively stable, with 53,761 occupied positions in 2019, accounting for 8.7% of employment in the core copyright-based industries.
Performing arts and related industries, and heritage institutions
Arts, Entertainment, and Recreation [71] is one of the few sectors where the employment data is disaggregated to the industry group level for multiple industry groups. This allows for the removal of employment in both Spectator Sports [7112] and Amusement, Gambling, and Recreation Industries [713] to focus on employment in performing arts and heritage institutions. It is important to note that the employment numbers used below reflect the data pertaining to Performing Arts and Related Industries, and Heritage Institutions, and therefore is not entirely comparable to the GDP numbers in the previous section, which pertains to Performing Arts, Spectator Sports, and Heritage Institutions. In particular, the figure below illustrates the level of employment for performing arts companies, promoters (or presenters), agents and managers, independent artists, writers and performers, and heritage institutions.
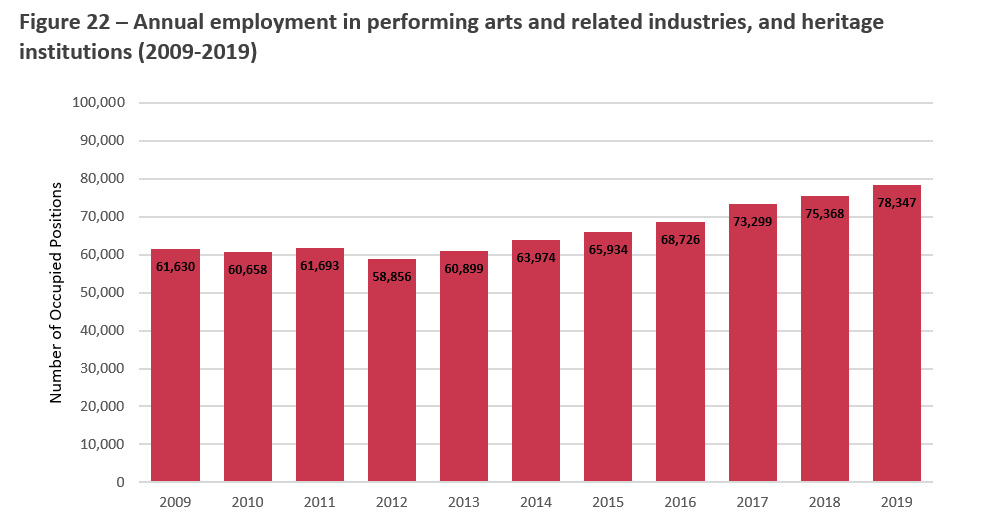
Source of Data: Statistics Canada. Table 14-10-0202-01 Employment by industry, annual.
Figure 22 – Annual employment in performing arts and related industries, and heritage institutions (2009-2019) – text version
| 2009 | 2010 | 2011 | 2012 | 2013 | 2014 | 2015 | 2016 | 2017 | 2018 | 2019 | |
|---|---|---|---|---|---|---|---|---|---|---|---|
| Performing arts and related industries, and heritage institutions [7111, 7113, 7114, 7115, 712, 7121] | 61,630 | 60,658 | 61,693 | 58,856 | 60,899 | 63,974 | 65,934 | 68,726 | 73,299 | 75,368 | 78,347 |
As shown in Figure 22, from 2009 to 2013, employment fluctuated up and down, but ultimately remained relatively stable at around 60,000 positions. In 2013, the subsector employed people in 60,899 positions, which is only 1.2% lower than in 2009. Since then, employment increased steadily, growing by 28.7% since 2013. With a CAGR of 4.3% per year, employment reached a new high of 78,347 occupied positions in 2019.
Section 3: Contribution to international trade
Contribution to the Canadian balance of trade
To measure the economic contribution of the core copyright-based industries, previous sections of this study relied on the input-output accounts, which is one of the major components in Canada’s national economic accounts, a subset of the Canadian system of macroeconomic accounts.Footnote 15 Footnote 16 Of the other subset of the system of macroeconomic accounts, the balance of payments is particularly important for capturing the international dimension of Canada’s economy through the commercial and financial transactions that take place with the rest of the world.Footnote 17 In the balance of payments, economic transactions are categorized into two groups. First, the current account, which tracks goods and services, investment income, and current transfers. Second, the capital and financial accounts, which tracks capital and financial investment.
The goods account of the balance of international payments is based on merchandise trade statistics, which measure the cross border physical flow of merchandise, but differs slightly in that international trade in goods follows the principle of ownership change, rather than just the inflows and outflows of merchandise trade. Compared to gross domestic product (GDP) and employment, another major difference is that Statistics Canada captures the value of these international transactions by type of product, rather than by industry. As a result, they rely on a different classification system, the North American Product Classification System (NAPCS), for the collection, processing, and dissemination of product statistics. Products are goods and services that result from production processes. The universe of potential products is vast and diverse; a classification system is necessary to simplify and organize them into a manageable number of detailed categories that structure trade data.
Statistics Canada does not disaggregate the balance of payments data by individual commodity codes, and most consumer goods in the current account are grouped together as a single line item identified as Consumer Goods. Because of this, the analysis in this section is limited to data on international transactions in services, where data is available at a more granular level. While this limits potential for looking at trade in consumer goods related to the copyright-based industries (e.g. television sets, smartphones) it focuses on the value in trade in services for the copyright-based industries (e.g. audiovisual services, computer and information services). Specific details for the six trade product (services) categories used in this study are outlined below.
As of Statistics Canada’s latest release, annual receipt and payment data is available through 2019. Receipts refer to exports and interest income, while payments refer to imports and interest expenses, and the trade balance refers to the difference between exports and imports. As such, the figures in this section use data retrieved from Statistics Canada based on receipts (referred to as Exports), payments (referred to as Imports), and trade balance (referred to as Balances).
Exports and imports of services for copyright-related products
Estimates on the contribution of the non-core copyright industries to international trade have not been produced at this point. We plan to include more in-depth examination of the economic contributions of the copyright-related services in terms of international trade in future versions of this report.
This analysis looks at six categories of commercial services to estimate the impact of international transactions in services for products related to the core copyright-based industries. This includes Computer and Information Services, Copyrights and Related Royalties, Software and Other Royalties, Advertising and Related Services, Audio-Visual Services, and Other Personal, Cultural and Recreational Services.
Computer and information services
- Hardware- and software-related services and data-processing services such as licenses to use software, maintenance and repairs of computers, data recovery services, web page hosting services and hardware and software consultancy services. (Excludes charges for licenses to reproduce or distribute software, which is included in a different category.)
- News agency services, database services such as data storage, dissemination of data and databases, web search portals, non-bulk subscriptions to newspapers and periodicals, and downloaded content that is not software, audio or video. (Excludes bulk newspapers, downloaded software, and downloaded audio and video since they appear in other categories.)
Copyright and related rights
- Payments for licences to reproduce or distribute intellectual property embodied in produced originals or prototypes, such as copyrights on books and manuscripts, cinematographic works and sound recordings, and related rights such as for live performances and television, cable, and satellite broadcasts.
Software and other royalties
- Payments for the use of proprietary rights, which arise from research and development, as well as marketing. It also includes payments for licences to reproduce or distribute intellectual property embodied in produced originals or prototypes, such as computer software.
Advertising and related services
- Advertising, market research and public opinion polling services. This category is a subsection of Professional and Management Consulting Services.
Audio-visual services
- Services related to the production of motion pictures, radio and television programs and musical recordings, including film and videotape rentals, fees received by actors, directors and producers, and charges for access to encrypted television channels such as cable and satellite services. Charges or licences to reproduce or distribute radio, television, film and music programming are instead included in charges for the use of intellectual property.
Other personal, cultural and recreational services
- Types of services associated with museums, libraries and archives, other cultural, sporting and recreational activities, education services, health service, and gambling.
Canada has typically been a significant net importer of goods and services over the past 10 years as seen in the annual balance of payments, which has been negative since 2009 (goods and services combined). During this time, trade in services has continued to grow in importance and the trade deficit in services has increased by 31%, from $16.4 billion in 2009 to $21.5 billion in 2019.Footnote 18
While Canada carries a trade deficit for many types of services, trade in services for copyright-related products has consistently been in surplus since 2009 and, like other services, the magnitude of trade has grown significantly. Although there have been fluctuations in imports and exports from 2009 to 2019, the overall trend has been a significant increase in both exports and imports.
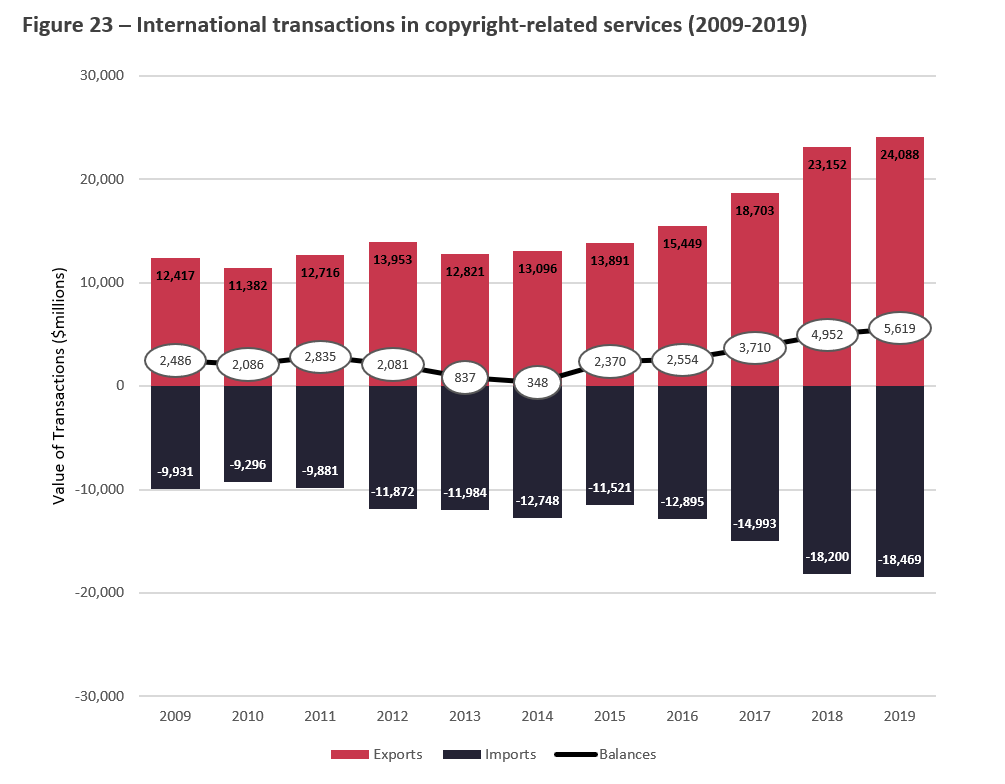
Source of Data: Statistics Canada. Table 36-10-0006-01 International transactions in services, commercial services by category, annual (x 1,000,000).
Figure 23 – International transactions in copyright-related services (2009-2019) – text version
| 2009 | 2010 | 2011 | 2012 | 2013 | 2014 | 2015 | 2016 | 2017 | 2018 | 2019 | |
|---|---|---|---|---|---|---|---|---|---|---|---|
| Exports (receipts) | 12,417 | 11,382 | 12,716 | 13,953 | 12,821 | 13,096 | 13,891 | 15,449 | 18,703 | 23,152 | 24,088 |
| Imports (payments) | -9,931 | -9,296 | -9,881 | -11,872 | -11,984 | -12,748 | -11,521 | -12,895 | -14,993 | -18,200 | -18,469 |
| Balances | 2,486 | 2,086 | 2,835 | 2,081 | 837 | 348 | 2,370 | 2,554 | 3,710 | 4,952 | 5,619 |
Figure 23 shows the total balance of international transactions in copyright-related services from 2009 to 2019. From 2009 to 2014, the trade surplus in services for products related to the copyright-based industries declined steadily, from $2.5 billion in 2009 to $348 million in 2014. This reflects a decrease of 86% over the period. For most of these years, this was because imports for services were increasing at a faster rate than exports. Through 2012, exports had grown to almost $14 billion (12.4% higher than in 2009), while imports had grown to $11.9 billion (19.5% higher than in 2009), resulting in a declining surplus. The largest decline, however, occurred between 2012 and 2013, when exports declined by 8.1% while imports increased by 0.9%. This trend has reversed since 2013, as exports increased by 87.9% from 2013 to 2019, reaching a new high of $24.1 billion. Imports continued to grow, but at a slower rate of 54.1%, also reaching a new high of $18.5 billion. The result was a trade surplus in services of $5.6 billion in 2019 (571.3% higher than in 2013).
Commercial services category-specific trends (2009 to 2019)
Computer and information services
Much like Computer Systems Design and Related Services contributed the largest share of the economic output of the core copyright-based industries domestically, Computer and Information Services accounted for the largest share of international transactions in services related to the copyright-based industries (50% of exports, 38% of imports in 2019).
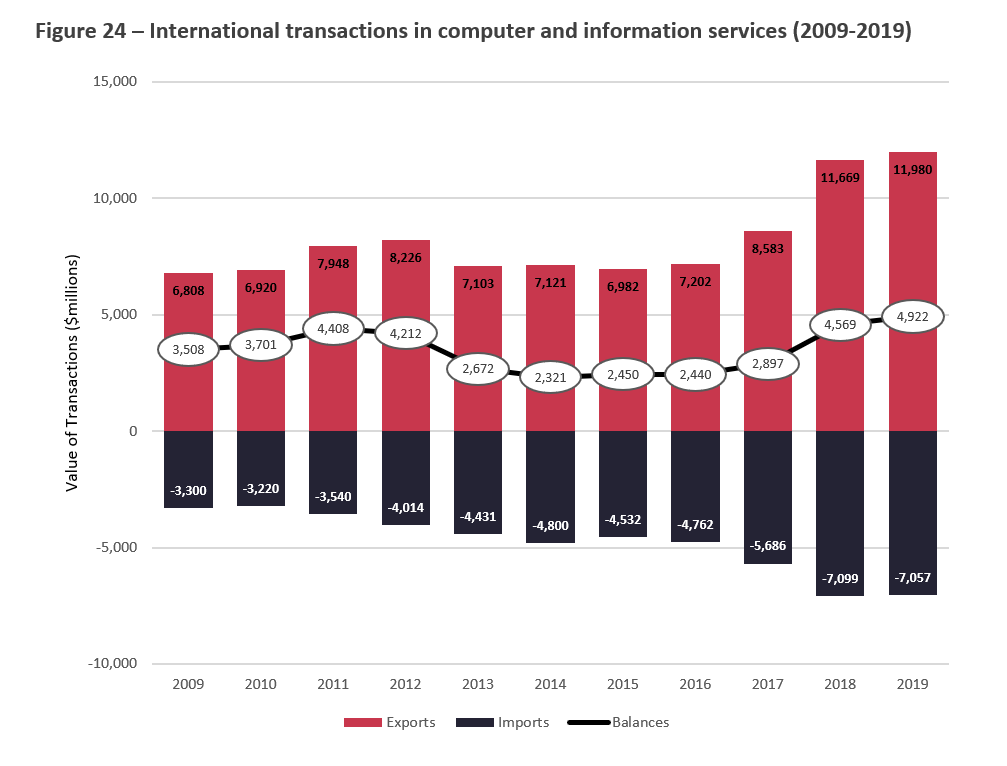
Source of Data: Statistics Canada. Table 36-10-0006-01 International transactions in services, commercial services by category, annual (x 1,000,000).
Figure 24 – International transactions in computer and information services (2009-2019) – text version
| 2009 | 2010 | 2011 | 2012 | 2013 | 2014 | 2015 | 2016 | 2017 | 2018 | 2019 | |
|---|---|---|---|---|---|---|---|---|---|---|---|
| Exports (receipts) | 6,808 | 6,920 | 7,948 | 8,226 | 7,103 | 7,121 | 6,982 | 7,202 | 8,583 | 11,669 | 11,980 |
| Imports (payments) | -3,300 | -3,220 | -3,540 | -4,014 | -4,431 | -4,800 | -4,532 | -4,762 | -5,686 | -7,099 | -7,057 |
| Balances | 3,508 | 3,701 | 4,408 | 4,212 | 2,672 | 2,321 | 2,450 | 2,440 | 2,897 | 4,569 | 4,922 |
Figure 24 illustrates exports (receipts), imports (payments) and the trade balance for Computer and Information Services from 2009 to 2019. Imports (in navy) for these services increased relatively quickly and consistently, from $3.3 billion in 2009 to $4.8 billion in 2014. In other words, it was 45.5% higher than five years prior. This was followed by two down years before increasing and surpassing 2014 levels, to $7 billion in 2019.
Exports (in pink) also increased rapidly. They grew by 20.8%, from $6.8 billion in 2009 to $8.2 billion in 2012. This was followed by a significant decline in 2013 ($1.1 billion decrease compared to the previous year), and a gradual increase since then. In 2019, exports totalled $12 billion, resulting in a trade surplus of $4.9 billion for the year.
Copyright and related rights
Of the commercial services categories included in this study, the category of Copyright and Related Rights accounted for the second smallest share of Canada’s international transactions in copyright-related services (almost 2% of exports, 8.2% of imports in 2019).
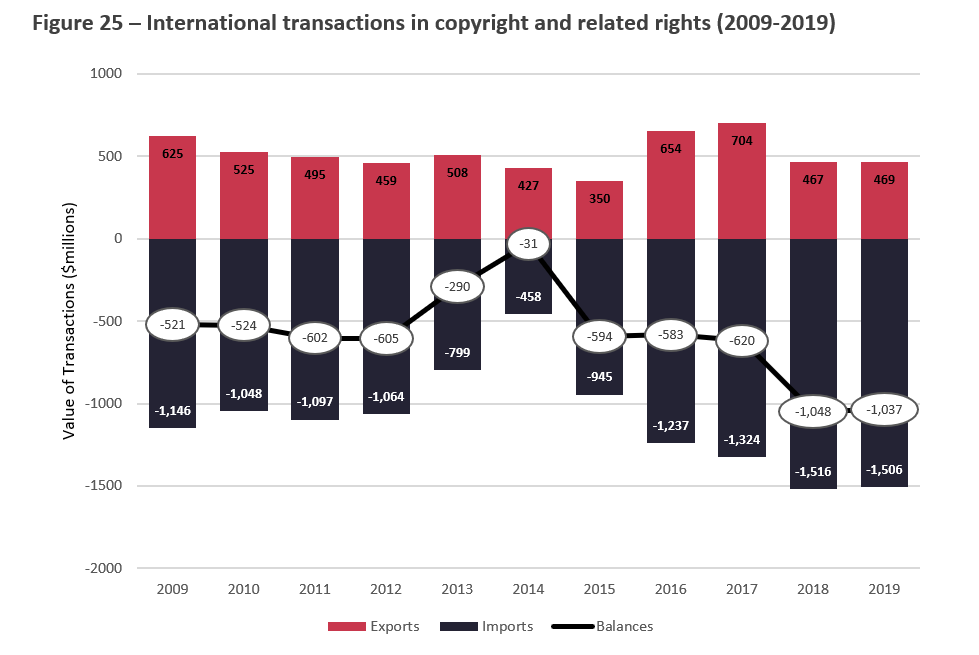
Source of Data: Statistics Canada. Table 36-10-0006-01 International transactions in services, commercial services by category, annual (x 1,000,000).
Figure 25 – International transactions in copyright and related rights (2009-2019) – text version
| 2009 | 2010 | 2011 | 2012 | 2013 | 2014 | 2015 | 2016 | 2017 | 2018 | 2019 | |
|---|---|---|---|---|---|---|---|---|---|---|---|
| Exports (Receipts) | 625 | 525 | 495 | 459 | 508 | 427 | 350 | 654 | 704 | 467 | 469 |
| Imports (Payments) | -1,146 | -1,048 | -1,097 | -1,064 | -799 | -458 | -945 | -1,237 | -1,324 | -1,516 | -1,506 |
| Balances | -521 | -524 | -602 | -605 | -290 | -31 | -594 | -583 | -620 | -1,048 | -1,037 |
As shown in Figure 25, from 2009 to 2019, Canada has had a trade deficit every year in international transactions in services for Copyright and Related Rights. Exports generally declined between 2009 and 2015. After increasing in the next two years and peaking at $704 million in 2017, exports again declined significantly, reaching $469 million in 2019. This was a large decline compared to 2017 and it was an overall decline of 25% compared to 2009.
Imports for Copyright and Related Rights fluctuated significantly between 2009 and 2019, but increased overall by 31.4% (from $1.1 billion in 2009 to $1.5 billion in 2019). Imports generally declined to $458 million in 2014, before increasing rapidly back up to $1.5 in 2018 and only decreasing by 0.7% in 2019. This resulted in a decline in trade deficit from 2009 ($512 million) to 2014 ($31 million), which increased back up in 2018 and 2019 (around $1 billion for both years).
Software and other royalties
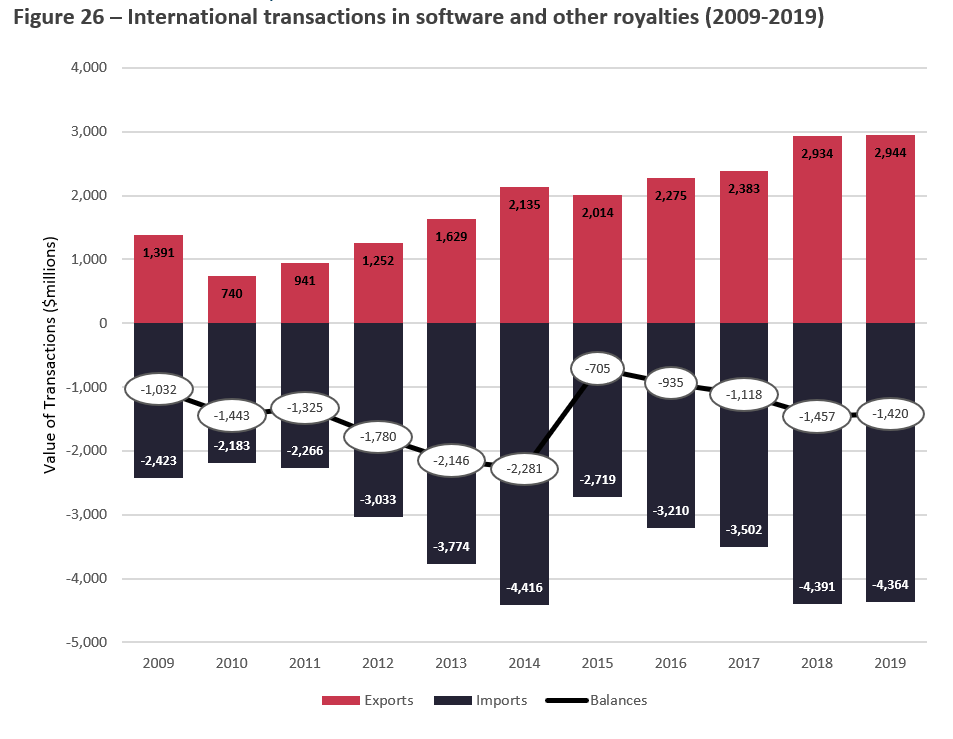
Source of Data: Statistics Canada. Table 36-10-0006-01 International transactions in services, commercial services by category, annual (x 1,000,000).
Figure 26 – International transactions in software and other royalties (2009-2019) – text version
| 2009 | 2010 | 2011 | 2012 | 2013 | 2014 | 2015 | 2016 | 2017 | 2018 | 2019 | |
|---|---|---|---|---|---|---|---|---|---|---|---|
| Exports (receipts) | 1,391 | 740 | 941 | 1,252 | 1,629 | 2,135 | 2,014 | 2,275 | 2,383 | 2,934 | 2,944 |
| Imports (payments) | -2,423 | -2,183 | -2,266 | -3,033 | -3,774 | -4,416 | -2,719 | -3,210 | -3,502 | -4,391 | -4,364 |
| Balances | -1,032 | -1,443 | -1,325 | -1,780 | -2,146 | -2,281 | -705 | -935 | -1,118 | -1,457 | -1,420 |
Software and Other Royalties is another commercial services category where Canada had a trade deficit every year from 2009 to 2019, as illustrated in Figure 26. Initially, exports declined significantly, from $1.4 billion in 2009 to $740 million in 2010, a decrease of 46.8%. Imports also declined during that time but not by as much, as they decreased by 9.9% ($240 million). As a result, the trade deficit increased from $1 billion in 2009 to $1.4 billion in 2010.
From 2010 to 2014, both exports and imports increased significantly, each more than doubling. In 2014, exports peaked at $2.1 billion ($1.40 billion or 188.5% higher than in 2010) and imports peaked at $4.4 billion ($2.23 billion or 102.3% higher than in 2010), resulting in a trade deficit of $2.3 billion. After reaching its highest level in 2014, imports declined by more than exports from 2014 to 2015, and the trade deficit decreased rapidly. From 2015 to 2019, both exports and imports increased steadily. In 2019, imports for Software and Other Royalties reached $4.4 billion and exports reached a high of $2.9, resulting in a trade deficit of $1.42 billion.
Advertising and related services
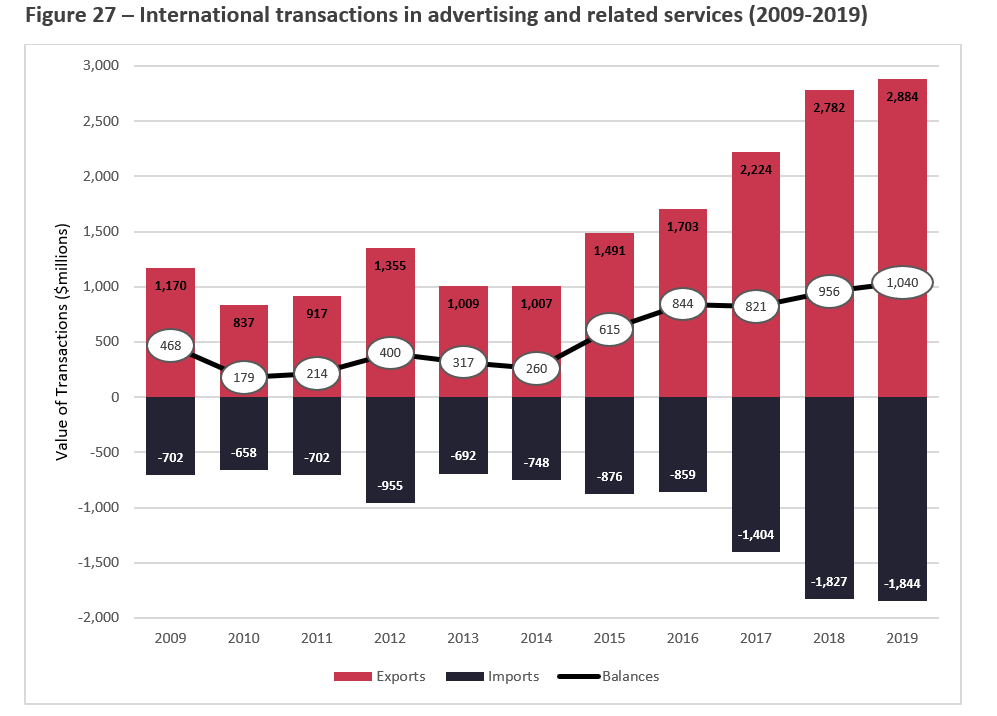
Source of Data: Statistics Canada. Table 36-10-0006-01 International transactions in services, commercial services by category, annual (x 1,000,000).
Figure 27 – Internationals transactions in advertising and related services (2009-2019) – text version
| 2009 | 2010 | 2011 | 2012 | 2013 | 2014 | 2015 | 2016 | 2017 | 2018 | 2019 | |
|---|---|---|---|---|---|---|---|---|---|---|---|
| Exports (receipts) | 1,170 | 837 | 917 | 1,355 | 1,009 | 1,007 | 1,491 | 1,703 | 2,224 | 2,782 | 2,884 |
| Imports (payments) | -702 | -658 | -702 | -955 | -692 | -748 | -876 | -859 | -1,404 | -1,827 | -1,844 |
| Balances | 468 | 179 | 214 | 400 | 317 | 260 | 615 | 844 | 821 | 956 | 1,040 |
As shown in Figure 27, from 2009 to 2012, both imports and exports for Advertising and Related Services fluctuated. Imports increased from $702 million in 2009 to $955 million in 2012. Exports went from $1.2 billion in 2019 to $1.4 billion in 2012. In 2013, imports declined to $692 million (27.5% lower than in 2012), before increasing again to $1.8 billion in 2019. Exports rapidly declined to $1 billion in 2013 (25.5% lower than in 2012), then grew steadily from 2013 to 2019, reaching a high of $2.9 billion in 2019. Due to this increase in exports, the trade surplus in Advertising and Related Services has similarly grown from $468 million in 2009 to $1 billion in 2019, i.e. $572 million or 122.2% higher than in 2009.
Audio-visual services
Relative to the other commercial services categories included in this study, Audio-Visual Services was one of the major contributors to Canada’s international transactions in services related to the copyright-based industries, accounting for 23.4% of exports and 18.7% of imports in 2019.
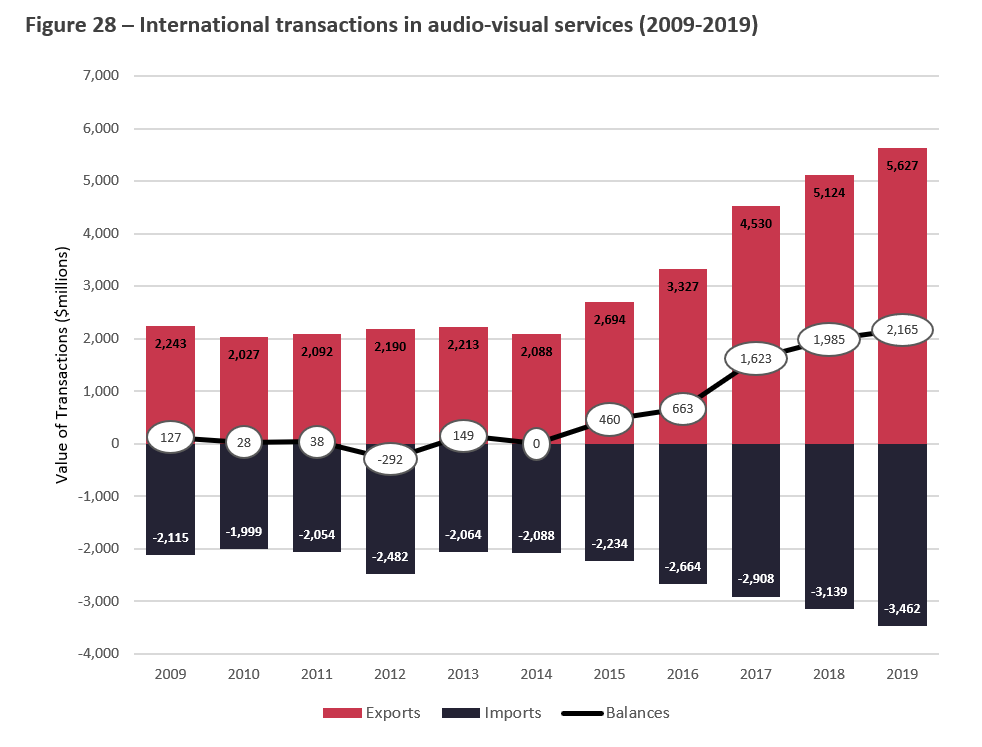
Source of Data: Statistics Canada. Table 36-10-0006-01 International transactions in services, commercial services by category, annual (x 1,000,000).
Figure 28 – International transactions in audio-visual services (2009-2019) – text version
| 2009 | 2010 | 2011 | 2012 | 2013 | 2014 | 2015 | 2016 | 2017 | 2018 | 2019 | |
|---|---|---|---|---|---|---|---|---|---|---|---|
| Exports (receipts) | 2,243 | 2,027 | 2,092 | 2,190 | 2,213 | 2,088 | 2,694 | 3,327 | 4,530 | 5,124 | 5,627 |
| Imports (payments) | -2,115 | -1,999 | -2,054 | -2,482 | -2,064 | -2,088 | -2,234 | -2,664 | -2,908 | -3,139 | -3,462 |
| Balances | 127 | 28 | 38 | -292 | 149 | 0 | 460 | 663 | 1,623 | 1,985 | 2,165 |
As illustrated in Figure 28, from 2009 to 2014, exports of Audio-Visual Services remained relatively stable, before increasing by 169.5% from $2.1 billion in 2014 to $5.6 billion in 2019. Imports were also relatively stable, before increasing steadily from $2.1 billion in 2013 to $3.5 billion in 2019, an increase of 67.7% in six years.
Despite differences in growth rates, exports and imports remained relatively even from 2009 to 2014, resulting in a trade balance that was sometimes in surplus and sometimes in deficit throughout that time. Due to the large increase in exports from 2014 to 2019, the trade balance remained in surplus during that period, increasing from a trade balance of $0 in 2014 to a trade surplus of $2.2 million in 2019.
Other personal, cultural and recreational services
Statistics Canada does not disaggregate the data for the Other Personal, Cultural and Recreational Services commercial services category, which prevents the separation of sporting and recreational activities, education services, health services, and gambling from this category.
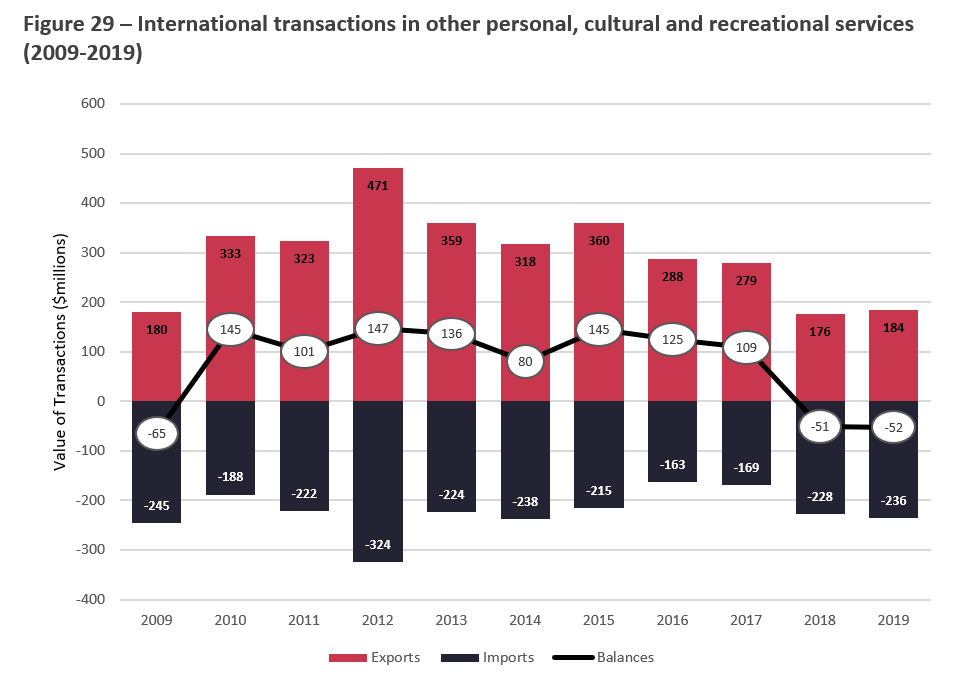
Source of Data: Statistics Canada. Table 36-10-0006-01 International transactions in services, commercial services by category, annual (x 1,000,000).
Figure 29 – International transactions in other personal, cultural and recreational services (2009-2019) – text version
| 2009 | 2010 | 2011 | 2012 | 2013 | 2014 | 2015 | 2016 | 2017 | 2018 | 2019 | |
|---|---|---|---|---|---|---|---|---|---|---|---|
| Exports (receipts) | 180 | 333 | 323 | 471 | 359 | 318 | 360 | 288 | 279 | 176 | 184 |
| Imports (payments) | -245 | -188 | -222 | -324 | -224 | -238 | -215 | -163 | -169 | -228 | -236 |
| Balances | -65 | 145 | 101 | 147 | 136 | 80 | 145 | 125 | 109 | -51 | -52 |
From 2008 to 2009, Figure 29 shows that exports had declined substantially (from $337 million in 2008 to $180 million in 2009) with little change in imports, resulting in a trade deficit of $65 million in 2009. In 2009, Canada had a trade deficit of $65 million, with exports of $180 million, and imports of $245 million. The following year, exports recovered and the trade balance in this commercial services category has remained in surplus from 2010 to 2017, before declining into a trade deficit in 2018 and 2019. The volume of trade in this commercial services category peaked in 2012 (exports of $471 million, imports of $324 million, balance of $147 million), before declining the next year. Both exports and imports have declined since then, leading to a trade surplus that remained relatively stable, with some fluctuations, before declining into a trade deficit of $51 million in 2018. In 2019, the exports ($185 million), imports ($236 million), and trade balance (-$52 million) were close to the 2009 numbers.
Conclusion
The copyright-based industries play an increasingly important role in Canada’s economy. Their economic contribution in terms of GDP, employment, and international trade compares favourably to other economic sectors despite having been affected by the financial crisis and broader trends related to digital disruption.
In fact, the 2008 financial crisis and subsequent economic downturn are likely factors which explain a decrease in the contribution of the copyright-based industries to the Canadian GDP from 2009 to 2012, before a period of rapid and steady growth from 2012 to 2019. The employment data suggests some resiliency within the core copyright-based industries, as employment in these industries decreased proportionately less than the overall Canadian employment in the year following the crisis. International trade in copyright-related services was also affected by the financial crisis, as the receipts (exports), payments (imports) and balances of copyright-related services generally decreased in the years following the crisis, recovered in 2010, declined again in 2013, and have since been increasing steadily. In general, the perturbation of recessionary pressure seems to be less pronounced but also to take longer to recover in the copyright-based industries when compared to the total Canadian economy.
The GDP of the core copyright-based industries started to recover in 2012 and increased by more than a third between 2012 and 2019, with a CAGR of more than double the growth rate of the overall Canadian economy. The employment in the core copyright-based industries started to recover in 2010 and continued to grow despite a slight decrease in 2012, amounting to an overall significant growth of employment in these industries from 2009 to 2019. The share of the core copyright-based industries in the overall Canadian employment also grew, meaning that the copyright-based industries contribute increasingly to Canadian employment. The receipts and payments of international transactions started to recover in 2011 and have grown since then, despite a decline in 2013. The trade balance stayed at a surplus for the copyright-related services from 2009 to 2019, which means that Canada has exported more copyright-related services than it has imported in that period.
Among the seven subsectors of the core copyright-based industries, Computer Systems Design and Related Services has been the largest contributor in terms of economic impact from 2009 to 2019. It accounted for almost half of the GDP and employment of the core copyright-based industries during that period, followed by the Publishing Industries (except internet). Similarly, Computer and Information Services accounted for the largest share of international transactions in services related to the copyright-based industries, maintaining a trade surplus during that period.
Audio-Visual Services was the second largest contributor to Canada's international transactions in services related to the copyright-based industries, its trade more than doubling in volume between 2009 and 2019. The category of Copyright and Related Rights, which comprises payments for licenses to reproduce or distribute intellectual property such as copyrights and related rights, accounted for the smallest share in terms of international transactions of the copyright-related services in the years studied.
Additionally, the economic weight of the core copyright-based industries has been affected in diverse ways by emerging technologies. On the one hand, this is notably reflected on the gradually shrinking GDP of non-internet publishing and broadcasting since 2009, and on the GDP fluctuation of the motion picture and sound recording industries from 2009 to 2019. The employment numbers in the publishing and broadcasting industries (excluding internet), decreased since 2009 and especially since 2013. On the other hand, the GDP of Other Information Services (which includes internet publishing and broadcasting, among other internet activities) increased since 2009, and so did the GDP of Computer Systems Design and Related Services. The employment in Other Information Services, Motion Picture and Sound Recording Industries, and Computer Systems Design and Related Services also grew steadily from 2009 to 2019 despite being slightly affected by the financial crisis.
As the copyright-based industries have become key drivers of the overall Canadian economy, it is important to evaluate the factors and trends that affect these industries – notably the emerging technologies that hold the potential to drive change in these industries. Indeed, new and emerging technologies disrupt business models and observed trends, such as a shift towards digital and online production and consumption across multiple economic sectors in recent years. These effects are also reflected on the economic data regarding the Canadian copyright-based industries.
In future work, it would be useful to consider other factors that may have affected the economic impact of the Canadian copyright-based industries in the last 10 years. More contextual and qualitative analysis of the data presented in this report – including the impact of the financial crisis and broader technological shifts – would lead to a better understanding of the role that these industries play in the Canadian economy.
It will also be important to have current data for 2020 and beyond, to develop an overview of how the COVID-19 pandemic affects the copyright-based industries. As previously noted, this report presents a ten-year portrait, from 2009 to 2019, of the copyright-based industries prior to the onset of the COVID-19 pandemic; future reports will be needed to examine data for the periods covering and extending beyond the 2020 pandemic. It will be relevant to continue to analyze the data in upcoming years, to gain a better understanding of the pandemic’s short-term and long-term effects on Canada’s copyright-based industries, national economy and broader society.
Lastly, future work should continue to align study and analysis of the Canadian copyright-based industries with common international practice and the recommendations of the World Intellectual Property Organization (WIPO). This will facilitate work alongside other member states to further knowledge and action related to the copyright-based industries’ contribution to national economies and international trade.
Appendix 1: Data comparability
This annex is provided to present context on the report’s underlying data and considerations in comparing this data with other sources, particularly the Culture Satellite Accounts.
The Canadian Culture Satellite Account (CSA)Footnote 19 is an accounting framework derived from Statistics Canada’s Canadian System Macroeconomic Accounts,Footnote 20 which compiles and integrates economic data to give a comprehensive picture of the economy and how it works, and results are organized into domains and sub-domains of related activity based on the Canadian Framework for Culture Statistics, 2011 (CFCS).Footnote 21 Those associated with culture are listed in Table 2 below.
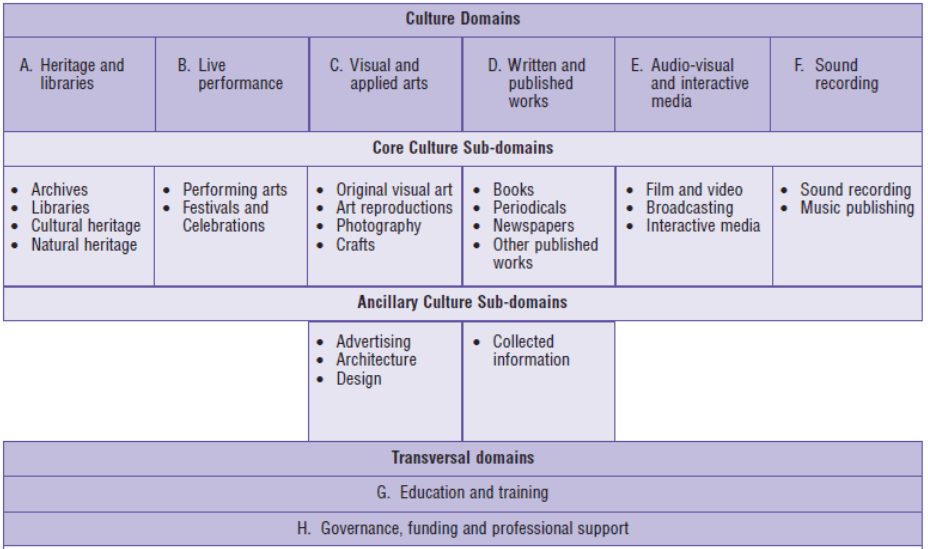
Table 2 – Culture domains and sub-domains of the Canadian Framework for Culture Statistics (2011) – text version
Table 2 shows the six culture domains and two transversal domains, along with their respective sub-domains, which compose the Canadian Framework for Culture Statistics. The six culture domains are shown at the top of Table 2 in dark purple. Beneath these, the six core sub-domains are shown in Table 2 in light purple below the culture domains to which they belong. Similarly, the ancillary culture sub-domains, are shown in Table 2 in light purple nested below the culture domains to which they belong. Finally, the transversal domains are shown in Table 2 in dark purple, cutting across all other domains.
The Framework consists primarily of six culture domains, as grouped by similarity of content:
Culture domains
- Heritage and libraries
- Live performance
- Visual and applied arts
- Written and published works
- Audio-visual and interactive media
- Sound recording
Each culture domain can be further disaggregated into core culture sub-domains. Core culture sub-domains produce goods and services that are the result of creative artistic activity and whose main purpose is often the transmission of an intellectual or culture concept. The core cultural sub-domains are as follows:
Core culture sub-domains
Heritage and libraries
- Archives
- Libraries
- Cultural heritage
- Natural heritage
Live performance
- Performing arts
- Festivals and Celebrations
Visual and applied arts
- Original visual art
- Art reproductions
- Photography
- Crafts
Written and published works
- Books
- Periodicals
- Newspapers
- Other published works
Audio-visual and interactive media
- Film and video
- Broadcasting
- Interactive media
Sound recording
- Sound recording
- Music publishing
The Framework recognizes two categories of ancillary culture sub-domains that fall under “C. Visual and applied arts” and “D. Written and published works”, respectively. Ancillary culture sub-domains produce goods and services that are the result of creative artistic activity (e.g. designs, architectural plans), but their primary purpose is not the transmission of an intellectual or culture concept. The final products, which have primarily a practical purpose (e.g. a landscape, a building, an advertisement), are not covered by the Framework definition of culture.
Ancillary culture sub-domains
Visual and applied arts
- Advertising
- Architecture
- Design
Written and published works
- Collected information
In addition to the six domains that group culture by similarity of content, transversal domains categorize industries, products or occupations that are directly related to, and cut across, all six content domains. The transversal domains produce goods and services that support all core and ancillary culture sub-domains. Transversal domains are not fundamentally cultural but are an integral part of culture statistics because the culture domains could not exist without them.
Transversal domains (apply to all culture domains)
- Education and training
- Governance, funding and professional support
Brief discussion of data overlap
There is a substantive degree of overlap, as evidenced by Table 2, between the core copyright-based industries used for this study and the CFCS culture sub-domains used by the CSA. However, there are also important differences between what the two represent conceptually, particularly which industries (or partial elements thereof) are included in, or excluded from, their respective estimates. The resulting effect is that even similar categories – such as Broadcasting – can report divergent trends over time.
The distinguishing characteristic between the two is that the Economic Impact of Canada’s Copyright-Based Industries study is concerned with industries implicated in copyrightable goods and services, whereas the CSA focuses solely on cultural economic activity (notwithstanding sport). More precisely, the CFCS, used by the CSA, defines culture as “creative artistic activity and the goods and services produced by it, and the preservation of heritage”,Footnote 22 and a good or service [to be considered cultural] must comply with the CFCS definition of culture and satisfy at least one of the following six criteria:Footnote 23
- It has the potential of being protected by copyright legislation, or in other words, be ‘copyrightable’. Examples include a magazine article, script, manuscript, drawing, choreography, book, newspaper column, sculpture, radio program, film, videogame, etc.;
- It supports the creation, production, dissemination or preservation of culture products, e.g. recording, manufacturing, printing, broadcasting, podcasting, etc.;
- It adds to, or alters, the content of a culture product (content services), e.g. editorial services, translation, illustration, layout and design, music, etc.;
- It preserves, exhibits, or interprets human or natural heritage, e.g. historic sites and buildings, archives, museums, art galleries, libraries, botanical gardens, zoos, etc.;
- It provides training or educational services aimed at individuals who create, produce or preserve culture products; or
- It governs, finances, or supports directly culture creation, production or dissemination, e.g. services provided by government, unions, associations, copyright societies, etc.
Therefore, the CSA and the Economic Impact of Canada’s Copyright-Based Industries study provide different – albeit complementary – views of the Canadian economy, and the economic trends that they present are not accurately comparable.