
Archived - Report on Federal Tax Expenditures - Concepts, Estimates and Evaluations 2022: part 10
Distributional Analysis of Personal Effective Marginal Tax RatesFootnote 1
1. Introduction
This paper analyzes the distribution of effective marginal tax rates (EMTRs) on labour income among Canadians aged 18 to 64 years using survey dataFootnote 2 and considering the federal and provincial tax and transfer systems as they were in 2017. EMTRs refer to the amounts of taxes owed and the reduction of benefits resulting from earning additional income through an increase in work hours or wages. EMTRs are generally derived on the basis of hypothetical scenarios. Such an approach uses the tax and transfers rules to compute EMTRs for various typical cases (e.g., unattached individual without kids residing in Ontario, with a given amount of annual earnings), assuming they are receiving all benefits for which they are eligible. While useful for identifying potentially problematic cases (i.e., circumstances where individuals are especially likely to face high EMTRs), the approach simplifies the reality with regards to benefits take-up and the mix of possible individual income situations and characteristics, while not allowing for the production of descriptive statistics. By using an approach based on survey data, the analyses presented in this study account for the actual rates of benefits, income situations, and individual characteristics. This methodology is especially useful for identifying and examining individuals who are actually facing high EMTRs. The main goals of the paper are to provide a comprehensive overview of EMTRs in Canada (federal, provincial and combined), as well as to identify the actual number of workers facing high EMTRs, their characteristics and the type of taxes and benefits that are involved.
The remainder of this paper is as follows. Section 2 describes the population of interest for calculating EMTRs, and Section 3 presents the distribution of EMTRs among this population. Sections 4 and 5 examine the contribution of the federal and provincial tax and transfer systems and the characteristics associated with high EMTRs. Section 6 discusses the profile of high-EMTR individuals in Canada. Methodological information, including definitions of EMTRs, details about the data, the tool and methodology used to derive actual EMTRs can be found in Annex A.
2. Population of Interest for Calculating EMTRs
As the main goal is to examine EMTRs on labour income, the group of interest is limited to individuals who are the most likely to participate in the labour market, i.e., those aged 18 to 64 years. Individuals who are below and above this age range are not expected to respond as much to lower or higher marginal tax rates on labour income. Among working-age individuals, those who worked during the year represent the population of interest for calculating EMTRs, since only the employed may decide to intensify their actual work effort.
Among the 36.3 million Canadian individuals, 22.9 million (63.2%) were aged 18 to 64 years, and among working-age individuals, close to 19 million (82.8%) reported some employment income in 2017 and formed the population of interest for calculating EMTRs.
The vast majority of individuals with employment income reported at least some wages and salaries (92.5%) and 7.5% only reported self-employment income. While most workers did not rely at all on social assistance (SA) income, 5.3% of them either reported some SA benefits or had SA recipients in their families. Social assistance is a provincial last-resort income-tested benefit based on family income. Accordingly, in couples, an increase in working income of any of the spouses can affect the SA amount granted to the family, regardless of which spouse is the SA recipient.
3. Distribution of EMTRs among Workers aged 18-64
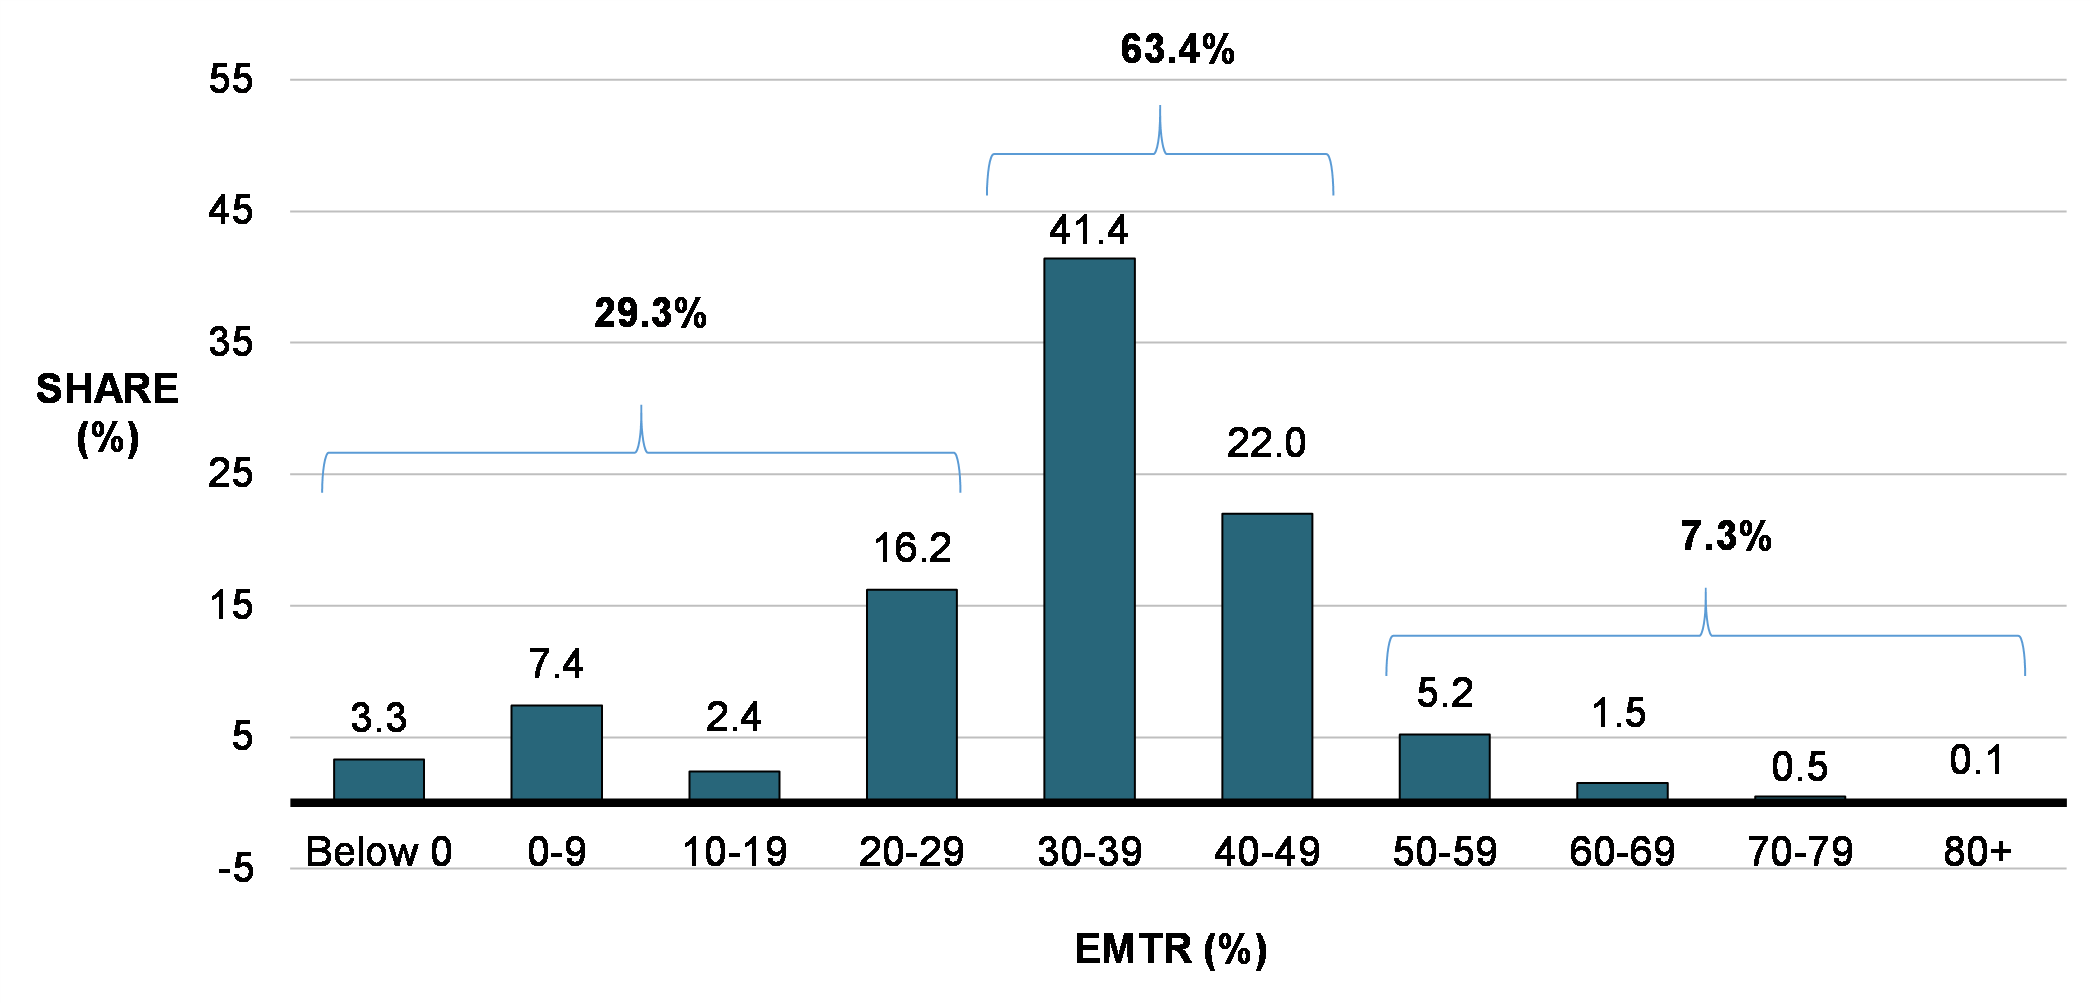
Among non-SA recipient workers, the average EMTR was 33% in 2017. The largest proportion (63.4%) faced EMTRs that were in the 30-49.9% range. About 29.3% faced EMTRs that were below 30% and 7.3% faced EMTRs of 50% or more.
Distribution of EMTRs among workers aged 18-64 who were not in receipt of SA, 2017
The distribution of EMTRs is different among workers who also rely on SA income. Workers with SA income in their family are more likely to face a 50% EMTR or more. Among them, the proportion facing such a high EMTR varies between 22.7% and 44.9% – depending on the assumption used for estimating SA claw back ratesFootnote 3 – compared with 7.3% among non-SA recipients.
The distribution of EMTRs among workers relying on SA is very sensitive to the assumption used for estimating the impact of labour income increments on SA income, and the available information does not allow a firm choice as to which assumption applies best. Nevertheless, because SA recipients represent only a small proportion of workers, the assumption retained does not have a significant impact on the overall distribution of EMTRs. To ensure that EMTRs are not underestimated among SA recipients, the more cautious assumption (scenario 1, footnote 3) was retained for the remainder of the analysis.
Under this assumption, it is estimated that the 19 million workers experienced an average EMTR of 34.1% (i.e., an average EMTR that is 1.1 percentage point higher than that experienced by the 18 million non-SA workers). This means that, on the whole, working Canadians would have benefited from $659, on average, out of an extra $1,000 of labour income.
4. Contributions of the Federal and Provincial Tax and Transfer Systems
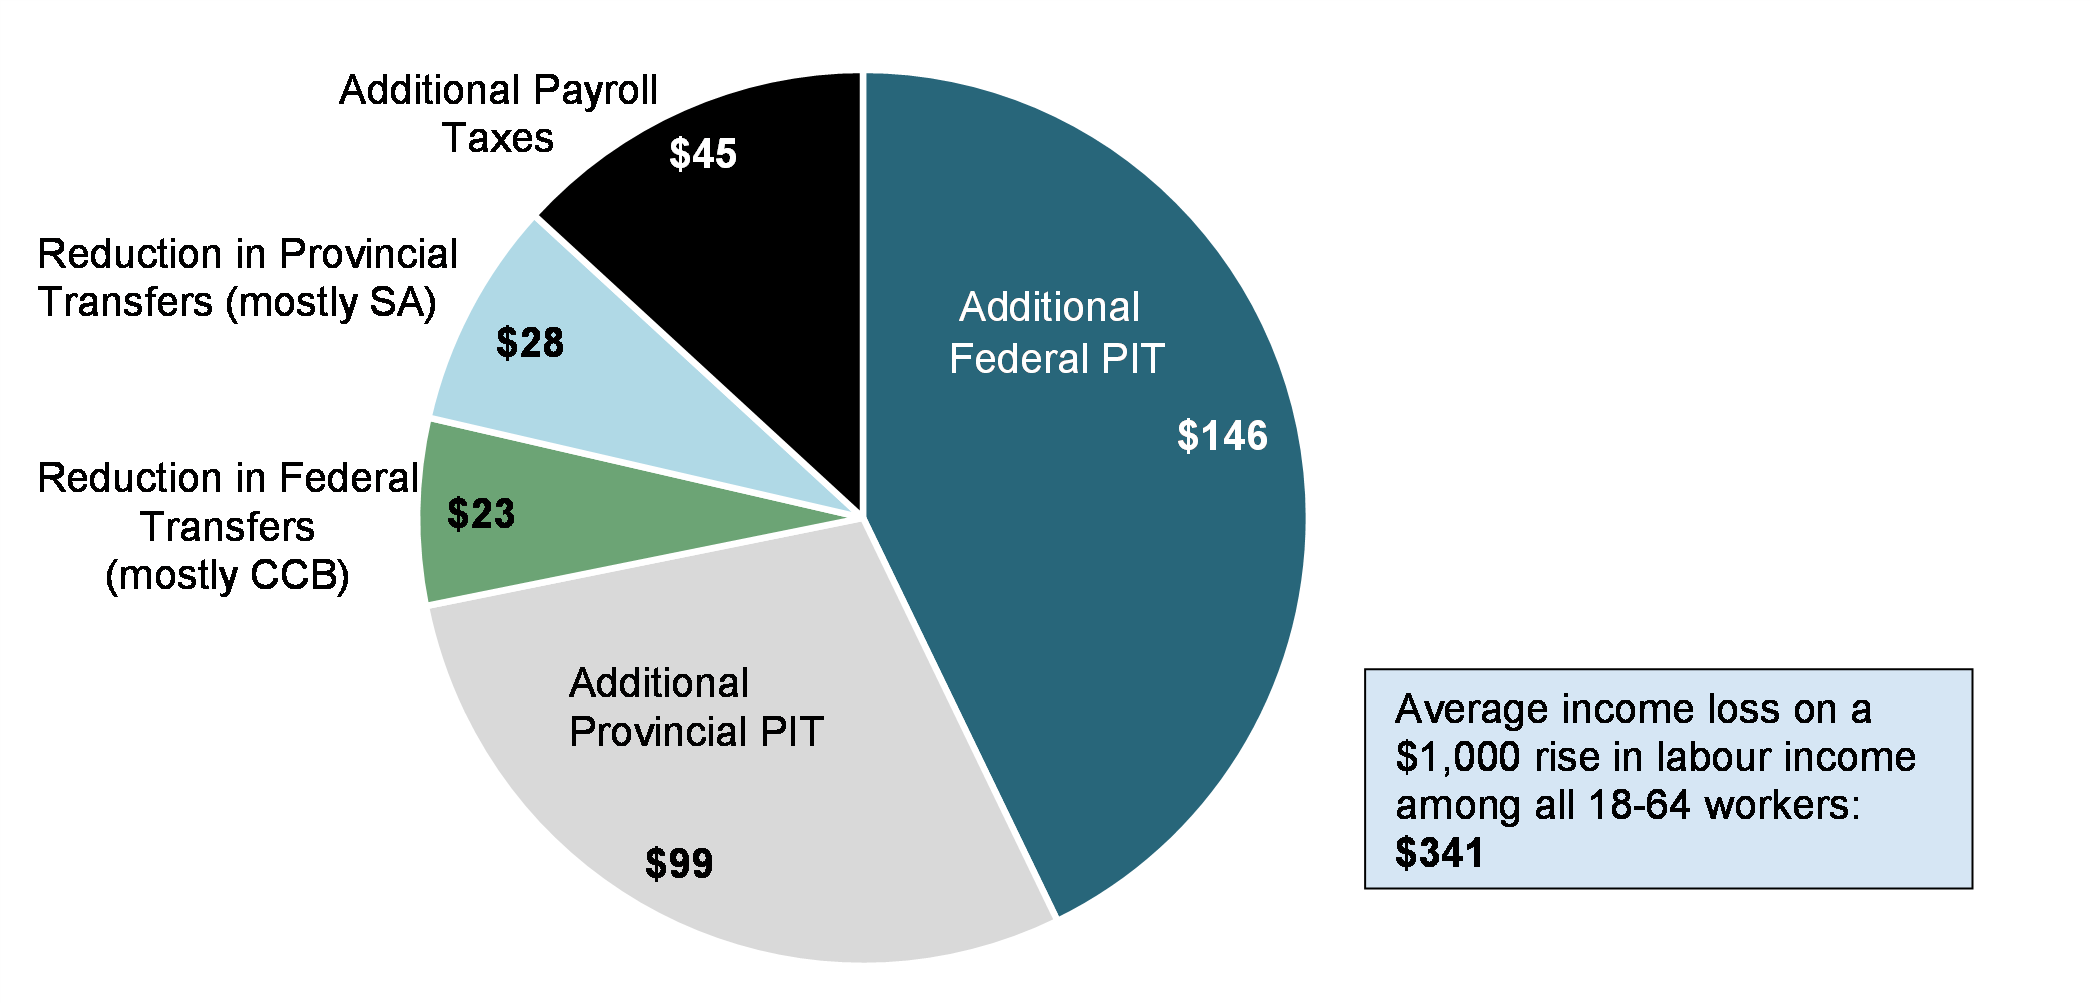
The income loss as a result of the application of the federal and provincial tax and transfer systems would be $341 on average. A decomposition of this 34.1% EMTR (Chart 2) suggests that, on average, the application of the federal personal income tax (PIT) and transfer system is responsible for almost half of the $341 average income loss, compared with 37% for the provincial tax and transfer system and with 13% for the combined federal-provincial payroll taxes.
The impact of the federal tax and transfer system is mainly driven by the additional PIT that workers would have owed on an extra $1,000 of labour income, and to a lesser extent by the reduction in federal transfer payments that they would have been entitled to, especially through reductions in Canada Child Benefit (CCB) amounts. The provincial impact is also particularly driven by the additional provincial PIT that workers would have had to pay, but to a lesser extent. At the provincial level, it is mostly SA claw back that explains the average loss in government transfers.
Contribution of changes in federal and provincial PIT and transfers, and in combined payroll taxes to the average EMTR of Workers aged 18-64, 2017
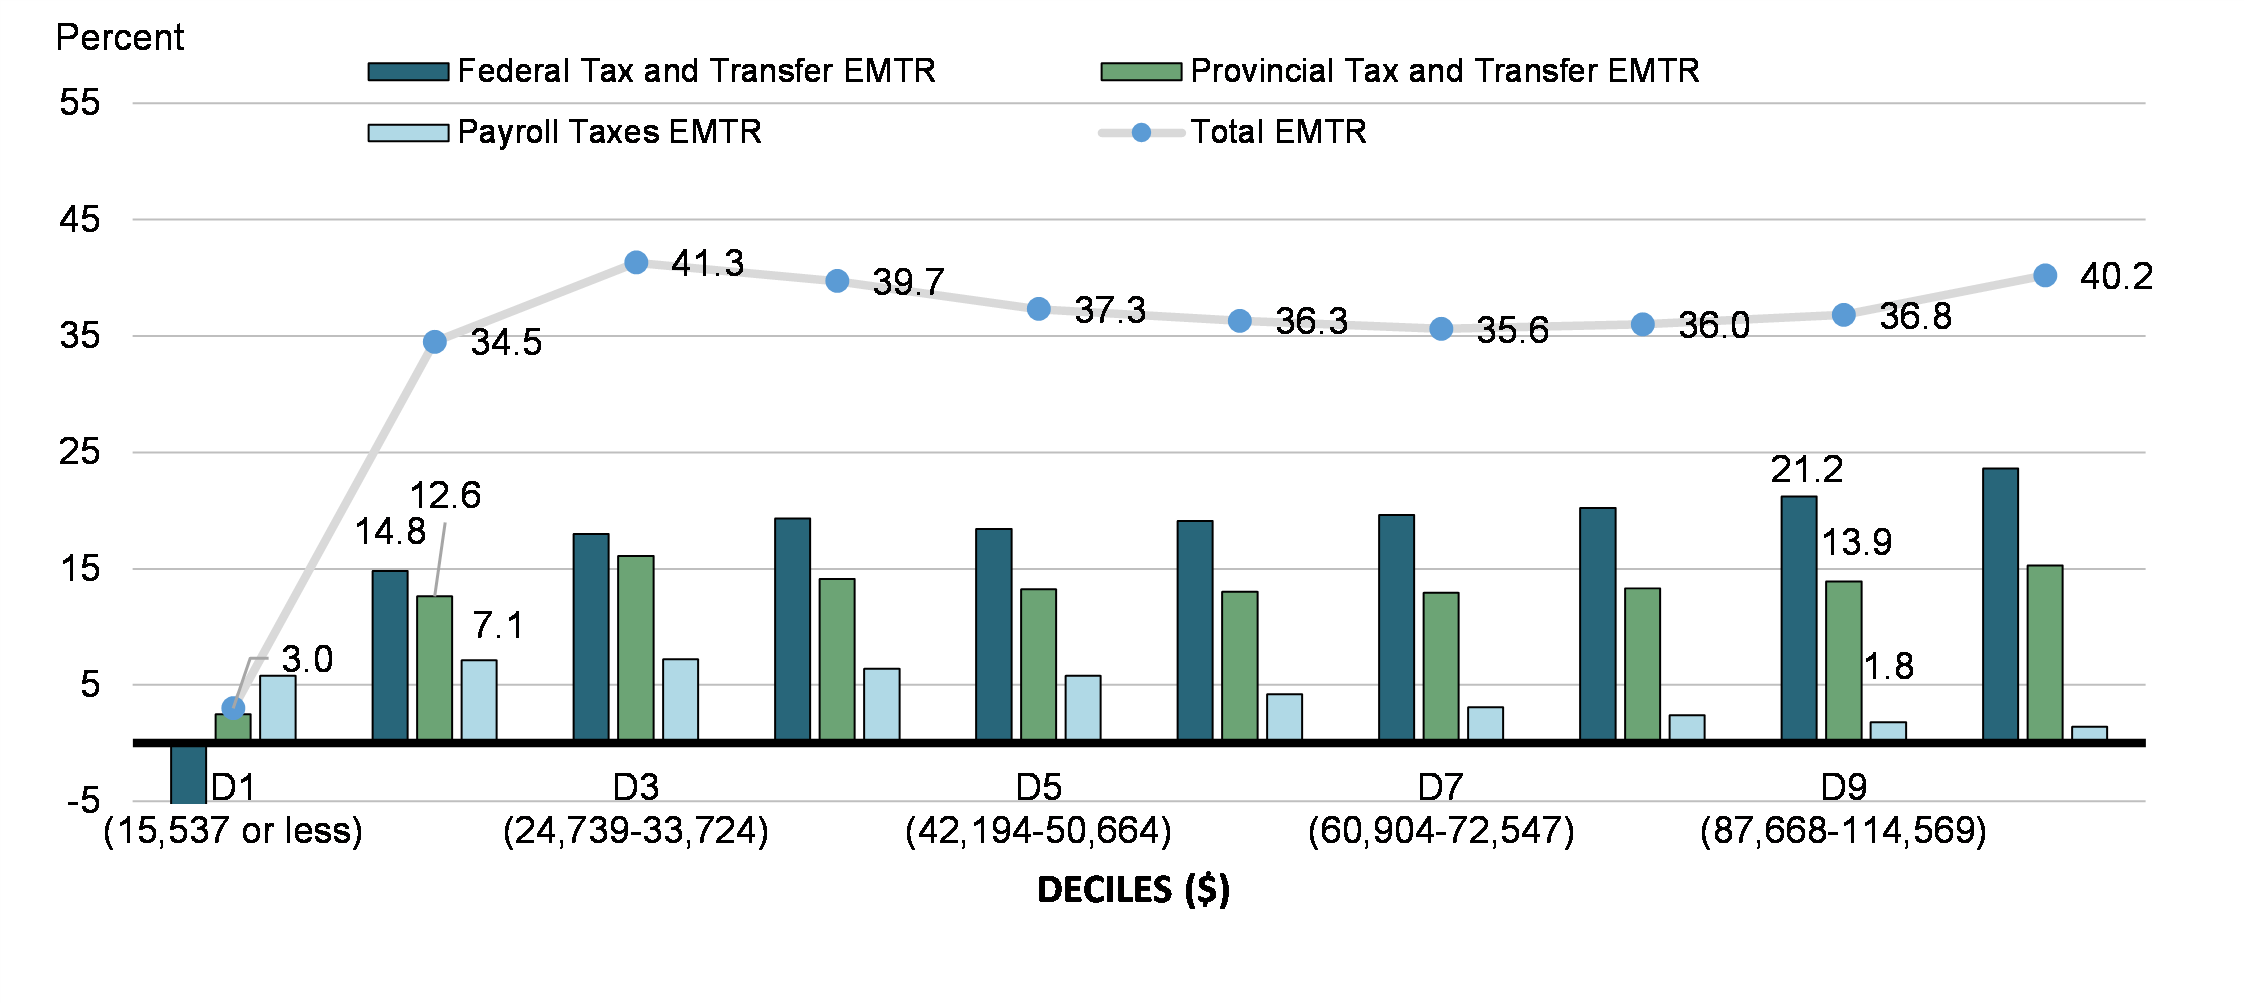
Because of the progressivity of federal and provincial PIT systems and because transfer programs are mostly targeted to lower income families, the contribution of taxes and transfers to workers' EMTRs varies across the family income spectrum. As Chart 3 shows, the average EMTR is significantly lower among workers who are part of the first family income decile (3.0%). Workers in the bottom decile would have retained almost the totality ($970) of an additional $1,000 in labour income, mainly due to the positive impact of the federal tax and transfer system. Compared to the first decile, average EMTR increases rapidly for workers in the second (34.5%) and third (41.3%) family income deciles. It then decreases slightly until decile 7 (35.6%), and starts to increase again afterwards, to reach 40.2% among workers in the top decile. Overall, workers in the third family income decile (i.e., those with an adjusted family income between $24,739 and $33,724) were those who faced the highest average EMTR (41.3%), followed by those in the top decile. It is interesting to note though that, while the average EMTR is just slightly higher in decile 3 than in the top decile, the proportion of workers with a 50% EMTR or more is considerably higher in the third decile (23.6% versus 11.8%).
Chart 3 also shows that the contribution to total EMTRs of the federal tax and transfer system increases with family income decile. The contribution of the provincial tax and transfer system also tends to increase with family income decile, but less markedly. In contrast, the contribution of payroll taxes generally decreases with family income decile. For instance, the federal tax and transfer system, the provincial tax and transfer system and payroll taxes were responsible for about 43%, 37% and 21% respectively of the total 34.5% average EMTR observed among workers in decile 2 compared with 58%, 38% and 5% respectively of the total 36.8% average EMTR among workers in decile 9.
Total EMTR, federal and provincial tax and transfer EMTR, and payroll taxes EMTR among workers aged 18-64, by adjusted* family income deciles, 2017
As can be seen in Table 1, changes in federal and provincial transfer program entitlements mostly explain the average EMTR observed among workers in the bottom family income decile. In all other deciles, changes in the amounts of federal and provincial PIT owed contribute mostly to EMTRs. In particular, the average increase in Working Income Tax Benefit (WITB) amounts and Goods and Services Tax/Harmonized Sales Tax Credit (GSTC)Footnote 4 (+$51, +$7) entirely compensate the average increase in payroll taxes that workers in the first decile encounter (+$58). However, the rise in WITB, GSTC and provincial transfers other than SA is not sufficient to entirely compensate average PIT increases and SA claw backs.
Table 1 also suggests that, among all federal transfers, changes in entitlement to the WITB predominantly impact additional gains from work in deciles 1 and 2, whereas the CCB and GSTC have stronger impacts in deciles 3, 4 and 5. While the CCB continues to have small impacts in deciles 6 to 9, impacts of all other federal transfers are negligible among workers in these higher family income groups. It is worth noting that, for deciles 2 and 3, provincial transfers play a larger role in explaining workers' EMTRs than federal transfers, while the opposite is true for all other deciles.
Given the progressivity of the Canadian tax system, federal and provincial PIT reduce the gain from additional earnings, as family income increases. While this is also true for payroll taxes from deciles 1 to 3, the upward trend reverses starting at decile 4, likely due to the maximum contribution thresholds.
| Average changes in $ | D1 | D2 | D3 | D4 | D5 | D6 | D7 | D8 | D9 | D10 |
|---|---|---|---|---|---|---|---|---|---|---|
| Federal PIT | -6 | -85 | -118 | -137 | -149 | -167 | -177 | -183 | -200 | -234 |
| Provincial PIT | -1 | -49 | -80 | -103 | -110 | -117 | -122 | -127 | -135 | -149 |
| Federal transfers* | 59 | -63 | -62 | -56 | -35 | -24 | -20 | -19 | -12 | -2 |
WITB |
51 | -59 | -5 | -1 | 0 | 0 | 0 | 0 | -1 | 0 |
CCB |
0 | -3 | -35 | -35 | -23 | -22 | -19 | -18 | -11 | -2 |
GSTC |
7 | 3 | -15 | -15 | -11 | -1 | 0 | 0 | 0 | 0 |
Others |
1 | -4 | -7 | -5 | -1 | 0 | 0 | 0 | 0 | 0 |
| Provincial transfers | -24 | -77 | -81 | -38 | -22 | -14 | -7 | -6 | -4 | -4 |
SA |
-30 | -59 | -31 | -9 | -8 | -5 | -5 | -3 | -3 | -4 |
Others |
6 | -18 | -50 | -29 | -14 | -9 | -2 | -4 | -1 | 0 |
| Combined payroll taxes | -58 | -71 | -72 | -64 | -58 | -42 | -31 | -24 | -18 | -14 |
| Total | -30 | -345 | -413 | -397 | -373 | -364 | -356 | -360 | -368 | -403 |
| * A positive number reflects an increase in transfers received. Source: Author's calculations using Statistics Canada's SPSD/M, v. 27.0. |
||||||||||
5. Distribution of EMTRs by Characteristics of Workers
As previously mentioned, the average EMTR and the proportion of individuals who face an EMTR of 50% or more are considerably higher among workers who rely on SA. While especially important, being in receipt of SA is not the sole factor increasing the likelihood of facing a high EMTR among workers. The presence of children is another factor that significantly increases the chances that workers experience a high EMTR. As Table 2 indicates, 19.1% of workers with children in their family faced an EMTR of 50% or more, compared with 4.8% of workers in families without children. Among workers in families with children, lone parents were the most likely to face a high EMTR (35.1%), followed by those who were the main worker in two-parent families (21.7%), and then by those who were the secondary workers in such families (11.7%).
While less markedly, the distribution of EMTRs also vary depending on other demographic and socio-economic characteristics of workers. Notably, workers who lived in the province of Quebec, who were aged 35-44 years old and/or were recent immigrants were slightly more likely to face an EMTR of 50% or more. Indeed, the proportions with an EMTR of 50% or more were respectively 16.2%, 15.4% and 13.6% for these three groups, compared to 9.4% for the overall population of workers. To some extent, educational attainment and intensity of work are also correlated with the level of EMTRs among workers. EMTRs calculated among those with a higher level of education and/or those who work full-time full-year (FTFY) were higher on average than among less educated workers and/or those who did not work FTFY. On the other hand, the distribution of EMTRs among these groups suggests that more educated workers and/or FTFY workers are less likely to face very low or very high EMTRs. In comparison with these two groups, the proportion of workers with EMTRs of at least 70% was higher among workers with less than a high school diploma and/or part-time or part-year workers.
| EMTRs | Distribution of EMTRs | ||||||||
|---|---|---|---|---|---|---|---|---|---|
| Characteristics | Number (x1000) | MEAN | 50% EMTR or more | Under 30% | 30-39% | 40-49% | 50-59% | 60-69% | 70% or more |
| All 18-64 workers | 18,968 | 34.1 | 9.4 | 28.8 | 40.4 | 21.4 | 5.3 | 1.7 | 2.4 |
| SA beneficiary | |||||||||
| Yes | 998 | 53.5 | 44.9 | 21.1 | 23.4 | 10.6 | 7.2 | 4.6 | 33.3 |
| No | 17,970 | 33.0 | 7.4 | 29.3 | 41.4 | 22.0 | 5.2 | 1.5 | 0.7 |
| Province | |||||||||
| Newfoundland and Labrador | 255 | 36.2 | 9.5 | 27.2 | 30.0 | 33.3 | 6.2 | 1.5 | 1.9 |
| Prince Edward Island | 79 | 34.9 | 7.0 | 21.9 | 46.2 | 24.9 | 4.5 | 0.7 | 1.8 |
| Nova Scotia | 453 | 36.0 | 8.3 | 21.4 | 41.0 | 29.4 | 6.3 | 0.7 | 1.3 |
| New Brunswick | 385 | 34.3 | 5.4 | 19.7 | 48.7 | 26.2 | 3.7 | 0.8 | 1.0 |
| Quebec | 4,379 | 38.1 | 16.2 | 15.0 | 35.1 | 33.7 | 9.9 | 4.0 | 2.2 |
| Ontario | 7,206 | 33.2 | 9.6 | 35.7 | 37.0 | 17.6 | 5.2 | 1.4 | 3.0 |
| Manitoba | 644 | 35.3 | 6.7 | 14.9 | 55.0 | 23.3 | 4.7 | 0.7 | 1.3 |
| Saskatchewan | 567 | 34.3 | 3.9 | 15.3 | 64.4 | 16.4 | 1.8 | 0.2 | 1.9 |
| Alberta | 2,437 | 31.6 | 4.3 | 25.8 | 56.5 | 13.4 | 2.3 | 0.6 | 1.4 |
| British Columbia | 2,564 | 30.9 | 4.7 | 45.6 | 34.3 | 15.5 | 1.8 | 0.4 | 2.4 |
| Age group | |||||||||
| 18-24 | 2,642 | 19.1 | 3.0 | 61.6 | 26.8 | 8.6 | 1.0 | 0.6 | 1.4 |
| 25-34 | 4,365 | 35.1 | 9.2 | 26.9 | 44.7 | 19.1 | 4.6 | 1.8 | 2.8 |
| 35-44 | 4,202 | 39.0 | 15.4 | 17.4 | 39.2 | 28.0 | 8.9 | 3.1 | 3.4 |
| 45-54 | 4,172 | 37.0 | 9.4 | 21.0 | 44.3 | 25.4 | 5.9 | 1.6 | 1.9 |
| 55-64 | 3,586 | 34.6 | 7.3 | 29.5 | 42.1 | 21.0 | 4.6 | 0.7 | 2.0 |
| Gender | |||||||||
| Man | 9,819 | 35.1 | 10.0 | 25.9 | 39.1 | 25.1 | 6.3 | 1.5 | 2.2 |
| Woman | 9,149 | 33.0 | 8.8 | 32.0 | 41.8 | 17.4 | 4.3 | 1.8 | 2.6 |
| Immigrant status | |||||||||
| Not Immigrant | 14,316 | 33.9 | 8.8 | 28.4 | 41.2 | 21.7 | 5.2 | 1.4 | 2.1 |
| Recent Immigrant (< 10 yrs) | 1,548 | 33.8 | 13.6 | 31.7 | 35.3 | 19.4 | 6.1 | 3.7 | 3.8 |
| Not-Recent Immigrant | 3,104 | 34.9 | 10.2 | 29.4 | 39.6 | 20.8 | 5.6 | 1.8 | 2.8 |
| Highest education | |||||||||
| Less than High School (HS) | 1,459 | 32.5 | 11.5 | 34.7 | 36.6 | 17.3 | 5.4 | 2.1 | 4.0 |
| HS | 5,158 | 29.7 | 7.6 | 40.1 | 36.5 | 15.8 | 3.8 | 1.6 | 2.2 |
| More than HS | 6,195 | 36.2 | 10.3 | 23.2 | 43.8 | 22.7 | 5.9 | 2.0 | 2.3 |
| University Degree | 6,156 | 36.0 | 9.5 | 23.7 | 41.2 | 25.7 | 6.1 | 1.3 | 2.2 |
| Student status | |||||||||
| Not Student | 16,117 | 36.5 | 10.1 | 23.5 | 42.9 | 23.5 | 5.8 | 1.8 | 2.5 |
| Full-Time Student | 2,151 | 16.4 | 4.0 | 67.6 | 21.6 | 6.8 | 1.8 | 0.9 | 1.3 |
| Part-Time Student | 700 | 32.4 | 9.0 | 32.4 | 41.3 | 17.3 | 4.7 | 2.2 | 2.1 |
| Type of worker | |||||||||
| Salaried | 17,550 | 34.2 | 9.2 | 28.3 | 41.1 | 21.4 | 5.2 | 1.7 | 2.4 |
| Self-Employed Only | 1,418 | 32.1 | 11.7 | 36.0 | 31.7 | 20.6 | 7.0 | 2.1 | 2.6 |
| Intensity of work | |||||||||
| Part-Year Worker | 5,663 | 28.6 | 10.0 | 43.8 | 32.3 | 13.9 | 4.7 | 1.9 | 3.5 |
| Part-Time, Full-Year, Worker | 1,657 | 29.9 | 10.0 | 43.5 | 33.1 | 13.5 | 3.7 | 1.7 | 4.6 |
| Full-Time, Full-Year Worker | 11,647 | 37.3 | 9.0 | 19.5 | 45.4 | 26.1 | 5.9 | 1.6 | 1.5 |
| Position in the family | |||||||||
| Unattached | 7,579 | 29.0 | 7.3 | 39.5 | 37.2 | 16.0 | 3.3 | 1.7 | 2.4 |
| Main Income Recipient (MIR) | 6,196 | 39.6 | 13.4 | 14.6 | 39.7 | 32.3 | 9.0 | 2.1 | 2.3 |
| Secondary Income (SIR) | 5,193 | 34.8 | 7.6 | 30.3 | 46.1 | 16.1 | 4.0 | 1.2 | 2.4 |
| Presence of kids | |||||||||
| Yes | 6,047 | 41.2 | 19.1 | 12.6 | 35.1 | 33.2 | 11.5 | 3.9 | 3.7 |
| No | 12,921 | 30.7 | 4.8 | 36.5 | 42.9 | 15.8 | 2.5 | 0.6 | 1.7 |
| Family circumstances | |||||||||
| Unattached Without Kids | 6,908 | 27.7 | 4.6 | 41.4 | 39.2 | 14.8 | 1.9 | 0.9 | 1.8 |
| Unattached With Kids | 671 | 42.3 | 35.1 | 19.4 | 16.5 | 29.0 | 17.7 | 9.5 | 7.9 |
| Couple With Kids, MIR | 2,903 | 43.7 | 21.7 | 4.8 | 32.1 | 41.4 | 14.5 | 4.0 | 3.2 |
| Couple With Kids, SIR | 2,473 | 38.0 | 11.7 | 19.8 | 43.8 | 24.6 | 6.3 | 2.3 | 3.2 |
| Couple Without Kids, MIR | 3,293 | 36.0 | 6.2 | 23.3 | 46.4 | 24.2 | 4.1 | 0.5 | 1.6 |
| Couple Without Kids, SIR | 2,720 | 31.9 | 3.8 | 39.8 | 48.1 | 8.3 | 1.8 | 0.3 | 1.7 |
| Source: Author's calculations using Statistics Canada's SPSD/M, v. 27.0. | |||||||||
It is also interesting to note that the average EMTR of working men (35.1%) was above that of working women (33.0%), and that a similar pattern was observed with respect to the proportions of men and women with EMTRs of 50% or more (10% versus 8.8%). Examining more carefully the distribution of EMTRs by gender suggests that women were slightly more likely than men to face EMTRs of 60% or more – likely due to their slightly more important reliance on transfersFootnote 5, but also more likely to face EMTRs below 40% – likely due to their generally lower personal income. Men, in turn, were more likely to face EMTRs in the 40-60% range.
On the other hand, average EMTR and the proportion of workers with an EMTR of 50% or more were especially low among young workers (i.e., those aged 18-24 years) and/or full-time students.Footnote 6
6. Profile of High-EMTR Individuals
While most workers would have retained the bulk of an additional $1,000 in labour income, about 9.4% of them (or 1.7 million) would have faced an EMTR of 50% or more. The previous section identified some characteristics that are associated with higher average EMTRs and larger shares of high EMTRs (i.e., EMTRs equal to or higher than 50%) among all workers. However, it did not denote the extent to which the specific high-EMTR population possesses those characteristics since it depends on how common these characteristics are in the overall working population. To better understand the causes of high EMTRs, this section examines the prevalence of such characteristics among the group of individuals actually facing high EMTRs.
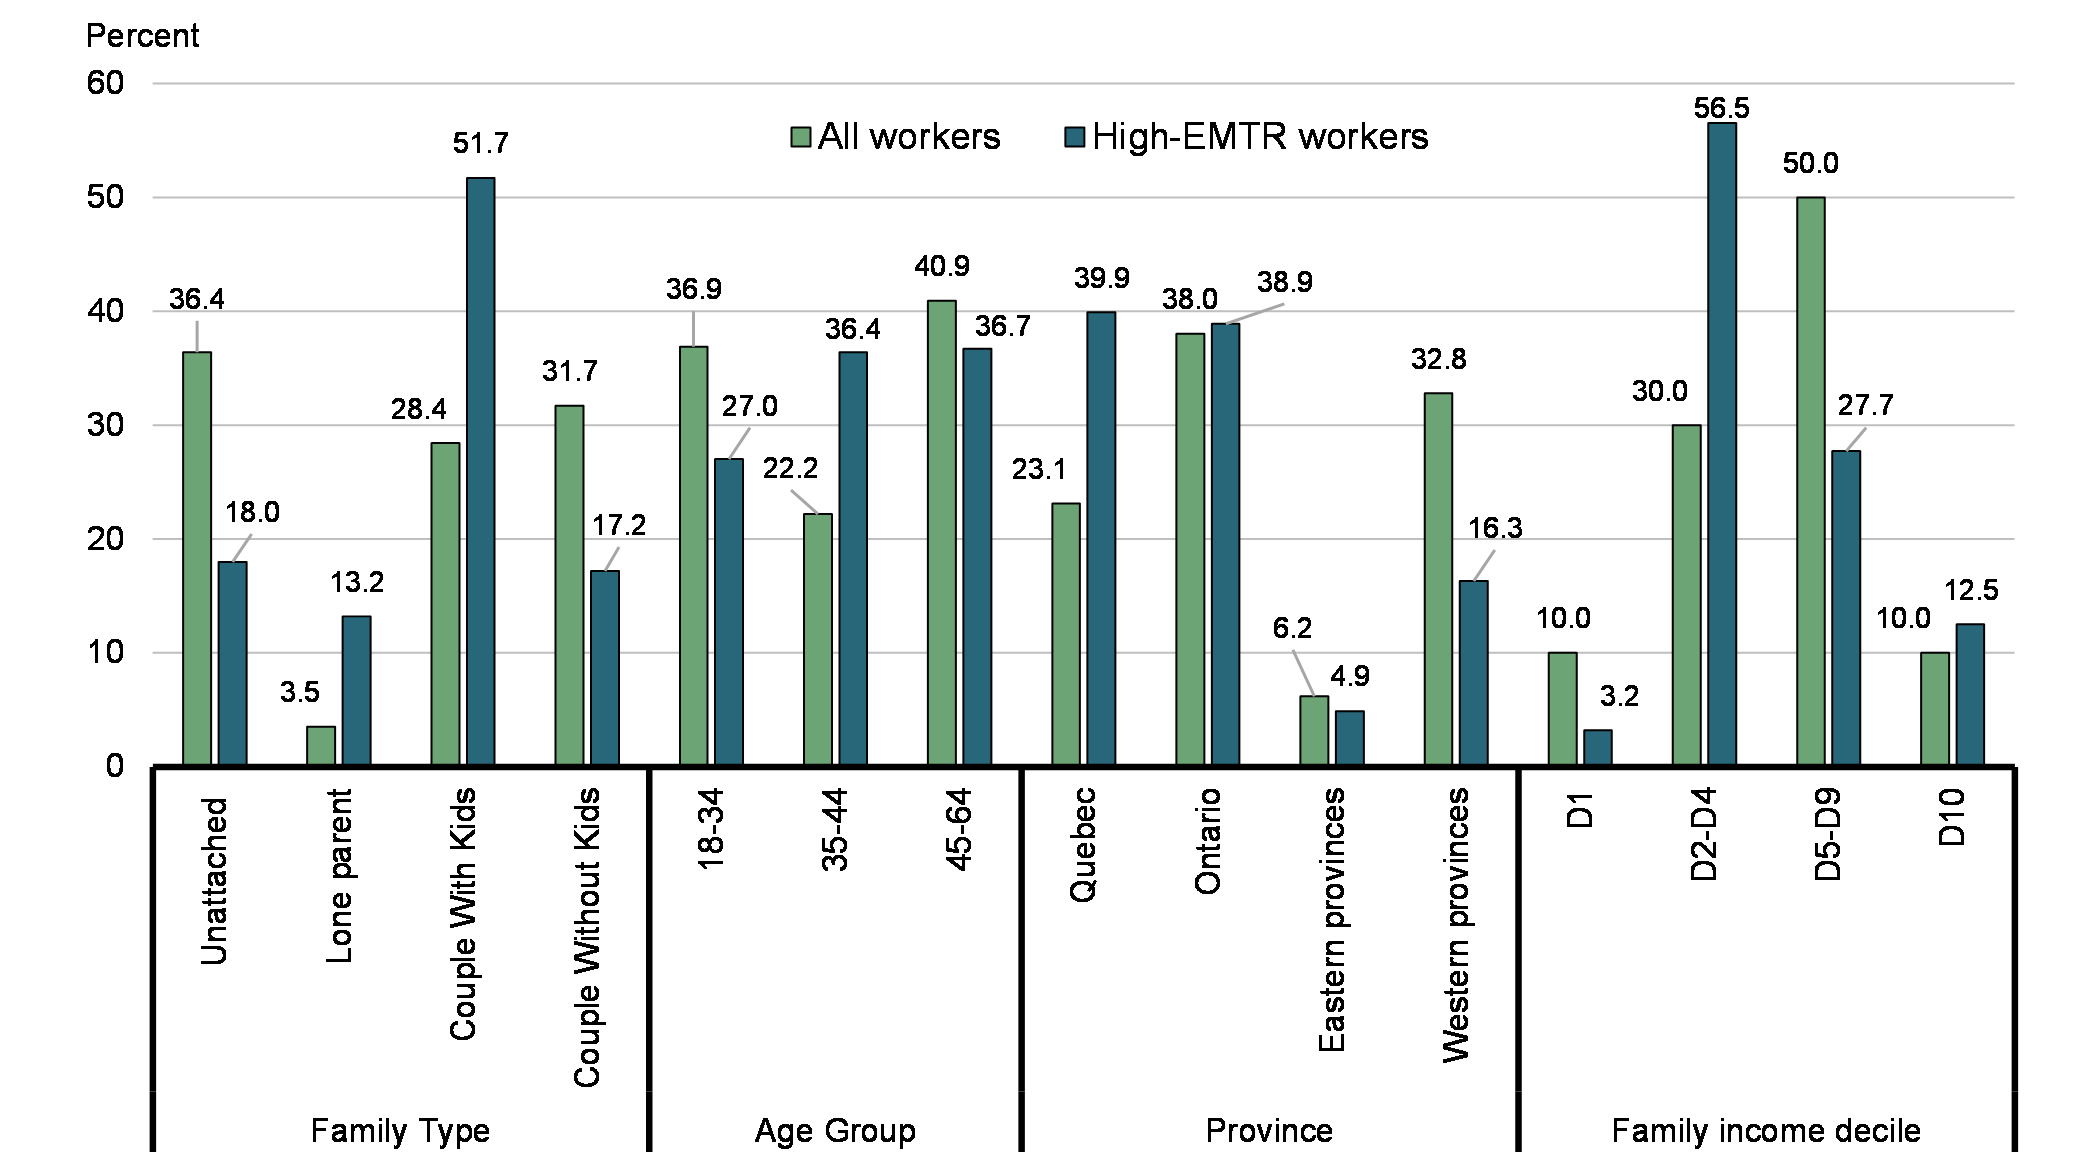
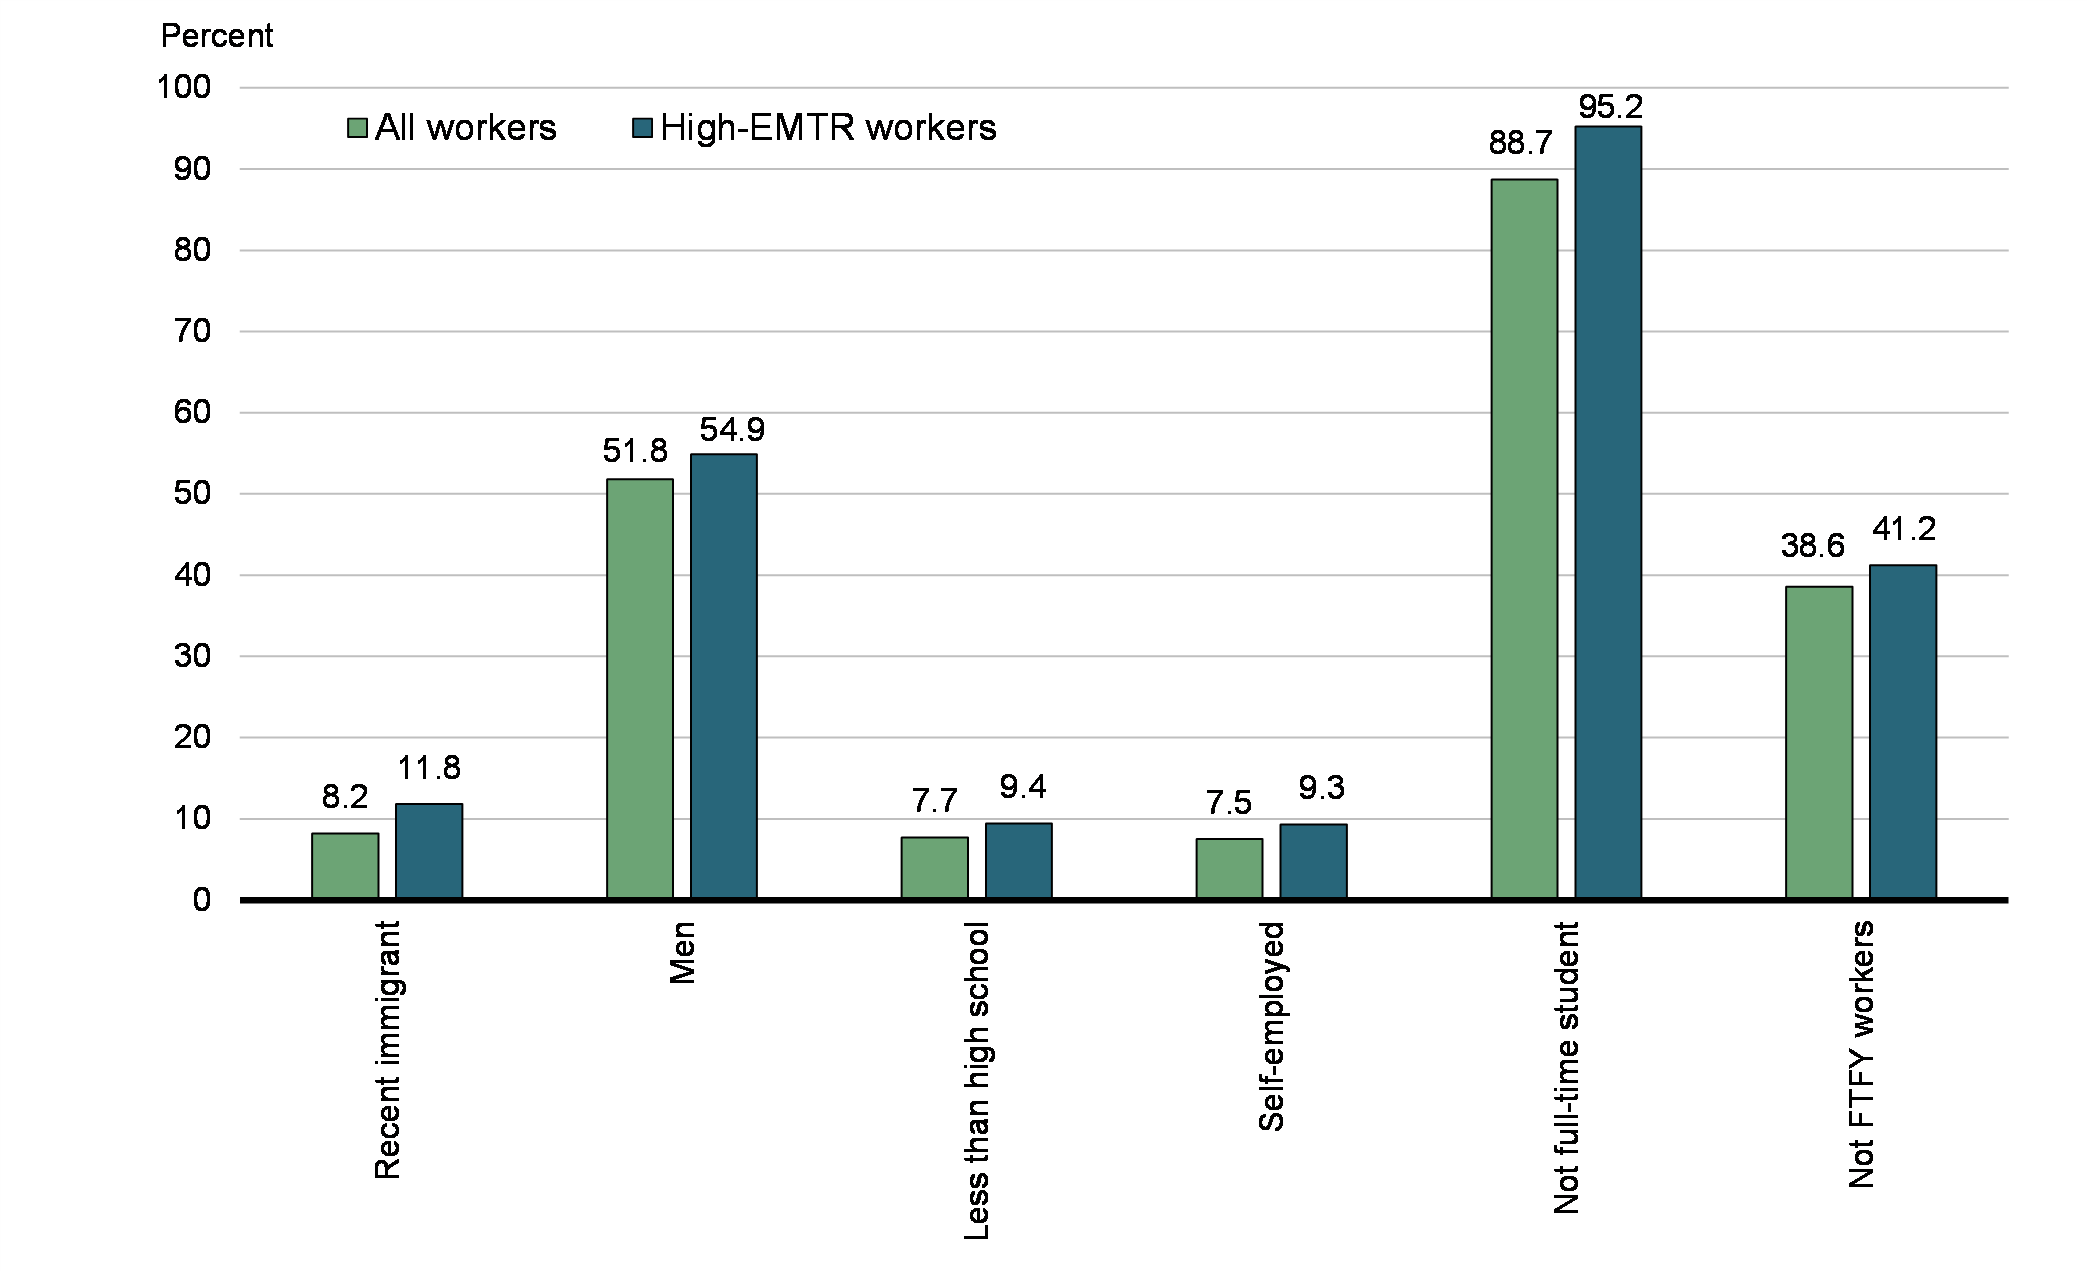
In comparison to all workers, Charts 4 and 5 show that high-EMTR individuals are more likely to be single parents or part of couples with children. They are also more likely to have an adjusted family income between $15,500 and $42,200 (deciles 2, 3 and 4) or to be in the top 10% of the income distribution (decile 10), and more likely to live in Quebec, to be aged 35 to 44 years, or to be recent immigrants. Further, the prevalence of men, individuals with less than a high school diploma, self-employed, and part-time or part-year workers is somewhat more important among this group.
Compared to all workers, workers facing high EMTRs are also less likely to have reached the maximum CPP/QPP and EI/QPIP contribution thresholds (21.9% versus 30.2%) and a much larger proportion are in receipt of transfers, both from the federal (93.4% versus 72.2% for other workers) and provincial governments (82.7% versus 52.9%). In particular, a majority received CCB (60% versus 25.7%) and GSTC amounts (55.3% versus 36.3%).
Share of individuals with specific characteristics among high-EMTR workers* in comparison to among all workers (including high-EMTR workers), 2017
Share of individuals with specific characteristics among high-EMTR workers* in comparison to among all workers (including high-EMTR workers), 2017
In theory, a better understanding of the characteristics associated with high EMTRs and which government programs are involved can guide the development of approaches to ease the burden of EMTRs and encourage additional work. However, the identification of these characteristics revealed that the majority (58.8%) of high-EMTR workers already worked full-time full-year.
According to Table 3, only 41.2% (or 733,300) of all high-EMTR individuals did not work FTFY (or 3.9% of all workers). Unattached individuals, recent immigrants, full-time students, those aged 25-34 years and/or those with less than a high-school diploma were more strongly represented among this group. Conversely, this subpopulation of high-EMTR individuals was less largely composed of men, residents of Quebec, individuals aged 35 to 44 years and/or individuals living in families with children (although families with children still represented the most common family situation among this subpopulation).
| Characteristics | All workers | High EMTRs (i.e., EMTRs of 50% or more) | |||
|---|---|---|---|---|---|
| All | Not working FTFY | 50-60% EMTRs | EMTRs of 60% or more | ||
| All 18-64 individuals (number x1,000) | 18,968 | 1,781 | 733 | 1,013 | 768 |
| Average employment income ($) | $48,700 | $67,700 | $32,900 | $99,600 | $25,600 |
| Province | |||||
| Newfoundland and Labrador | 1.3 | 1.4 | 1.7 | 1.6 | 1.1 |
| Prince Edward Island | 0.4 | 0.3 | 0.4 | 0.4 | 0.3 |
| Nova Scotia | 2.4 | 2.1 | 2.6 | 2.8 | 1.2 |
| New Brunswick | 2.0 | 1.2 | 1.3 | 1.4 | 0.9 |
| Quebec | 23.1 | 39.9 | 32.8 | 42.9 | 35.8 |
| Ontario | 38.0 | 38.9 | 37.4 | 36.8 | 41.7 |
| Manitoba | 3.4 | 2.4 | 2.9 | 3.0 | 1.7 |
| Saskatchewan | 3.0 | 1.2 | 1.7 | 1.0 | 1.5 |
| Alberta | 12.9 | 6.0 | 9.0 | 5.6 | 6.4 |
| British Columbia | 13.5 | 6.7 | 10.3 | 4.6 | 9.5 |
| Age group | |||||
| 18-24 | 13.9 | 4.4 | 6.7 | 2.6 | 6.8 |
| 25-34 | 23.0 | 22.5 | 27.2 | 19.7 | 26.3 |
| 35-44 | 22.2 | 36.4 | 29.4 | 36.9 | 35.6 |
| 45-54 | 22.0 | 21.9 | 19.5 | 24.4 | 18.7 |
| 55-64 | 18.9 | 14.8 | 17.2 | 16.4 | 12.6 |
| Gender | |||||
| Man | 51.8 | 54.9 | 48.0 | 60.8 | 47.1 |
| Woman | 48.2 | 45.1 | 52.1 | 39.2 | 52.9 |
| Immigrant status | |||||
| Not Immigrant | 75.5 | 70.4 | 67.6 | 73.5 | 66.3 |
| Recent Immigrant (< 10 yrs) | 8.2 | 11.8 | 15.5 | 9.3 | 15.1 |
| Not-Recent Immigrant | 16.4 | 17.9 | 16.9 | 17.2 | 18.7 |
| Highest education | |||||
| Less than High School (HS) | 7.7 | 9.4 | 13.1 | 7.8 | 11.5 |
| HS | 27.2 | 22.0 | 25.2 | 19.3 | 25.5 |
| More than HS | 32.7 | 35.7 | 34.5 | 36.1 | 35.2 |
| University Degree | 32.5 | 33.0 | 27.1 | 36.9 | 27.8 |
| Student status | |||||
| Not Student | 85.0 | 91.7 | 85.2 | 93.0 | 90.0 |
| Full-Time Student | 11.3 | 4.8 | 10.3 | 3.8 | 6.1 |
| Part-Time Student | 3.7 | 3.5 | 4.5 | 3.3 | 3.9 |
| Intensity of work | |||||
| Part-Year Worker | 29.9 | 31.9 | 77.5 | 26.0 | 39.7 |
| Part-Time, Full-Year, Worker | 8.7 | 9.3 | 22.5 | 6.0 | 13.6 |
| Full-Time, Full-Year Worker | 61.4 | 58.8 | 0.0 | 68.0 | 46.7 |
| Family circumstances | |||||
| Unattached | 36.4 | 18.0 | 25.6 | 13.0 | 24.5 |
| Lone parent | 3.5 | 13.2 | 11.3 | 11.7 | 15.2 |
| Couple With Kids | 28.4 | 51.7 | 42.0 | 56.9 | 44.7 |
| Couple Without Kids | 31.7 | 17.2 | 21.1 | 18.3 | 15.6 |
| Group of actual personal total income | |||||
| Below the 2017 BPA ($11,635) | 9.7 | 4.5 | 8.4 | 3.2 | 6.2 |
| Between $11,635 and $45,916 (15% PIT rate) | 42.8 | 45.2 | 63.7 | 31.7 | 63.0 |
| Between $45,916 and $91,831 (20.5% PIT rate) | 33.6 | 30.8 | 20.4 | 32.8 | 28.3 |
| Between $91,831 and $142,353 (26.0% PIT rate) | 9.8 | 6.4 | 2.5 | 9.8 | 1.9 |
| Between $142,353 and $202,800 (29.0% PIT rate) | 2.4 | 3.5 | 1.4 | 5.8 | 0.3 |
| Above $202,800 (33.0% PIT rate) | 1.7 | 9.7 | 3.7 | 16.8 | 0.3 |
| Topped up max. CPP/QPP and EI/QPIP contributions (Yes) | 30.2 | 21.9 | 8.8 | 33.7 | 6.4 |
| Received any benefit from federal transfers (Yes) | 74.2 | 93.4 | 97.6 | 89.9 | 98.1 |
| Received any benefit from provincial transfers (Yes) | 55.7 | 82.7 | 90.9 | 70.9 | 98.1 |
| CCB receipt (Yes) | 28.9 | 60.0 | 51.9 | 60.5 | 59.5 |
| GSTC receipt (Yes) | 38.1 | 55.3 | 69.4 | 37.8 | 78.4 |
| WITB receipt (Yes) | 11.0 | 11.6 | 19.5 | 6.7 | 18.1 |
| EI receipt (Yes) | 17.6 | 24.0 | 37.2 | 22.1 | 26.6 |
| SA receipt (Yes) | 5.3 | 25.2 | 44.5 | 7.1 | 49.1 |
| Adjusted family income decile | |||||
| D1 ($15,537 or less) | 10.0 | 3.2 | 7.0 | 1.5 | 5.6 |
| D2-D4 ($15,538 to $42,193) | 30.0 | 56.5 | 68.3 | 42.1 | 75.5 |
| D5-D9 ($42,194 to $114,569) | 50.0 | 27.7 | 19.1 | 35.8 | 17.1 |
| D10 ($114,569 or more) | 10.0 | 12.5 | 5.6 | 20.6 | 1.9 |
| Note: In table 3, "total income" refers to the sum of all market income and transfer income, not to total income for tax purposes. This approach, combined with the focus on workers aged 18 to 64 years, explains why a smaller than usual proportion of individuals is found in the first tax bracket. Source: Author's calculations using Statistics Canada's SPSD/M, v. 27.0. |
|||||
In comparison to all high-EMTR workers, those who did not work FTFY were more highly concentrated in the bottom 4 deciles (75% versus 60% among all high-EMTR and 40% among all workers) and were more likely to make use of government transfers, either federal or provincial transfers. They were especially likely to have received employment insurance (EI), WITB, GSTC and SA payments. As Table 4 shows, if all individuals in this specific high-EMTR subpopulation had increased their earnings by $1,000, they would have retained only $297 on average of this additional $1,000, mainly due to reductions in transfer amounts. While the loss in provincial transfers is considerably more important than that in federal transfers, among all federal transfers, it is the reduction in CCB that would have played the most important role in offsetting additional earnings.
| High EMTRs (i.e., EMTRs of 50% or more) | ||||||
|---|---|---|---|---|---|---|
| Average changes in $ | All workers | EMTRs below 50% | All | Not working FTFY | 50-60% EMTRs | EMTRs of 60% or more |
| Average EMTR (%) | 34.1% | 30.9% | 64.5% | 70.2% | 53.8% | 78.7% |
| Federal PIT | -146 | -144 | -158 | -121 | -193 | -113 |
| Provincial PIT | -99 | -96 | -130 | -87 | -156 | -96 |
| Federal transfers | -23 | -16 | -90 | -82 | -80 | -104 |
WITB |
-2 | -1 | -8 | -9 | -6 | -11 |
CCB |
-17 | -13 | -58 | -49 | -55 | -63 |
GSTC |
-3 | -2 | -13 | -11 | -10 | -17 |
Others |
-2 | -1 | -11 | -13 | -9 | -14 |
| Provincial transfers | -28 | -9 | -210 | -343 | -61 | -406 |
SA |
-16 | -1 | -153 | -290 | -23 | -324 |
Others |
-12 | -7 | -57 | -52 | -38 | -82 |
| Combined payroll taxes | -45 | -44 | -58 | -70 | -48 | -70 |
| Total | -341 | -309 | -646 | -703 | -538 | -789 |
| Note: Results may not always add up due to rounding. Source: Author's calculations using Statistics Canada's SPSD/M, v. 27.0. |
||||||
A closer look at the characteristics of high-EMTR individuals revealed two distinct types of profiles. The first type is the profile of workers for whom EMTRs fall between 50% and 60% (Tables 3 and 4, second last column). These represented 56.9% of the high-EMTR population. This 50-60% EMTR group had an average personal employment income about four times higher than that of other high-EMTR workers ($99,600 versus $25,600). Their total income was also significantly more likely to fall in the highest federal PIT bracket (33%). They were also less likely to be social assistance recipients, recent immigrants and students, but more likely to be men and full-time workers. For this high-EMTR group, 65% of the income loss generated by the application of tax and transfer systems is the result of additional taxes payable on earnings (Table 4). The second type is made of the remaining 43.1% workers facing EMTRs of 60% or more (Tables 3 and 4, last column). In comparison, this type comprises a very large share of social assistance recipients (about 50%) and has a family income that is much lower on average. More than 80% of this group had an adjusted family income in the first four deciles (i.e., below $42,193), while among the 50-60% EMTR group, this proportion was just above 40%. It should also be noted that, while this last high-EMTR group included a non-negligible proportion of FTFY workers (47%), its profile was more similar to that of the previously-described subpopulation of high-EMTR workers who did not work FTFY than that of the 50-60% EMTR group.
7. Conclusion
EMTRs are useful concepts since they provide indications on the extent to which incentives to increase the intensity of work are reduced by the tax and transfer systems. For individuals and families, the anticipation of not being much better-off or even being worse-off after an increase in earnings may represent a disincentive for taking on extra work. Hence, a large share of the population facing high EMTRs may represent an impediment to the success of policies aimed at increasing labour supply at the intensive margin.
Using actual survey data, this study estimates that the 19 million Canadian workers aged 18 to 64 in 2017 faced an average EMTR of 34.1%, implying that $341 of an extra $1,000 in earnings would have been offset by additional taxes or lost benefits. The distribution of EMTRs indicates that a large majority of Canadian workers would have retained a large share of their additional earnings. Around 9.4% of them (or 1.7 million) would have faced an EMTR of 50% or more, implying that they would have retained less than half of any additional labour income. Of these 1.7 million high-EMTR workers, close to 1 million (58.8%) already worked FTFY.
An examination of the characteristics associated with high EMTRs suggests that there is no single profile of high-EMTR workers. However, two groups stand out among them. The first is made of individuals facing EMTRs in the 50-60% range and for whom PIT systems largely explain their high EMTRs. The second group is made of individuals facing EMTRs above 60% and for whom the impact of government transfers phase out is more significant, especially the impact of social assistance claw backs, which considerably reduce the gains from additional earnings.
Among federal transfers, the CCB contributes the most to offsetting the benefits of earning more for high-EMTR workers. The CCB impact is, however, not as important as the offsetting impacts of the federal PIT system and payroll deductions.
It is important to stress that the changing economic environment and recent tax policy measures introduced since 2017, in particular in response to the pandemic, may have impacted the distribution of EMTRs among working-age Canadians.
Annex A: Methodology
A.1 Definition of Effective Marginal Tax Rates (EMTRs)
EMTRs on labour income refer to the financial penalty in terms of lost benefits and increased taxes and social contributions that are encountered by working individuals who are receiving additional earnings (through extra work hours or increase in wages). Arithmetically, EMTRs on labour income can be derived for each individual using the following formula:
Ratei = 1 - [Increase in disposable incomef / increase in labour incomei],
where subscripts i and f denote respectively to the individual receiving labour income increment and to the familyFootnote 7 of this individual.
In general, EMTRs fall between 0 and 100%. However, they can be above 100% when the total disposable income loss exceeds the total labour income gain. They can also be below 0% when the total disposable income improvement exceeds the total labour income gain. A high EMTR means that a high percentage of the individual's labour income gain is offset by lost tax and transfer benefits for his or her family. A low EMTR means that the individual's family retains a high percentage of his or her labour income gain after the application of the tax and transfer system.
In Canada, the distribution of EMTRs depends on multiple factors, including the various provisions of the federal and provincial tax systems (e.g., statutory income tax rates, deductions and credits) and the various government income transfers paid to eligible individuals or families. It is also the result of payroll taxes on earnings that workers have to pay to finance the Canada Pension Plan (CPP) or the Quebec Pension Plan (QPP) as well as the Employment-Insurance (EI) and the Quebec parental insurance plan (QPIP) programs.Footnote 8 EMTRs can be hard to predict for individuals. Two individuals with similar levels of personal income may face considerably different EMTRs depending on their income situation, personal characteristics and/or family circumstances. Personal income taxes, payroll taxes and government assistance (through tax expenditures and government transfers) vary considerably based on personal and/or family income, and may only be available to individuals with specific characteristics (e.g., seniors, those with children, those who are working). Also, an increase in labour income for one individual in a couple could impact the income of both spouses, since some federal and provincial benefits are based on family income. Therefore, the estimation of EMTRs for individuals requires considering the change in their family disposable income that may result from a change in their personal labour income. It is worth noting that the change in family disposable income may differ depending on which spouse receives the labour income increment in the family (e.g., the impact may differ depending on where the income of the individual receiving the labour income increment falls in the tax rate structure, and on whether the individual has already topped up maximum annual CPP/QPP contributions and EI/QPIP premiums).
When EMTRs are calculated for each individual in a given population, they can be aggregated to represent the actual distribution of EMTRs in the economy, and to better understand the characteristics of the groups facing high EMTRs.
A.2 Data Source and Methodology
To derive individuals' EMTRs, this project uses the "Marginal Tax Rate" facility of Statistics Canada's Social Policy Simulation Database/Model (SPSD/M) version 27.0 for the 2017 tax year. This facility can simulate the impact on income after taxes, transfers and payroll deductions of an increase in employment income for each individual of interest.
Given that SPSD/M only produces EMTRs when the sources of income incremented are SPSD/M base income variables, total employment income could not be incremented at once. Paid-employment income and self-employment income had to be incremented separately. Further, while social assistance income is included in SPSD/M data, this source of income does not affect the calculation of SPSD/M's EMTRs, meaning that increasing labour income does not decrease social assistance. Hence, using the SPSD/M facility underestimates the real EMTRs values for social assistance recipients. For more accurate estimates for this group, some adjustments to social assistance amounts were needed before estimating EMTRs.Footnote 9
References
Alexandre Laurin (January 2018), "Two-Parent Families with Children: How Effective Tax Rates Affect Work Decisions", E-Brief, C.D. HOWE Institute.
Office of the Assistance Secretary for Planning & Evaluation – U.S. Department of Health and Human Services, Suzanne Macartney and Nina Chien (March 2019), "Marginal Tax Rates: A Quick Overview", Brief#1 in ASPE Marginal Tax Rate Series.
Office of the Assistance Secretary for Planning & Evaluation – U.S. Department of Health and Human Services, Suzanne Macartney and Nina Chien (March 2019), "What Happens when People Increase their Earnings? Effective Marginal Tax Rates for Low-Income Households", Brief#2 in ASPE Marginal Tax Rate Series.
Office of the Assistance Secretary for Planning & Evaluation – U.S. Department of Health and Human Services, Linda Giannarell, Kye Lippold, Elaine Maag, C. Eugene Steuerle, Nina Chien and Suzanne Macartney (March 2019), "Estimating Marginal Tax Rates Using a Microsimulation Model: Technical Appendix", Brief#5 in ASPE Marginal Tax Rate Series.
Statistics Canada (December 2018), "User's Guide", Social Policy Simulation
Database/Model (SPSD/M) Version 27.0, Catalogue no. 89F0002X.
Statistics Canada (December 2018), "Variable Guide", Social Policy Simulation Database/Model (SPSD/M) Version 27.0, Catalogue no. 89F0002X.