
Archived -Report on Federal Tax Expenditures - Concepts, Estimates and Evaluations 2022: part 11
Evaluation of Wage Subsidy ProgramsFootnote 1
1. Introduction
At the onset of the COVID-19 pandemic, the federal government introduced the Temporary Wage Subsidy (TWS), designed to encourage employers to keep employees on their payrolls. Shortly thereafter, the Canada Emergency Wage Subsidy (CEWS) was introduced, with similar objectives. These programs were developed in an emergency context under exceptionally short timeframes and have been modified over time as the pandemic has evolved.
This paper presents an evaluation of the TWS and the CEWS, as recommended in recent reports by the Office of the Auditor GeneralFootnote 2 and the House of Commons Standing Committee on Public Accounts (PACP).Footnote 3
The evaluation begins by providing background information on the programs, including the emergency context in which they were developed and delivered, their policy intents, and their evolution over time. This is followed by an evaluation of the programs on the basis of relevance, effectiveness, equity and efficiency.
2. Background Information
2.1 Health and Economic Context
The COVID-19 pandemic was unprecedented in terms of the rapidity, depth and scope of its health, societal, and economic impacts. In early March 2020, as an exponential rise in cases was reported, governments across Canada took wide-ranging steps to mitigate and contain the spread of COVID-19. Restrictive public health containment measures were implemented, including school and business closures, cancelation of mass gatherings, travel restrictions and stay-at-home policies, which resulted in drastic impacts on the Canadian economy. Gross domestic product (GDP) contracted by almost 11% in the second quarter of 2020 compared to the first, with precipitous drops also observed in household final consumption (-14%), business investment ( 15%), imports (-23%) and exports (-11%).Footnote 4 It was the largest and most sudden economic contraction since the Great Depression.
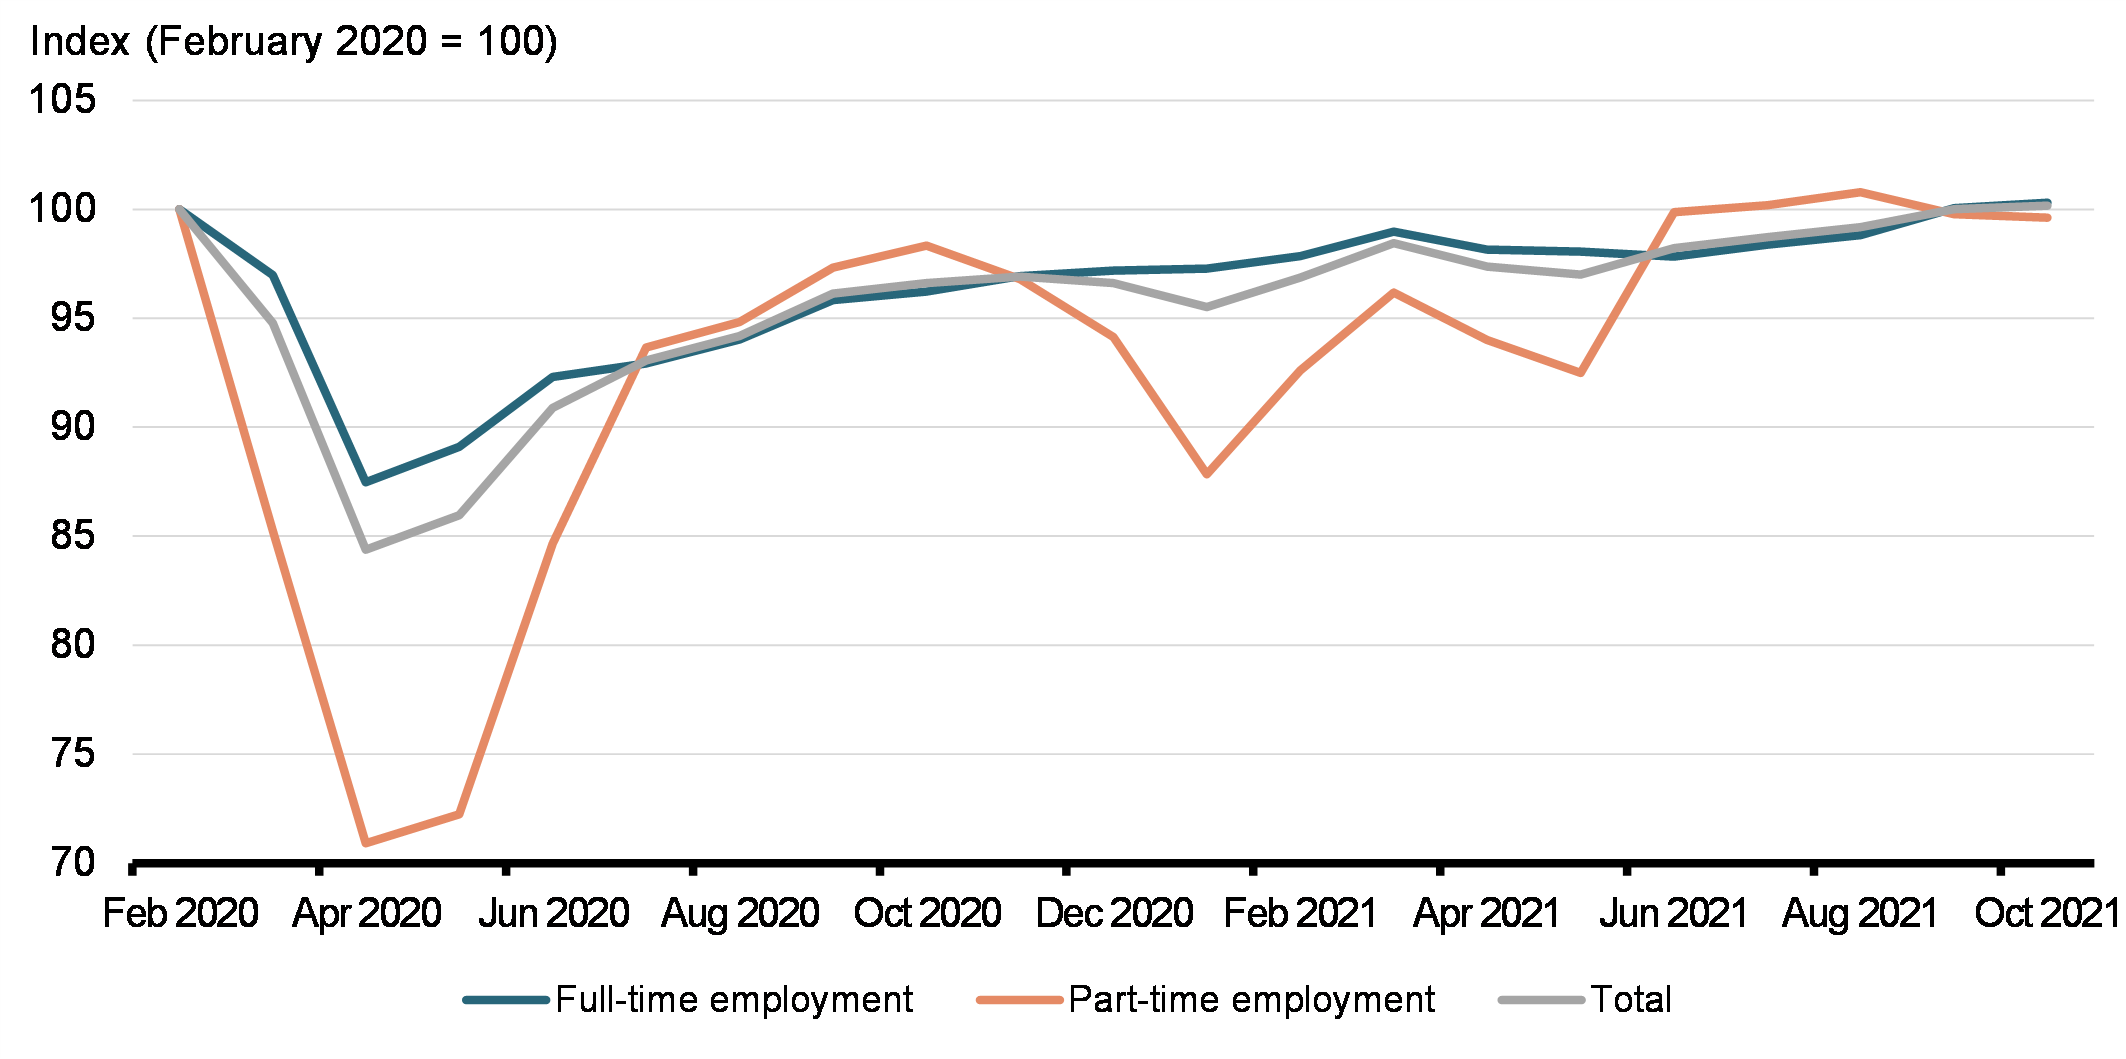
Over March and April 2020, 5.5 million Canadians (about 30% of the workforce) either lost their jobs or saw their hours significantly scaled back, and the employment rate fell to its lowest level on record.Footnote 5 Business closures nearly tripled in April 2020 compared to February 2020,Footnote 6 with full-time employment declining by 16%, and part-time employment falling by 29% (Chart 1). By May 2020, employment among salaried workers had fallen by 8%, while for hourly-paid employees the contraction was 25%.Footnote 7
Total, Full-Time, and Part-Time Employment, February 2020 to October 2021
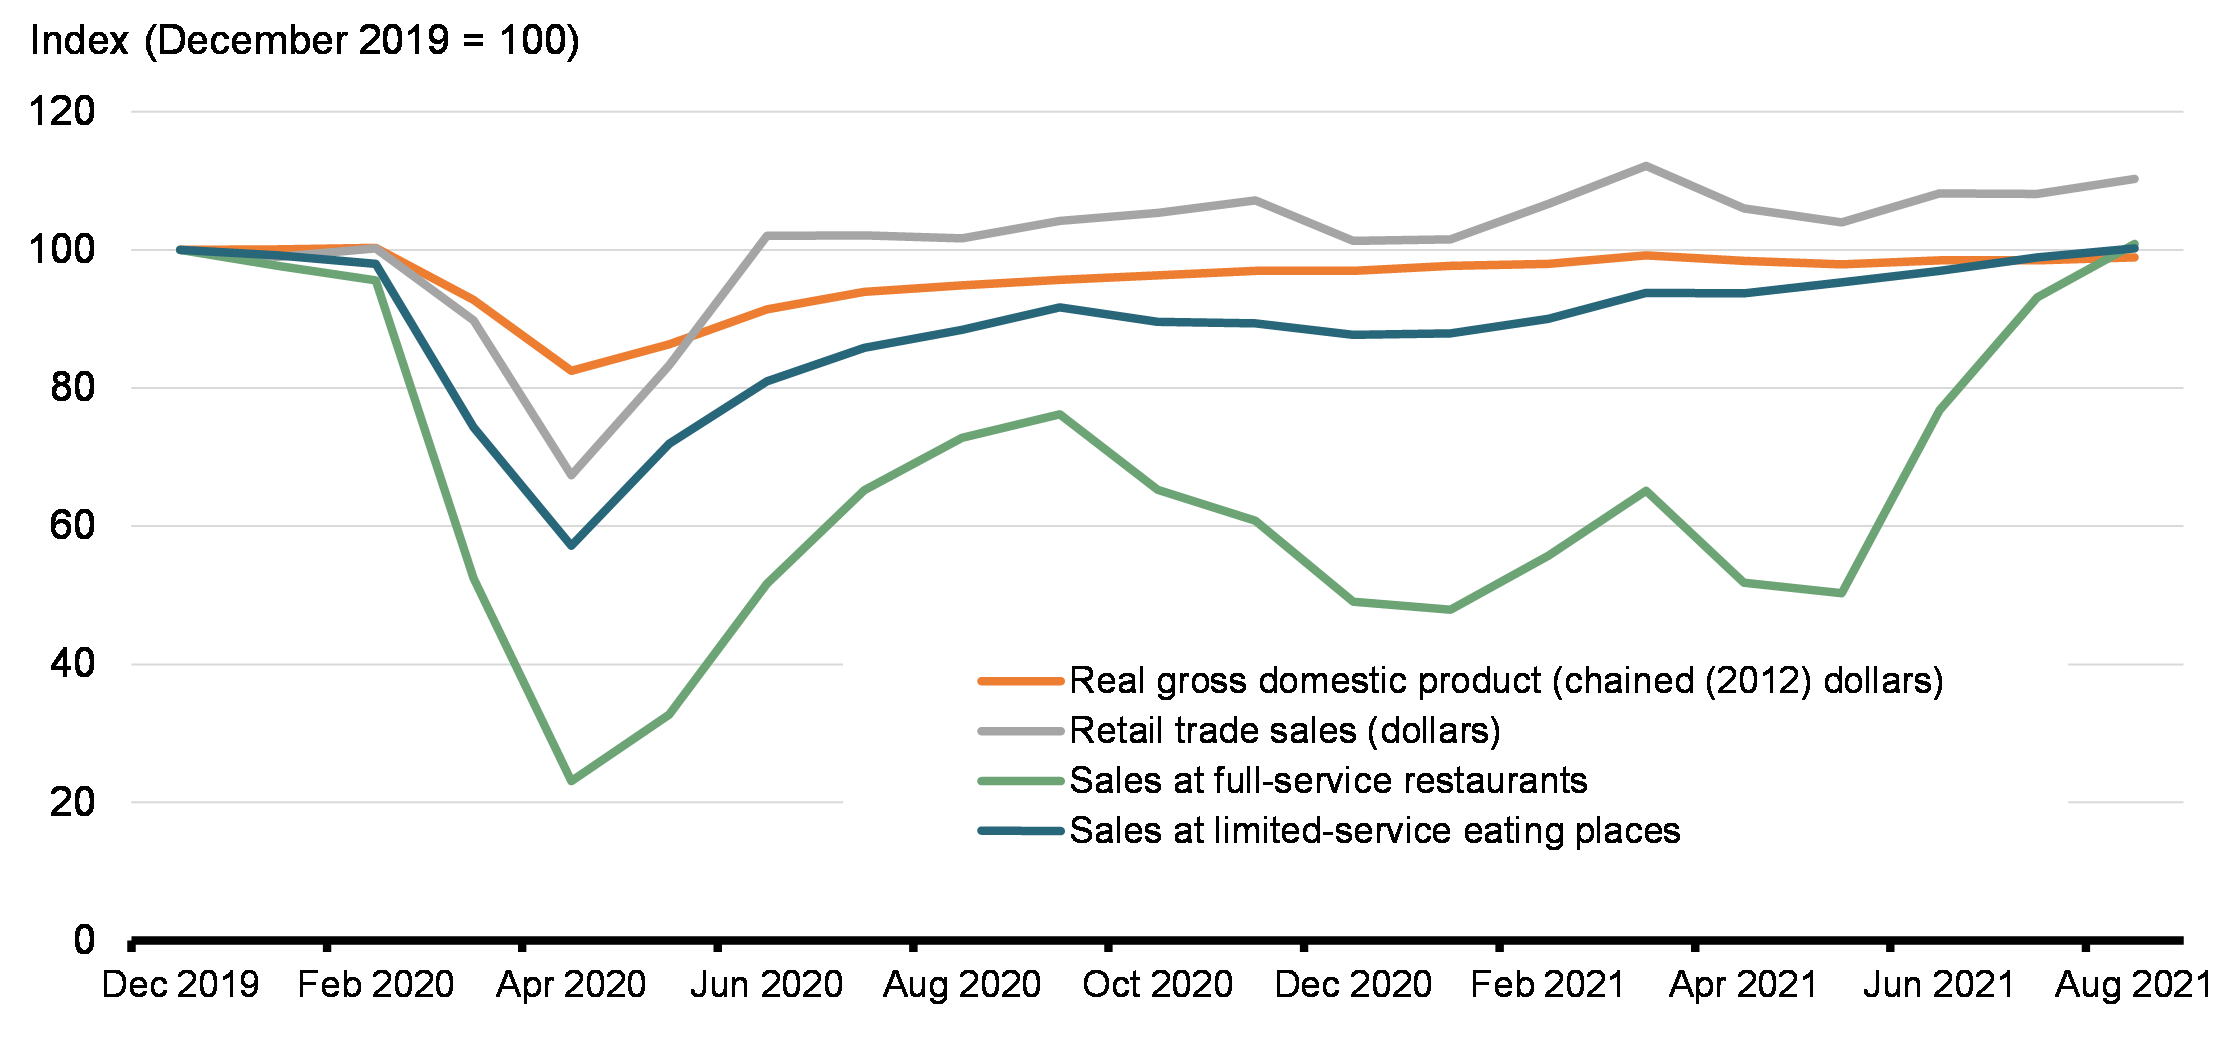
The most significant impacts were concentrated in the service sector, particularly in areas affected by the closure of non-essential activities, and where physical distancing and alternative work arrangements are more difficult or not possible, such as restaurants (Chart 2). Women experienced a slightly larger reduction in hours worked and lost their jobs earlier than men, reflecting their greater share of employment in some of the hardest-hit service industries. Differentiated sectoral impacts meant that low-wage workers, youth and very recent immigrants faced more significant job losses and reductions in hours worked.Footnote 8
Indexes of Economic Activity Demonstrate the Impacts of COVID-19 on Different Segments of the Canadian Economy
In order to stabilize the economy, the federal government implemented rapid and broad-based emergency support measures aimed at protecting the health of Canadians and supplementing the existing safety net that supports families, workers and businesses across the country. Substantial support was provided by replacing lost income and avoiding even higher unemployment. It was in this context that the TWS and CEWS were first introduced.
2.2 Introduction of the Temporary Wage Subsidy
At the onset of the pandemic, on March 18, 2020, the Government announced the TWS to support employment. This was a three-month measure that allowed eligible employers to reduce the amount of payroll deductions required to be remitted to the Canada Revenue Agency (CRA).Footnote 9 This mechanism provided immediate access to Government support, without the need to put in place a new government program, which was an important objective in the context of a crisis. The subsidy was equal to 10% of the remuneration paid from March 18 to June 19, 2020, up to $1,375 for each eligible employee and to a maximum of $25,000 total per employer. The cost of this measure is estimated to be $1.3 billion for subsidies provided for the period between March 18 and June 19, 2020.
The TWS was designed to support small- and medium-sized employers and prevent layoffs. To be eligible, employers must: i) have had a payroll program account with the CRA as of March 18, 2020; ii) have paid salary, wages, bonuses or other remuneration to an eligible employee employed in Canada; and iii) have been classified as an individual, partnership, non-profit organization, registered charity or a Canadian-controlled private corporation with taxable capital in the previous taxation year (or at the start of the subsidy period where it is their first taxation year) below $15 million. An application for the subsidy was not necessary; employers were able to calculate their subsidy and reduce the federal, provincial and territorial income tax portion of payroll remittances by the amount of the subsidy. Eligible employers were then required to submit a self-identification form to the CRA for the subsidy amount they claimed.
The TWS was introduced swiftly at the onset of the pandemic. As the pandemic evolved, it became quickly apparent that the health crisis would last longer than initially anticipated and require a stronger government response. This sentiment was echoed by many stakeholders and ultimately led to the creation of the CEWS. The TWS and the CEWS coexisted until June 19, 2020. The TWS continued to provide timely support to employers, including employers not eligible for the CEWS.
2.3 Introduction of the Canada Emergency Wage Subsidy
On March 27, 2020, the Government announced the creation of the CEWS to provide further support to affected businesses. Its objective was to prevent further job losses by encouraging employers to keep employees on the payroll and enable them to rehire workers who were laid off as a result of the pandemic. As with the TWS, this measure was intended to preserve the employer-employee relationship, thus helping employers to resume normal operations as pandemic restrictions were lifted and prevent disruption and uncertainty for employees.
The CEWS was initially put in place for the period from March 15 to June 6, 2020, and available to eligible employers experiencing a minimum decline in revenue of 15% in March, 2020, or a minimum 30% decline in revenue in April, May, or June of 2020. The subsidy was available for both active and furloughed employees (i.e., employees on leave with pay). Eligibility requirements, described further below, were established, including rules for calculating revenue declines. In contrast to the TWS, which mainly focused on small- and medium-sized businesses, the CEWS was made available to a broader range of employers.
The subsidy amount for a given employee on eligible remuneration paid in respect of the period between March 15 and June 6, 2020 was the greater of:
- 75% of remuneration paid, up to a maximum of $847 per week; and,
- The amount of remuneration paid, up to a maximum of $847 per week or 75% of the employee's pre-crisis weekly remuneration,Footnote 10 whichever is less.
In effect, this meant that employers could have been eligible for a subsidy of up to 100% in cases where the eligible remuneration was equal to or less than 75% of the baseline remuneration for an eligible employee.
Employers were also entitled to a 100% refund for employer-paid contributions to Employment Insurance, the Canada Pension Plan, the Quebec Pension Plan, and the Quebec Parental Insurance Plan for eligible employees for each week throughout which those employees were on leave with pay and for which the employer is eligible to claim the CEWS for those employees.
Employers were required to apply for the subsidy through a web-based application on the CRA website for each four-week claim period. Employers were initially required to apply by October 2020 for the subsidy. This deadline was subsequently modified as the program evolved, to the later of February 1, 2021 and 180 days after the end of a claim period. Employers that qualified for both the TWS and CEWS were able to claim both subsidies, but were required to reduce their CEWS claim by the amount claimed under the TWS.
2.4 Evolution of the CEWS
Since its introduction, the CEWS has undergone modifications in order to respond to the evolving health and economic situation, as well as stakeholder concerns. The major extensions and modifications to program parameters are summarized below:
- On May 15, 2020, the Government extended the CEWS for an additional 12 weeks (from June 7 to August 29, 2020) and to a broader range of employers. At this point, the Government also signaled its intention to consult with business and labour representatives and other stakeholders on potential adjustments to the program to maximize employment and better ensure the CEWS reflected the immediate needs of businesses and supported the economic recovery.
- In July 2020, the Government announced another extension until December 19, 2020 and introduced a new rate structure for active employees as of July 5, 2020, based on feedback from consultations. The new rate structure was comprised of a base subsidy available to all eligible employers, and a 25% top-up for employers experiencing a decline in revenues of more than 50%.Footnote 11 The base subsidy was available to all employers experiencing a decline in revenues, with the subsidy amount varying depending on the scale of revenue decline. This new approach was designed to address concerns that the 30% revenue drop threshold was too stringent and was creating a "cliff effect."
- For active arm's-length employees, the amount of remuneration was also now based solely on actual remuneration paid for the eligibility period at hand, without reference to the pre-crisis remuneration concept used for earlier CEWS periods. However, the wage subsidy for active non-arm's-length employees was based on the employee's weekly eligible remuneration or pre-crisis remuneration, whichever is less, up to a maximum of $1,129. The CEWS support for furloughed employees was also adjusted to align with the benefits provided under the Canada Emergency Response Benefit and/or Employment Insurance system as of August 30, 2020.
- In October 2020 it was announced that the CEWS would be extended until June 2021 and the maximum subsidy rate would be 65% until December 19, 2020. Shortly thereafter, the Fall Economic Statement announced the maximum subsidy rates would be increased to 75% from December 20, 2020 to March 13, 2021 given the expected economic impact of a second wave. The subsidy rates remained unchanged from March 14, 2021 to June 5, 2021.
- Budget 2021 extended the program until September 25, 2021, with gradually declining subsidy rates, beginning 4 July 2021, in order to ensure an orderly phase-out of the program as vaccinations progressed and the economy was reopening. On July 30, the program was further extended until October 23, 2021 and the maximum subsidy rate was increased from 20% to 40% for the period between August 29 and September 25, 2021, in recognition of the uneven recovery and need for continued support in the context of a fourth wave.
- The broad-based CEWS program ended on October 23, 2021 and was replaced with three new targeted programs: the Tourism and Hospitality Recovery Program, Hardest-hit Business Recovery Program and Local Lockdown Program.
- To better support Canadians in the face of the Omicron variant, on December 22, 2021, the government proposed to temporarily expand eligibility for the Local Lockdown Program to include employers that are subject to capacity-limiting restrictions of 50% or more, in addition to those subject to full lockdowns as per the previous rules. The government also proposed to lower the current-month revenue decline requirement from 40% to 25%.
Additional program details are provided in Annex 1. As published in the 2021 Economic and Fiscal Update, the cost of the program is estimated to be $100.5 billion from March 15, 2020 to October 23, 2021.
2.5 Data Sources
This analysis relies primarily on administrative information and data collected from CEWS and TWS claims. As mentioned above, the application period for CEWS closes 180 days after the end of a period, so that as of the time of writing, complete data on program spending were only available up to Period 15 (ending May 8, 2021) inclusively.
Where applicable, data from forms PD7A — Statement of account for current source deductions is also used to complement the data from CEWS claims. These PD7A forms accompany the remittances that are submitted to the CRA by employers who are required to collect and remit Canada Pension Plan contributions, Employment Insurance premiums and income tax deductions on behalf of their employees each pay period. Data from 2019 corporate income tax returns is also used to identify and obtain supplemental information from employers that have claimed CEWS and who are corporations and partnerships.
Finally, data from Statistics Canada is used to provide additional context by industry in certain instances. In particular, the 2019 Labour Force Survey is useful to provide relevant information about labour force characteristics, and the 2021 Canadian Survey of Business Conditions is used to examine the impacts of the COVID-19 pandemic on employers.
2.6 Overview of Completed TWS Claims to Date
As described, employers were able to access TWS support from March 18 to June 19, 2020 and to confirm to the CRA that they had withheld remittances using self-declaration forms that became available in July 2020.
Table 1 provides an overview of the scale of the program, based on employers who had completed their self-declaration forms at the time of writing and the total value of withheld remittances. The available data do not allow for a precise count of employees who received any support, but based on the size of the program it is equivalent to 1.88 million employees receiving full support of $1,375.Footnote 12
| Total payout ($B) | Unique applicants | Total estimated number of employees fully supported |
|---|---|---|
| 1.3 | 264,000 | 1,880,000 |
| Notes: The estimated number of employees fully supported was calculated by dividing total TWS claimed by the TWS limit of $1,375 per employee. In practice, not all employees whose wages were subsidized would have received the full TWS limit of $1,375 due to: the limit being below 10% of their pay for the period, eligible employees not being on payrolls for the full TWS period, or employers opting not to claim TWS after CEWS became available. The actual number of employees who received some wage support is therefore likely higher. | ||
2.7 Overview of Completed CEWS Claims to Date
At the time of writing, the CEWS periods between March 15, 2020 and May 8, 2021 were closed for applications. Table 2 provides an overview of the scale of the program over this period.
| Total payout ($B) | Unique applicants | Average number of employees supported in a single period |
|---|---|---|
| 87.1 | 442,000 | 4,432,000 |
| Period | Dates | Total payout ($m) | Number of employers supported | Number of employees supported | Average payout per employee ($) | Average revenue decline (%) |
|---|---|---|---|---|---|---|
| 1 | April 12 to May 9, 2020 | 7,590 | 258,000 | 3,654,000 | 2,077 | N/A |
| 2 | May 10 to June 6, 2020 | 9,380 | 298,000 | 3,981,000 | 2,359 | N/A |
| 3 | June 7 to July 4, 2020 | 10,087 | 301,000 | 4,313,000 | 2,339 | N/A |
| 4 | July 5 to August 1, 2020 | 9,376 | 276,000 | 4,118,000 | 2,277 | N/A |
| 5 | August 2 to August 29, 2020 | 8,703 | 290,000 | 5,246,000 | 1,659 | 40 |
| 6 | August 30 to September 26, 2020 | 8,073 | 289,000 | 5,333,000 | 1,514 | 38 |
| 7 | September 27 to October 24, 2020 | 5,017 | 277,000 | 5,229,000 | 959 | 35 |
| 8 | October 25 to November 21, 2020 | 3,865 | 268,000 | 4,982,000 | 776 | 36 |
| 9 | November 22 to December 19, 2020 | 3,739 | 259,000 | 4,786,000 | 781 | 37 |
| 10 | December 20 to January 16, 2021 | 3,685 | 250,000 | 4,698,000 | 784 | 38 |
| 11 | January 17 to February 13, 2021 | 3,463 | 235,000 | 4,272,000 | 811 | 38 |
| 12 | February 14 to March 13, 2021 | 3,737 | 236,000 | 4,203,000 | 889 | 42 |
| 13 | March 14 to April 10, 2021 | 3,810 | 233,000 | 4,289,000 | 886 | 39 |
| 14 | April 11 to May 8, 2021 | 3,476 | 219,000 | 4,033,000 | 862 | 36 |
| 15 | May 9 to June 5, 2021 | 3,117 | 194,000 | 3,350,000 | 931 | 43 |
Table 3 summarizes the date ranges for each period and provides an overview of claimant characteristics. The period with the highest claims and highest number of individual claimants was between May 10 and June 6, 2020 (period 3). On average, however, more employees were supported in the period between August 2 and August 29, 2020 (period 6), despite slightly fewer employers claiming.
As described, after the CEWS period between July 5 and August 1 (period 5), claimants were required to report their year-over-year revenue declines to calculate their subsidies. Average revenue decline rates stayed within about seven percentage points, ranging from a low of 35% between August 30 and September 26 (period 7) and a high of 43% between April 11 and May 8, 2021 (period 15).
2.8 Evaluation Framework
The remainder of this paper evaluates the CEWS and TWS using both qualitative and quantitative analyses on the basis of relevance, effectiveness, equity and efficiency, as defined below:
- Relevance: The extent to which the measures serve a clearly defined policy need aligned with the roles and responsibilities and current priorities of the Government.
- Effectiveness: The extent to which the measures achieve their stated policy objectives.
- Equity: The extent to which the measures contribute to an equitable distribution of benefits not only across income classes, but also between genders, and across age groups, industries, regions, etc.
- Efficiency: The extent to which the costs incurred in achieving the measures’ objectives are minimized, or alternatively when the benefits attained are maximized for a given level of costs incurred.
This evaluation framework is based on the list of core issues that departments and agencies should consider when evaluating programs under the Policy on Results of the Treasury Board Secretariat, as well as more general considerations pertinent to tax policy issues (Lenjosek, 2004).
3. Relevance of Wage Subsidy Programs
3.1 Temporary Wage Subsidy
A measure is relevant if it serves a demonstrable, clearly defined policy need that is aligned with the roles, responsibilities and current priorities of the federal government. The TWS was introduced at the onset of the COVID-19 pandemic in response to the extraordinary nature of the crisis and its impact on the Canadian economy. At the time, there was a clear policy need to help employers and workers manage the sudden and unpredictable decline and, in some cases, shutdown of business activity. The Government’s position was that support was needed to keep employees on payroll to establish a quick economic recovery. The TWS was designed to respond to this need by providing immediate support to employers through a reduction in payroll remittances.
Indeed, economic theory suggests that there is value in maintaining employer-employee matches by subsidizing employment through periods of uncertainty. While economic shocks may allow an efficient reallocation of resources, sudden liquidity issues and decreases in revenues could inefficiently force employers to lay off productive employees. Preventing separations is therefore particularly relevant in the current situation, where employers are facing pressure from externally imposed, temporary public health measures rather than structural economic changes or inefficient operations.
In all downturns, an added reason to prevent or delay layoffs is that searching for, hiring and training new employees is costly for employers. Further, employees also develop job-specific skills in a given role, and “separations risk destroying this valuable source of idiosyncratic employment”, while unemployment is associated with adverse health and economic outcomes for workers and their communities (Giupponi et al., 2021). This is particularly true of long-term unemployment (Nichols et al., 2013). Successfully keeping employees on payrolls and encouraging rehiring also supported employers in resuming normal operations as pandemic restrictions were lifted and demand recovered.
The relevance of this measure is further demonstrated by considering the international context. Many other countries including Denmark, Australia, New Zealand, Ireland and the United Kingdom, also launched new job retention schemes to allow businesses to retain their employees during the pandemic. On average across the OECD, the use of job retention support peaked during the first wave of the pandemic in April 2020, supporting approximately 20% of employment or 60 million jobs, more than 10 times as many as during the 2007-2008 global financial crisis (OECD, 2021). These measures were similar to the TWS in that they were short-term measures; however, many of them offered significantly more generous support than the 10% TWS. Consequently, while Canada’s decision to launch the TWS was aligned with the actions of other countries, as the pandemic evolved it became clear that more generous support would be needed to preserve employment.
That said, the TWS still played an important role in supporting small employers not directly affected by the pandemic, especially after the CEWS was launched. The reduction in payroll remittances granted through the TWS provided immediate access to government subsidies for eligible businesses, up to the level allowed under the TWS.
3.2 Canada Emergency Wage Subsidy
Similar to the TWS, the CEWS was introduced during the first wave of the pandemic in response to the extraordinary nature of the crisis and its impact on the Canadian economy. As COVID-19 cases surged and public health restrictions were tightened, the CEWS program provided significantly more support to eligible employers through an initial subsidy of 75% of qualifying wages. The CEWS program has since been adapted to ensure that it continued to remain relevant to the evolution of the pandemic context. The various extensions, rate structure launched in July 2020 and subsequent enhancements to the subsidy rate, are examples of how the program has been modified to respond to the impacts of the multiple waves of the pandemic, as well as employer and stakeholder concerns.
In addition to responding to a clear policy need, the CEWS was aligned with the federal government’s role and responsibility to ensure Canada’s economic stability in the face of the pandemic, and complement the public health and safety measures of the provincial and territorial governments. Without broad-based support through programs like the CEWS, for example, provinces and territories may have been limited in the types of public health measures that could be practically implemented without suffering untenable economic and human consequences. The CEWS provided a consistent, nation-wide approach to protecting Canadians and businesses, allowing provinces and territories to focus on public health measures under their jurisdiction.
The evolution of the CEWS has also followed that of job retention programs in other countries. Similar to the CEWS, international job retention programs were initially announced as three-to-six month measures but were subsequently extended and adapted in response to continued restrictions and to better incentivize economic recovery. To date, some countries have ended their programs following a period of low case counts and minimal ongoing restrictions, while others have extended them until into 2022, with modifications to account for a gradual reopening of their economies. See Annex 2 for a summary of select international job retention schemes.
4. Effectiveness Evaluation
Effectiveness relates to the extent to which a program meets its stated policy objectives. In the case of the TWS, the objective was to support employment. Similarly, the objective of the CEWS was to help prevent job losses and encourage employers to quickly rehire workers previously laid off as a result of COVID-19.
Outside of the pandemic context, the effectiveness of payroll (tax) subsidies has been widely discussed in the literature. As related by Collischon et al. (2020), evidence for an effect on employment is limited in earlier papers (see, e.g., Gruber, 1997, Anderson and Meyer, 2000), either because of wage adjustments or rigidity in labour supply or demand. In their own study, Collischon et al. exploit variation in German federal subsidies to demonstrate a significant crowd-out effect of subsidized employment (i.e., Minijobs) on non-subsidized employment. That said, some papers suggest a positive employment effect from payroll tax subsidies (e.g., Kangasharju, 2007; Garsaa and Levratto, 2015). Recently, Saez et al. (2019) leverage the age dependence of payroll tax subsidies in Sweden, and find the tax subsidies led to a two-to-three percentage point increase in youth employment, with the effect stronger for credit-constrained firms. In an upcoming paper using a similar approach in the Hungarian context, Bíró et al. (2021) also find a positive employment effect from payroll tax subsidies on both young and older workers. Moreover, targeted subsidies supporting new hires are found to be effective in Boockmann (2007) among East German women, Brown et al. (2007) for the long-term unemployed in Germany, Cahuc et al. (2014) for low-wage workers in France ,Footnote 13 and in Rubolino (2021) among unemployed Italian women, though Huttunen et al. (2013) report little effect among older low-wage workers in Finland. A review by Neumark (2013), meanwhile, indicates that subsidies for new hires can have an impact on employment during recessions when they are broad-based.
In fulfilment of its objective of supporting employers through the pandemic, the TWS provided $1.3 billion in support to approximately 264,000 employers, most of which would likely have been bearing additional pandemic-related costs. The majority of TWS support (88%) was received by Canadian-controlled private corporations (CCPCs). Of all CCPCs that were eligible and had employees, 26.9% accessed the TWSFootnote 14 and support received was equivalent to 1.88 million employeesFootnote 15 being fully supported (for more detail on take-up of the TWS by province and industry, see tables in Section 5.1.). The TWS was available to all employers, even those without a revenue decline, in recognition that small businesses could have more difficulty dealing with additional costs created by the pandemic. The design of the TWS enabled liquidity support to be immediately provided to employers, who did not need to apply for the subsidy but instead could receive it through a reduction in payroll remittances. This approach enabled timely implementation, thus facilitating immediate support to employers. The quick delivery mechanism for the TWS continued to be effective even after the CEWS was launched as employers with important liquidity constraints were able to obtain immediate support from the TWS and then adjust their CEWS claim accordingly, while they waited for CEWS payments.
Estimating the number of jobs saved or employees rehired through the CEWS, meanwhile, requires a reliable counterfactual (OECD, 2021). This is made challenging in the current context due to the existence of other interventions and the difficulty in establishing a control group (i.e., a group that does not claim but is otherwise identical).Footnote 16 All firms were eligible at the same time, and all across the country. Moreover, while in some periods firms have to meet a revenue-decline threshold, high frequency data on revenues and outcomes among non-claimants is not available. Nevertheless, some early analysis of the program is available. On one hand, in initial appraisals Smart (2020) and Corak (2021) regard the program as not being sufficiently targeted to those jobs and workers affected by the COVID restrictions. On the other hand, in an upcoming paper, Leung and Liu (2022) find that usage of the CEWS in the early months of the pandemic correlates with a lower probability of closure over the period spanning October 2020 to March 2021. In addition, businesses that used the CEWS had an average cumulative employment growth rate 2.5 percentage points higher than that of non-claimants between February and the last three months of 2020, and this difference increases to 5 percentage points when accounting for pre-pandemic firm characteristics. The estimates are also larger when attempting to account for the possible relationship between an employer’s decision to claim and their likelihood of remaining open.
Feedback from surveys among stakeholders also points to the effectiveness of the CEWS. During consultations in May and June 2020 on the CEWS, many businesses and employers indicated that the CEWS helped them keep workers on the payroll and bring previously laid off workers back.Footnote 17,Footnote 18Additional surveys were conducted by associations such as the Canadian Federation of Independent Business (CFIB), which also indicated that the CEWS was an important lifeline, especially for small businesses.Footnote 19
To gain more insight into the effectiveness of the CEWS, the remainder of this section explores data trends among claimants, some of which will also have benefited from the TWS.
4.1 Overall Trends in Employment and Business Closures among CEWS Claimants and Non-Claimants
This section looks at data to explore the trends in employment, rehiring, and business closures among CEWS claimants (defined as all businesses that claim the CEWS in at least one period). As a point of reference, the section also presents the data for non-claimants when possible.Footnote 20 While a comparison is being made between the two groups, CEWS claimants are expected to fare worse on these indicators, since by definition, they were more likely to have been deeply affected by the pandemic than non-claimants. Certain trends are however expected to be common between the two groups (for example, improvements for both groups would be expected at times when restrictions were generally lifted).
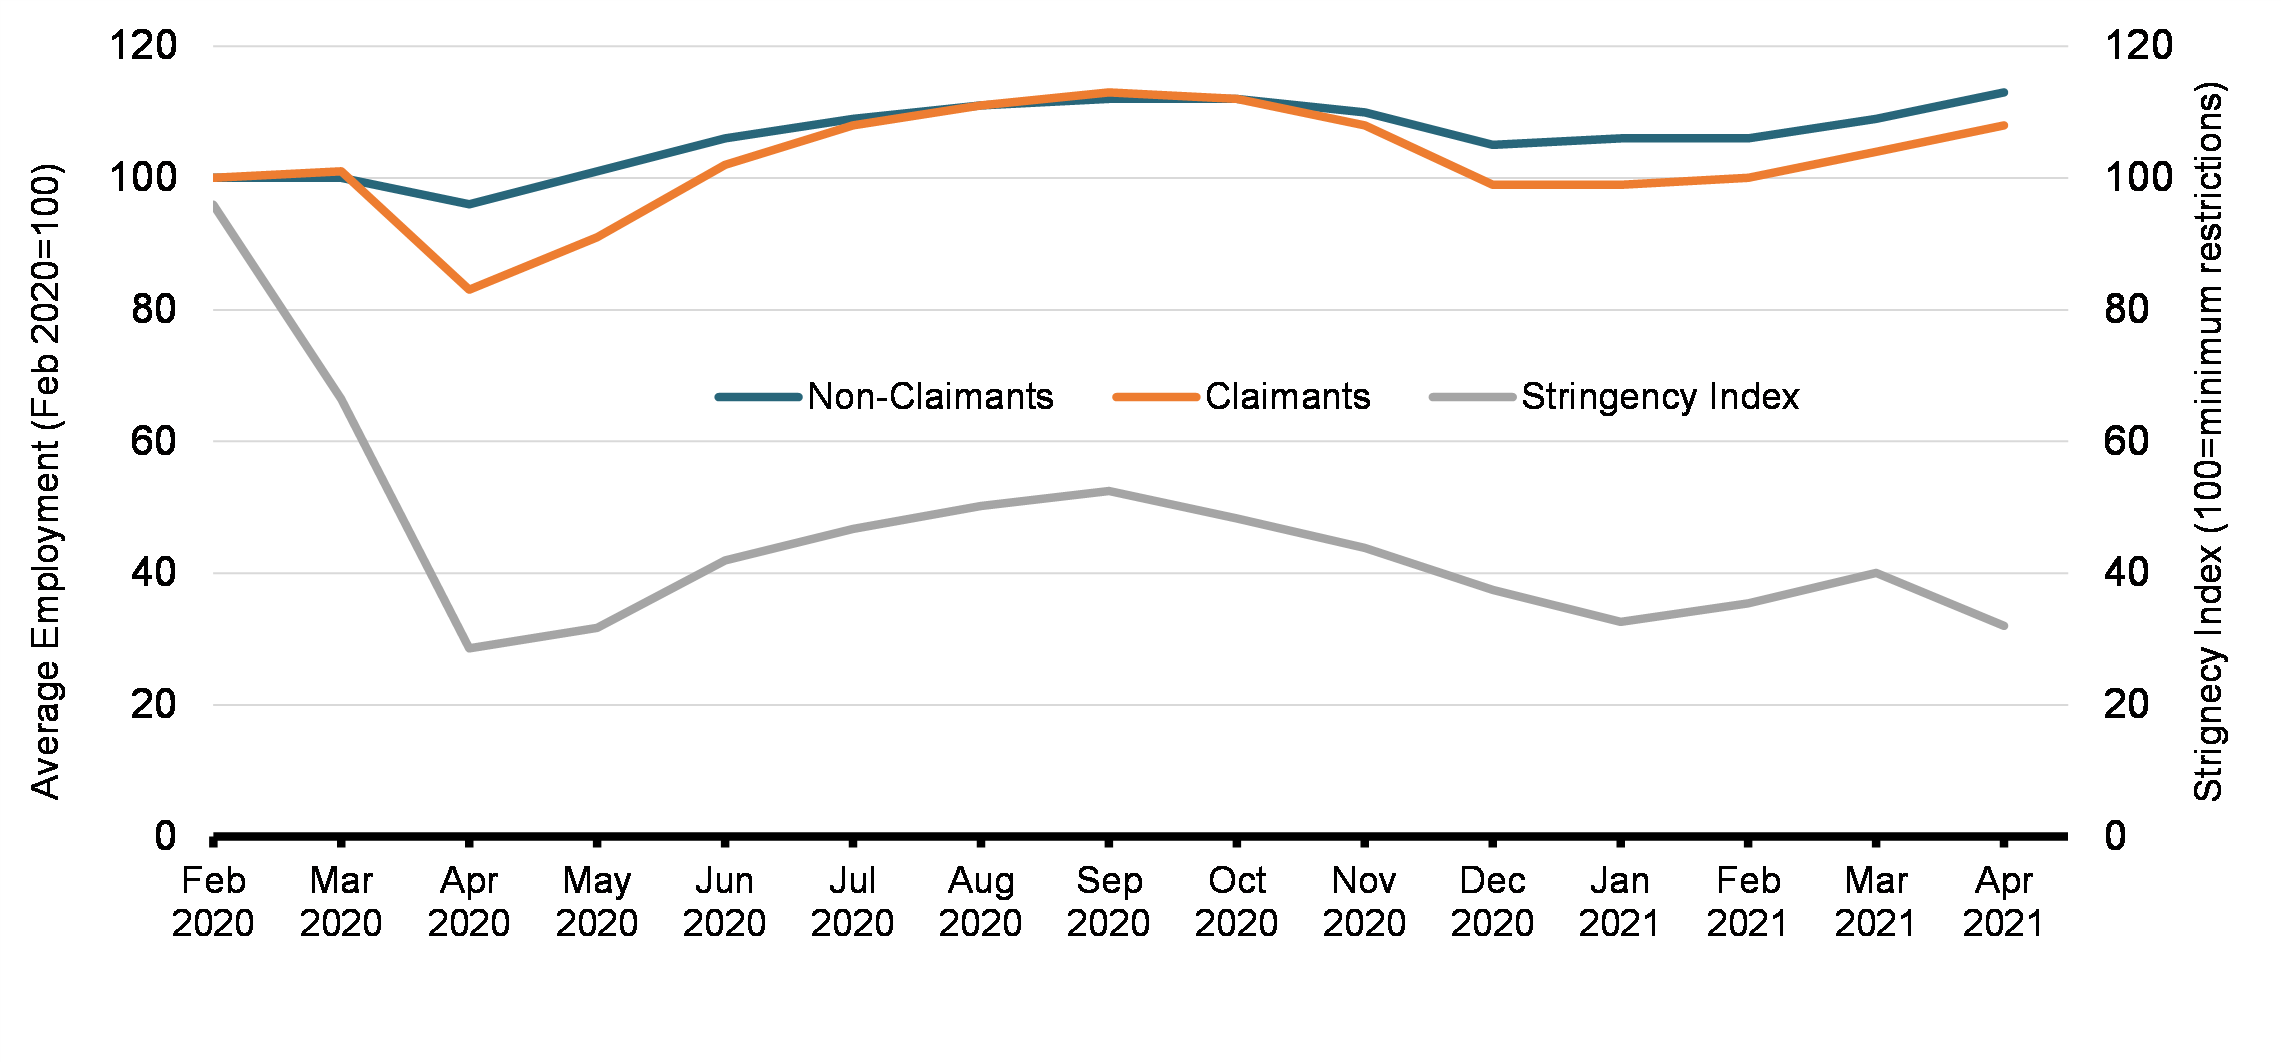
Chart 3 shows the aggregate employment trends among CEWS claimants (employers claiming CEWS in at least one period) and non-claimants (those who never claimed CEWS) from February 2020 to April 2021. Private sector job losses were concentrated among employers who claimed CEWS at some point, with employment reaching a low of 80% of the pre-pandemic level among claimants and 95% among non-claimants in May 2020. Starting in June 2020, employment began rising among claimants and non-claimants. This coincided with a period of loosening restrictions across Canada as measured by the Bank of Canada’s COVID-19 stringency indexFootnote 21 and followed the May announcement that the CEWS would be extended as long as necessary. In addition, starting in July 2020, aggregate employment among CEWS claimants and non-claimants followed similar trends. However, among CEWS claimants, the level of aggregate employment remains lower than it was in February 2020, which is expected since by definition, CEWS claimants were more likely to have been affected by the pandemic.
Share of Aggregate Employment Recovered among CEWS Claimants and Non-Claimants and Bank of Canada COVID-19 Stringency Index
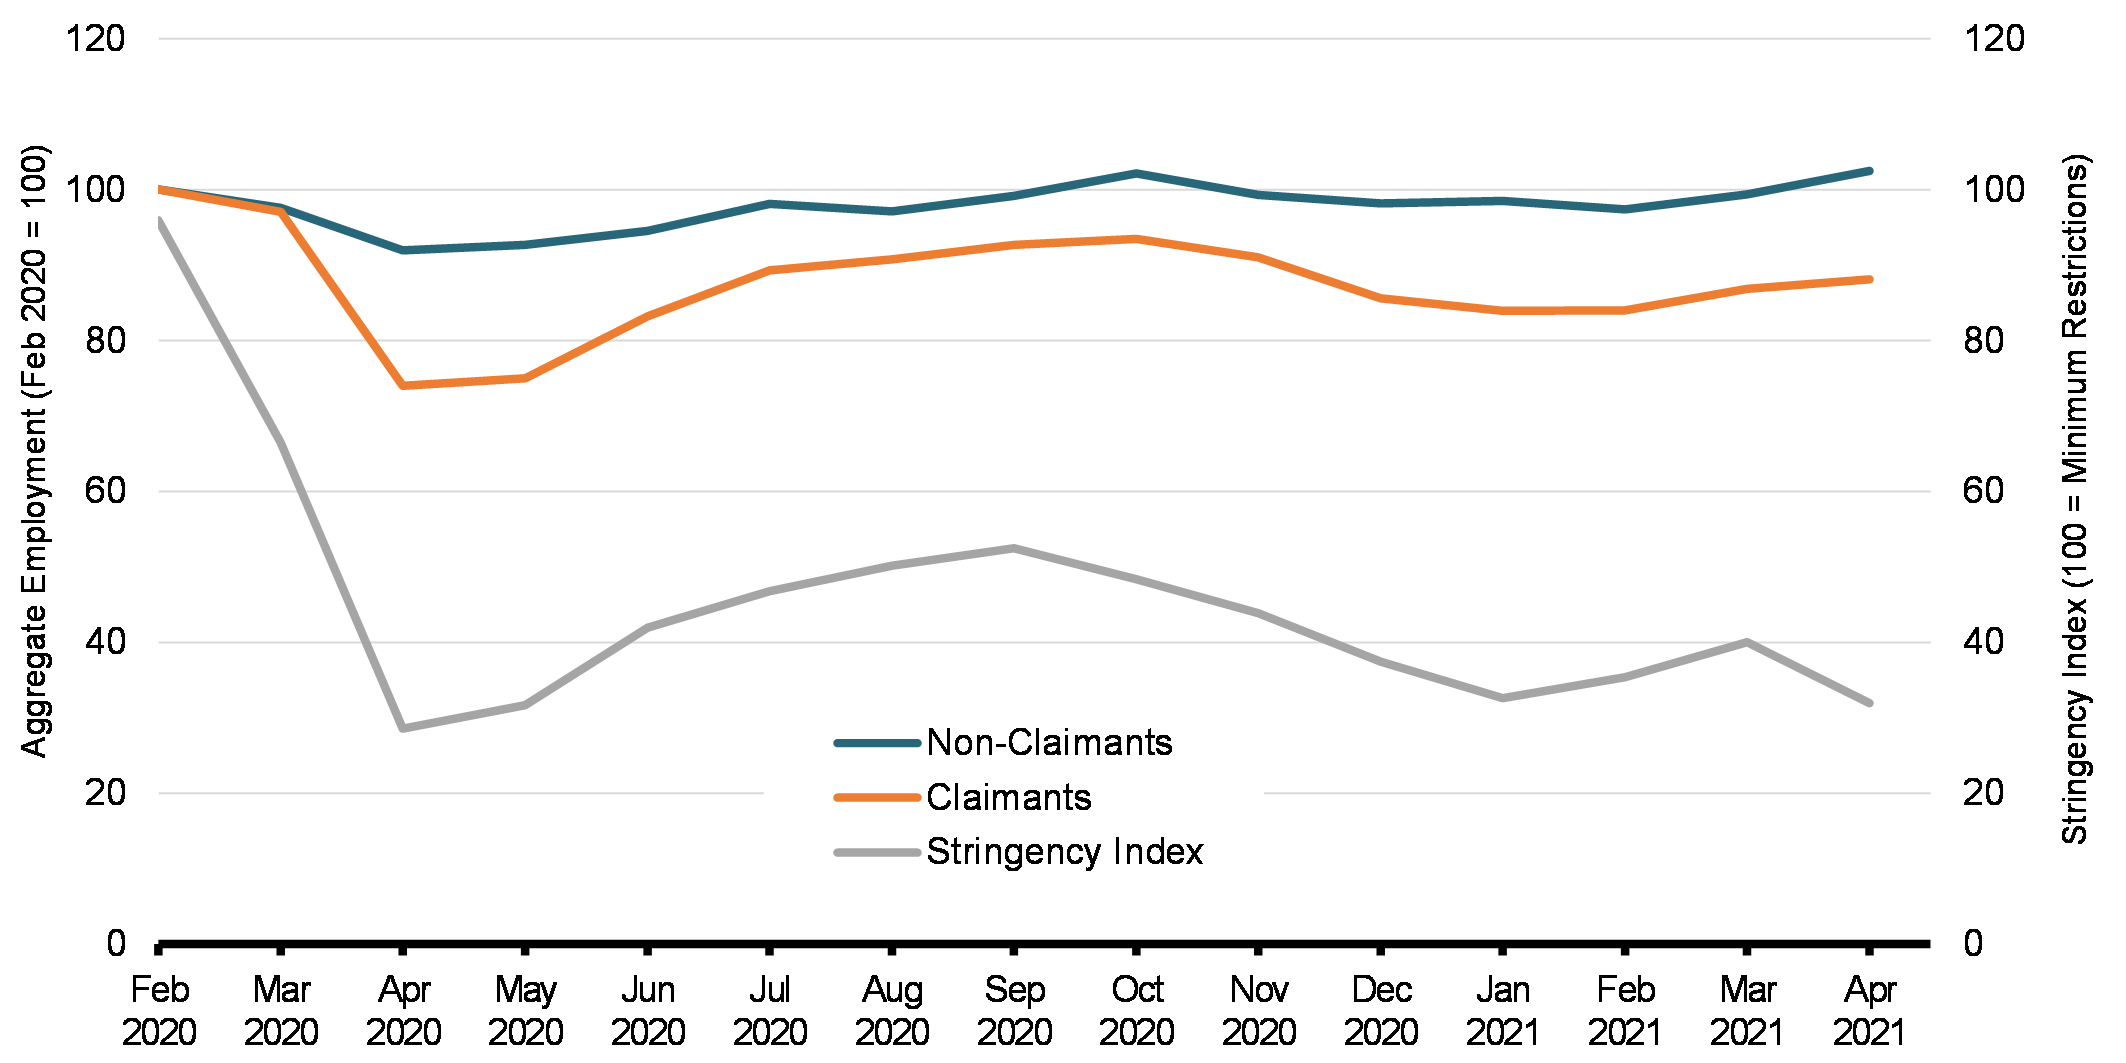
Chart 4 shows the trends in the business closure rate among CEWS claimants and non-claimants.Footnote 22 It demonstrates that over the period from March 2020 to March 2021, CEWS claimants were less likely, on average, to close than non-claimants. The spike in business closures in the first few months may reflect a selection bias, since by definition, claimants had to operate at least until CEWS was available to be classified as such. That being said, CEWS claimants were consistently less likely to close in all periods.
Chart 4 shows two major spikes in the closure rate in March and April 2020, at the beginning of the pandemic. The closure rate then stabilized from May 2020 until January 2021, at which point another smaller increase in the number of businesses that stop operating is observed. Notably, this spike in the closure rate affected both claimants and non-claimants, and thus may reflect a seasonal pattern. In February 2021, the closure rate decreased again.
Business Closure Rate among CEWS Claimants and Non-Claimants, by Month
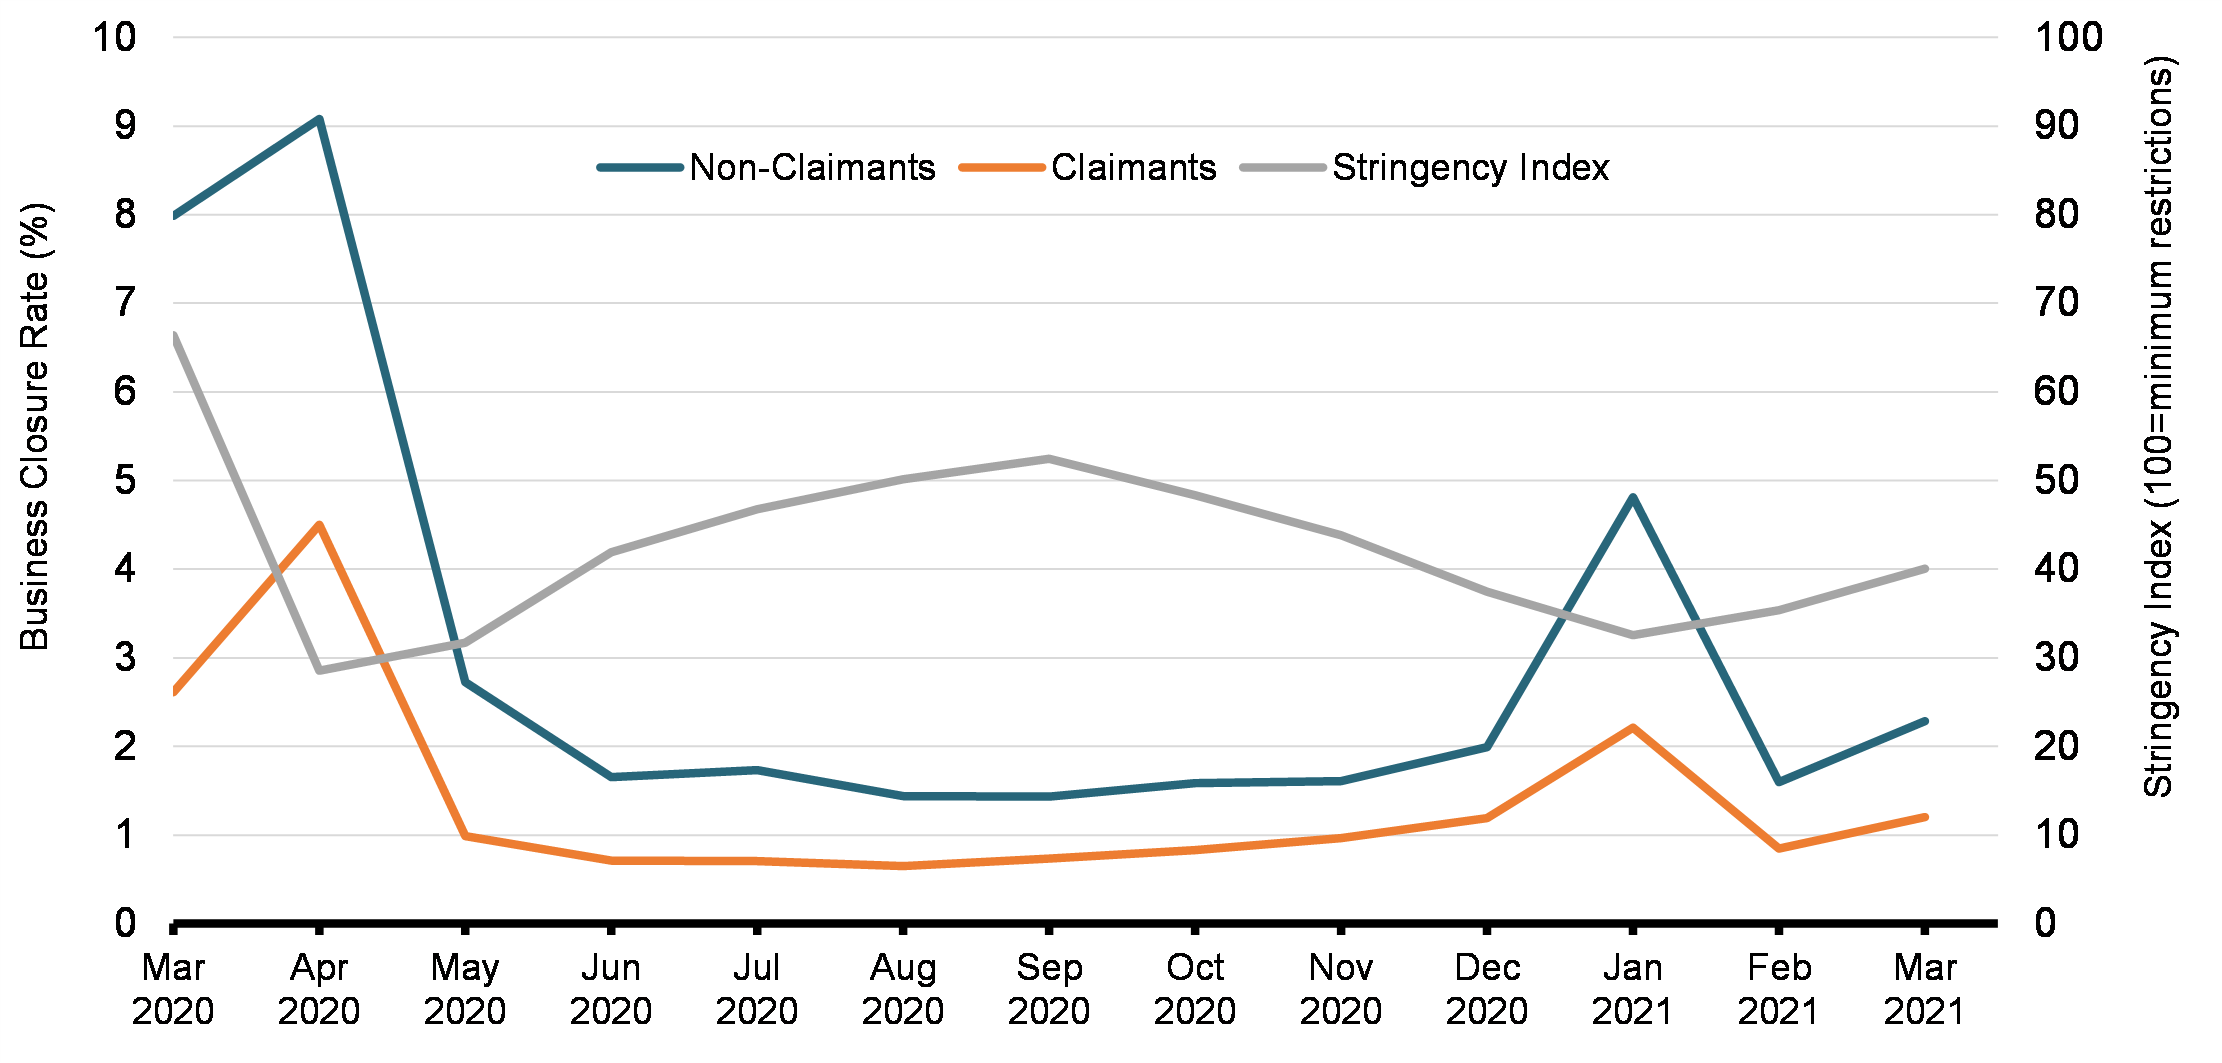
Chart 5 illustrates average employment at surviving firms among CEWS claimants and non-claimants. These lines show that among businesses continuing operations, average employment in April 2021 surpassed its pre-pandemic level. This is true both for CEWS claimants and non-claimants. In other words, while aggregate employment is lower among CEWS claimants, surviving firms kept a level of employment similar to their pre-pandemic level, at least for the period after June 2020.
Average Employment at Surviving Firms
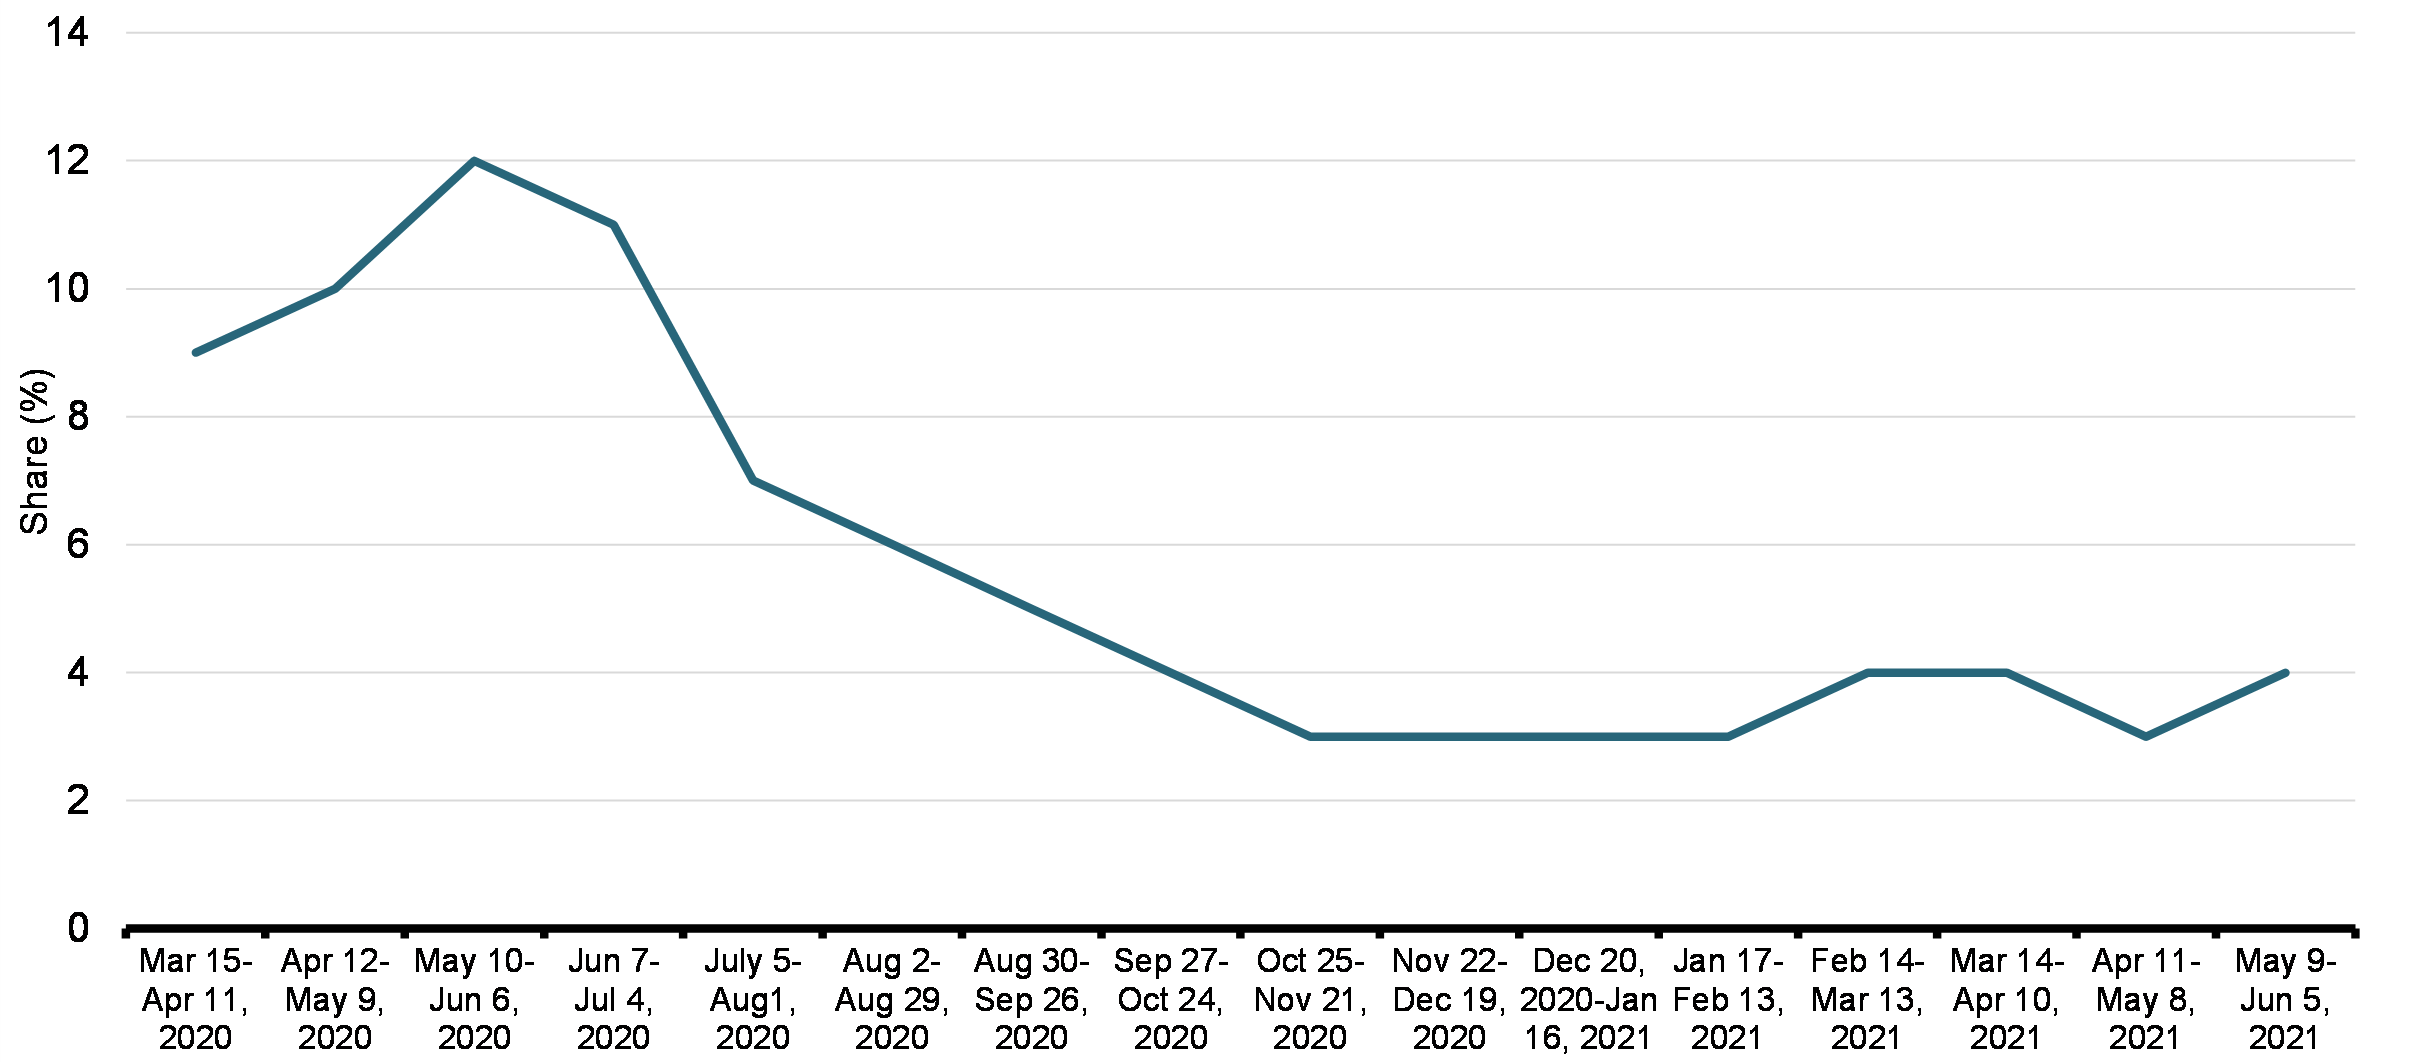
A second objective of the CEWS was enabling employers to rehire workers who had been laid off during the pandemic. While detail about individual employees supported by CEWS is not collected from employers, employers are required to report whether they have rehired at least one employee with each claim they submit. Chart 6 shows the overall pattern on a period-by-period basis of the share of CEWS claimants that rehired at least one employee. This proportion has varied over the course of the program, with a peak of 12% of applicants in the third period. On average, over all periods, 22.3% of CEWS claimants rehired at least one worker.
Share of CEWS Claimants Rehiring at Least One Employee, by CEWS Period
4.2 Industry-Level Trends in Employment, Business Closures, and Revenues among CEWS Claimants and Non-Claimants
Generally speaking, the more severely impacted an industry, the greater the reduction in demand and revenues and the less likely claimants in the industry will be to retain employees or even stay open, both because of reduced staffing needs and reduced liquidity.
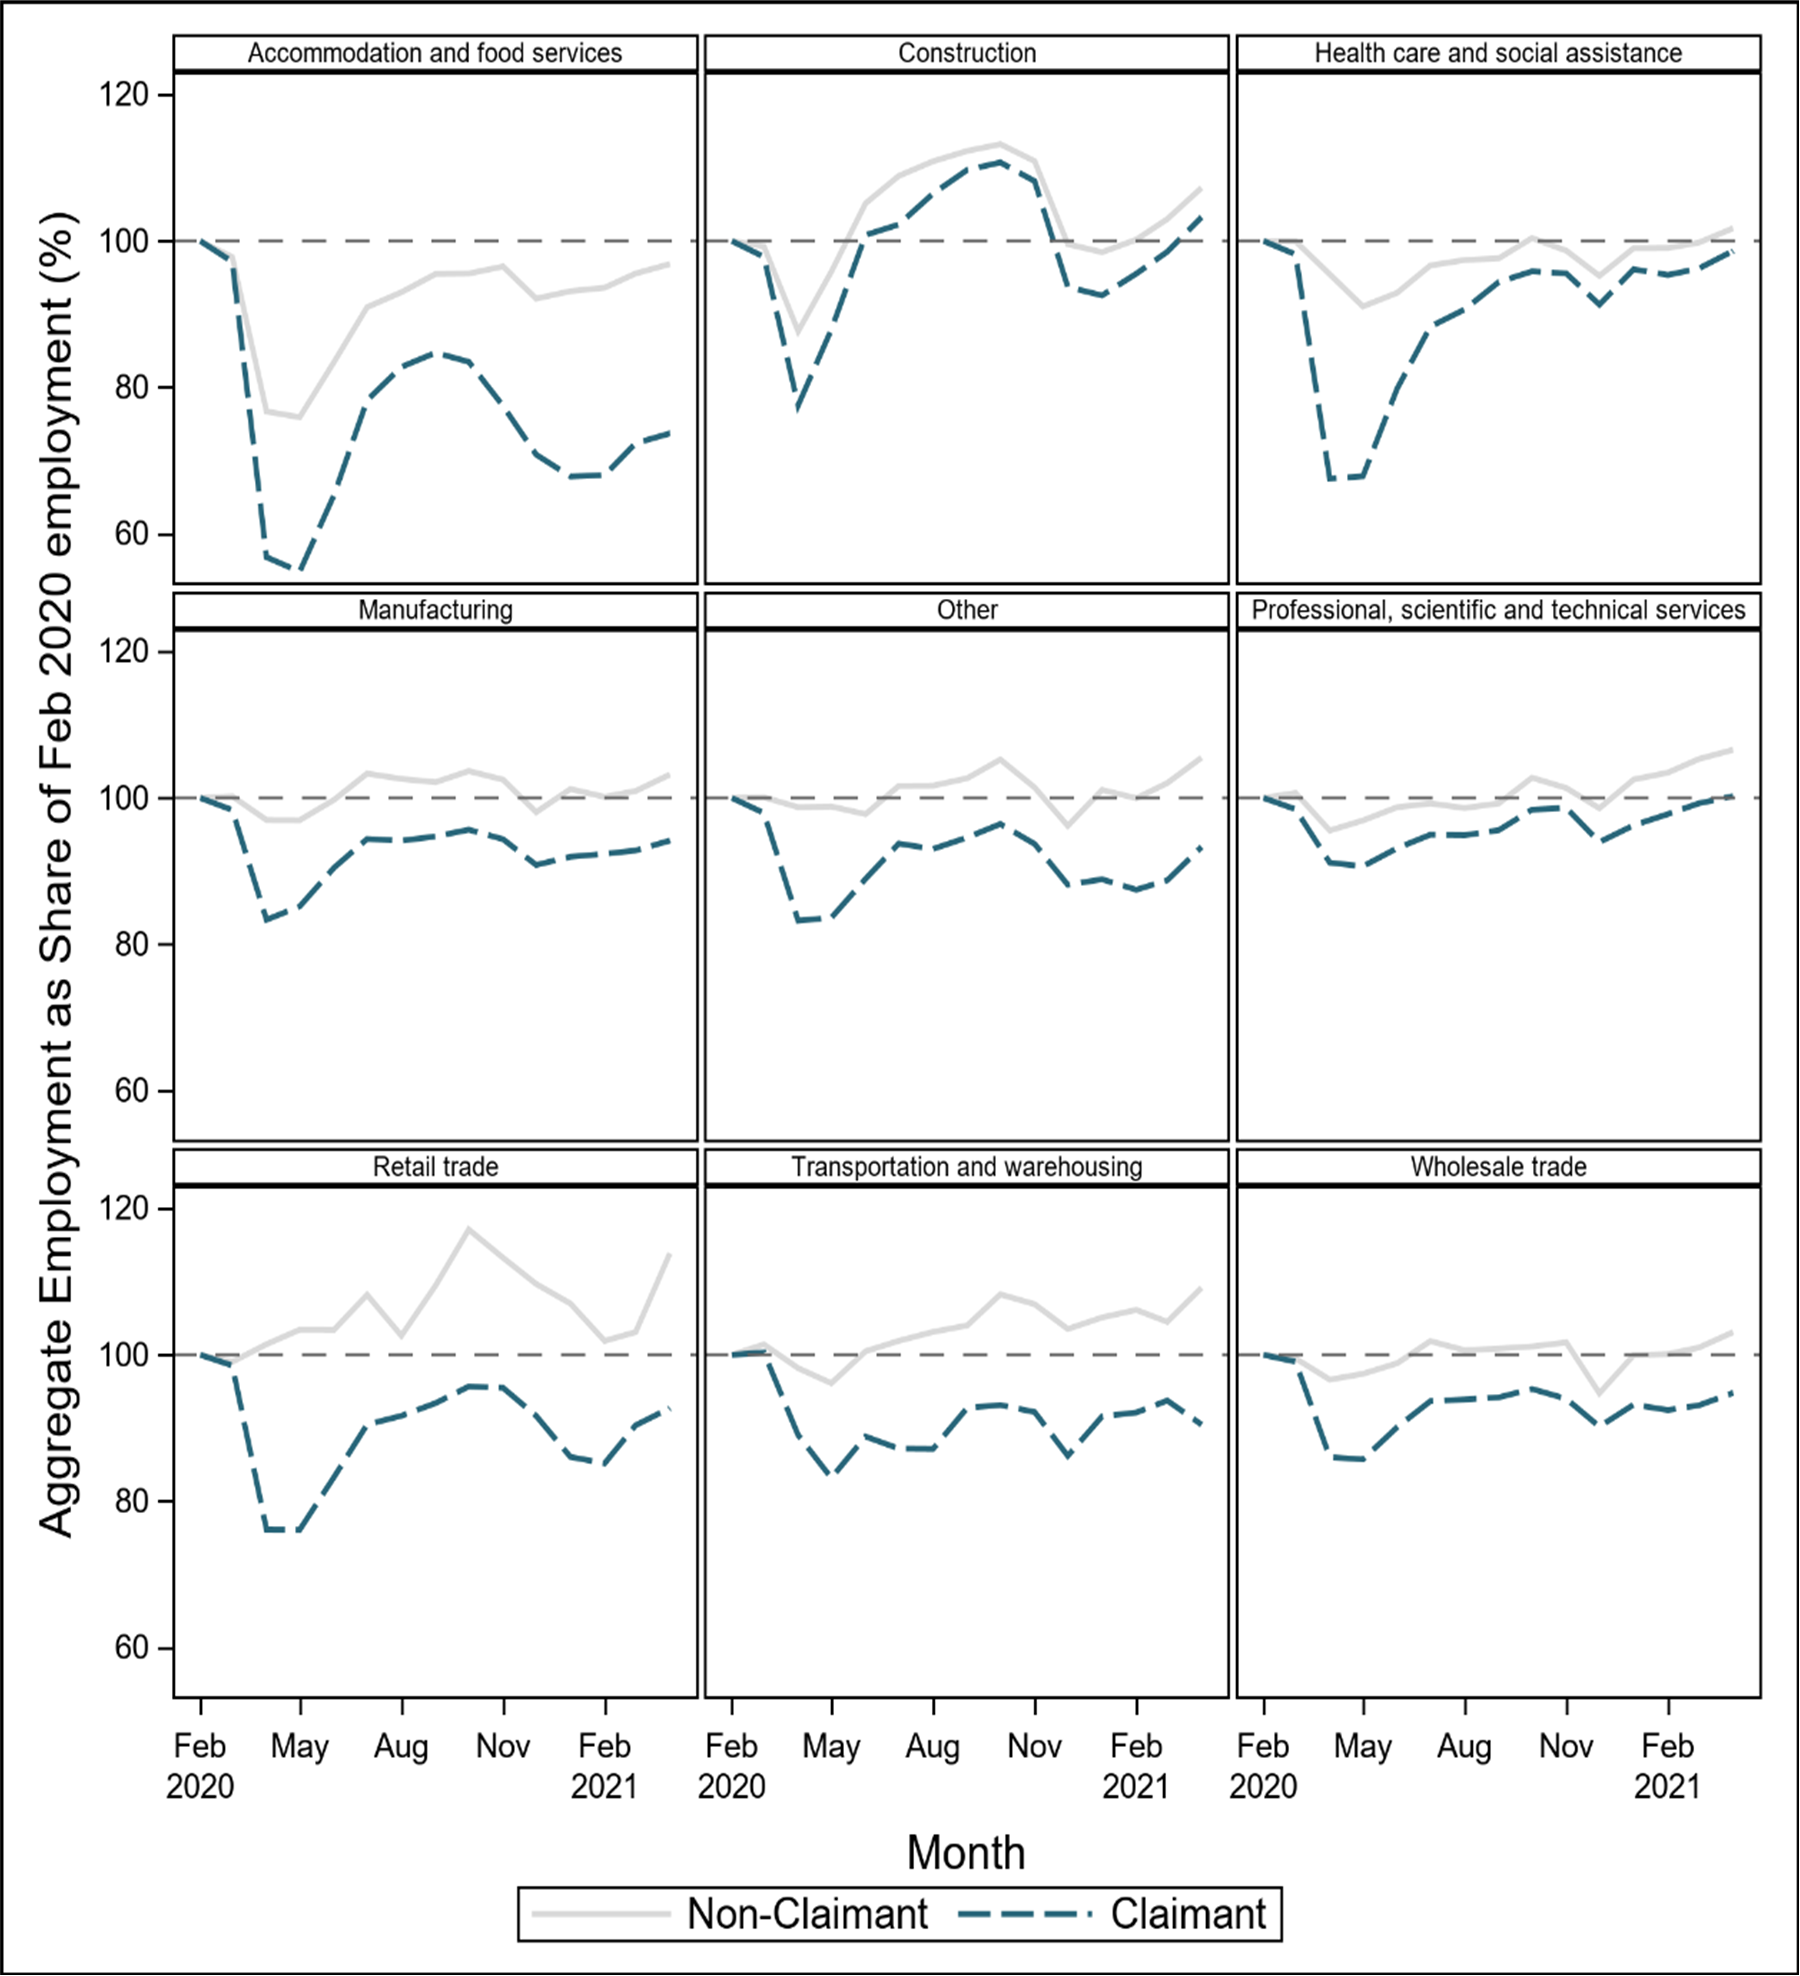
Chart 7 shows how aggregate employment among CEWS claimants and non-claimants has evolved across industries. Customer-facing industries in particular struggled due to COVID-19 related restrictions. In Accommodation and food services, for example, aggregate employment decreased more than in any other industry at the beginning of the pandemic, and more for claimants than non-claimants. In addition, aggregate employment among CEWS claimants in this industry remained well below its February 2020 level. Retail trade is another sector in which CEWS claimants experienced large swings in employment, although that sector experienced a slightly faster recovery by April 2021. In other industries, aggregate employment among non-claimants recovered around its February 2020 level by April 2021, while that of claimants settled at a slightly lower level.
Share of February 2020 Aggregate Employment Recovered Among CEWS Claimants and Non-Claimants, by Industry
Business closures by industry tell a similar story (Chart 8). The Accommodation and food services sector experienced the largest spike in closures at the beginning of the pandemic, with over 28% of non-claimant businesses in that sector closing in April 2020. As explained earlier, however, trends in business closures in the first few months of the pandemic are particularly prone to selection bias. Nevertheless, since that selection bias affects every industry in the same way, this chart still shows that businesses in the accommodation and food services sector were more likely to close.
Business Closure Rate among CEWS Claimants and Non-Claimants, by Month and Industry
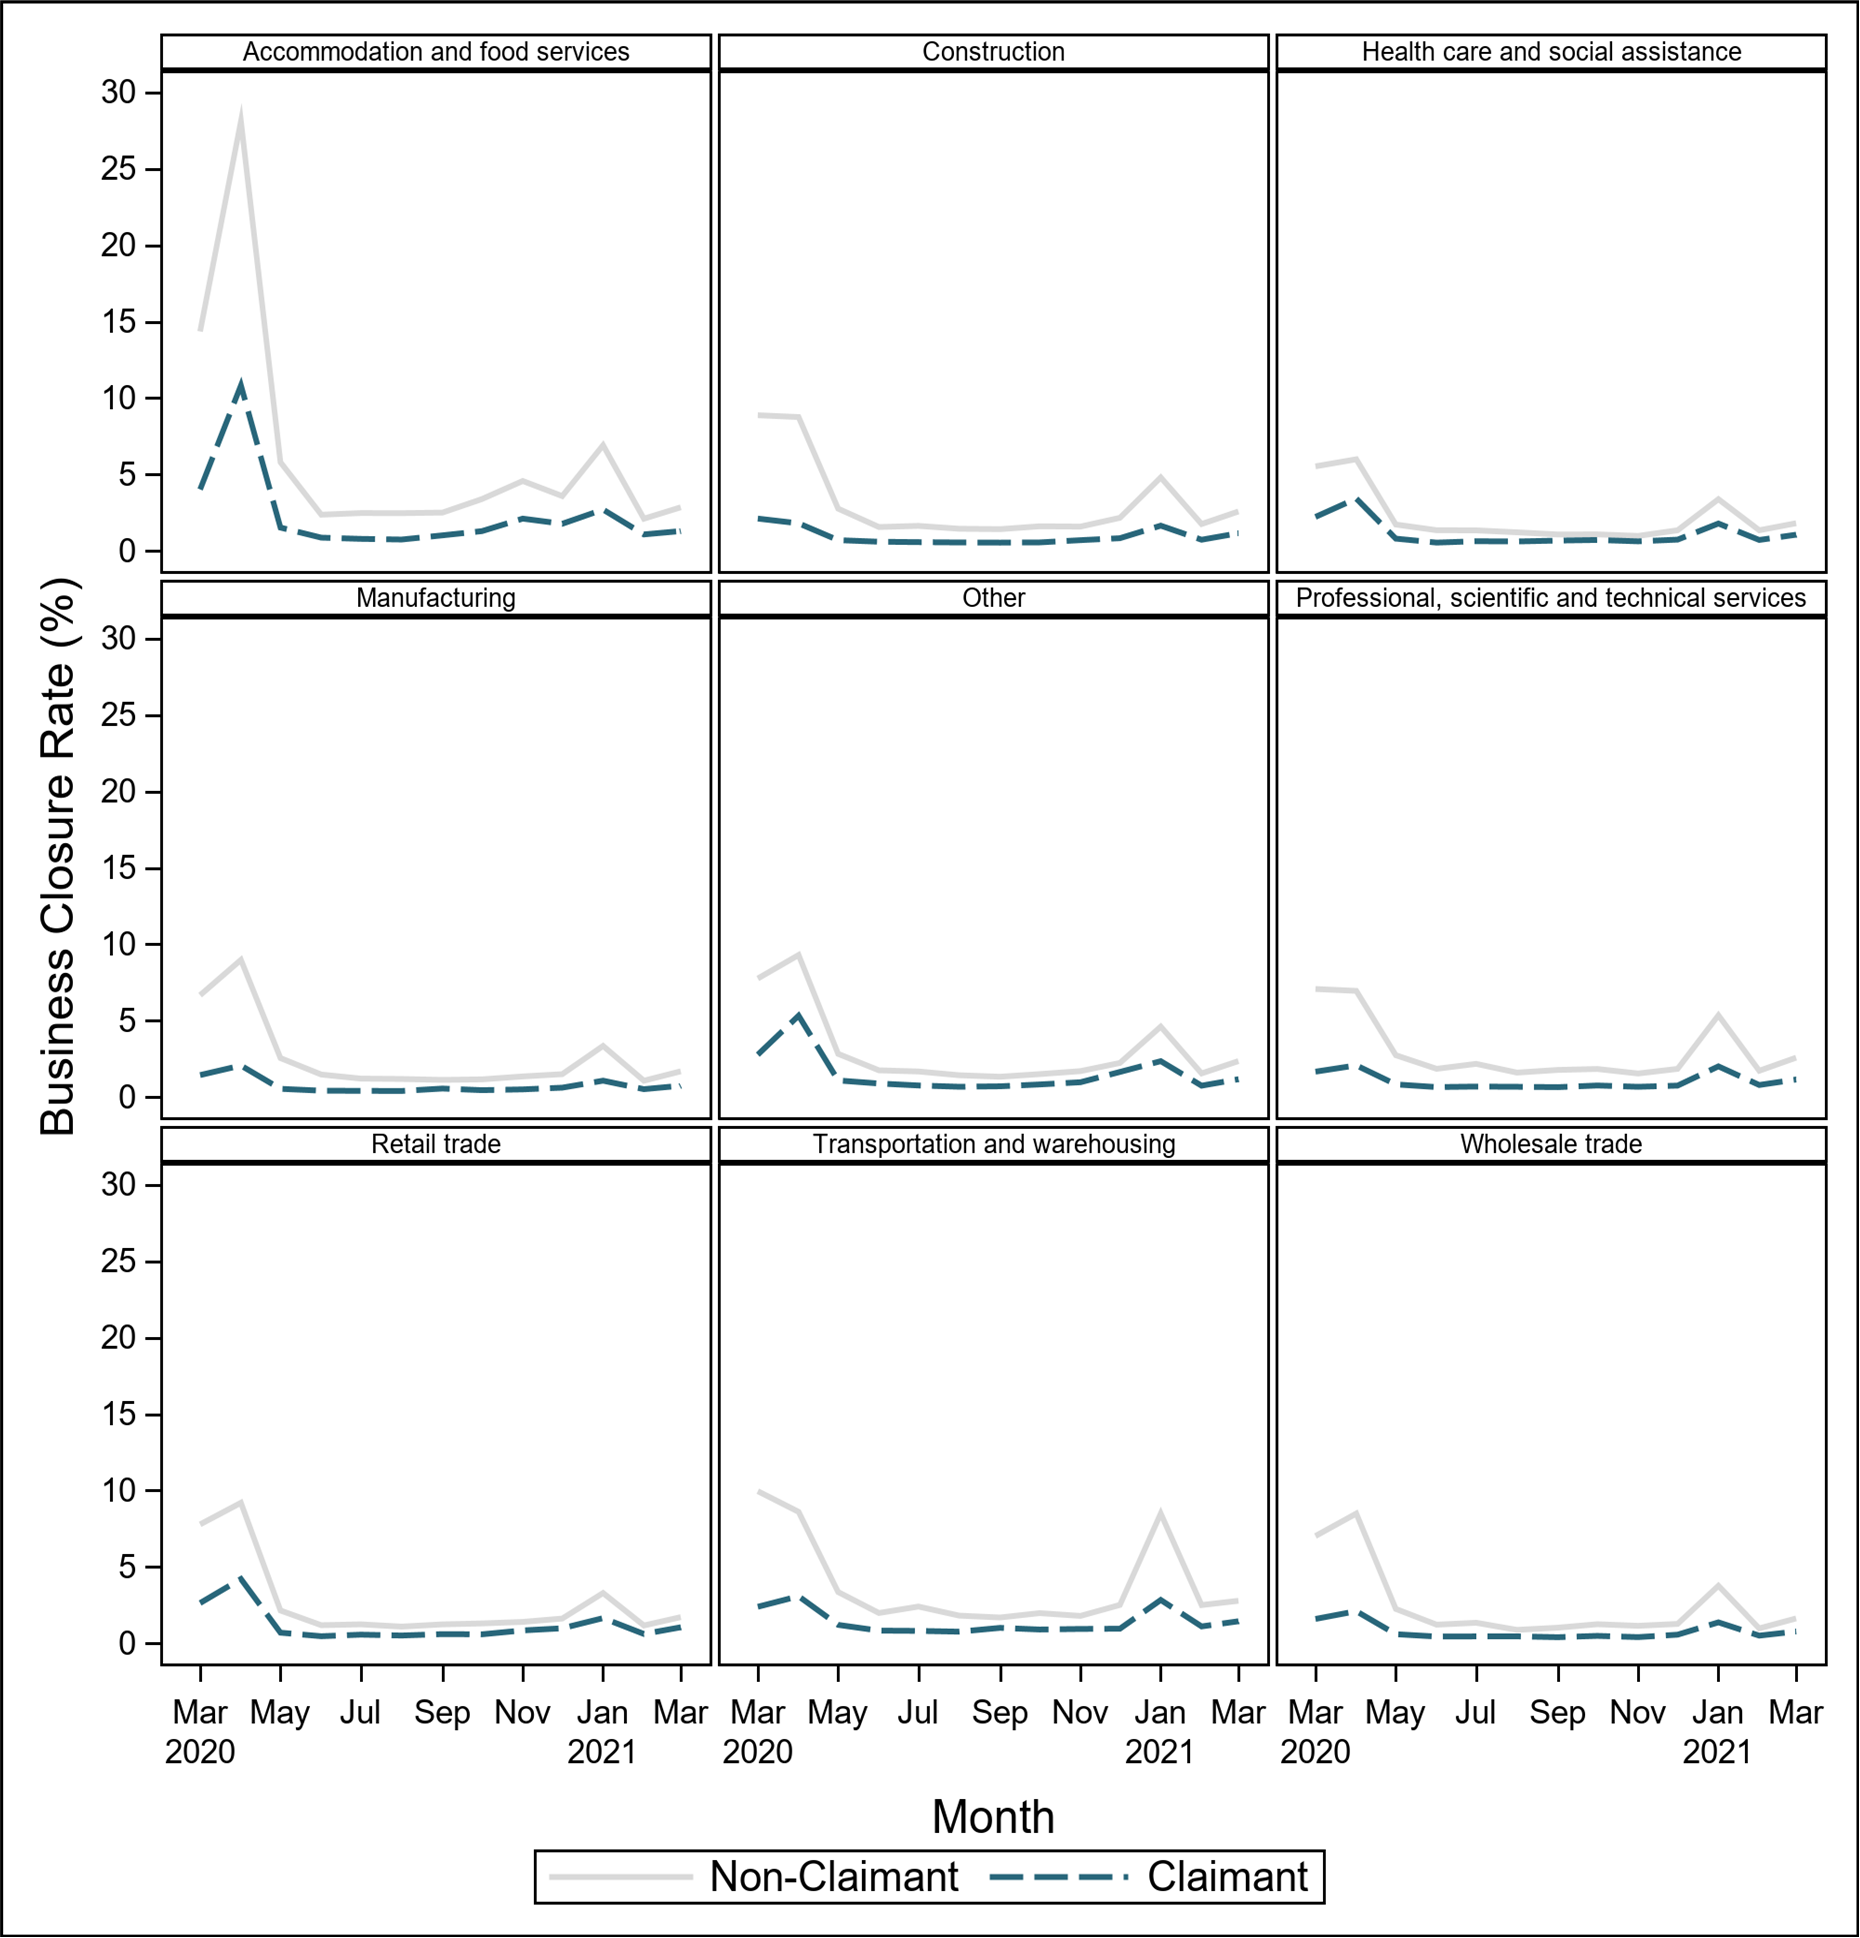
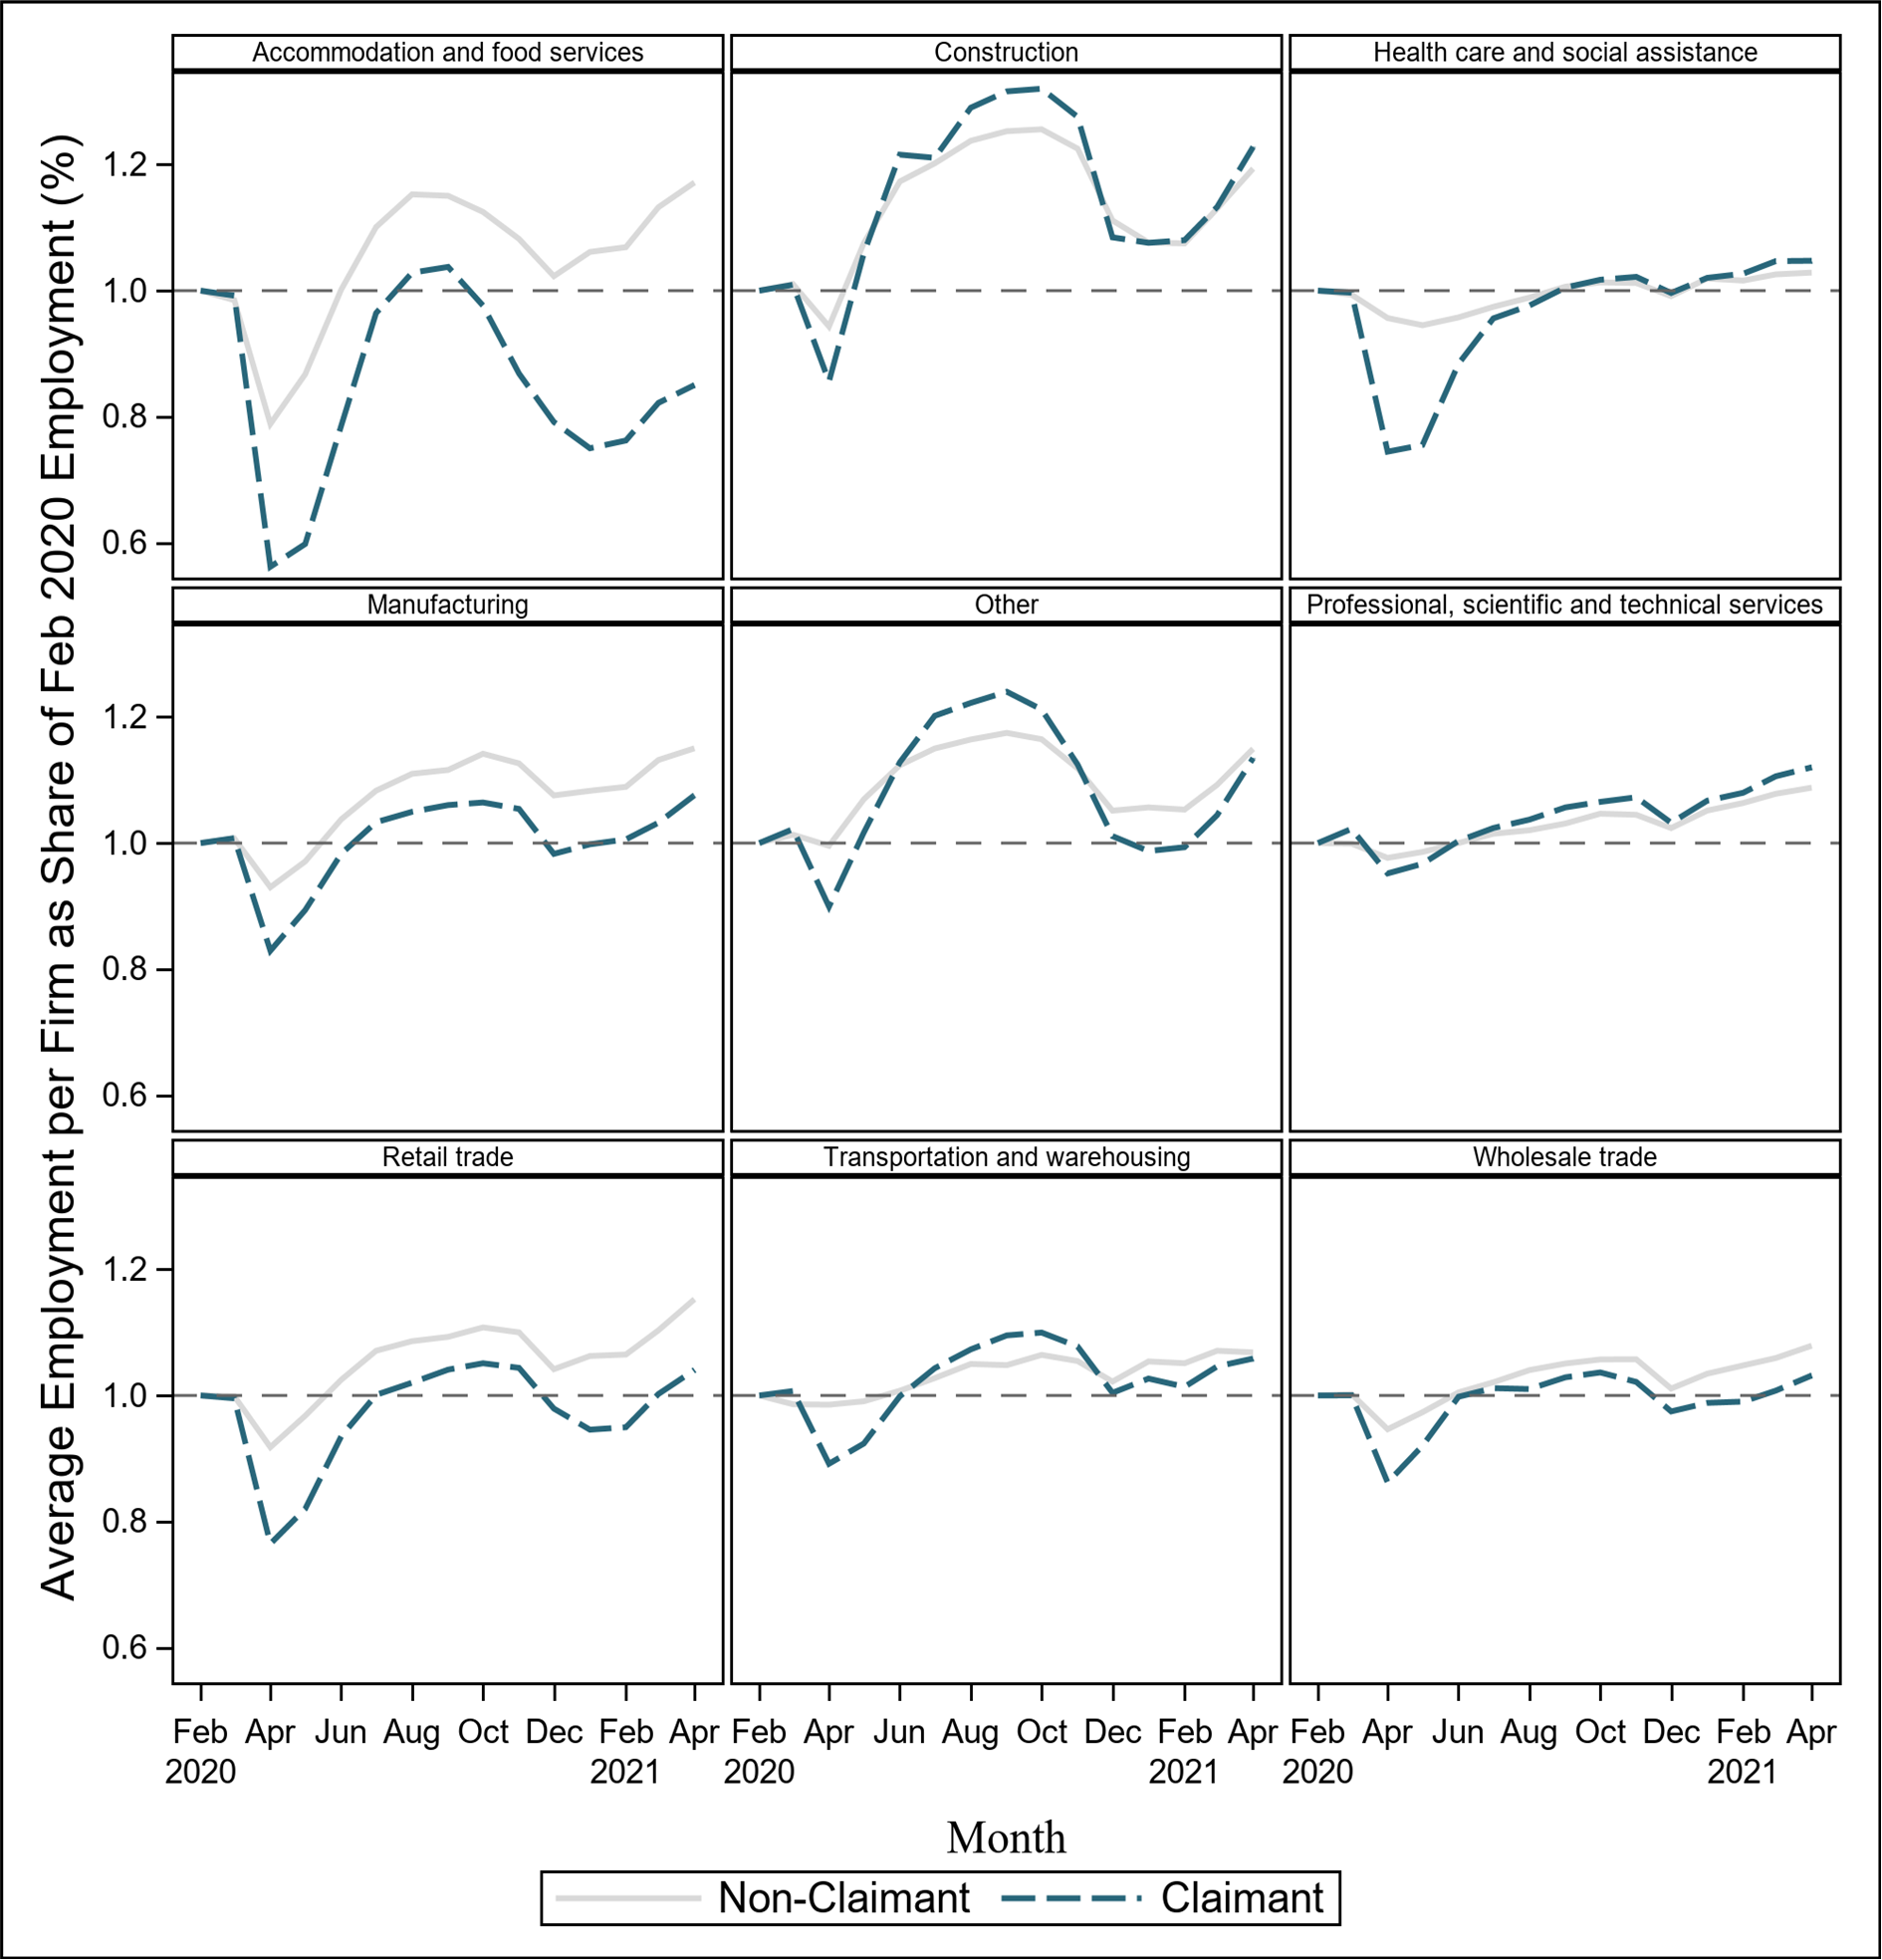
Chart 9 shows the average employment of firms within each industry. It demonstrates that in most industries, the level of employment per firm reached or surpassed its February 2020 level, both for claimants and non-claimants. One notable exception is the Accommodation and food services sector, where CEWS claimants still employ fewer workers on average than they did before the pandemic.
Average Employment at Surviving Firms, by Industry
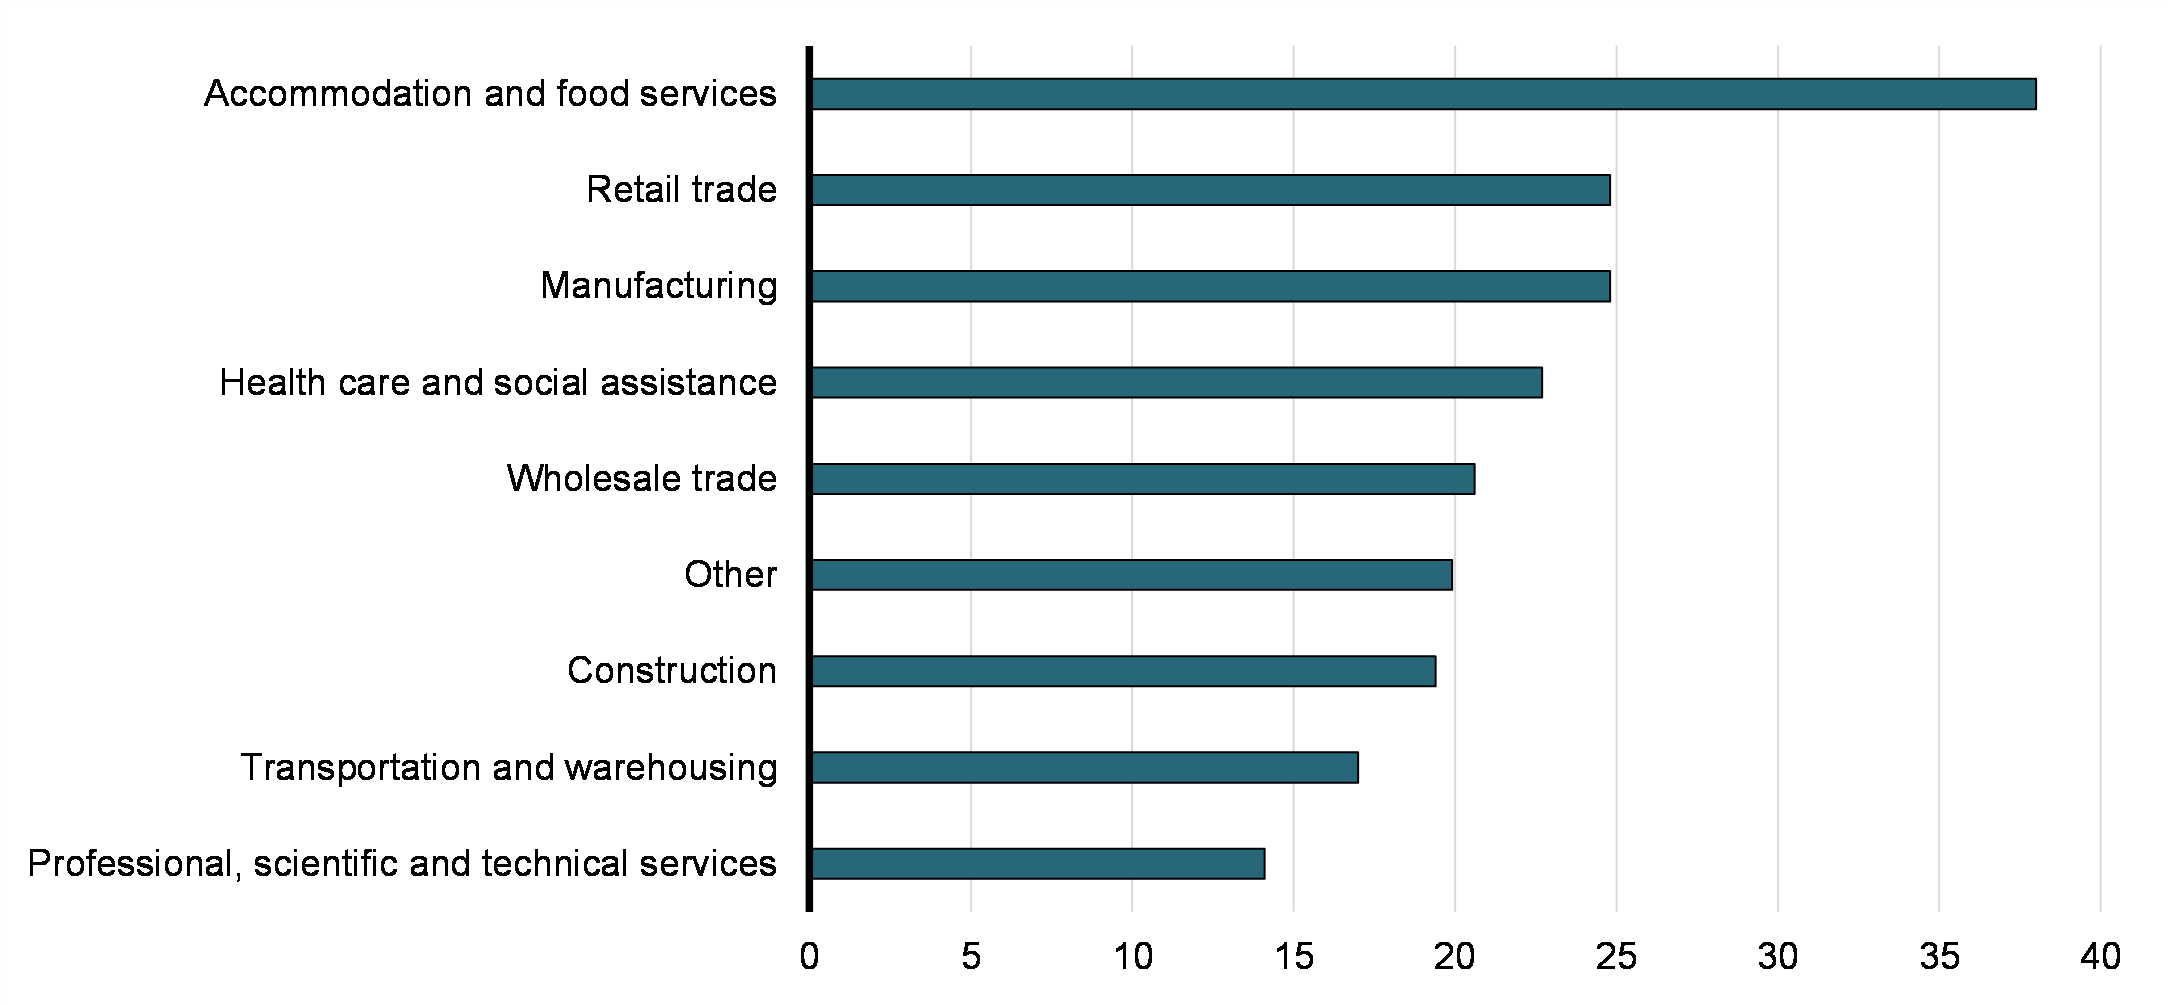
Rehiring rates also vary by industry. Chart 10 shows the share of CEWS claimants in each industry who rehired at least one worker in at least one period since the implementation of CEWS. Of course, in order to rehire workers, a first condition is that employees had first been laid-off by a business, and therefore sectoral differences are to be expected, in line with differential impacts of the pandemic restrictions. Employers in the accommodation and food services sector have been the most likely to report rehiring a worker (38.0% of them did so), while businesses in the professional, scientific and technical services sector were the least likely (14.1%). These observations are consistent with employment trends across sectors.
Share of CEWS Claimants who Rehired at Least One Employee between March 15, 2020 and September 25, 2021 (Periods 1 to 20)
4.3 Summary on Effectiveness
Overall, this study finds that the CEWS and TWS were effective at supporting employment during a time of crisis. For the TWS, the study argues that the design was effective at providing temporary and immediate liquidity support to employers. For the CEWS, the study reports both survey-based and quantitative findings. First, feedback from stakeholders indicate that the CEWS was effective, in line with a number of academic studies. Second, the data show how businesses claiming the CEWS were less likely on average to close than non-claimants, and that claimants in the most affected industries (such as accommodation and food services) were most likely to report rehiring workers. Moreover, while aggregate employment among CEWS claimants has not reached its pre-pandemic level before the end of the period considered in this study, the average employment at surviving businesses that claim the CEWS is actually higher than it was before the pandemic, and follows a trend similar to that among non-claimants.
5. Equity Evaluation
This section evaluates the TWS and CEWS from an equity perspective, assessing whether they provided an equitable distribution of benefits across dimensions such as industry, province and gender. To describe program reach, a key metric is the take-up rate, which represents the share of eligible employers that received wage subsidies. Take-up rates were calculated by dividing the total number of employers that received CEWS by the total number of businesses with employees according to payroll data prior to the pandemic.
5.1 Distribution of the Temporary Wage Subsidy
The TWS was designed to support small- and medium-sized employers across the economy who may have struggled to maintain their payrolls as COVID-19 restrictions disrupted their operations. As such, eligibility was extended to individuals (excluding trusts), registered charities, non-profit organizations, certain partnerships, and CCPCs that have taxable capital in the previous taxation year (or at the start of the subsidy period where it is their first taxation year) below $15 million.Footnote 23
As mentioned in section 4.2, 88% of TWS claimants were CCPCs. Table 4 shows TWS take-up among eligible CCPCs by industry.Footnote 24 Take-up was particularly high in the Agriculture, forestry, fishing and hunting and Health care and social assistance industries, where respectively 39.8% and 32.2% of all eligible CCPCs made use of the TWS, while representing 5.9% and 12.6% of overall unique applicants.
The distribution of take-up by province shows that it was the highest in New Brunswick and Manitoba, where 2.2% and 3.4% of applicants are located, respectively (Table 5).
| Industry | Take-up (%) | Share of unique applicants (%) | |
|---|---|---|---|
| Agriculture, forestry, fishing and hunting | 39.8 | 5.9 | |
| Health care and social assistance | 32.2 | 12.6 | |
| Utilities | 30.0 | 0.1 | |
| Retail trade | 29.3 | 10.5 | |
| Manufacturing | 28.8 | 4.9 | |
| Construction | 28.5 | 15.3 | |
| Professional, scientific and technical services | 27.6 | 15.1 | |
| Wholesale trade | 27.3 | 4.3 | |
| Mining, quarrying, and oil and gas extraction | 26.6 | 0.7 | |
| Administrative and support, waste management and remediation services | 25.7 | 4.3 | |
| Finance and insurance | 25.5 | 2.3 | |
| Other services (except public administration) | 25.3 | 6.8 | |
| Information and cultural industries | 23.4 | 1.1 | |
| Accommodation and food services | 22.5 | 6.2 | |
| Educational services | 21.4 | 1.0 | |
| Real estate and rental and leasing | 20.2 | 2.9 | |
| Arts, entertainment and recreation | 18.5 | 1.2 | |
| Transportation and warehousing | 18.2 | 4.6 | |
| Management of companies and enterprises | 15.2 | 0.3 | |
| Average/ Total | 26.9 | 100.0 | |
| Notes: Total shares of applicants may not add up to 100% due to rounding. Estimates are based on total private sector employers that submitted PD7 forms to CRA in 2019 and the average monthly number of employees they reported, as well as CEWS claims submitted as of September 27, 2021. | |||
| Province | Take-up (%) | Share of unique applicants (%) |
|---|---|---|
| New Brunswick | 32.6 | 2.2 |
| Manitoba | 30.7 | 3.4 |
| Saskatchewan | 30.6 | 3.3 |
| British Columbia | 29.2 | 17.4 |
| Quebec | 28.5 | 21.9 |
| Newfoundland | 26.9 | 1.0 |
| Alberta | 26.5 | 13.5 |
| Nova Scotia | 24.8 | 2 |
| Ontario | 24.4 | 34.7 |
| Prince Edward Island | 24.2 | 0.4 |
| Yukon | 21.4 | 0.1 |
| Northwest Territories | 18.8 | 0.1 |
| Nunavut | 12.2 | 0 |
| Average/ Total | 26.9 | 100.0 |
| Notes: Total shares of applicants may not add up to 100% due to rounding. Estimates are based on total private sector employers that submitted PD7 forms to CRA in 2019 and the average monthly number of employees they reported, as well as CEWS claims submitted as of September 27, 2021. Provinces are assigned to employers based on the address provided on tax returns. Employers that operate in more than one province are assigned to one province only. | ||
Although the TWS did not provide direct benefits across all employers and employees, from a macro-economic stabilization perspective, all groups and sectors of the economy may have indirectly benefitted from this measure. The liquidity support provided through the TWS, combined with the support from other components of the Government's Covid-19 Economic Response Plan, helped stabilize the economy, thereby indirectly supporting all groups and sectors of the economy.
5.2 Distribution of the Canada Emergency Wage Subsidy
The CEWS is a broad-based program, designed to ensure that all employers who have suffered revenue declines during the pandemic have the support and certainty they need to keep employees on payroll. In this respect, program parameters were chosen to ensure that the program is accessible to a wide range of employers of different sizes and across different regions and sectors. For example, eligibility requirements are quite broad and the program also includes flexibilities (e.g., approach to calculate revenue decline, accounting method to determine qualifying revenue, etc.) to minimize any variability in support between different types of employers. In addition, eligibility has been extended over time to additional groups and the rate structure has also been modified to ensure the program remains equitable and provides support proportional to the level of revenue decline.
As shown in Table 6, the composition of types of employers that received the CEWS is roughly proportional to the composition of types of employers in the economy as a whole. However, a slightly higher share of employees supported by CEWS were in CCPCs than were employed by CCPCs in the economy as a whole. As in the economy generally, a relatively small share of CEWS recipients are public corporations.
| Share of employers (%) | Share of employers that received CEWS (%) | Share of employees (%) | Share of employees in CEWS claimants (%) | |
|---|---|---|---|---|
| CCPCs | 87.5 | 86.7 | 60.1 | 66.5 |
| Other corporations | 6.5 | 6.3 | 15.4 | 14.9 |
| Charities and NPOs | 4.7 | 4.7 | 6.3 | 7.1 |
| Partnerships | 1.2 | 1.8 | 4.1 | 4.9 |
| Public corporations (including corporations controlled by public corporations) | 0.5 | 0.4 | 14.1 | 6.6 |
| Total | 100.0 | 100.0 | 100.0 | 100.0 |
| Notes: Total shares of employers may not add up to 100% due to rounding. Estimates are based on total private sector employers that submitted PD7 forms to CRA in 2019 and the average monthly number of employees they reported, as well as CEWS claims submitted as of September 27, 2021. Employers which could not be assigned a 'Type' based on tax information are excluded. | ||||
Take-up rates by industry (Table 7) suggest that the CEWS was accessed by a broad range of private sector businesses experiencing revenue losses across Canada. Take-up was highest in the Accommodation and food services industry, with 67% of businesses receiving support, and lowest in the Finance and insurance (19.2%), and Real estate, rental and leasing (21.8%) industries.Footnote 25 Differences in take-up rates by industry are associated with findings from Statistics Canada's Canadian Survey of Business Conditions. Generally speaking, industries with above average take-up rates, such as Manufacturing, Retail trade and Accommodation and food services also had above average rates of experiencing shut down due to COVID-19 restrictions and below- average rates of remaining fully operational throughout the pandemic. According to the survey, these industries also have a greater than average share of businesses reporting revenue decreases between 2019 and 2020.
| Industry | Take-up (%) | Share of unique applicants (%) |
|
|---|---|---|---|
| Accommodation and food services | 67.0 | 9.9 | |
| Manufacturing | 58.2 | 6.2 | |
| Arts, entertainment and recreation | 53.6 | 1.4 | |
| Educational services | 52.6 | 1.2 | |
| Other services (except public administration) | 48.7 | 5.9 | |
| Wholesale trade | 48.5 | 4.9 | |
| Health care and social assistance | 45.2 | 9.1 | |
| Retail trade | 43.2 | 8.9 | |
| Construction | 41.1 | 12.5 | |
| Information and cultural industries | 40.0 | 1.1 | |
| Administrative and support, waste management and remediation services | 38.9 | 3.7 | |
| Mining, quarrying, and oil and gas extraction | 35.7 | 0.6 | |
| Agriculture, forestry, fishing and hunting | 31.1 | 2.7 | |
| Professional, scientific and technical services | 29.9 | 9.7 | |
| Utilities | 28.5 | 0.1 | |
| Real estate and rental and leasing | 21.8 | 2 | |
| Transportation and warehousing | 21.5 | 3.5 | |
| Finance and insurance | 19.2 | 1.2 | |
| Management of companies and enterprises | 17.2 | 0.3 | |
| Average/ Total | 42.2 | 100.0 | |
| Notes: Total shares of applicants may not add up to 100% due to rounding. Estimates are based on total private sector employers that submitted PD7 forms to CRA in 2019 and the average monthly number of employees they reported, as well as CEWS claims submitted as of September 27, 2021. | |||
Unlike the TWS, the CEWS did not have limits on the number of employees that could be supported. CEWS take-up rates also varied according to business size, with take-up highest among employers with 20 to 99 employees prior to the onset of the pandemic (Table 8).
| Size | Take-up (%) | Share of unique applicants (%) | |
|---|---|---|---|
| Fewer than 5 employees | 30.7 | 49.7 | |
| 5 to 19 employees | 65.5 | 34.0 | |
| 20 to 99 employees | 70.4 | 14.1 | |
| 100 or more employees | 63.3 | 2.1 | |
| Average/ total | 42.2 | 100 | |
| Notes: Total shares of applicants may not add up to 100% due to rounding. Estimates are based on total private sector employers that submitted PD7 forms to CRA in 2019 and the average monthly number of employees they reported, as well as CEWS claims submitted as of September 27, 2021. | |||
Finally, Table 9 illustrates that take-up rates vary across provinces. This provincial variation is partially attributable to industry distribution. For example, CEWS take-up is generally higher in Atlantic provinces than in other parts of Canada, despite lower average incidence of COVID-19.Footnote 26 This is in part due to the relative importance to the region of industries that rely on tourism such as Accommodation and food services, and the disruption to these industries caused by provincial and international restrictions on travel. Similarly, high take-up in Quebec is partly attributable to a higher proportion of businesses in both Accommodation and Food services and Manufacturing.
| Province | Take-up (%) | Share of unique applicants (%) | |
|---|---|---|---|
| New Brunswick | 51.9 | 2.1 | |
| Prince Edward Island | 51.5 | 0.5 | |
| Quebec | 50.5 | 24.6 | |
| Newfoundland | 48.9 | 1.2 | |
| Nova Scotia | 47.1 | 2.2 | |
| Nunavut | 43.8 | 0 | |
| Northwest Territories | 41.9 | 0.1 | |
| Yukon | 40.0 | 0 | |
| British Columbia | 39.9 | 14.7 | |
| Ontario | 39.6 | 35.9 | |
| Alberta | 39.2 | 13.4 | |
| Saskatchewan | 38.1 | 2.6 | |
| Manitoba | 37.6 | 2.5 | |
| Average/ Total | 42.2 | 100.0 | |
| Notes: Total shares of applicants may not add up to 100% due to rounding. Estimates are based on total private sector employers that submitted PD7 forms to CRA in 2019 and the average monthly number of employees they reported, as well as CEWS claims submitted as of September 27, 2021. Provinces are assigned to employers based on the address provided on tax returns. Employers that operate in more than one province are assigned to one province only. | |||
The share of the private sector labour force supported, or the CEWS coverage rate, is another perspective on the importance of the program. Industries that were highly affected, as evidenced by above-average take-up rates and revenue losses, generally also had an above-average share of the private sector labour force supported.
Considering program reach by examining labour force composition also enables a discussion of equity in terms of types of employees that the CEWS supported and if groups that may be disadvantaged in the labour market benefitted from the program. Table 10 complements Table 8 by showing coverage rates across industries that received at least 5% of total CEWS payouts. Of these eight industries, Retail trade, Health care and social assistance, and Accommodation and food services had a larger than average share of female employees. Retail trade and Accommodation and food services were also the only industries with a larger than average share of youth employment (defined as employees under age twenty-five), which is consistent with a quarter of all youth employment occurring in these industries.Footnote 27 These industries also have below-average payout rates, which reflect the fact that they are generally lower wage and have a higher share of part-time workers.Footnote 28
Overall, given the demographic profiles of sectors that have benefitted from the CEWS, men and more established workers may be slightly more likely to be covered by the wage subsidy than women and younger workers.
| Industry | Share of all employees in industry covered by CEWS (%) | Coverage rate: Average share of private sector labour force covered by CEWS (%) | Share of female employees in industry (%) | Share of employees under 25 in industry (%) | Average payout, P1 to P11 ($) | Average payout, after P8 ($) | |
|---|---|---|---|---|---|---|---|
| Manufacturing | 15.3 | 43.7 | 27.4 | 8.4 | 1,714 | 873 | |
| Accommodation and food services | 13.5 | 54.9 | 55.5 | 41.2 | 841 | 541 | |
| Retail trade | 10.6 | 23.9 | 51.6 | 29.7 | 1,024 | 438 | |
| Construction | 9.7 | 33.3 | 12.3 | 10.6 | 1,821 | 1,083 | |
| Professional, scientific and technical services | 7.2 | 23.3 | 41.3 | 7.8 | 1,840 | 1,066 | |
| Wholesale trade | 6.5 | 49.8 | 31.0 | 6.7 | 1,660 | 789 | |
| Health care and social assistance | 6.4 | 23.9 | 80.8 | 9 | 1,172 | 569 | |
| Transportation and warehousing | 5.1 | 29.7 | 21.6 | 8.5 | 1,742 | 1,058 | |
| Other | 25.6 | 30.3 | 46.3 | 11.6 | 1,484 | 870 | |
| Total/average | 100.0 | 32.7 | 42.9 | 15.2 | 1,447 | 793 | |
| Notes: Total shares of employees may not add up to 100% due to rounding. Selected industries all received at least 5% of total CEWS payouts. Estimates are based on average total employees reported by CEWS claimants between P1 and P11. Labour force demographic statistics are based on Statistics Canada Table 14-10-0023-01, Labour force characteristics by industry, annual. | |||||||
It is worth noting that efforts were made as the CEWS evolved to ensure that the program was accessible to a broad range of employers and employees. For example, in May 2020, eligibility was extended to groups that had been inadvertently excluded when the program was launched, including partnerships with one or more non-eligible members, registered Canadian Amateur Athletic Associations, registered journalism organizations and others. In addition, amendments were introduced to better support employees returning from extended leave, such as parental or disability leave. These amendments allowed employers to use an alternative period to calculate the baseline remuneration of their employee in cases where the employee was on leave during the baseline period originally intended to be used (January 1 to March 15, 2020). In response to stakeholder feedback, eligibility was also extended in July 2020 to employers who had experienced a revenue decline of less than 30%.
5.3 Summary on Equity
The data presented in this section show that the wage subsidies put in place by the Government followed principles of equity, and were available to a broad range of employers: primarily CCPCs, but also public corporations, charities and NPOs, as well as partnerships. Take-up rates across provinces and industries are variable but illustrate that the programs benefited employers and workers across the country. Evidence on the labour force composition of CEWS recipients, meanwhile, suggests that men and more established workers were slightly more likely to be covered than women and younger workers, given the composition on the industries in which they work, and how these were affected by the pandemic.
6. Efficiency Evaluation
Whether a policy is effective in achieving its stated objectives is an important criterion for its evaluation, but also of importance is whether the policy is efficient; that is, whether the measure achieved its stated objectives in a cost-minimizing fashion, or alternatively, maximized the benefits attained for a given level of costs incurred. Therefore, the extent to which the wage subsidies have achieved their objective of preserving employment in the midst of the pandemic must be weighed against the costs that result from the introduction of the measure. This discussion focuses on the CEWS, as there is limited data available with respect to the short-lived TWS and as the CEWS became the main support program for businesses facing the adverse effects of the pandemic.
Evaluating the overall efficiency of the program must go beyond simply estimating the average CEWS payout per job saved. To that end, establishing a cost-benefit framework is useful to present the major elements to be considered. On one hand, the total costs of the CEWS go beyond the fiscal cost of the program itself and include other impacts it may have on the economy. On the other hand, the benefits should also account for its broader consequences, and not merely the benefits for businesses and employees whose jobs were potentially saved. In particular, in the context of a very sharp economic downturn, the benefits of avoiding a prolonged recession can have much longer-term implications than what can be observed in the short term. Thus, the economic context in which the wage subsidies were introduced and their broader economic impacts must be taken into consideration.
The remainder of this section provides a high-level discussion of the direct and indirect costs and benefits that should be considered.
6.1 Direct and indirect costs
The direct fiscal cost of the wage subsidy is a function of the design parameters of the program and the take-up of businesses that qualify. One obvious factor that influenced the cost of the CEWS is the Government's intention that the program be widely available to entities affected by the pandemic. During the initial four periods of coverage of the CEWS, i.e., March 15 to July 4, 2020, a total of over $36.4 billion in CEWS was paid out (nearly 42% of the total for the first 15 periods, Table 3). The large payouts in the first four periods reflect high take-up in the early days of the pandemic and the generous subsidy rate available starting at a revenue drop of 30%.
The initial program requirement of a 30% revenue drop did ensure that the subsidy was targeted at businesses that had been negatively impacted by the pandemic. In addition, the generosity of the subsidy, i.e., a flat 75% during the first four periods, ensured that some hard-hit businesses could keep more employees on the payroll.
At the beginning of Period 5, a new rate structure for the CEWS was introduced, which provided support proportional to the level of revenue decline. In Period 7, following the sunsetting of the "safe harbour" clause,Footnote 29 subsidy rates decreased.Footnote 30 Tying the subsidy rate to revenue losses improved targeting, because claimants with high revenue losses were experiencing less demand and this could correlate with a greater need for a subsidy to encourage them to keep employees on payrolls. Overall, these changes reduced the cost of the program from an average of $2,260 per employee in P2 to P4 to an average of $1,400 per employee for a comparable claimant in P11.Footnote 31
Beyond the direct costs, government programs can result in other costs from indirect consequences. Though such indirect effects often cannot be readily measured, four effects are discussed in this context. The first effect is the potential that the CEWS has discouraged growth for businesses that qualified, as an increase in revenues could have eliminated access to an important government subsidy. Over the first four periods, the main design feature that determined the eligibility was the 30% revenue drop rule (15% in the first period). This rule was modified in Period 5, with the introduction of a sliding scale to determine the level of subsidy and eliminate this so-called cliff effect.
The second potential effect is to subsidize businesses that will not be viable when the pandemic and subsidies end, which can therefore result in an inefficient allocation of resources. In a healthy and innovative economy, businesses that fall behind competitors exit markets and their resources are then reallocated to more productive ends. In the context of the pandemic, this effect is believed to be less important, as a number of businesses are not suffering because of inherent economic or productivity reasons, but rather because of the external pandemic context and associated health and safety restrictions.
The third indirect effect is the loss of economic activity associated with financing the wage subsidies via taxation or debt. An opportunity cost could exist if the economic benefits of introducing a wage subsidy are less than those under an alternative use of the funds.
Finally, the efficiency of the CEWS can also be evaluated in terms of administration costs for the Government and the compliance costs for claimants. At the onset of the pandemic, it was essential that support be provided to businesses as quickly as possible given the emergency context. In order to expedite subsidy payments to applicants and for ease of administration, a decision was made to deliver the CEWS through the tax system. By using the tax system, the Government was able to legislate objective rules in the Income Tax Act that could accommodate a broad range of businesses, while still maintaining the integrity of the program by using an existing architecture of rules that enables the Canada Revenue Agency to audit and review claims. This was important in facilitating rapid and efficient administration and delivery of benefits.
As the program has evolved, efforts have also been made to simplify planning and provide greater certainty for claimants. For example, when the new rate structure was implemented in July 2020, a "safe harbour" rule was introduced to provide certainty to businesses that had already made business decisions for July and August by ensuring that they would not receive a subsidy rate lower than under the previous rules. Similarly, under the "deeming rule", applicants can choose the current or previous period to calculate their revenue decline. This effectively ensures that they can continue to receive support for one additional period after their revenue recovers. In addition, educational material, including frequently asked questions and tools for applicants (e.g., subsidy calculator, application guide), were published regularly on the CRA website to enhance program understanding and simplify planning for applicants. Together these features helped minimize administration costs and other barriers to application for claimants.
6.2 Direct and indirect benefits
The direct beneficiaries of the wage subsidies are the employees whose wages were supported by the programs. As discussed in the effectiveness section, data has shown that starting in June 2020, employment began rising among claimants as they hired and rehired while remaining relatively stable among non-claimants. The CEWS claimants were also less likely to close than non-claimants, on average from February 2020 to March 2021. This is corroborated by Leung and Liu (2022) who found evidence on the correlation between claiming the CEWS and the probability of not being closed and as well as higher employment growth. Absent the CEWS, additional closures or layoffs could have had a significant negative impact on employees.
In addition to the direct benefits, there are other possible indirect benefits that may have resulted from the wage subsidies; two will be discussed in this section. The first is the extent to which the subsidies have helped maintain macroeconomic stability. The second is the extent to which the subsidies help avoid drops in productivity.
The CEWS was introduced rather early in the pandemic, with payments retroactive to March 15, roughly coinciding with the first mandated closures. It became apparent that the economy was likely to take a very sharp downward turn, more profound and faster than any other experienced in modern times. When faced with severe downturns, additional fiscal policy measures, i.e., fiscal stimulus measures, are often deemed necessary when monetary policy responses and automatic stabilizersFootnote 32 are not sufficient to maintain aggregate demand. Fiscal stimulus measures, financed through increased borrowing in the short term, reinject funds in the economy where the recipients use these funds to make purchases (e.g., businesses and employees in this context) from goods and services providers who will in turn make purchases of their own to other suppliers. The initial funds provided thus continue circulating, creating a multiplier effect. In the absence of fiscal stimulus, loss of income from affected businesses and employees would reduce their spending and lower demand for other goods and services.
The CEWS has been one of the largest conduits for stimulus funds to be reinjected into the economy to boost demand and accelerate the recovery. Delivering support more quickly than typical government spending programs and public works would normally have, and targeting businesses and their employees that have been impacted by the pandemic, aimed to ensure that demand from those affected would be prevented from falling too rapidly. Estimates made in the context of Budget 2021 evaluated the total direct support in the economic response plan at $219 billion for fiscal year 2020-21, of which the CEWS represented 38.6%.
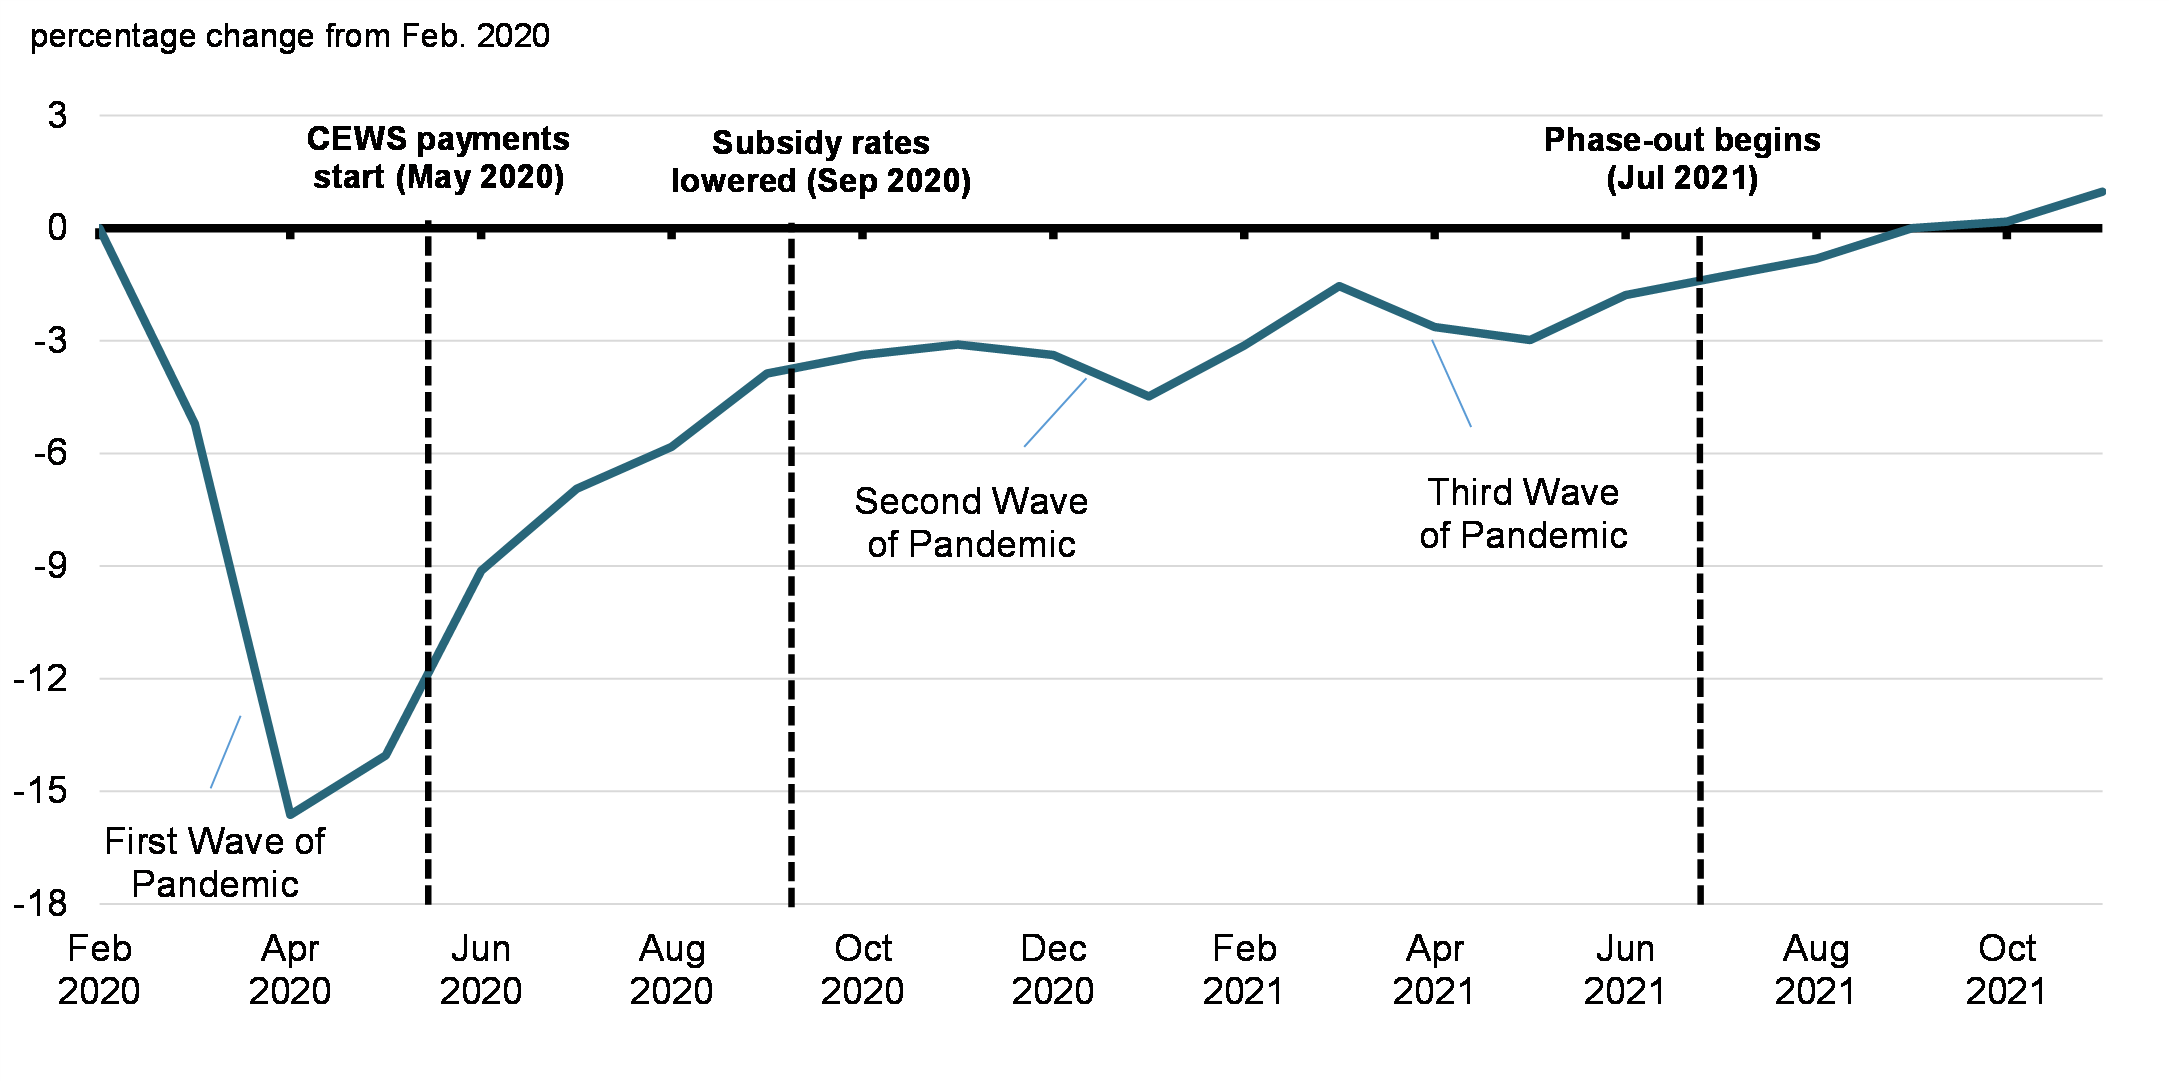
The sum of actions taken by the Government have produced results that contributed to the recovery in terms of the major macroeconomic indicators such as GDP (as shown in Chart 2). More directly, the CEWS has contributed to hastening the recovery in employment in the months following the first wave of the pandemic, and to sustaining employment during the subsequent waves (Chart 11). Without a rapid response, it is possible that the recovery could have dragged on for a significant period.
Employment recovery path
The second indirect effect is to prevent a drop in productivity over the longer term. Because the effects of a prolonged recession can last longer than the recession itself, the benefits of recovery measures that help prevent a prolonged recession can therefore also last for much longer. Two benefits that have effects over the longer term are particularly important: the negative impact of capital underutilization and lack of investment, and the effects on human capital.
In a prolonged recession, because of reduced demand for goods and services, unused or underused capital can lead to reductions in the returns on investment, and to firms delaying further investment decisions. A fall in investment not only reduces economic activity in the short term but also to a reduction in productivity over the longer term. With lower investments may come lower labour productivity and delays in the adoption of new technologies, which can further lower productivity and competitiveness over time. However, business gross fixed capital formation has recovered to its pre-pandemic level in the fourth quarter of 2020 and has exceeded it since.Footnote 33 The CEWS may have played a role by providing an income stream, helping with business liquidity and allowing for some funds to be available for new investments.
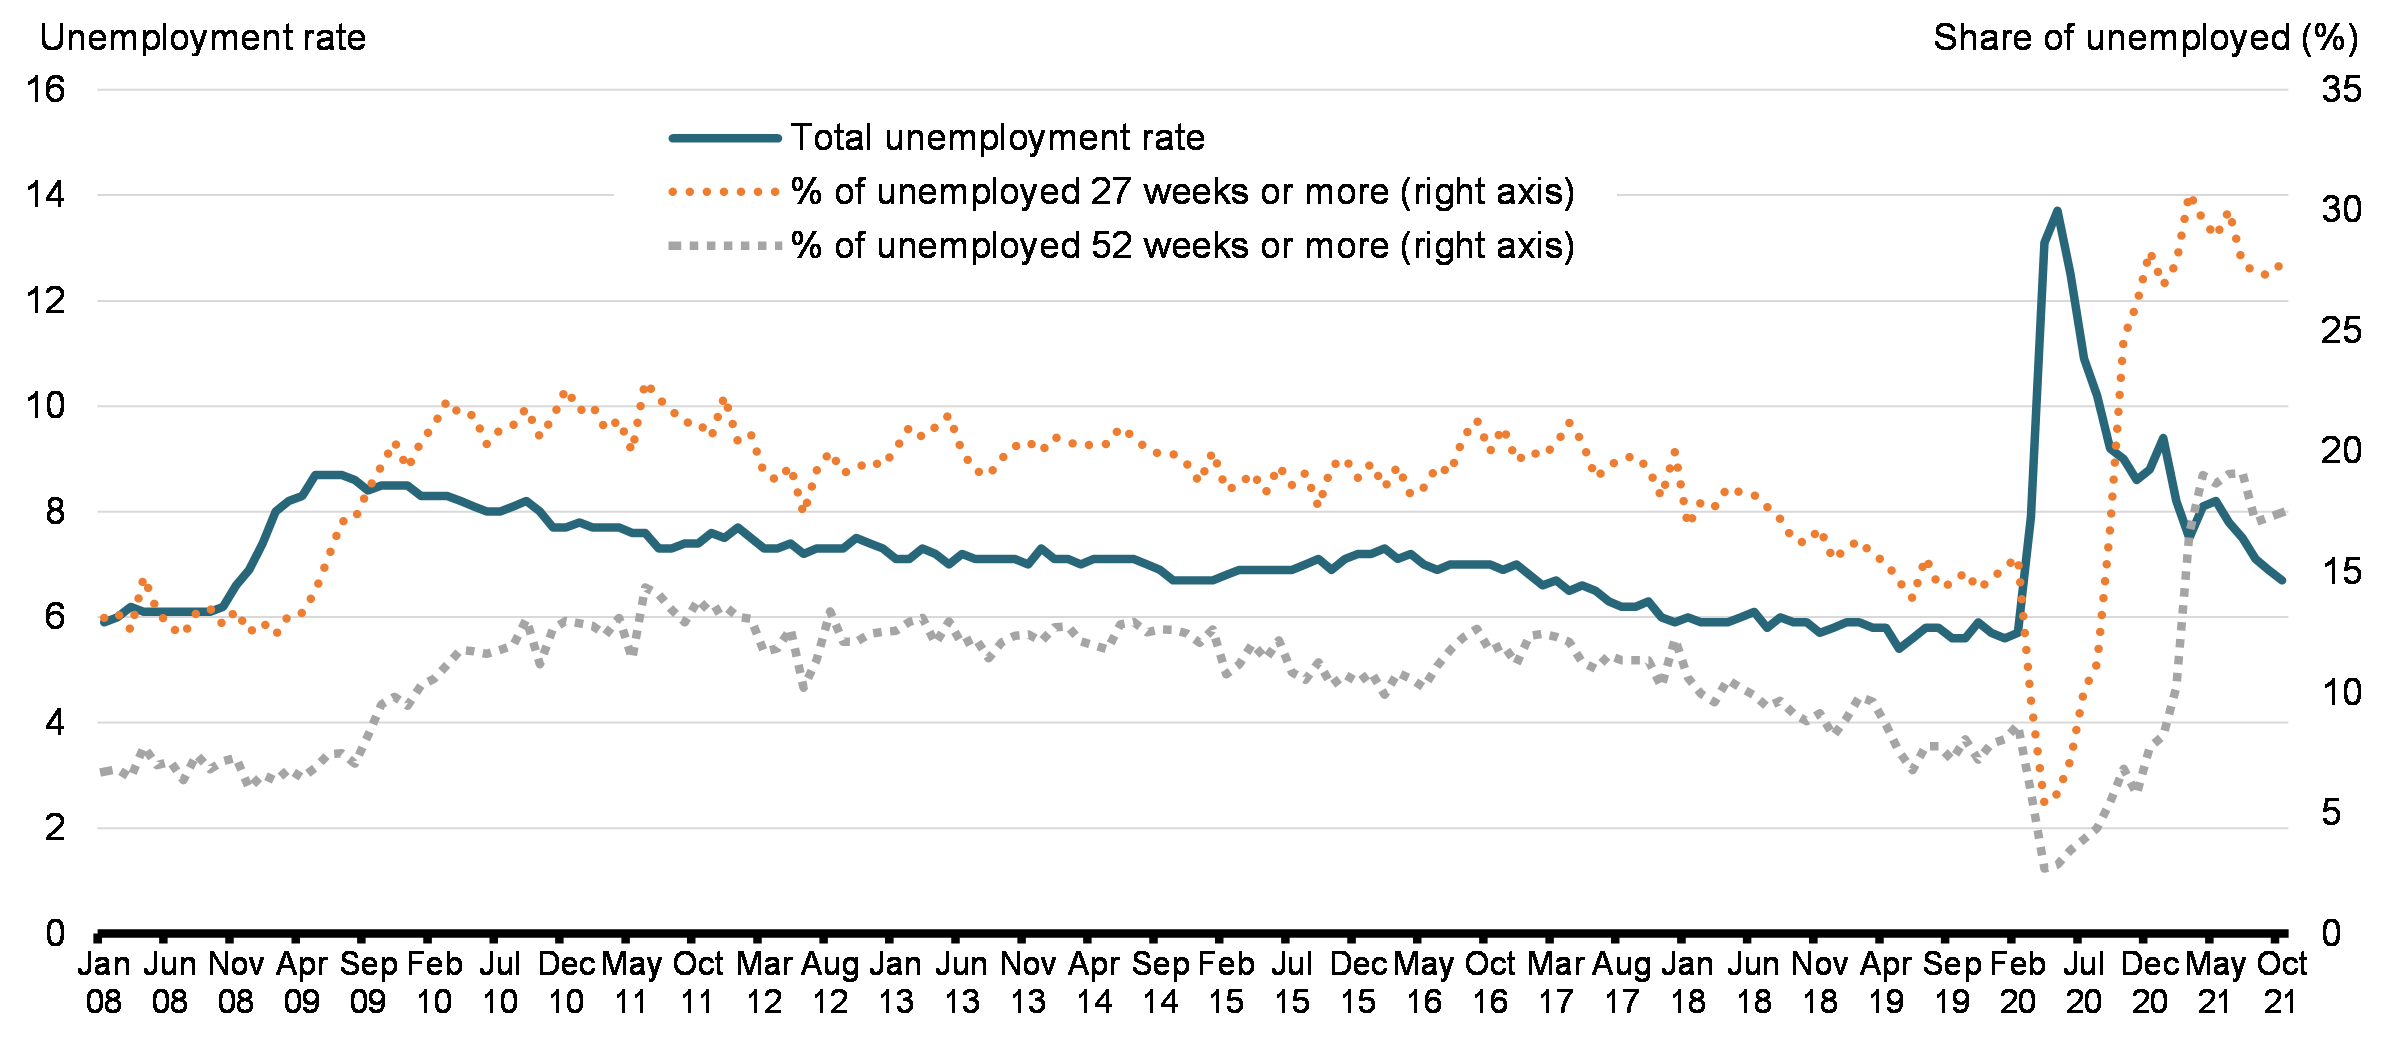
On the human capital side, an extended spell of unemployment can diminish job skills and the ability to return to the labour market once the recession fades. As discussed in the relevance section (section 3), unemployment is also associated with adverse health and economic outcomes for workers, their families and their communities, particularly in the case of long-term unemployment. In October 2021 (last update at the time of writing this report), the unemployment rate in Canada fell to 6.7%, inching closer to pre-pandemic levels, but the share of those unemployed that have been continuously unemployed for more than 27 weeks or 52 weeks has risen sharply (Chart 12). This suggests that the pandemic has had lasting effects on certain categories of workers and there are likely to be longer term consequences for the most affected workers. In comparison to the 2008-09 recession, there is now evidence that long-term unemployment is impacting a greater share of the unemployed. By helping businesses keep employees on the payroll, the CEWS may have to some extent prevented workers of falling into long-term unemployment and reduce the associated risks of enduring socio-economic hardship.
Unemployment rate, and share of long-term unemployment
6.3 Summary on Efficiency
This study finds that the wage subsidies put in place by the Government were efficient.
A subsidy program of the magnitude of the CEWS, in the unprecedented context of a pandemic shutting down large segments of the economy, has certainly led to a very wide range of consequences for the economy and society. The direct costs of providing the program were large, $87.1 billion to date during the first 15 periods. But the benefits of the subsidies are numerous as well. The subsidies have prevented business closures and encouraged businesses to rehire employees, or keep employees on the payroll. Beyond the benefits of protecting employment, the subsidies were a part of the Government's recovery plan that has shored up demand and helped the recovery in the short-term. And by helping to prevent a prolonged recession, the subsidies have possibly prevented longer term reductions in capital and labour productivity which could yield benefits into the future.
7. Conclusion
On balance, recognizing the limited information available and the context in which the wage subsidies were introduced, it is reasonable to conclude that these subsidies were relevant, effective at meeting their objectives, equitable and efficient.
The TWS and CEWS were designed and administered by the Government in the context of an extraordinary health and economic crisis. From the launch of the TWS in March 2020, to the rapid expansion of support through the CEWS and its evolution as the pandemic wore on, these programs provided unprecedented assistance to Canadian businesses and workers affected by COVID-19. The relevance of the measures is set against this backdrop and in respect of the Government's roles and responsibilities in helping employers and workers cope with the sudden decline in business activity, as well as supporting provincial and territorial governments by providing a consistent, nation-wide approach to stabilizing the economy. The Government's provision of temporary wage subsidies also mirrors the response observed in countries across the world.
The evidence presented supports the notion that the programs helped claimant businesses and workers. Alongside feedback from stakeholders and some academic studies indicating the CEWS or similar payroll subsidies are generally effective, the data show that businesses claiming the CEWS were less likely on average to close than non-claimants, and that those in the most affected industries (such as Accommodation and food services) were most likely to report rehiring workers. Moreover, while aggregate employment among CEWS claimants has not reached its pre-pandemic level before the end of the period considered in this study, the average employment at surviving businesses that claim the CEWS is actually higher than it was before the pandemic, and follows a trend similar to that among non-claimants.
In examining whether the measures were equitable in their distribution of support, the data reveal a broad range of employers claimed both the TWS and CEWS: primarily CCPCs, but also public corporations, charities and NPOs, as well as partnerships. Take-up rates, although variable, also show the programs reached employers of different sizes across the country and across industries. With respect to the CEWS in particular, the evidence suggests that men and more established workers were slightly more likely to be covered than women and younger workers, given the composition on the industries in which they work, and how these were affected by the pandemic.
Finally, while the cost of the programs were substantial, their benefits in terms of sustaining employment, preventing business closures and supporting the economic recovery were also tremendous. In particular, there are substantial indirect benefits of preventing a prolonged recession that, once fully accounted for, supports the overall assessment that the CEWS has fulfilled its objectives in an efficient manner.
References
Anderson, P.A. and B.D. Meyer (2000). “The effects of the unemployment insurance payroll tax on wages, employment, claims and denials”, Journal of Public Economics 78: 81-106.
Autor, D., Cho, D., Crane, L.D., Goldar, M., Lutz, B., Montes, J., Peterman, W.B., Ratner, D., Villar, D., and A. Yildirmaz (2020). “An Evaluation of the Paycheck Protection Program Using Administrative Payroll Microdata”, MIT Working Paper.
Bíró, A., Branyiczki, R., Lindner, A., and L. Márk (2021). “The Impact of Payroll Tax Subsidies: Theory and Evidence”, forthcoming.
Boockmann, B., Zwick, T., Ammermüller, A., and M. Maier (2007). “Do Hiring Subsidies Reduce Unemployment Among the Elderly? Evidence From Two Natural Experiments”, ZEW Discussion Paper No. 07-001.
Brown, A., Merkl, C., and D.J. Snower (2007). “Comparing the Effectiveness of Employment Subsidies”, IZA Discussion Paper No. 2835.
Chetty, R., Friedman, J. N., Hendren, N., Stepner, M., and The Opportunity Insights Team (2020). “How Did COVID-19 and Stabilization Policies Affect Spending and Employment? A New Real-Time Economic Tracker Based on Private Sector Data”, NBER Working Paper 27431.
Cahuc, P., Carcillo, S., and T. Le Barbanchon (2014). “Do Hiring Credits Work in Recessions? Evidence from France”, IZA Discussion Paper No. 8330.
Corak, M. (2021). “The Canada Emergency Wage Subsidy as an employer-based response to the pandemic: First steps, missteps, and next steps”. Accessed November 18, 2021.
Collischon, M., Cygan-Rehm, K., and R.T. Riphahn (2020). “Employment Effects of Payroll Tax Subsidies”, IZA Discussion Paper No. 13037.
Garsaa, A. and N. Levratto (2015). “Do labor tax rebates facilitate firm growth? An empirical study on French establishments in the manufacturing industry, 2004-2011.” Small Business Economics, 45: 613-641.
Giupponi, G., Landais, L. and A. Lapeyre (2021). “Should We Insure Workers or Jobs During Recessions?”. Accessed November 4, 2021.
Gruber, J. (1997). “The Incidence of Payroll Taxation: Evidence from Chile”, Journal of Labor Economics 15(3-2): 72-101.
Hale, T., Angrist, N., Cameron-Blake, E., Hallas, L., Kira, B., Majumdar, S., Petherick, A., Phillips, T., Tatlow, H., and S. Webster. (2020). “Variation in Government Responses to COVID-19” Version 7.0. Blavatnik School of Government Working Paper. May 25, 2020.
Huttunen, K., Pirttilä, J., and R. Uusitalo (2013). “The employment effects of low-wage subsidies”, Journal of Public Economics, 97: 49-60.
Kangasharju, A. (2007). “Do Wage Subsidies Increase Employment in Subsidized Firms?”, Economica, 74: 51-67.
Lafrance-Cooke, A., R. Macdonald, and M. Willox (2020). “Monthly Business Openings and Closures: Experimental Series for Canada, the Provinces and Territories, and Census Metropolitan Areas,” Economic Insights, Statistics Canada Catalogue no. 11-626-X — 2020014 - No. 116.
Lenjosek, G. J. (2004). “A Framework for Evaluating Tax Measures and Some Methodological Issues”, in Polackova B., H., Valenduc, C., and Swift, Z. L. (ed) Tax Expenditures – Shedding Light on Government Spending through the Tax System: Lessons from Developed and Transition Economies. The World Bank, 19-32.
Leung, D. and H. Liu (2022). "The Canada Emergency Wage Subsidy Program and Business Survival and Growth During the COVID-19 Pandemic in Canada", Statistics Canada.
Leung, D. (2021). “Characteristics of businesses that closed during the COVID-19 pandemic in 2020,” Economic and Social Reports, Statistics Canada Catalogue no. 36-28-0001.
Nichols, A., Mitchell, J., and S. Lindner (2013). “Consequences of Long-Term Unemployment”’, Urban Institute.
Neumark, D. (2013). “Spurring Job Creation in Response to Severe Recessions: Reconsidering Hiring Credits”, Journal of Policy Analysis and Management, 32(1): 142-171.
OECD (2021). “OECD Employment Outlook 2021: Navigating the COVID-19 Crisis and Recovery”, OECD Publishing, Paris.
Rubolino, E. (2021). “Taxing the Gender Gap: Labor Market Effects of a Payroll Tax Cut for Women in Italy”. Accessed December 23, 2021.
Saez, E., Schoefer, B. and D. Seim (2019). “Payroll Taxes, Firm Behavior, and Rent Sharing: Evidence from a Young Workers’ Tax Cut in Sweden”, American Economic Review, 109(5): 1717-1763.
Smart, M. (2020). “Boos for CEWS”. Finances of the Nation. Accessed November 18, 2021.
Annex 1: Program Details
| CEWS | TWS | |
|---|---|---|
| Short description | Wage subsidy (via direct payment) for eligible employers that have experienced a decline in revenues due to COVID-19 | Wage subsidy (via payroll remittance reduction) for eligible employers. No revenue reduction necessary. |
| Claiming the Subsidy | Application required for each claim period through CRA's web-based application system. Employers were initially required to apply by October 2020. This deadline was subsequently modified as the program evolved. Employers must currently file an application by the later of February 1, 2021 and 180 days after the end of a claim period. | No application necessary. Eligible employers calculate their subsidy and reduce their payroll remittances of federal, provincial and territorial income tax, accordingly. Eligible employers required to submit a self-identification form to the CRA for the subsidy amount they claimed. |
| Eligible employers | For-profit corporations, individuals, registered charities, non-profit organizations, and other prescribed organizations with a CRA payroll account as of March 15, 20201. | Primarily designed to support small and medium sized businesses, including: individuals or sole proprietors (excluding trusts), partnerships, non-profit organizations, registered charities, Canadian-controlled private corporations. |
| Minimum revenue-decline threshold | >15% (March 15 to April 11, 2020) >30% (April 12 to July 4, 2020) >0% (July 5, 2020 to July 4, 2021) >10% (July 5 to October 23, 2021) |
N/A |
| Eligible employees | Active and furloughed employees | Active employees |
| Maximum eligible remuneration | $1,129 per week per active employee | Equivalent to total remuneration of $13,750 per employee and $250,000 per employer between March 18 and June 19 2020 |
| Subsidy rate (active employees) | At its most generous, up to 85% of eligible remuneration.2 Between July 4 and October 23, 2021, subsidy rates gradually declined from a maximum of 60% to 20%. |
10% of remuneration paid for the period |
| Subsidy rate (furloughed employees) | Aligned with benefits provided under the Canada Emergency Response Benefit and/or Employment Insurance system, as of August 30, 2020. | N/A |
| Available as of | March 15, 2020 | March 18, 2020 |
| Available until | August 28, 2021 (furloughed employees) October 23, 2021 (active employees)3 |
June 19, 2020 |
| Notes: 1Entities without a payroll account on March 15 could still qualify if a) another person or partnership made remittances on their behalf or b) they purchased all (or almost all) of another person's or partnership's business assets. 2 For a complete history of subsidy rates, see Section 2.4 and Chart 1. 3 After October 23, 2021, the broad-based CEWS program for active employees expired and was replaced by three new targeted programs specifically for tourism, hospitality and other hard-hit employers. |
||
| Period | Dates | Minimum revenue decline required to qualify | Subsidy rate detail | Maximum subsidy rate |
|---|---|---|---|---|
| 1 | March 15 to April 11, 2020 | 15% | Flat rate | 75% of eligible wages |
| 2 | April 12 to May 9, 2020 | 30% | ||
| 3 | May 10 to June 6, 2020 | |||
| 4 | June 7 to July 4, 2020 | |||
| 5 | July 5 to August 1, 2020 | 0% | Base rate (1.2 x current-period revenue decline) + Top-up (1.25 x (3-month revenue decline -50%) "Safe harbor" rule in effect* | 85% of eligible wages (60% base + 25% top-up) |
| 6 | August 2 to August 29, 2020 | |||
| 7 | August 30 to September 26, 2020 | Base rate (1 x current-period revenue decline) + top-up (1.25 x (3-month revenue decline - 50%) | 75% of eligible wages (50% base + 25% top-up) | |
| 8 | September 27 to October 24, 2020 | Base rate (0.8 x current-period revenue decline) + top-up (1.25 x (current revenue decline - 50%) "Safe harbor" rule for top-up in effect* | 65% of eligible wages (40% base + 25% top-up) | |
| 9 | October 25 to November 21, 2020 | |||
| 10 | November 22 to December 19, 2020 | |||
| 11 | December 20 to January 16, 2021 | Base rate (0.8 x current-period revenue decline) + top-up (1.75 x (current-period revenue decline -50%) | 75% of eligible wages (40% base + 35% top-up) | |
| 12 | January 17 to February 13, 2021 | |||
| 13 | February 14 to March 13, 2021 | |||
| 14 | March 14 to April 10, 2021 | |||
| 15 | April 11 to May 8, 2021 | |||
| 16 | May 9 to June 5, 2021 | |||
| 17 | June 6 to July 3, 2021 | |||
| 18 | July 4 to July 31, 2021 | 10% | Base rate (0.875 x (current-period revenue decline – 10%)) + top-up (1.25 x (current-period revenue decline -50%)) | 60% of eligible wages (35% base + 25% top-up) |
| 19 | August 1 to August 28, 2021 | Base rate (0.625 x (current-period revenue decline – 10%)) + top-up (0.75 x (current-period revenue decline -50%)) | 40% of eligible wages (25% base + 15% top-up) |
|
| 20 | August 29 to September 25, 2021 | |||
| 21 | September 26 to October 23, 2021 | Base rate (0.25 x (current-period revenue decline – 10%)) + top-up (0.5 x (current-period revenue decline -50%)) | 20% of eligible wages (10% base + 10% top-up) |
|
| Notes: "Safe harbour" rules were designed to manage uncertainty associated with changes in the subsidy rate schedules for claimants. In Period 5 and Period 6, claimants could choose to take the flat subsidy of 75% from the previous four periods or calculate a rate based on their revenue declines, depending on which approach was more favorable. In Periods 8 to 10, after a decision to harmonize periods used to calculate the base and top-up rates, claimants could choose to use the revenue decline for the previous 3-months or the current period revenue decline to calculate their top-up subsidy. | ||||
Maximum CEWS Subsidy Rate, by Period
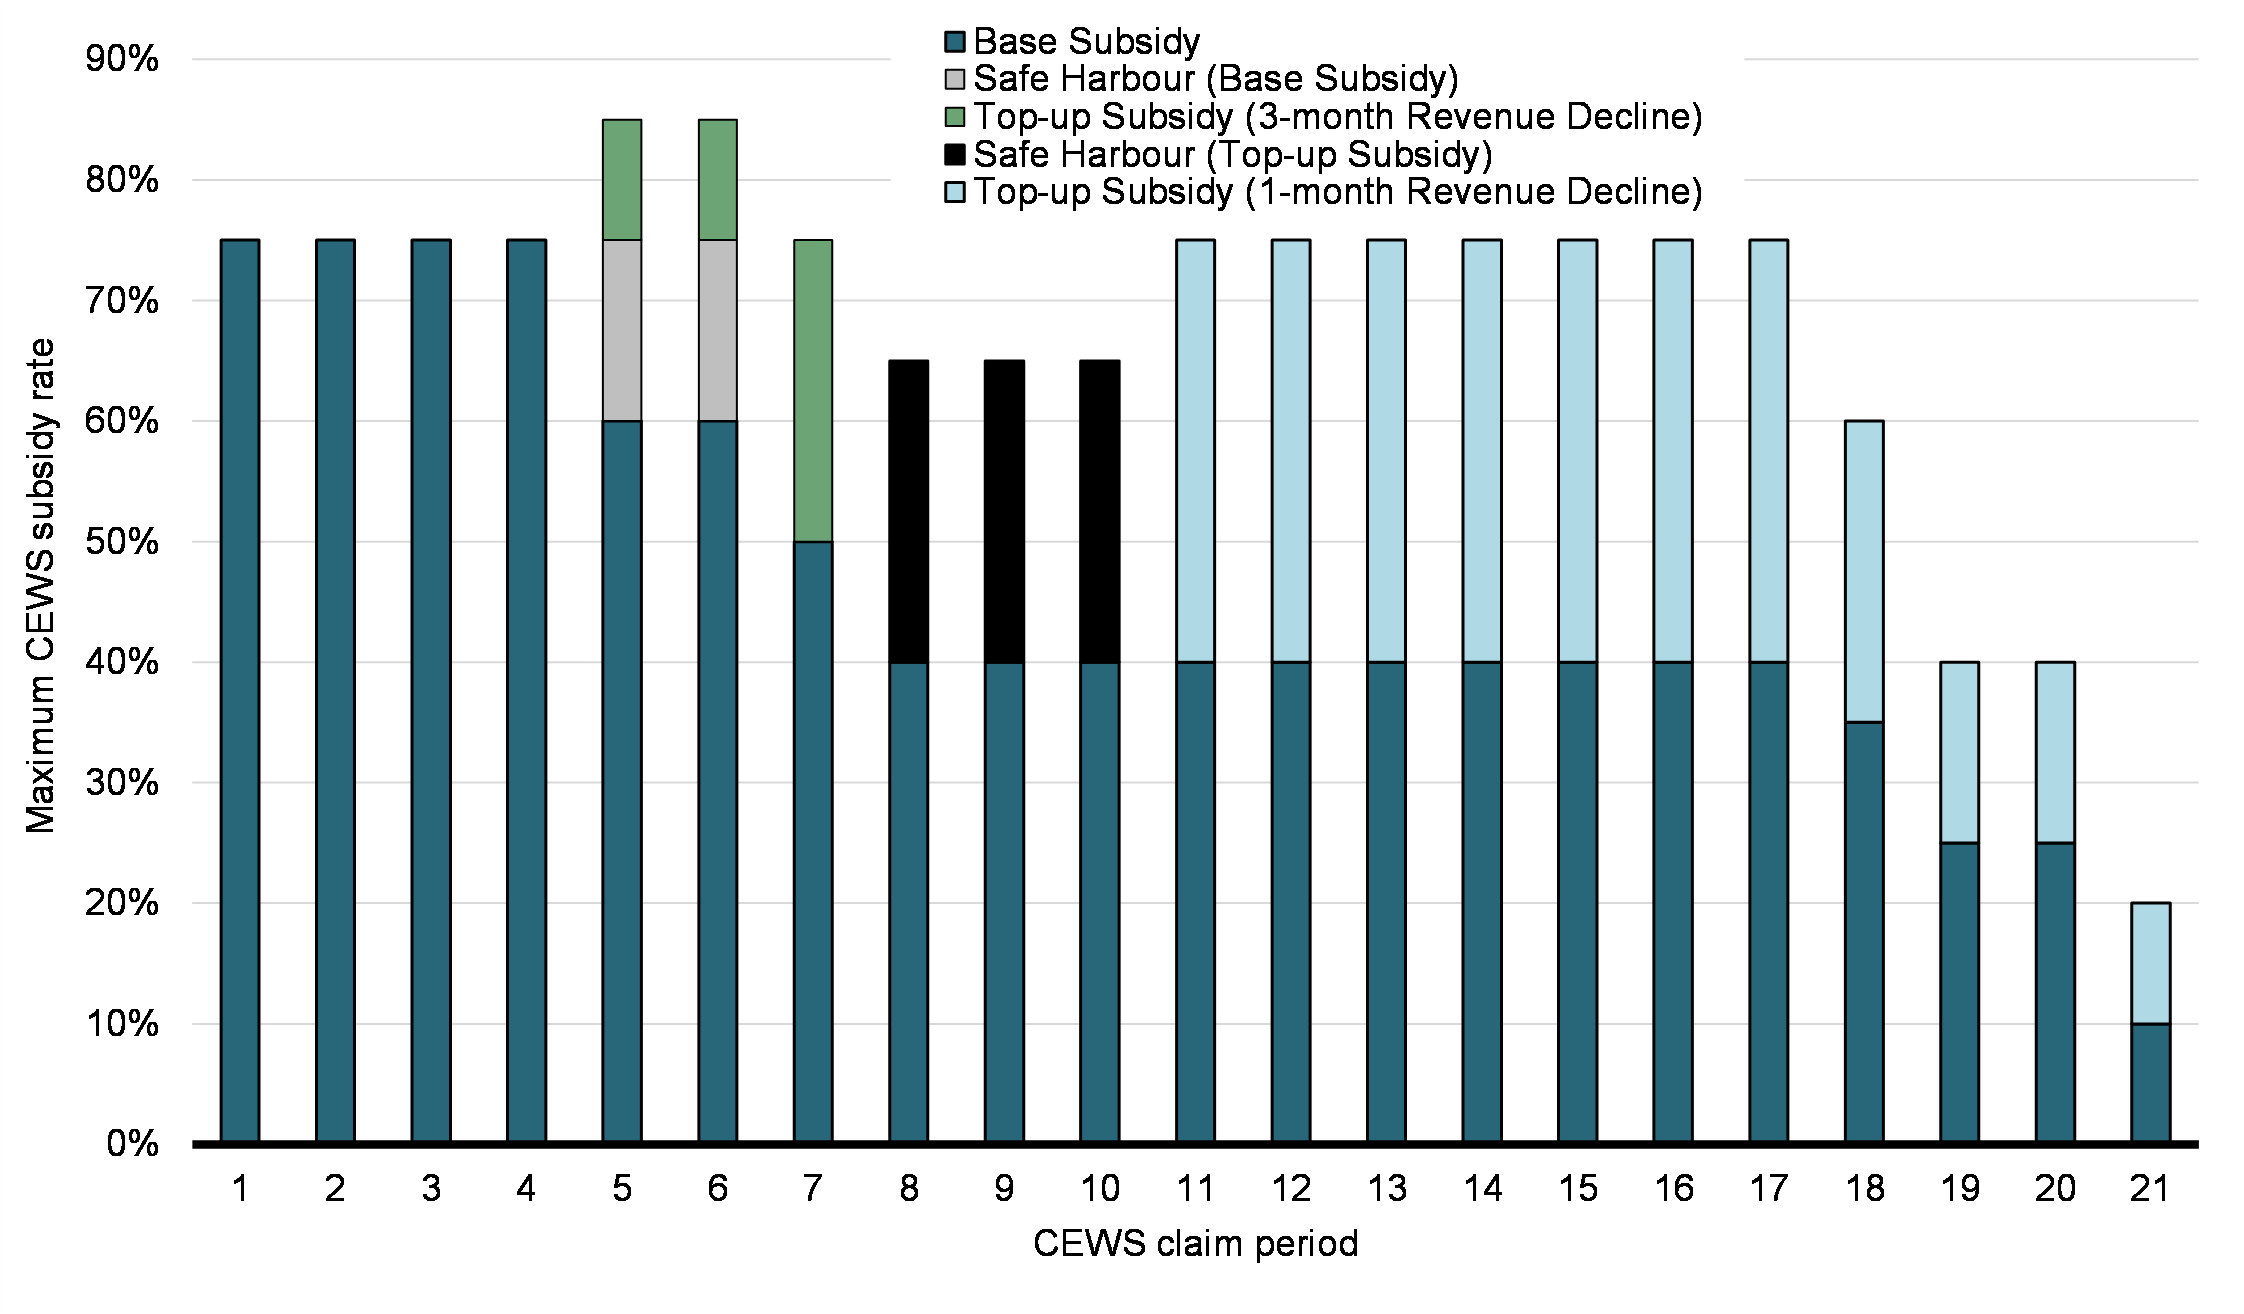
Annex 2: Select International Job Retention Programs
Many countries relied on job retention programs during the COVID-19 crisis to help preserve jobs and maintain employer-employee links. Some countries adapted already-established short-time work schemes, including Germany, France, Japan, and Italy. Several other countries launched new temporary job retention programs under an accelerated timeframe, namely Australia, Canada, Ireland, New Zealand, and the United Kingdom.
These job retention schemes shared the common goal of supporting workers and preserving employment linkages to prevent scarring. However, they varied in terms of employer eligibility, employee coverage and generosity. With respect to coverage of employees, some schemes subsidized only fully/partially furloughed workers (e.g., United Kingdom, Germany, France, Italy, Japan), whereas other schemes could be used by firms for both active and furloughed employees (e.g., New Zealand, Australia, Canada, Ireland).
While most new wage subsidy programs were initially announced as three-to-six month programs, most were extended to align with the renewal of COVID-19 restrictions as the health and economic situation evolved. Countries with pre-existing short-time work schemes similarly extended their expanded criteria to facilitate access, expand coverage and increase the generosity of these schemes. At present, some countries have ended their programs, while other countries have extended them into 2022. In countries where programs ended, more targeted measures were often introduced to support workers during renewed lockdowns.
| New Wage Subsidy Scheme | New Short-time Work Scheme | Adjusted Short-time Work Scheme | |
|---|---|---|---|
| Australia | Yes | ||
| Canada | Yes | Yes | |
| France | Yes | ||
| Germany | Yes | ||
| Ireland | Yes | ||
| Italy | Yes | ||
| Japan | Yes | ||
| New Zealand | Yes | ||
| United Kingdom | Yes | ||
| Source: Finance Canada, OECD (2021), "Job retention schemes during the COVID-19 crisis: Promoting job retention while supporting job creation", in OECD Employment Outlook 2021: Navigating the COVID-19 Crisis and Recovery, OECD Publishing, Paris. | |||
| Australia | Canada | Ireland | New Zealand | |
|---|---|---|---|---|
| Program | JobKeeper Payment scheme | Canada Emergency Wage Subsidy | Temporary Wage Subsidy Scheme / Employment Wage Subsidy Scheme |
COVID-19 Wage Subsidy |
| Description | Flat rate payments to support eligible workers for businesses experiencing a decline in revenues | Subsidy proportional to employee wages with subsidy rate determined by revenue decline of employer | Flat rate payment or subsidy proportional to employee wages for qualifying employers experiencing a decline in revenues | Flat rate payments to eligible employers for businesses experiencing a decline in revenues |
| Government contribution | Originally one flat rate subsidy, extended as two flat rates based on number of hours worked (+/- 80 hours over a four week period) |
Originally one flat rate subsidy, rate subsequently modified to be proportional to the employer's decline in revenues (up to a maximum earnings limit) | Subsidy amount, including as multiple flat-rate payments, dependent on the gross income of each employee (up to a maximum earnings limit) | Two flat rate payments based on number of hours worked (+/- 20 hours per week) |
| Maximum government contribution | Up to AU$1,000 - AU$1,500 per fortnight (C$2,004 - C$3,005 per month) |
At the program's most generous level, up to C$847 per week (C$3,388 per month) |
Up to €100 - €410 per week (C$663 - C$2,718 per month) |
Up to NZ$586 - NZ$600 per week (C$2,212 - C$2,265 per month) |
| Minimum Decline in Revenue | 15% - 50% decline depending on the type of entity and its revenues |
0% -30% decline (range over time) |
25% -30% decline (range over time) |
30% - 40% decline (range over time) |
| Start | March 30, 2020 | March 15, 2020 | March 26, 2020 | March 27, 2020 |
| Original Duration | 6 months | 12 weeks | 12 weeks | 3 months |
| Current Extension | Ended March 28, 2021 | Ended October 23, 2021 and replaced by more targeted subsidy programs | Extended until April 30, 2022 |
Ended September 3, 2020 Reactivated March; August - December 2021 |
| New Lockdown Supports | New COVID-19 Disaster Payment program for workers experiencing reduced hours was implemented during recent lockdowns | More targeted wage and rent support available until May 7, 2022, including a new Local Lockdown Program, for businesses that are facing temporary local lockdowns or, in some cases, capacity-limiting restrictions | Enhanced rates maintained for December 2021 and January 2022 before tapering off | Program was reactivated during recent lockdowns |
| Note: Calculation of revenue decline may differ by jurisdiction. Range of revenue drop required and maximum government contribution may have varied during the life of the program. Source: Finance Canada, National authorities, OECD (2021), "Job retention schemes during the COVID-19 crisis: Promoting job retention while supporting job creation", in OECD Employment Outlook 2021: Navigating the COVID-19 Crisis and Recovery, OECD Publishing, Paris. |
||||