
Report on Federal Tax Expenditures - Concepts, Estimates and Evaluations 2024: part 10
Archived - Report on Federal Tax Expenditures - Concepts, Estimates and Evaluations 2024: part 10
Medical Expense Tax Credit: A Statistical Analysis of Claims and BenefitsFootnote 1
1. Introduction
The Medical Expense Tax Credit (METC) is a non-refundable tax credit available to individuals who spend a higher-than-average amount on itemizable medical expenses for themselves and their family members. The objective of this tax expenditure is to recognize "the effect of above-average medical and disability-related expenses on the ability of an individual to pay income tax." Footnote 2 The METC promotes horizontal equity by recognizing that individuals who have high out-of-pocket medical expenses have a lower ability to pay taxes than individuals with similar incomes without this same financial burden. The METC was introduced first as a tax deduction in 1942 and was replaced by a non-refundable credit in 1987, as part of a more general tax reform. Footnote 3 The design of its claim components and eligibility rules was last modified in 2011 when the $10,000 limit was removed for medical expenses incurred on behalf of a dependent relative. Qualifying medical expenses for the METC are continually being reviewed in light of evolving medical treatments and research developments. For example, recent changes to the METC as part of Budget 2022 relate to certain expenses incurred to conceive a child, including medical expenses for a surrogate as well as fees paid to acquire ova and sperm. In 2020, about 5.0 million individuals claimed this credit and its cost was estimated to be around $1.6 billion.
Section 2 presents some background on the METC, including details on the process of claiming the tax credit, family components of the measure as well as information on related federal, provincial and territorial tax expenditures. Section 3 outlines the key datasets and variables used and the main tax unit selected for the analysis, i.e., the individual taxfiler. Section 4 presents a cross-sectional analysis of claimants and beneficiaries of the METC including a trend analysis of total METC claims between 2008 and 2020. The section also includes an in-depth examination of METC use in the most recent year for which tax data were available when the study was conducted, i.e., 2019. Footnote 4 Section 5 presents a longitudinal analysis of claims by looking at the history of individuals with a positive METC amount in 2019. It explores the persistence and intensity of their claims year to year as well as the main reasons for which individuals start or stop claiming the METC. Section 6 summarizes the main findings of the paper.
2. Background
2.1 Description of the Credit and its Eligibility Rules
The METC is a non-refundable tax credit that aims to provide tax relief for medical expenses related to the purchase of specific goods and services whose costs can be detailed using invoices. Like for any other non-refundable credit, taxfilers generally need to have sufficient taxable income and above-zero federal tax payable (above and beyond other claimed tax credits) to benefit from the METC. The amount of allowable medical expenses claimed on the T1 Income Tax and Benefit Return is multiplied by 15% (i.e., the percentage corresponding to the marginal tax rate of the lowest tax bracket). The result is the amount of taxes that individuals can save by claiming the METC.
Taxfilers can claim medical expenses that either they or their partner paid for in any 12-month period ending in the current taxation year, as long as they did not claim these same expenses in the previous year. For example, taxfilers can claim all eligible medical expenses they incurred between November 1, 2020 and October 31, 2021 on their 2021 tax return if they did not claim these expenses in 2020. Exceptionally, taxfilers can claim medical expenses in any 24-month period ending in the current taxation year for a deceased person. Individuals can also claim certain medical expenses incurred outside Canada. Importantly, they can claim only expenses for which they or their partner will not be reimbursed through either an employer or an insurance benefit plan. The types of eligible medical expenses include prescribed medical devices, dental services, physiotherapy, psychotherapy, optometry, prescription medication, hospital, nursing home and attendant care expenses, and many others. For a detailed list of all eligible expenses, qualifying practitioners in each province or territory, and required documentation for each type of expense, information can be found on the Canada Revenue Agency website.
The METC has two claim portions. The first includes eligible medical expenses incurred for oneself, spouse or common-law partner, and dependant children under 18 years old. Throughout this analysis, the spouse or common-law partner and children under 18 years old are referred to as the immediate family members of the taxfiler. The second portion, which was introduced in 2004 to provide greater tax relief to caregivers, Footnote 5 covers medical expenses incurred for other dependants. Other dependants are individuals that, at any time in the year, are dependent on the taxfiler or their partner for support. These dependants can include the taxfiler or partner's grandchildren or adult children, as well as parents, grandparents, brothers, sisters, uncles, aunts, nephews, or nieces who were residents of Canada at any time in the year.
Because the purpose of the METC is to provide support to individuals with above-average health and medical expenses, all eligible medical expenses are subject to certain thresholds, which are subject to indexation, when calculating the total amount of allowable expenses that can be claimed.
After entering the total amount of eligible medical expenses for self, partner and children under 18 years old, taxfilers need to subtract the lesser of 3% of their net income or a maximum indexed threshold amount ($2,352 in 2019). For instance, if the taxfiler's total eligible expenses are $3,000 and 3% of their net income is equal to $2,000, they would be entitled to claim $1,000 in allowable expenses for immediate family members. If the taxfiler is in a couple with another taxfiler, either they or their spouse will be able to claim all eligible medical expenses on their tax return for the entire family, regardless of who paid for each expense. To maximize benefits from the METC from a family standpoint, it is often most advantageous for the lower-income spouse to claim the credit. Indeed, in many cases, the lower-income spouse has a lower threshold to cross to start receiving benefits from the measure (i.e., 3% of a lower net income is a smaller amount). Thus, a higher proportion of the money spent on medical expenses will be subject to tax relief.
Allowable medical expenses on behalf of other dependants are subject to the lesser of 3% of each dependant's net income or a maximum indexed threshold ($2,352 in 2019). These are the same thresholds as those for the expenses claimed on behalf of immediate family members. Claims of eligible medical expenses on behalf of other dependants are also transferable between spouses or common-law partners.
All details about the eligibility criteria and rules for the METC are set out in section 118.2 of the Income Tax Act as well as sections 5700 and 5701 of the Income Tax Regulations.
2.2 Related Tax Expenditures
At the federal level, there are other personal income tax expenditures related to health and medical expenses:
- The Refundable Medical Expense Supplement is a refundable tax credit that provides tax relief to low-income workers with medical expenses;
- The Disability Tax Credit is a non-refundable tax credit that provides tax relief to individuals with certain severe and prolonged disabilities as well as the family members that support them;
- The Disability Supports Deduction is a tax deduction that recognizes the cost of certain medical expenses for persons with disabilities in order to engage in education, work or research;
- The Home Accessibility Tax Credit is a non-refundable tax credit that helps eligible seniors and persons with disabilities who incur expenses to renovate their homes to make them more accessible; and
- The Canada Caregiver Credit is a non-refundable tax credit that helps taxfilers who support a spouse or common-law partner and/or eligible dependants with physical and/or mental infirmities.
While the specific objectives and target populations of these tax expenditures differ from those of the METC, there might be some overlap in the groups of taxfilers making use of them and benefitting from them. Further, many provinces and territories provide additional tax support to those facing significant health and medical expenses. The claim and benefit patterns of these provincial and territorial tax expenditures are outside the scope of this paper. For additional information on provincial and territorial tax expenditures, individuals can consult various sources provided by the Canada Revenue Agency or the Government of Quebec. Footnote 6
3. Data and Variables Used in the Study
This study uses data from the T1 Income Tax and Benefit Return (T1) for years 2008 to 2020. Specifically, the trend analysis uses data from 2008 to 2020, the cross-sectional analysis focuses on data from 2019, and the longitudinal analysis uses data from 2014 to 2020. Although 2020 data was available when the study was initiated, we chose to use 2019 data in Section 4 for the cross-sectional analysis and in Section 5 as the reference point for the longitudinal analysis. This is due to irregularities in claiming patterns observed in 2020 given that it was the first year of the COVID-19 pandemic and access to certain types of in-person medical services was limited.
Key variables from the T1 used to analyze METC claims and benefits are the following:
- Line 33099 (line 330 for tax years before 2019): Medical expenses for self, spouse or common-law partner, and dependant children aged 17 and under.
- Line 33199 (line 331 for tax years before 2019): Allowable amount of medical expenses for other dependants.
- Line 33200 (line 332 for tax years before 2019): Eligible amount of medical expenses for the METC.
The study uses the individual taxfiler as the unit of analysis. Although the METC has a family component, in that spouses or common-law partners can choose who should claim the expenses for themselves and family members, ultimately only the claiming individual(s) can directly benefit from the METC from an income tax standpoint. However, some results are presented from a family lens in Section 4 to highlight how METC benefits can be distributed differently based on the presence of a filing partner and the selected intra-household benefit-sharing assumption.
4. Cross-Sectional Analysis of Claims and Benefits
4.1 Trend Analysis of Claims
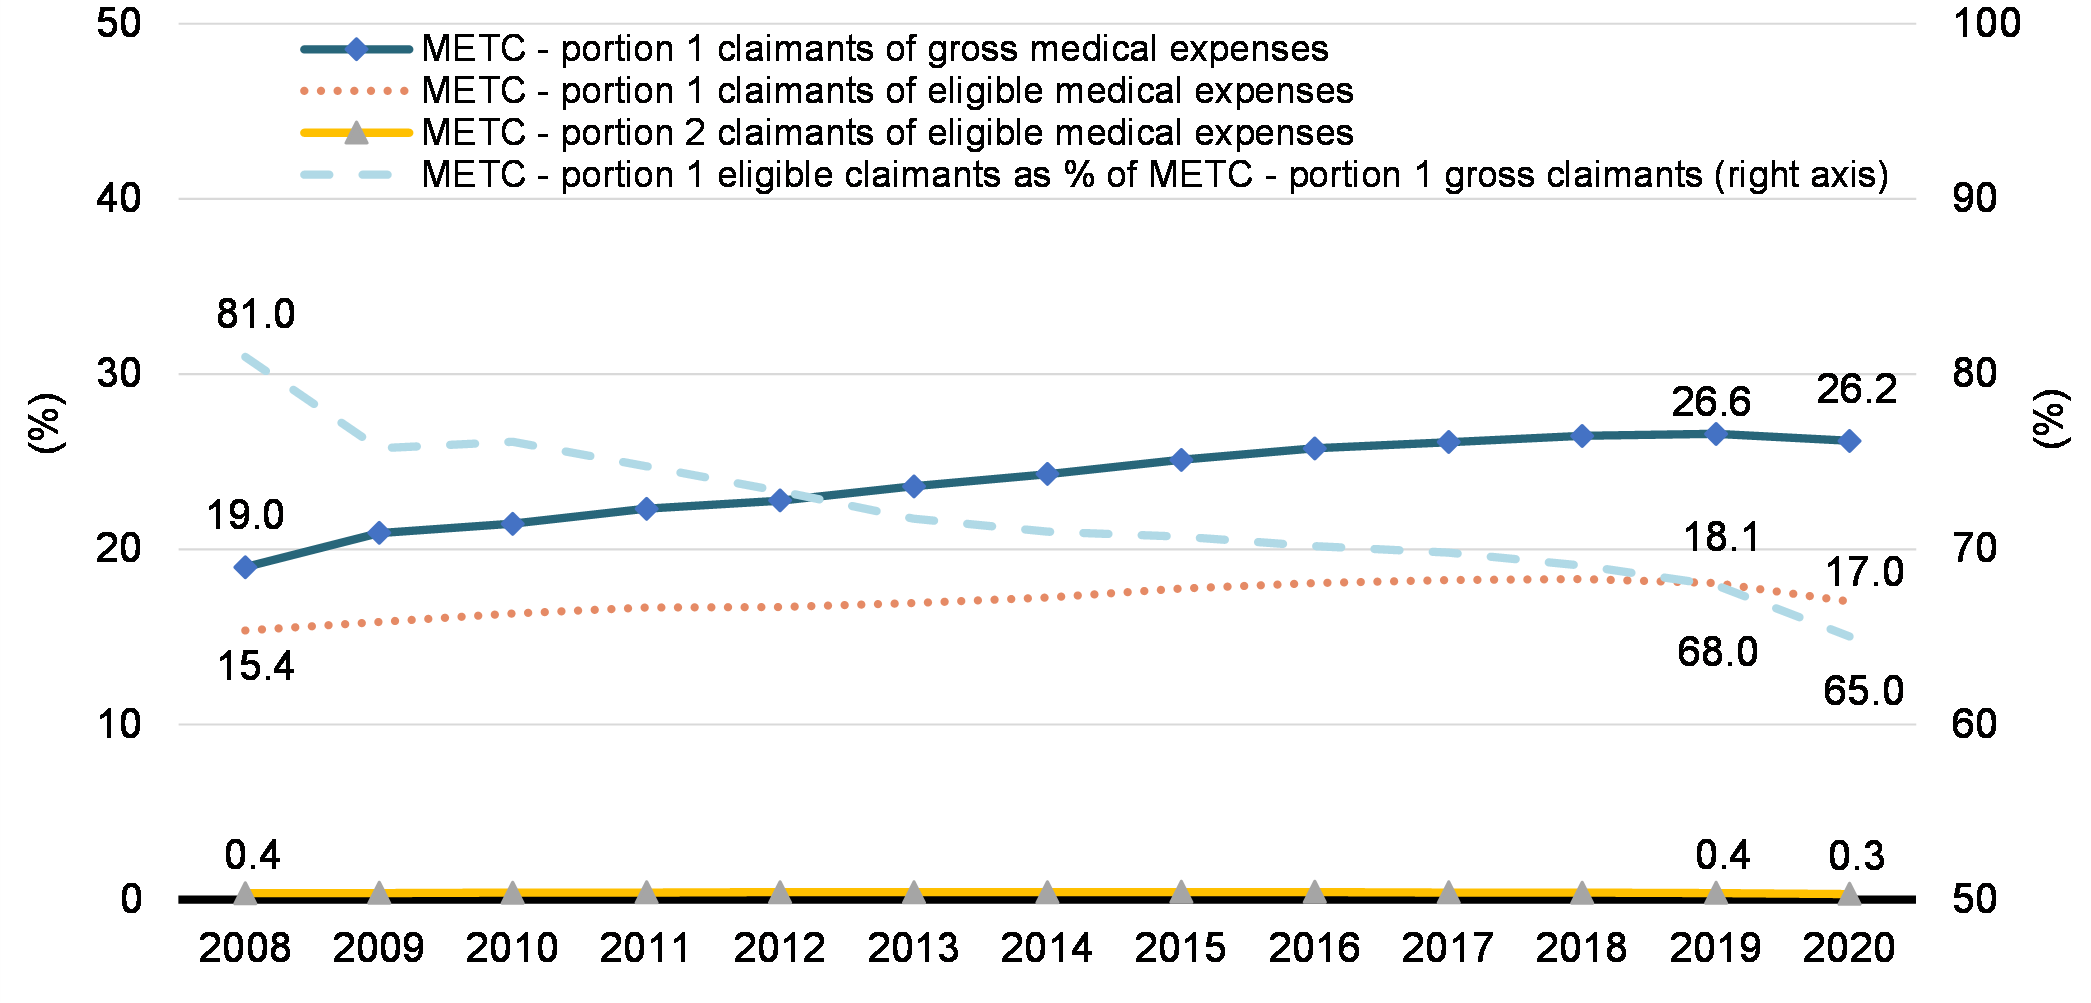
This section discusses trends in annual total METC claims over the 2008 to 2020 period, distinguishing between gross claims and eligible claims for immediate family members (portion 1) and other dependants (portion 2). Based on trends in the total number of METC claimants and amount of METC claims (presented in the annex), Chart 1 illustrates the evolution of METC claim rates over the past decade or so. In the charts and descriptions that follow, the term "gross medical expenses" is used to refer to the amount of expenses reported by a taxfiler before subtracting the eligibility threshold (i.e., the lesser of 3% of their net income or an annually indexed dollar amount). The term "eligible medical expenses" is used to refer to the net amount claimed after subtracting this threshold.
Chart 1 shows that the proportion of taxfilers who reported eligible medical expenses under portion 1 of the METC follows a continuous upward trend between 2008 and 2019, followed by a slight decrease in 2020 – the year the COVID-19 pandemic began. During this same period, the claim rates for portion 2 of the METC remained stable.
According to Chart 1, there was a more important increase in the proportion of taxfilers who claimed at least some gross medical expenses under portion 1 of the METC (i.e., a 40.1% increase between 2008 and 2019) than in the proportion of those who claimed eligible medical expenses (17.4%). As a result, and as the dashed blue line shows, the share of taxfilers eligible for portion 1 of the METC as a share of those who claimed some gross medical expenses decreased from 81% in 2008 to 65% in 2020.
This declining trend is not the result of more restrictive METC eligibility criteria. On balance, the list of expenses eligible for the credit has been regularly reviewed and expanded considering new health-related developments. Further, the proportion of claimants for whom 3% of their net income was above the minimum dollar amount increased during this period (from 12.9% in 2008 to 14.4% in 2019). This also suggests that the eligibility threshold became relatively less restrictive between 2008 and 2019.
Proportion of taxfilers with METC claims (portion 1 and portion 2), and METC – portion 1 eligible claimants as a share of METC – portion 1 gross claimants, 2008 to 2020
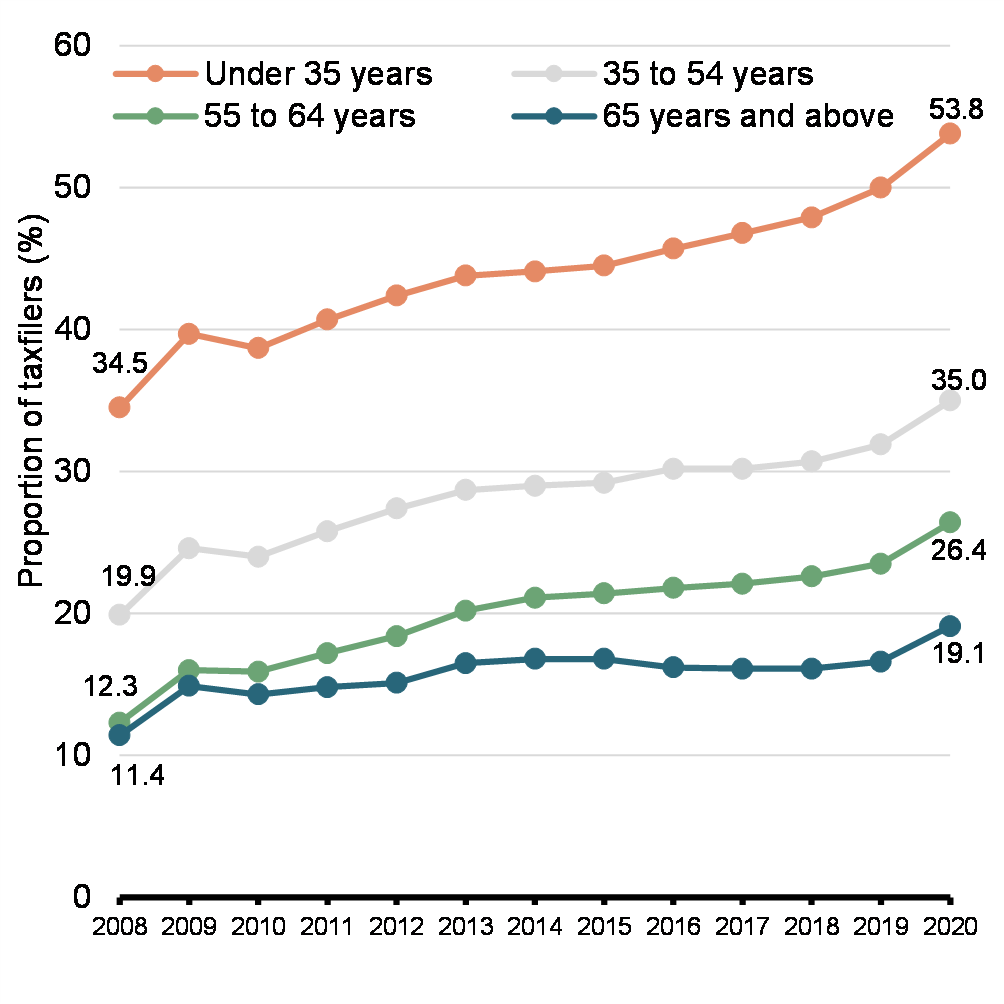
A possible explanation for this trend might be a greater propensity among taxfilers to claim the credit without knowing whether their total meets the eligibility threshold. When we look at the claimed amounts of gross medical expenses, we see an increase in all age groups in the proportion of claimants for whom the claimed amount does not exceed their respective eligibility threshold (Chart 2). This finding is true regardless of the threshold applicable to their situation (i.e., a percentage or dollar threshold). This supports the idea that taxfilers could be automatically claiming the METC regardless of whether they think they will be eligible for the credit. Contributing factors could include a better awareness of this credit or a change in the way tax software or tax professionals incentivize taxfilers to claim medical expenses. Greater access to electronic medical receipts in recent years could also help explain this trend. These factors may also explain why the average amount of gross medical expenses slightly decreased during the period, while the average amount of eligible medical expenses remained stable.
Chart 2
Proportion (%) of taxfilers who claimed an amount of gross medical expenses lower than their respective METC thresholds (i.e., as a percentage or in dollars), by age group, 2008-2020

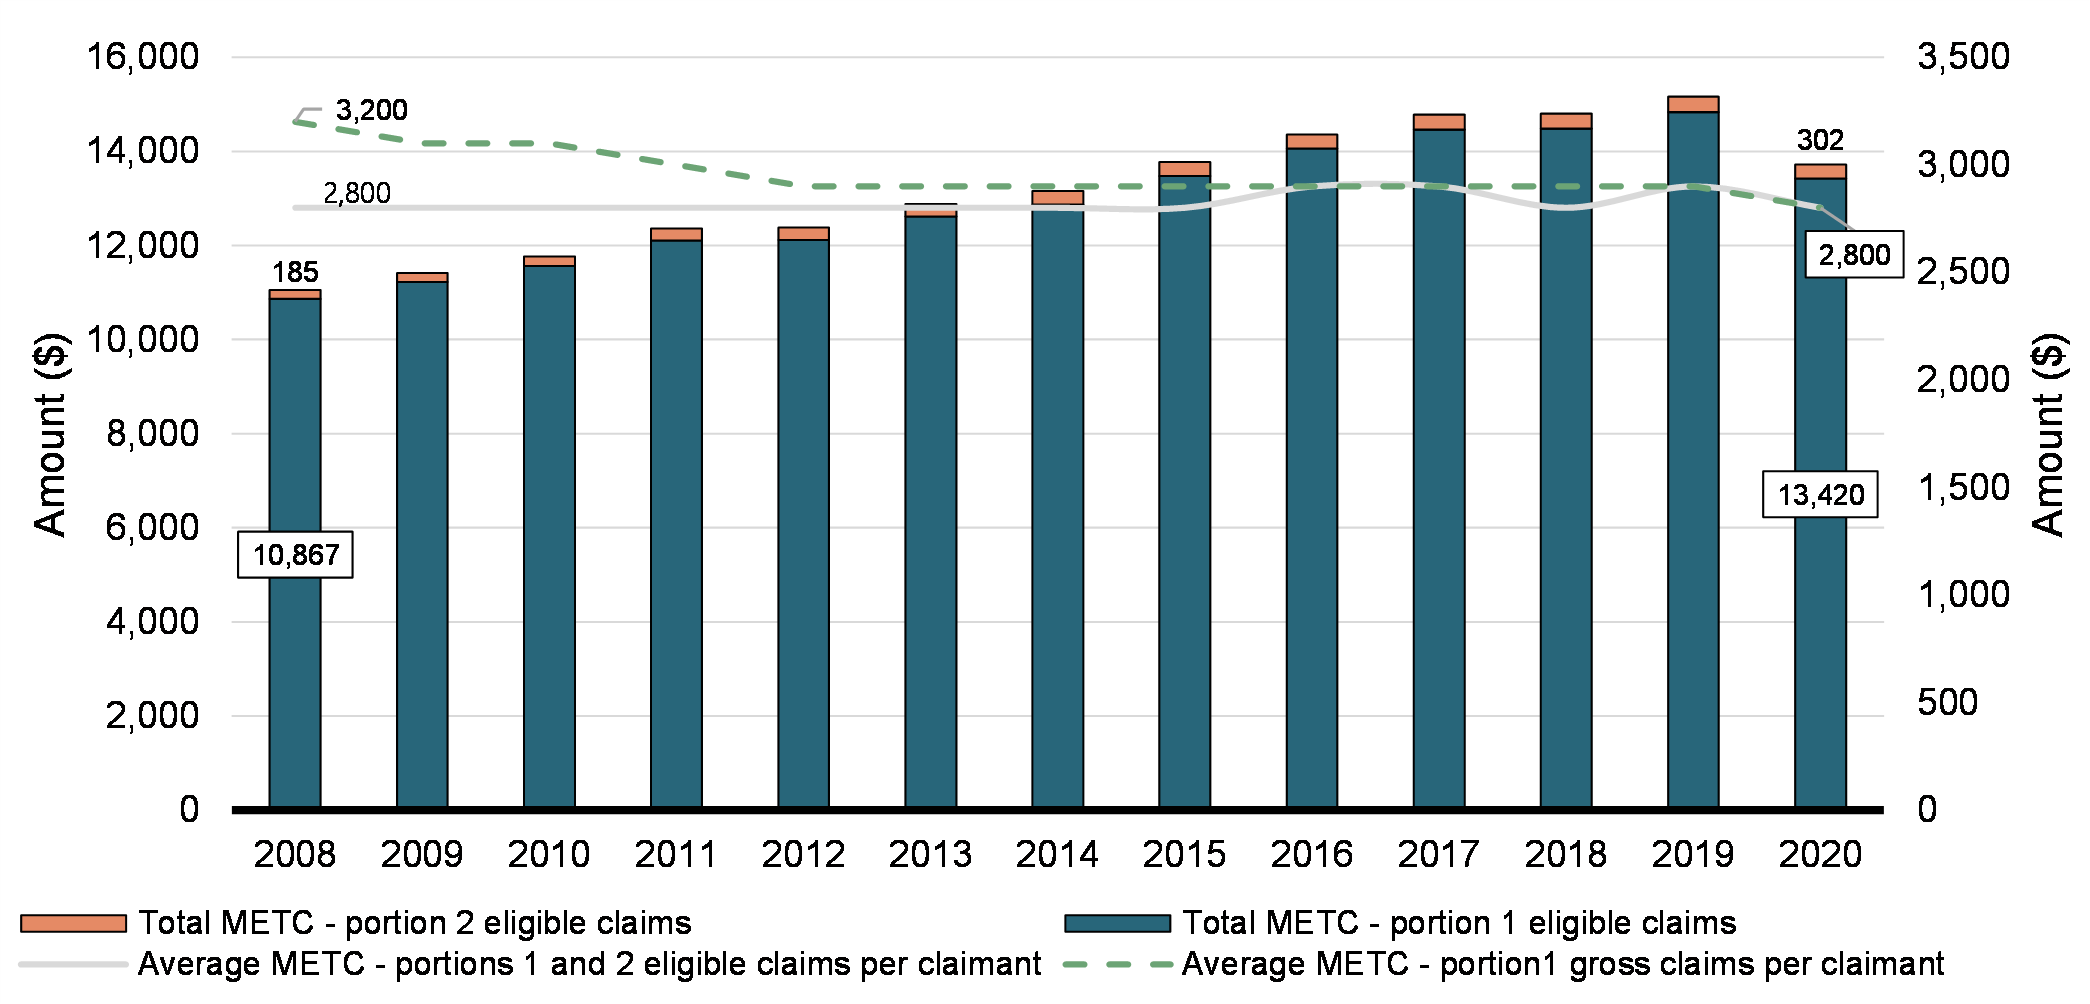
The average amount of eligible medical expenses claimed under the METC each year has remained stable. Despite this, a constant rise in the number of METC claimants as a proportion of all taxfilers has increased the total amount of METC claims between 2008 and 2019 (Chart 3), from $11.1 billion to $15.2 billion (in 2019 dollars).
Total amount of eligible METC claims (in millions of 2019 dollars – primary axis) and average amount claimed per claimant (in 2019 dollars – secondary axis), under portion 1, portion 2 and total, 2008 to 2020
4.2 Cross-Sectional Profile of Claimants and Beneficiaries in 2019
This section takes a closer look at the profile of taxfilers who claimed and benefitted from the METC in 2019.
4.2.1 Profile of Claimants
Overall, 7,685,000 taxfilers claimed gross medical expenses for their immediate family, representing approximately 27% of all taxfilers in 2019 (Table 1). Of these, 5,223,000 (or 68% of them) could claim eligible medical expenses (i.e., after subtracting the lesser of 3% of their net income or $2,352 from their gross medical expenses). An additional 109,900 taxfilers claimed eligible medical expenses for other dependants, for a total of 5,272,900 taxfilers (or 18.2% of all taxfilers) who claimed eligible expenses as part of the METC. Further, 59,900 taxfilers claimed both portions of the METC in 2019.
Looking at the gender Footnote 7 distribution of METC claimants in Table 1, we can see that women are more likely than men to claim medical expenses for all portions of the METC. They are also overrepresented among claimants relative to their share among all taxfilers (51.4%). This is linked to women generally being the lower-income spouse in a couple, Footnote 8 who would face a lower METC threshold, since it is based on individual income. With respect to age groups, taxfilers aged 65+ make up a large share of eligible portion 1 claimants (40.6%), whereas taxfilers below 35 make up a small share (12.5%) relative to their share in the overall T1 population (23.3% and 28.2%, respectively). This is linked to older individuals generally requiring more medical goods and services than younger individuals. As for portion 2, taxfilers aged 35 to 54 make up more than half of claimants (53.4%), followed by taxfilers aged 55 to 64 who make up nearly a third. Individuals in these age groups are more likely to be supporting dependants, such as adult children or elderly parents and siblings, with their medical expenses compared to younger or elderly individuals. For the METC overall, results are similar to those for portion 1 with taxfilers aged 65 and above being significantly overrepresented among claimants.
Regarding family situation, taxfilers who are the lower-income spouses in a couple are slightly more likely to claim portion 1 and the total METC relative to taxfilers in other family situations. This makes sense given that the couple may benefit from higher tax relief if the lower-income spouse – who faces a lower METC portion 1 eligibility threshold – claims the medical expenses for all immediate family members. Results are slightly different for portion 2 of the METC. First, unattached individuals are less likely to be claimants relative to their share among all taxfilers (20.7% and 40.7%, respectively). Second, higher-income spouses in a couple without children account for the highest share of claimants (25.5%). Eligibility to portion 2 of the METC is not dependent on the claimant's net income, but on the dependants' net income (one or multiple dependants), which is the same regardless of the claiming spouse. Therefore, the higher-income spouse, who is more likely to have sufficient federal tax to pay before applying the credit, is more likely to claim portion 2 of the METC.
Looking at personal and adjusted family pre-tax income distributions, a few results stand out. Individuals in the first income quintile (Q1) are much less likely to claim medical expenses for immediate family members or other dependants relative to other income groups. In general, lower-income individuals have a lower ability to pay for medical expenses. Additionally, they may be aware that their income will not be sufficient to have tax payable and benefit from the METC. Claimants in quintile Q3 are slightly overrepresented among portion 1 and overall claimants (32.1% by personal income quintile and 27.2% by adjusted family income quintile for the total METC) relative to their share of the taxfiler population (20.0%). In contrast, the likelihood of claiming expenses for other dependants under portion 2 increases with income. Specifically, individuals in the top personal and adjusted family income quintiles (Q5) account for a large share of portion 2 claimants (39.5% and 43.1%, respectively). Higher-income individuals are often better able to support dependants outside their immediate family with medical costs.
Finally, looking at region of residence, METC claimants in all portions appear to be overrepresented in Quebec and in the Atlantic provinces (51.2%) in comparison to the proportion of all taxfilers living in these regions (29.8%). The relatively high percentage of claims in Quebec could be partly explained by the eligibility of premiums paid for coverage under the Public Prescription Drug Insurance Plan, since other provinces do not have universal prescription drug insurance coverage which involves a minimum annual premium.
| All taxfilers | METC portion 1 claimants, gross medical expenses | METC portion 1 claimants, eligible medical expenses | METC portion 2 claimants, eligible medical expenses | Total METC claimants, eligible medical expenses | |
|---|---|---|---|---|---|
| All Individuals (#) | 28,903,800 | 7,685,000 | 5,223,000 | 109,900 | 5,272,900 |
| Gender* | |||||
| Men | 48.4 | 43.7 | 39.6 | 47.0 | 39.7 |
| Women | 51.4 | 56.3 | 60.4 | 53.0 | 60.3 |
| Age group | |||||
| Under 35 | 28.2 | 17.9 | 12.5 | 1.9 | 12.4 |
| 35-54 | 31.5 | 29.6 | 26.9 | 53.4 | 27.2 |
| 55-64 | 17.0 | 18.9 | 20.0 | 32.8 | 20.1 |
| 65 and above | 23.3 | 33.6 | 40.6 | 11.7 | 40.3 |
| Family situation** | |||||
| Unattached (no spouse) | 40.7 | 39.7 | 33.5 | 20.7 | 33.4 |
| One-parent family (no spouse) | 3.5 | 3.8 | 3.5 | 4.5 | 3.5 |
| In a couple, 1+ children, higher-income spouse | 9.7 | 7.0 | 5.1 | 13.5 | 5.2 |
| In a couple, 1+ children, lower-income spouse | 9.6 | 10.2 | 12.0 | 12.4 | 12.0 |
| In a couple, no children, higher-income spouse | 19.1 | 15.7 | 15.6 | 25.5 | 15.8 |
| In a couple, no children, lower-income spouse | 17.5 | 23.6 | 30.2 | 23.5 | 30.1 |
| Personal pre-tax income quintile | |||||
| Q1 (under $13,563) | 19.9 | 7.4 | 9.7 | 2.8 | 9.6 |
| Q2 (from $13,563 to $26,377) | 20.1 | 19.0 | 22.0 | 9.0 | 21.9 |
| Q3 (from $26,377 to $45,247) | 20.0 | 29.4 | 32.3 | 21.8 | 32.1 |
| Q4 (from $45,247 to $73,733) | 20.0 | 25.1 | 22.9 | 26.9 | 22.9 |
| Q5 (at or above $73,733) | 20.0 | 19.1 | 13.1 | 39.5 | 13.5 |
| Adjusted family pre-tax income quintile*** | |||||
| Q1 (under $18,348) | 20.0 | 7.3 | 8.3 | 3.7 | 8.2 |
| Q2 (from $18,348 to $33,638) | 20.0 | 21.2 | 22.8 | 9.6 | 22.7 |
| Q3 (from $33,638 to $54,148) | 20.0 | 26.3 | 27.3 | 18.4 | 27.2 |
| Q4 (from $54,148 to $83,918) | 20.0 | 24.2 | 23.4 | 25.2 | 23.5 |
| Q5 (at or above $83,918) | 20.0 | 21.0 | 18.2 | 43.1 | 18.5 |
| Regions of residence**** | |||||
| Atlantic provinces | 6.6 | 8.2 | 8.5 | 8.2 | 8.4 |
| Quebec | 23.2 | 39.0 | 43.0 | 30.9 | 42.8 |
| Ontario | 38.1 | 27.2 | 24.6 | 34.2 | 24.7 |
| Prairies | 17.4 | 14.8 | 13.5 | 13.9 | 13.5 |
| BC and the territories | 14.0 | 10.7 | 10.4 | 12.6 | 10.4 |
|
Notes: All population figures in this table are rounded to the nearest 100. Totals (percentages) may not add up to 100% due to rounding. * Gender: Taxfilers whose gender cannot be identified in the data have been excluded from the table. ** Family situation: Taxfilers who are in a couple but do not have a filing spouse are automatically classified as the higher-income spouse. For couples in which both taxfilers have the same net income, the first taxfiler to appear in the data by assigned family identifier is classified as the higher-income spouse. The second taxfiler to appear in the data is classified as the lower-income spouse. *** Income is adjusted for the presence of a partner as well as the presence of children under 18 in the family. The adjusted family pre-tax income of an individual is obtained by dividing the individual's total pre-tax family income by the square root of the number of family members in the household. **** Regions of residence: Taxfilers for whom region of residence is "non-resident", "multiple jurisdiction", unknown or missing have been excluded from the table. Source: T1 data; Department of Finance calculations. |
|||||
Chart 4 shows the average and median amounts of claims for each portion of the METC, indicating much higher amounts for averages than medians. The difference between the average and median values indicates that claim amounts are skewed for each portion of the METC, with a few individuals claiming high amounts of medical expenses and pulling up the average relative to the median. This is particularly true for portion 2 claimants where the difference between the average and median claim amount is larger than for portion 1. This means that some portion 2 claimants claim very high medical expenses. For example, looking at the claim distribution for portion 2, the top 5% of claimants claim over $13,100 and the top 1% of claimants claim over $32,300 in medical expenses for other dependants.
Average and median claims, 2019

4.2.2 Profile of Beneficiaries
Not all eligible claimants of a tax expenditure ultimately benefit from it. They must have a high enough taxable income to benefit from tax savings as a result of claiming this specific tax expenditure. In this study, beneficiaries and the amount of benefits are determined by subtracting the amount of net federal tax that claimants would have to pay in the absence of the METC from the amount payable in the presence of the METC. Footnote 9 The difference between the two amounts is called the tax benefit, or the amount of net federal taxes saved by METC claimants. Footnote 10 Table 2 presents the number of claimants, number of beneficiaries, the benefit rate (defined as the proportion of beneficiaries among claimants) as well as total benefits as a share of total claims.
Overall, there were 4,263,100 beneficiaries of the METC in 2019. They represented about 80.8% of all eligible METC claimants (i.e., of all taxfilers who claimed medical expenses exceeding the expense threshold for portion 1 and/or portion 2). The remaining 19.2% are non-benefitting claimants, which is due to some individuals not having sufficient taxable income to benefit from the credit. The benefit rate is higher among portion 2 claimants (91.7%) than among portion 1 claimants (80.7%). Total METC benefits represent 11.9% of total claims, with portion 1 benefits also representing 11.9% of portion 1 claims and portion 2 benefits representing 13.7% of portion 2 claims.
| Claimants (#) |
Beneficiaries (#) |
Benefit rate (%) |
Total benefits as a share of total claims (%) | |
|---|---|---|---|---|
| METC portion 1 eligible expenses | 5,223,000 | 4,215,400 | 80.7 | 11.9 |
| METC portion 2 eligible expenses | 109,900 | 100,800 | 91.7 | 13.7 |
| Total METC eligible expenses | 5,272,900 | 4,263,100 | 80.8 | 11.9 |
|
Notes: The sum of portion 1 and portion 2 beneficiaries does not add up to the total number of beneficiaries because some taxfilers benefit from both portions. Source: T1 data; Department of Finance calculations. |
||||
Table 3 displays differences in the benefit rate, average benefit, and median benefit among METC claimants pertaining to various sociodemographic groups. It shows that benefit rates in different groups are more or less the same as the benefit rate for all METC claimants (80.8%), except for when we disaggregate different income quintiles. Taxfilers benefit from the METC at higher rates as income increases, which reflects the fact that many individuals in lower income quintiles do not have sufficient taxable income to benefit from the METC. Because younger, older and unattached filers tend to have lower incomes, they also have slightly lower benefit rates. Further, many older filers have access to other large tax credits (such as the age amount and the pension income amount) that can reduce their tax liability to zero. Interestingly, among older filers who are beneficiaries, average benefits from the METC are higher than average benefits for beneficiaries in other age groups.
As with claims, the amount of benefits received within each group is skewed to varying degrees, as evidenced by higher average amounts relative to median amounts. This indicates that some individuals within each group are receiving high benefit amounts (as a result of high claim amounts) and pulling up the average benefit in these groups.
| All claimants | Benefit rate (%) | Average benefit ($) | Median benefit ($) | |
|---|---|---|---|---|
| All Individuals | 5,272,900 | 80.8 | 420 | 230 |
| Gender | ||||
| Men | 39.7 | 81.6 | 440 | 240 |
| Women | 60.3 | 80.4 | 410 | 230 |
| Age group | ||||
| Under 35 | 12.4 | 73.6 | 210 | 120 |
| 35-54 | 27.2 | 86.2 | 350 | 210 |
| 55-64 | 20.1 | 88.4 | 370 | 230 |
| 65 and above | 40.3 | 75.7 | 580 | 310 |
| Family situation | ||||
| Unattached (no spouse) | 33.4 | 74.9 | 390 | 140 |
| One-parent family (no spouse) | 3.5 | 68.5 | 250 | 150 |
| In a couple, 1+ children, higher-income spouse | 5.2 | 90.0 | 420 | 240 |
| In a couple, 1+ children, lower-income spouse | 12 | 85.3 | 340 | 240 |
| In a couple, no children, higher-income spouse | 15.8 | 79.2 | 560 | 310 |
| In a couple, no children, lower-income spouse | 30.1 | 86.4 | 440 | 310 |
| Personal pre-tax income quintile | ||||
| Q1 (under $13,563) | 9.6 | 18.8 | 390 | 310 |
| Q2 (from $13,563 to $26,377) | 21.9 | 59.1 | 260 | 170 |
| Q3 (from $26,377 to $45,247) | 32.1 | 93.4 | 340 | 220 |
| Q4 (from $45,247 to $73,733) | 22.9 | 99.1 | 450 | 250 |
| Q5 (at or above $73,733) | 13.5 | 99.4 | 730 | 320 |
| Adjusted family pre-tax income quintile | ||||
| Q1 (under $18,348) | 8.2 | 20.2 | 130 | 70 |
| Q2 (from $18,348 to $33,638) | 22.7 | 57.8 | 220 | 140 |
| Q3 (from $33,638 to $54,148) | 27.2 | 93.0 | 360 | 220 |
| Q4 (from $54,148 to $83,918) | 23.5 | 96.8 | 450 | 270 |
| Q5 (at or above $83,918) | 18.5 | 97.9 | 650 | 330 |
| Regions of residence | ||||
| Atlantic provinces | 8.4 | 83.4 | 370 | 220 |
| Quebec | 42.8 | 79.6 | 350 | 230 |
| Ontario | 24.7 | 80.9 | 510 | 230 |
| Prairies | 13.5 | 81.6 | 440 | 230 |
| BC and the territories | 10.4 | 83.0 | 530 | 260 |
4.3 Claimants and Beneficiaries from a Family Lens
The METC has a family component. Spouses or common-law partners can choose who should claim the medical expenses incurred for the family regardless of who paid for them. So far, the study assumed that claiming spouses are the only potential beneficiaries of the METC among couples. While claiming spouses have no legal obligation to share their METC benefits some may decide to do so.
Chart 5 looks at the number and shares of METC claimants and non-METC claimants by spouse filing and claiming status.
Chart 5
Distribution of METC claimants and non-METC claimants by spouse filing and claiming status, 2019

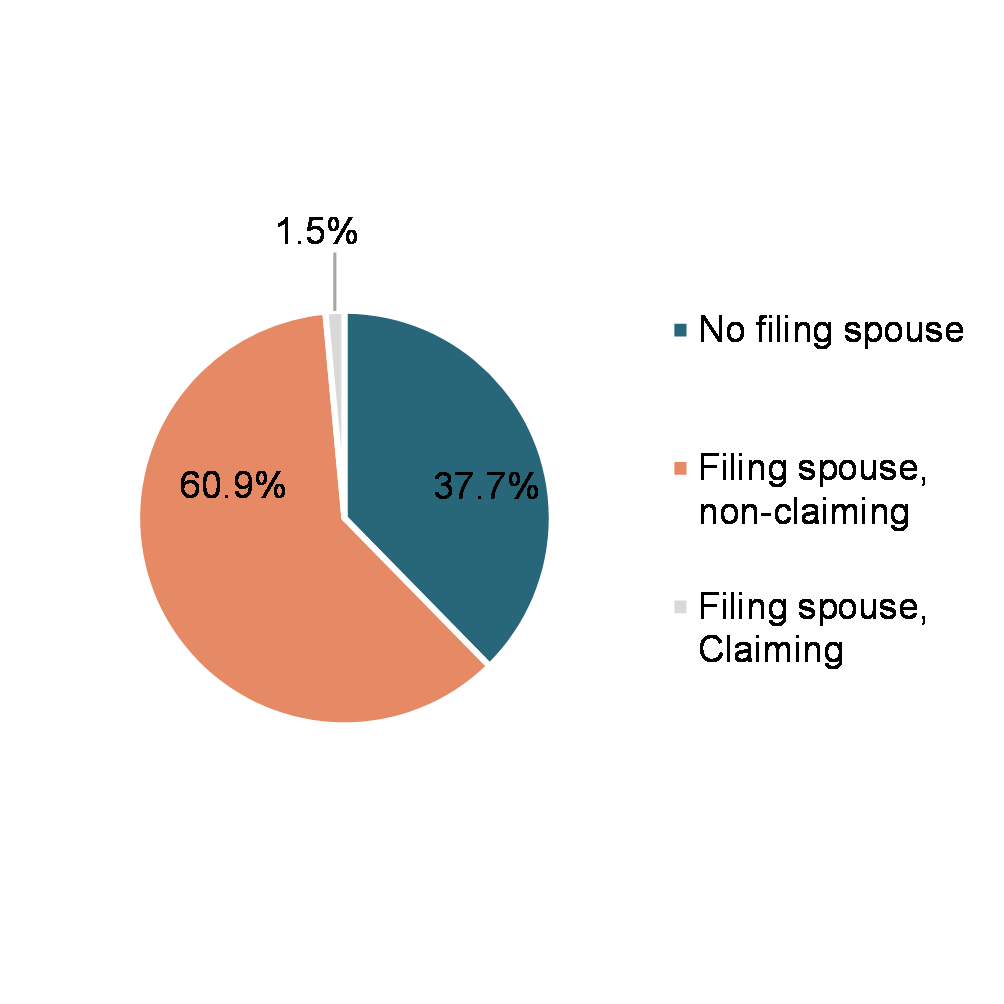
Note: * The category of non-METC claimants with a filing spouse who claims the METC mirrors the category of METC claimants with a filing spouse who does not claim the METC.
Chart 5 shows that on top of the 5.3 million METC claimants in 2019, an additional 3.2 million taxfilers may have indirectly benefited from the METC through their spouse. Indeed, 13.6% of all non-METC claimants were in a couple with a filing spouse who claimed the METC, and potentially shared with them the tax savings resulting from their claim. Chart 5 also indicates that 62.4% of METC claimants were in a couple with a filing spouse, but that very few of these spouses also claimed the METC.
4.4 Interactions with Other Federal Tax Expenditures Related to Health and Medical Expenses
This section focuses on the interactions between the METC and other federal tax expenditures related to health and medical expenses. These tax expenditures are the Refundable Medical Expense Supplement, the Disability Tax Credit, the Disability Supports Deduction, the Home Accessibility Tax Credit, and the Canada Caregiver Credit. Table 4 shows the overlaps in the number of individuals who claim the METC in addition to these other tax expenditures as well as in the total amounts claimed. Overall, 16.6% of all METC claimants also claimed any of the five above-mentioned measures, compared to 3.8% among non-METC claimants. Furthermore, the percentage of all claims made under these other measures by METC claimants (varying from 27.4% for the Disability Tax Credit to 99.9% for the Refundable Medical Expense Supplement) is significantly higher than the 18.2% proportion that METC claimants represent among all taxfilers in 2019.
Looking at the Refundable Medical Expense Supplement more specifically, one in ten METC claimants also claimed the supplement, and essentially all supplement claimants are METC claimants. It makes sense that the Refundable Medical Expense Supplement is closely related to the METC because the supplement amount depends on amounts claimed as part of the METC and the Disability Supports Deduction. Next, the Disability Supports Deduction and the Home Accessibility Tax Credit are much smaller, more targeted measures than the METC. The Disability Supports Deduction applies to specific types of disability expenses for education and work purposes, whereas the Home Accessibility Tax Credit applies to eligible home renovation expenses made by persons with disabilities and individuals aged 65 and older (as well as the individuals that support them). The list of medical expenses eligible for the METC is much broader than that under these tax expenditures. This explains why the Disability Supports Deduction and Home Accessibility Tax Credit claim rates are very small among both METC claimants and the rest of taxfilers. With respect to the Canada Caregiver Credit, the higher claim rate of this credit among METC claimants (2.4% in comparison to 1.3% among non-METC claimants) suggests that some taxfilers with above-average medical expenses are also supporting individuals with physical and mental impairments.
Finally, 4.3% of METC claimants also claimed the Disability Tax Credit for themselves, a proportion higher than among non-METC claimants (2.5%). Intuitively, this suggests an overrepresentation of individuals with above-average medical expenses who live with a disability. This result is supported by a 2023 study that shows that over one in five individuals with a disability claimed the METC. Footnote 11 While there is a relatively high claim rate for persons with disabilities generally, the METC claim rate for those also claiming the Disability Tax Credit for themselves is relatively small, at 4.3%. There are three notable explanations for this. First, the Disability Tax Credit provides non-refundable tax relief to individuals with a severe and prolonged disability in recognition of expenses related to that disability that cannot be detailed. An individual does not need to prove that they have incurred expenses related to their disability to be eligible for the Disability Tax Credit; and, in fact, they may not incur any METC-eligible medical expenses in a given year. Second, individuals with severe disabilities tend to have lower incomes and may not have sufficient taxes owing to claim the METC. Individuals claiming the Disability Tax Credit for themselves are more likely to have low incomes relative to those claiming the METC and taxfilers more generally. Footnote 12 Finally, for certain expenses (such as fees paid for full-time care in a nursing home or for a full-time attendant at home), individuals may claim either the METC for their full care expenses or the Disability Tax Credit amount (alongside up to $10,000 in attendant care, or $20,000 in the year of death of the patient), but not both. Given that there is no upper bound on expenses that may be claimed under the METC, it may be more advantageous for individuals to forgo claiming the Disability Tax Credit in order to claim the full amount of their care expenses under the METC.
| Non-METC claimants | METC claimants | |||||||
|---|---|---|---|---|---|---|---|---|
| Number of claimants | Total amount of claims ($ million) |
% among non-METC claimants | % of all claims | Number of claimants | Total amount of claims ($ million) |
% among METC claimants | % of all claims | |
| Claimed the Refundable Medical Expense Supplement | 380 | 0 | 0.0 | 0.1 | 544,600 | 162 | 10.3 | 99.9 |
| Claimed the Disability Supports Deduction | 2,100 | 8 | 0.0 | 59.5 | 1,200 | 6 | 0.0 | 40.5 |
| Claimed the Home Accessibility Tax Credit | 15,200 | 67 | 0.1 | 58.2 | 11,700 | 48 | 0.2 | 41.8 |
| Claimed the Canada Caregiver Credit | 307,800 | 1,477 | 1.3 | 70.6 | 128,200 | 615 | 2.4 | 29.4 |
| Claimed the Disability Tax Credit* | 600,400 | 5,110 | 2.5 | 72.6 | 226,700 | 1,926 | 4.3 | 27.4 |
| Claimed any of the five above tax expenditures | 908,100 | 6,663 | 3.8 | 70.7 | 876,400 | 2,757 | 16.6 | 29.3 |
| * Refers to taxfilers who claimed the disability amount for self in 2019. | ||||||||
5. Longitudinal Analysis of Claims
This section examines individuals' METC claiming patterns over more than one tax year. It is divided in two main parts. The first examines the group of METC claimants in 2019, looking at their claim persistence over a six-year period, from 2014 to 2019. The second part looks at the dynamic of METC claims over two consecutive years, from 2018 to 2019 and from 2019 to 2020.
5.1 Claim Persistence over Six Years
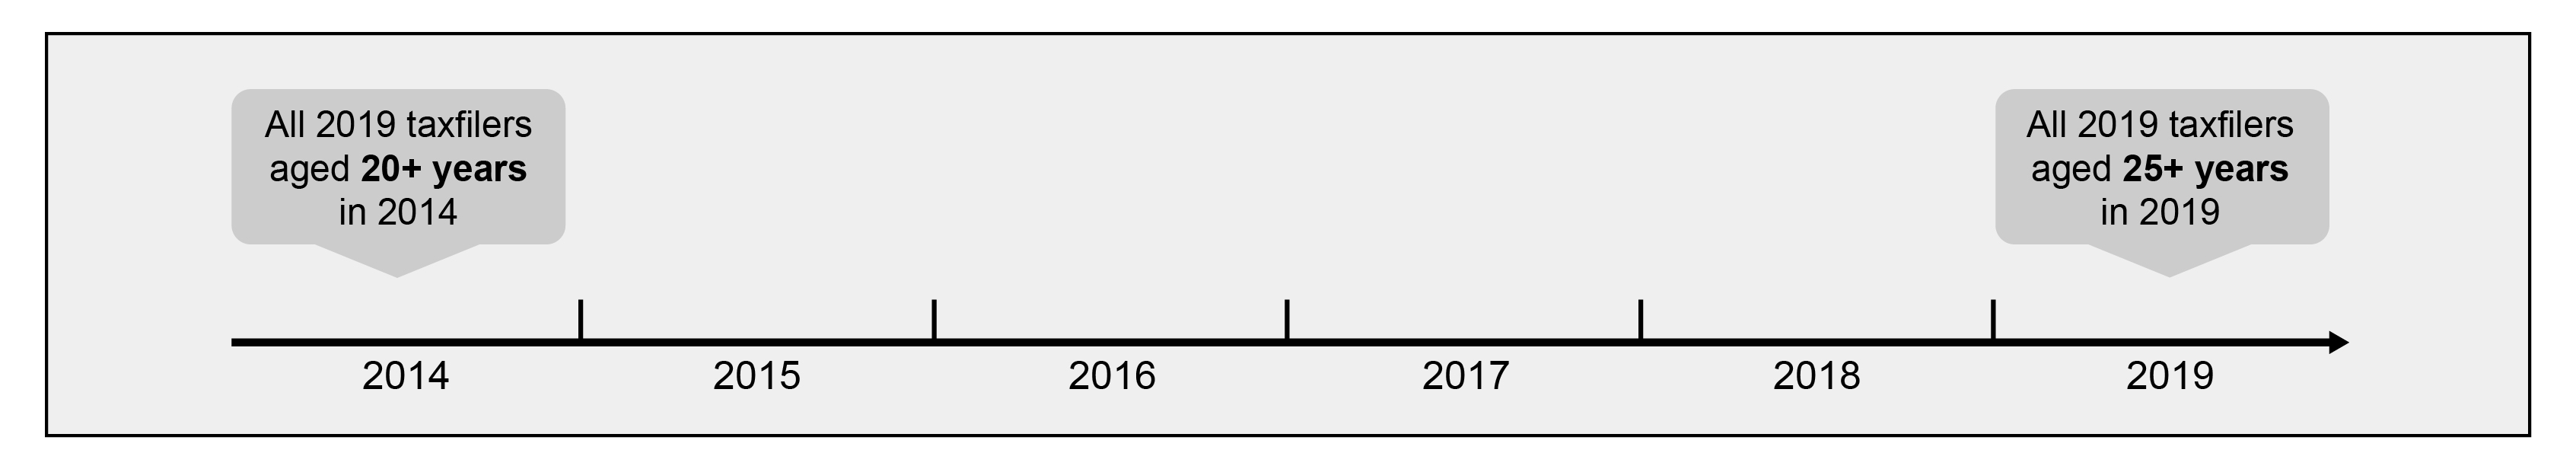
To study claim persistence over several consecutive years, a longitudinal sample must first be selected. Like for the cross-sectional analysis, the reference point for determining the longitudinal sample was all individuals who filed their taxes in 2019. Because the objective is to look at individuals' METC claiming patterns in the years preceding their claims, and because METC claims are less frequent at younger ages, an inferior limit of 25 years of age was imposed in 2019. As the timescale below shows, imposing this age limit ensures that individuals were at least 20 years of age in 2014. By excluding taxfilers under 25 in 2019, 156,900 (5,272,900-5,116,000) taxfilers or 3.0% of METC claimants in 2019 were dropped from the longitudinal sample (Table 5).
Illustration of the longitudinal sample selected for studying the persistence of claims in the five years preceding 2019
Subsample criteria |
(#) | (%) |
|---|---|---|
| All taxfilers in 2019 | 28,903,800 | 100.0 |
All METC claimants in 2019 |
5,272,900 | 18.2 |
| Taxfilers who were 25 years and above in 2019 | 25,601,600 | 88.6 |
Taxfilers aged 25+ who were METC claimants in 2019 [longitudinal sample 1] |
5,116,000 | 17.7 |
|
Note: METC claimants refers to those with eligible METC – portion 1 or portion 2 claims. |
||
Filing and claiming are two factors that may explain METC use over years. A non-filer will automatically not claim, while a filer may claim or not claim depending on their level of medical expenses. Table 6 compares filing patterns between METC claimants aged 25 and above and all taxfilers aged 25 and above. It shows that METC claimants in 2019 are more likely to have filed their taxes for all years between 2014 and 2019, probably due to their higher age on average (older taxfilers have higher tax filing rates). Close to 93% of them filed all 6 years in comparison to 84% of all taxfilers.
From 2014 to 2019 |
Taxfilers aged 25+ in 2019 | METC claimants aged 25+ in 2019 | ||
|---|---|---|---|---|
| Distribution by number of filing years | (#) | (%) | (#) | (%) |
| - Only filed in 2019 | 570,400 | 2.2 | 26,800 | 0.5 |
| - Filed 2 to 3 years from 2014 to 2019 | 1,307,200 | 5.1 | 106,200 | 2.1 |
| - Filed 4 to 5 years from 2014 to 2019 | 2,222,401 | 8.7 | 242,200 | 4.7 |
| - Filed all 6 years from 2014 to 2019 | 21,501,500 | 84.0 | 4,740,700 | 92.7 |
Table 7 divides 2019 METC claimants into four mutually exclusive groups depending on their claiming frequency between 2014 and 2019. According to this table, slightly more than one fifth of them claimed the METC all six years. These individuals are categorized as persistent claimants. By definition, claimants who did not file all years during the six-year observation period cannot be categorized as persistent claimants. On the contrary, less than one fifth of 2019 METC claimants only claimed in 2019. This group is called new claimants. The remaining 60% are intermittent claimants, categorized as either occasional (i.e., claimed 2 to 3 years) or frequent claimants (i.e., claimed 4 to 5 years).
From 2014 to 2019 |
METC claimants aged 25+ in 2019 | |
|---|---|---|
| Distribution by number of claiming years | (#) | (%) |
| - Only claimed in 2019 [NEW claimants] | 897,300 | 17.5 |
| - Claimed 2 to 3 years from 2014 to 2019 [INTERMITTENT/OCCASIONAL claimants] | 1,624,600 | 31.8 |
| - Claimed 4 to 5 years from 2014 to 2019 [INTERMITTENT/FREQUENT claimants] | 1,511,200 | 29.5 |
| - Claimed all 6 years from 2014 to 2019 [PERSISTENT claimants] | 1,082,800 | 21.2 |
Table 8 finds some differences in the sociodemographic profiles of low- and high-frequency METC claimants. Interestingly, the characteristics that are more closely associated with being a frequent or persistent METC claimant are almost the same as the characteristics that increase the probability of a taxfiler claiming the METC in a given year. These characteristics are to be a woman, to be aged 65 years or more, to be part of the middle-income quintiles (i.e., quintiles 2, 3 and 4, but especially the third), and to live in the Atlantic provinces and Quebec. Being unattached is the only characteristic that increases the probability of being a high-frequency METC claimant, while not necessarily being associated with a higher chance of claiming the METC in a given year.
Characteristics in 2019 |
METC claimants aged 25+ in 2019 | |||
|---|---|---|---|---|
| Low-frequency | High-frequency | |||
| New | Interm./ occasional |
Interm./ frequent |
Persistent | |
| Distribution in % by gender | ||||
| Men | 46.7 | 42.5 | 37.4 | 33.4 |
| Women | 53.3 | 57.5 | 62.7 | 66.6 |
| Average age (years) | 52.8 | 57.1 | 61.2 | 65.1 |
| Distribution in % by age group | ||||
| Between 25 and 34 years | 18.5 | 12.0 | 6.8 | 3.1 |
| Between 35 and 54 years | 33.9 | 30.3 | 26.2 | 22.3 |
| Between 55 and 64 years | 20.3 | 21.2 | 20.8 | 20.4 |
| 65 years or more | 27.3 | 36.6 | 46.2 | 54.2 |
| Distribution in % by family situation | ||||
| Unattached (no spouse) | 29.3 | 28.6 | 31.1 | 39.7 |
| One-parent family (no spouse) | 3.7 | 3.9 | 3.6 | 3.1 |
| In a couple, 1+ children, higher-income spouse | 8.4 | 6.7 | 4.5 | 2.1 |
| In a couple, 1+ children, lower-income spouse | 14.2 | 13.8 | 11.8 | 9.1 |
| In a couple, no children, higher-income spouse | 16.6 | 16.3 | 16.1 | 16.0 |
| In a couple, no children, lower-income spouse | 27.8 | 30.8 | 33.0 | 30.1 |
| Average personal pre-tax income ($) | 53,500 | 52,200 | 50,700 | 50,900 |
| Distribution in % by personal pre-tax income quintile | ||||
| Q1 (under $13,563) | 13.3 | 9.6 | 7.6 | 5.0 |
| Q2 (from $13,563 to $26,377) | 20.9 | 21.5 | 22.4 | 21.1 |
| Q3 (from $26,377 to $45,247) | 26.5 | 30.7 | 33.8 | 38.0 |
| Q4 (from $45,247 to $73,733) | 22.2 | 23.4 | 23.4 | 24.6 |
| Q5 (at or above $73,733) | 17.2 | 14.8 | 12.7 | 11.4 |
| Average adjusted family pre-tax income ($) | 65,400 | 65,200 | 64,800 | 65,200 |
| Distribution in % by adjusted family pre-tax income quintile | ||||
| Q1 (under $18,348) | 11.3 | 7.4 | 5.2 | 3.6 |
| Q2 (from $18,348 to $33,638) | 21.1 | 21.8 | 23.1 | 23.7 |
| Q3 (from $33,638 to $54,148) | 24.7 | 27.5 | 28.6 | 29.4 |
| Q4 (from $54,148 to $83,918) | 22.3 | 23.9 | 24.7 | 25.2 |
| Q5 (at or above $83,918) | 20.5 | 19.4 | 18.5 | 18.2 |
| Distribution in % by region of residence | ||||
| Atlantic provinces | 7.2 | 7.9 | 8.6 | 10.4 |
| Quebec | 28.9 | 37.4 | 47.0 | 55.3 |
| Ontario | 34.0 | 27.9 | 22.0 | 16.6 |
| Prairies | 17.0 | 15.1 | 12.5 | 9.9 |
| BC and the territories | 13.0 | 11.6 | 9.9 | 7.8 |
According to Table 9, the intensity of METC claims over the longer term (i.e., the percentage of total METC claims and average claim amount over multiple years), varies greatly among low- and high-frequency claimants. Overall, 2019 METC claimants claimed a total amount of about $53 billion under the METC from 2014 to 2019. Of this total amount, only 4% was claimed by new METC claimants, a proportion much lower than the proportion they represented among all 2019 METC claimants (i.e., 17.5%). On the other hand, frequent and persistent METC claimants claimed more than three quarters of total METC claims while they represented just above half of claimants. The average amount of yearly claims is also higher among frequent and persistent claimants than it is among new and occasional claimants.
| METC claimants aged 25+ in 2019 | ||||
|---|---|---|---|---|
| Low-frequency | High-frequency | |||
| New | Interm./ occasional |
Interm./ frequent |
Persistent | |
| Total amount claimed under the METC ($ million) | 2,106 | 10,205 | 19,128 | 21,566 |
| - Percentage of total METC amount claimed (%) | 4.0 | 19.3 | 36.1 | 40.7 |
| Average amount of METC claims over the claiming years ($) | 2,300 | 2,500 | 2,800 | 3,300 |
5.2 Dynamic of Claims over Two Consecutive Years
To look at the dynamic of METC claims over two consecutive years, other longitudinal samples needed to be selected. Again, the reference point for this analysis is the 2019 tax year. As illustrated below, the new longitudinal samples are made up of all individuals who filed a tax return in either of the 2018 or 2019 tax years, and then in either of the 2019 or 2020 tax years. With such samples, it is possible to examine the patterns of entry into and exit from the METC in 2019, and then to compare these patterns with those that occurred in the first year of the pandemic.
Illustration of the two longitudinal samples selected for studying the dynamic of claims over two consecutive years, 2018-2019 and 2019-2020
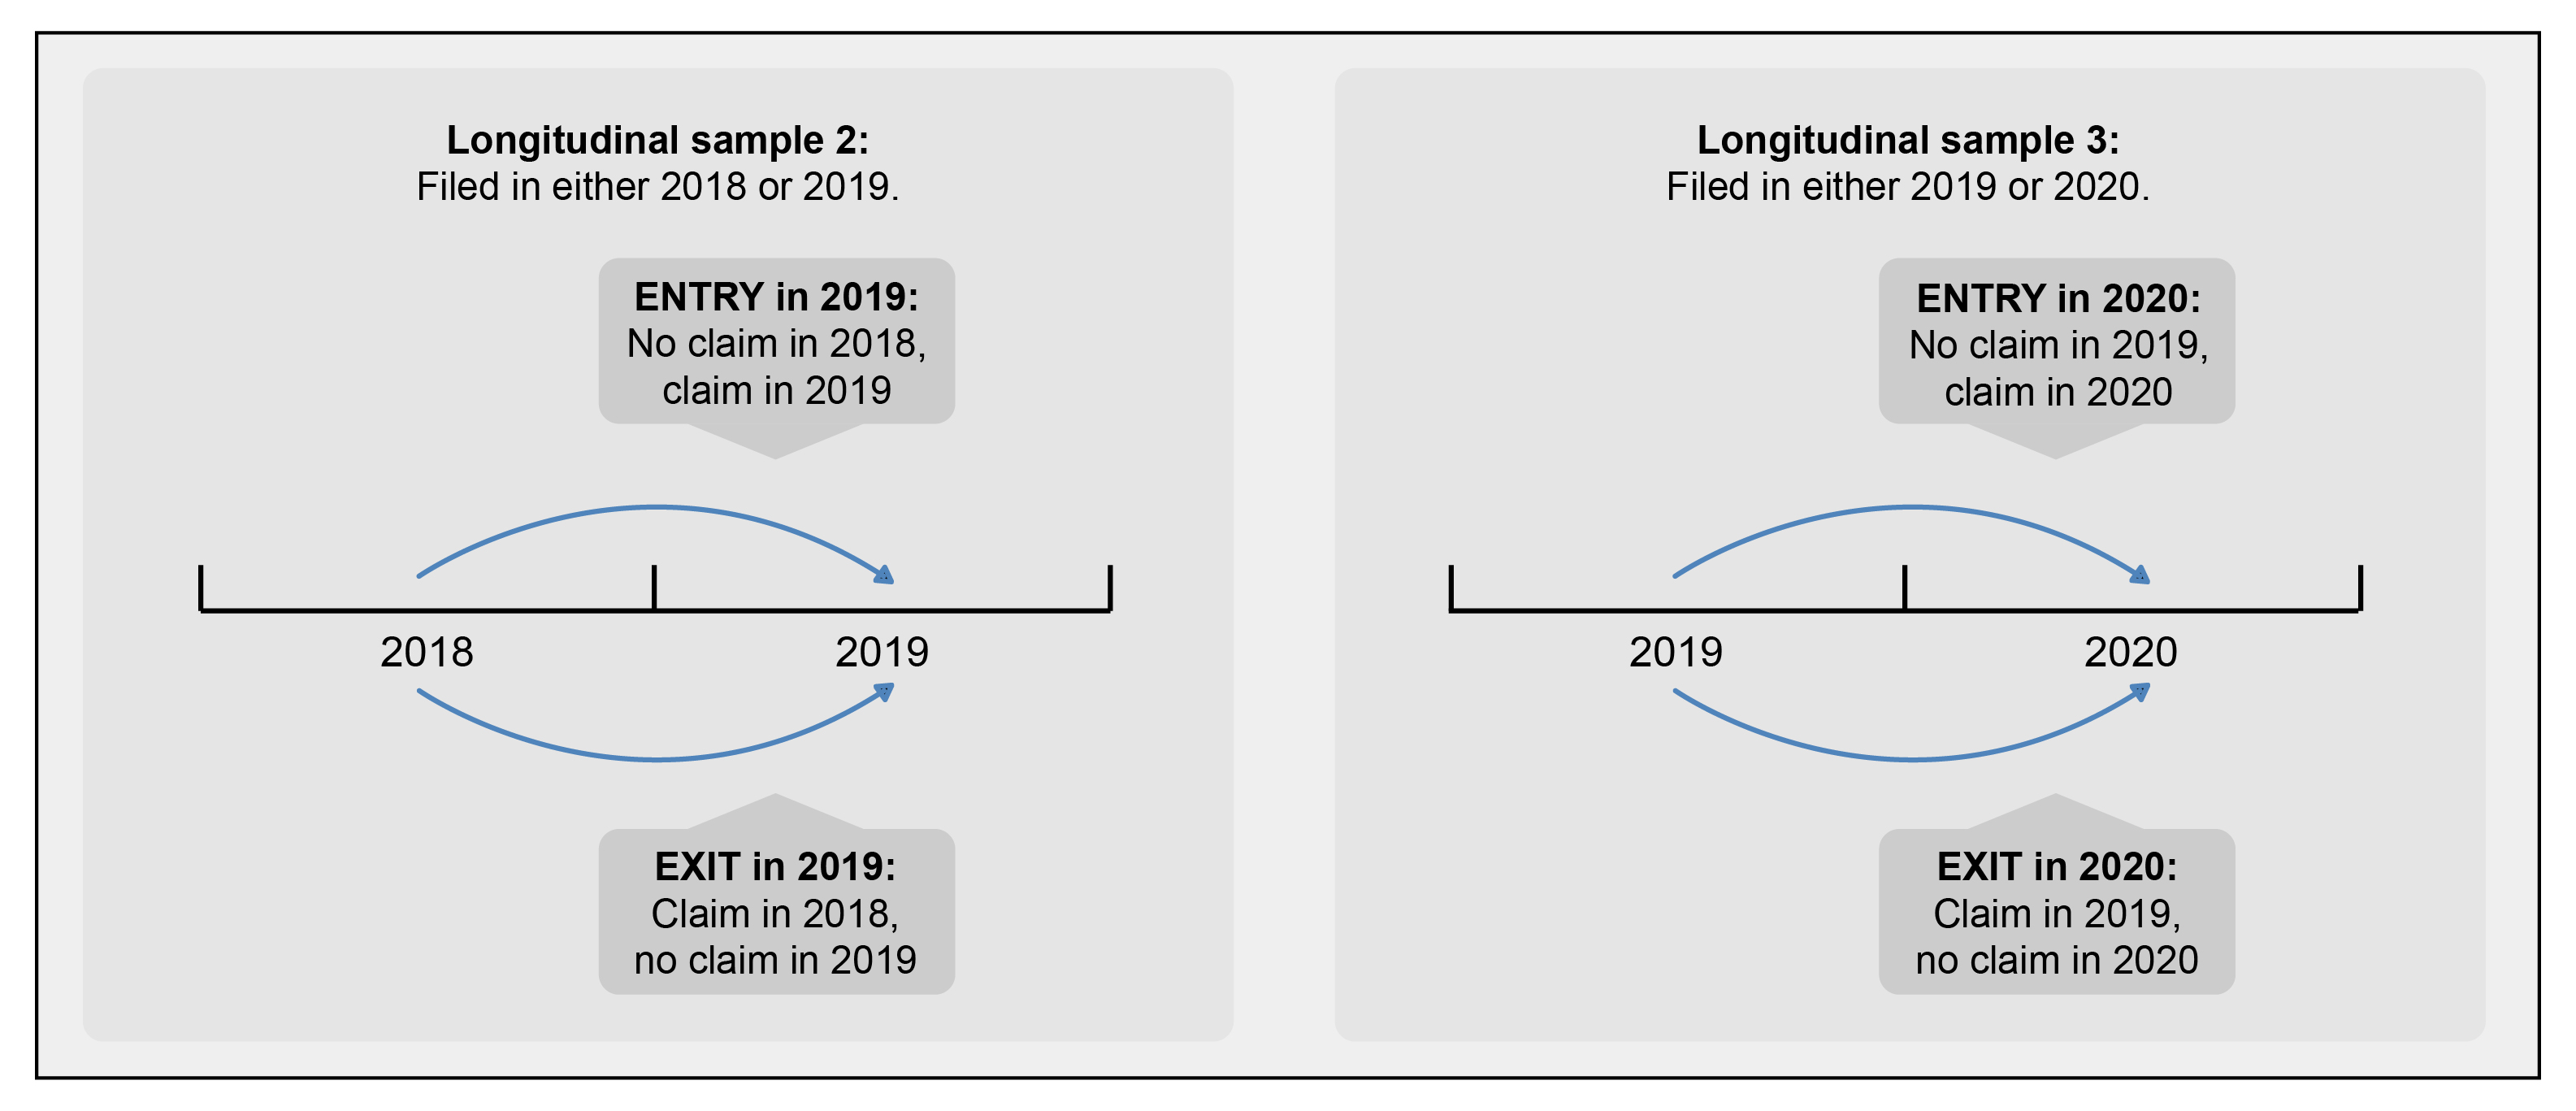
As results in Table 10 indicate, of all individuals who filed a T1 return in either 2018 or 2019, 23.9% claimed the METC in at least one of these two years. About 10.8% of them claimed the METC in 2019 and the year prior, whereas similar proportions of them started (6.6%) and stopped (6.5%) claiming the METC in 2019. In comparison, the proportion of filers who continued to claim in 2020 – the first year of the pandemic – decreased to 10.3%, and the proportion of those who exited the METC (7.0%) was slightly above that who entered it (6.0%). This dynamic explains why the overall proportion of METC claims decreased between 2019 and 2020.
| Reference year/Current year | 2019 | 2020 |
|---|---|---|
| Number of taxfilers in the longitudinal sample | 30,301,200 | 30,620,800 |
| Number of longitudinal taxfilers who did not claim the METC in previous and current years | 23,057,200 | 23,500,200 |
| Number of longitudinal taxfilers who claimed the METC in previous or current years (longitudinal claimants) | 7,244,000 | 7,120,600 |
| Among all longitudinal taxfilers | ||
| % claimed in both previous and current years (i.e., % of continuous claimants) | 10.8 | 10.3 |
| % who did not claim in previous year, but claimed in current year (entry rate or % of new claimants) | 6.6 | 6.0 |
| % who claimed in previous year, but did not claim in current year (exit rate or % of former claimants) | 6.5 | 7.0 |
| Among all longitudinal METC claimants | ||
| % of continuous METC claimants | 45.1 | 44.1 |
| % of new claimants | 27.7 | 25.9 |
| % of former claimants | 27.2 | 30.0 |
|
* Refers to all taxfilers who were not METC claimants in previous year but were METC claimants in current year. ** Refers to all taxfilers who were METC claimants in previous year but were not METC claimants in current year. |
||
Table 11 presents the potential reasons behind entries into and exits from the METC. It shows that most new METC claims are due to individuals starting to claim the credit on their T1 return (77.3% in 2019). Reporting a higher amount of gross medical expenses is the second most common reason. Less than 6% of new claims are mainly due to a significant change in taxfilers' net income level. The reverse situations are also the most likely explanations to stop being an METC claimant between two consecutive years. In other words, the two most common reasons to stop being an METC claimant are to stop claiming the credit and to experience a drop in gross medical expenses. However, the proportion who stop being METC claimants because they stop filing is slightly higher than the proportion who start being METC claimants because they start filing. Again, this is likely because of the older age profile of METC claimants.
| Reference year/Current year | 2019 | 2020 |
|---|---|---|
| Distribution in % of "new claimants" by main reason for starting to claim | ||
| Started being a filer | 4.7 | 5.4 |
| Started to claim the METC (by reporting gross medical expenses) | 77.3 | 77.0 |
| Experienced a rise in gross medical expenses | 17.3 | 16.8 |
| Did not experience a rise in medical expenses, but a change in net income | 0.8 | 0.8 |
| Distribution in % of "former claimants" by main reason for stopping to claim | ||
| Stopped being a filer | 8.3 | 7.6 |
| Stopped claiming the METC (by no longer reporting gross medical expenses) | 72.7 | 71.3 |
| Experienced a drop in gross medical expenses | 17.9 | 19.9 |
| Did not experience a drop in medical expenses, but a change in net income | 1.1 | 1.2 |
6. Conclusion
The METC provides tax relief to individuals and their family members who have above-average medical expenses. This study uses data from 2008 to 2020 to highlight various trends and characteristics of claimants and beneficiaries.
The share of taxfilers who claimed the METC increases from 2008 to 2019 and drops slightly in 2020, coinciding with the beginning of the COVID-19 pandemic. Average eligible claim amounts for immediate family members and other dependants remained stable over the same period at approximately $2,800 combined (2019 dollars). The 5.3 million METC claimants in 2019 benefited from an average amount of $420 in tax savings as a result of their claims. An additional 3.2 million taxfilers may have indirectly benefited from the METC through their claiming spouse. In terms of their characteristics, METC claimants are overrepresented among women, individuals aged 65 and above, lower-income spouses in a couple without children, middle-income taxfilers, and residents of Quebec and the Atlantic provinces. Persistence of claims is also more common among most of these groups. About half of METC claimants in 2019 were either new claimants (i.e., they only claimed this tax expenditure in 2019 from 2014 to 2019) or occasional claimants (i.e., they claimed it 2 to 3 years over the 6-year period). The other half were more frequent claimants. While unattached taxfilers are not more likely to claim the METC in a given year, the longitudinal analysis suggests that, once they claim, they are especially likely to be high-frequency claimants.
Annex: Trends in the Number of METC Claimants and Total Amount of METC Claims
Tax year |
All taxfilers | METC – portion 1 claimants of gross medical expenses | METC – portion 1 claimants of eligible medical expenses | METC – portion 2 claimants of eligible medical expenses | METC – total claimants of eligible medical expenses |
|---|---|---|---|---|---|
| 2008 | 24,963,800 | 4,737,700 | 3,836,600 | 89,300 | 3,878,500 |
| 2009 | 25,230,200 | 5,281,100 | 4,000,900 | 95,000 | 4,043,600 |
| 2010 | 25,460,900 | 5,463,200 | 4,158,900 | 100,100 | 4,203,800 |
| 2011 | 25,767,000 | 5,747,400 | 4,295,100 | 103,100 | 4,341,600 |
| 2012 | 26,119,000 | 5,951,300 | 4,362,400 | 109,800 | 4,413,500 |
| 2013 | 26,505,600 | 6,252,800 | 4,486,800 | 112,300 | 4,539,000 |
| 2014 | 26,909,500 | 6,536,100 | 4,640,200 | 113,300 | 4,692,800 |
| 2015 | 27,152,900 | 6,817,500 | 4,821,300 | 116,700 | 4,875,500 |
| 2016 | 27,445,100 | 7,071,500 | 4,963,000 | 117,700 | 5,017,500 |
| 2017 | 27,847,900 | 7,274,600 | 5,078,400 | 114,300 | 5,130,800 |
| 2018 | 28,359,000 | 7,509,300 | 5,186,500 | 112,500 | 5,237,600 |
| 2019 | 28,903,800 | 7,685,000 | 5,223,000 | 109,900 | 5,272,900 |
| 2020 | 29,019,100 | 7,598,100 | 4,939,800 | 94,100 | 4,986,400 |
Tax year |
METC – portion 1 claims of gross medical expenses | METC – portion 1 claims of eligible medical expenses | METC – portion 2 claims of eligible medical expenses | METC – total claims of eligible medical expenses |
|---|---|---|---|---|
| 2008 | 15,173 | 10,867 | 185 | 11,052 |
| 2009 | 16,160 | 11,221 | 194 | 11,415 |
| 2010 | 16,696 | 11,562 | 203 | 11,765 |
| 2011 | 17,081 | 12,108 | 254 | 12,361 |
| 2012 | 17,423 | 12,120 | 265 | 12,385 |
| 2013 | 18,204 | 12,611 | 271 | 12,881 |
| 2014 | 18,753 | 12,874 | 282 | 13,155 |
| 2015 | 19,561 | 13,478 | 292 | 13,770 |
| 2016 | 20,304 | 14,059 | 301 | 14,360 |
| 2017 | 21,128 | 14,464 | 314 | 14,770 |
| 2018 | 21,920 | 14,480 | 324 | 14,804 |
| 2019 | 22,437 | 14,836 | 324 | 15,160 |
| 2020 | 20,956 | 13,420 | 302 | 13,723 |
Tax year |
METC – portion 1 – gross medical expenses | METC – portion 1 – eligible medical expenses | METC – portion 2 – eligible medical expenses | Total METC eligible medical expenses | For comparison: Expenditure on health care per household (SHS*) |
|---|---|---|---|---|---|
| 2008 | 3,200 | 2,800 | 2,100 | 2,800 | |
| 2009 | 3,100 | 2,800 | 2,000 | 2,800 | |
| 2010 | 3,100 | 2,800 | 2,000 | 2,800 | 2,700 |
| 2011 | 3,000 | 2,800 | 2,500 | 2,800 | 2,600 |
| 2012 | 2,900 | 2,800 | 2,400 | 2,800 | 2,600 |
| 2013 | 2,900 | 2,800 | 2,400 | 2,800 | 2,800 |
| 2014 | 2,900 | 2,800 | 2,500 | 2,800 | 2,500 |
| 2015 | 2,900 | 2,800 | 2,500 | 2,800 | 2,600 |
| 2016 | 2,900 | 2,800 | 2,600 | 2,900 | 2,800 |
| 2017 | 2,900 | 2,800 | 2,700 | 2,900 | 2,700 |
| 2018 | 2,900 | 2,800 | 2,900 | 2,800 | |
| 2019 | 2,900 | 2,800 | 2,900 | 2,900 | 2,800 |
| 2020 | 2,800 | 2,700 | 3,200 | 2,800 | |
|
* Statistics Canada, Survey of Household Spending, Table 8-10-0222-01. |
|||||