
Analysis of trends in spending and human resources
Actual expenditures
Departmental spending trend graph
The following graph presents planned (voted and statutory) spending over time.
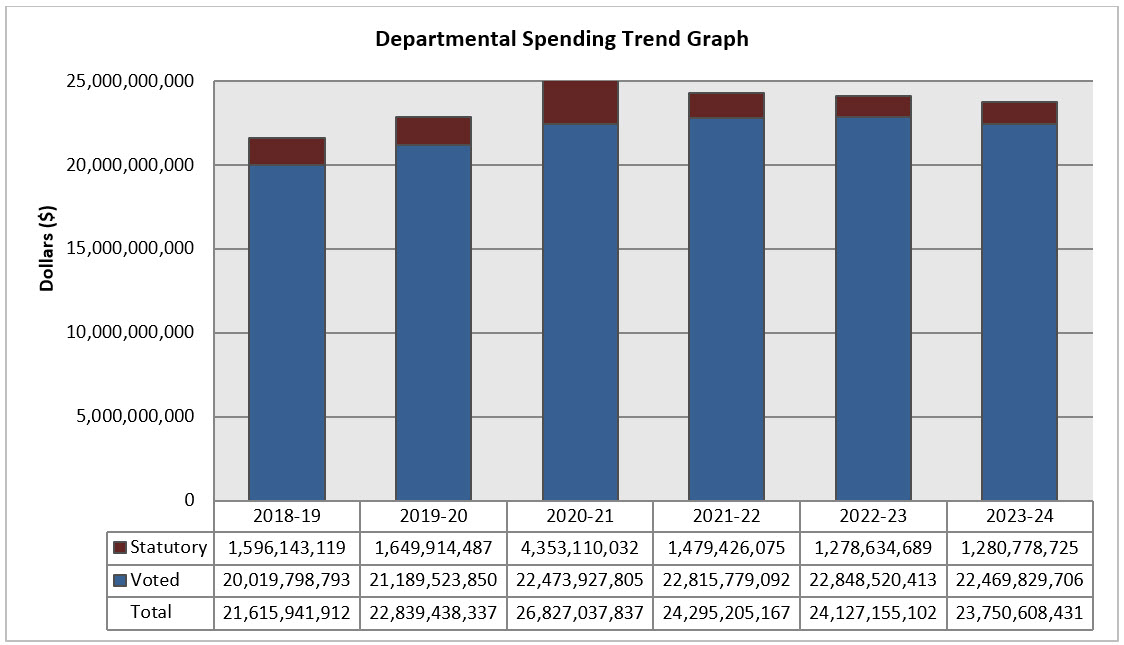
Description of Figure: Departmental Spending Trend Graph
This bar graph depicts Defence's financial spending trend starting with fiscal year 2018-19.
On the Y-axis are dollars ranging from 0 to 25,000,000,000. On the X-axis is Fiscal Year 2018-19 through 2023-24.
Statutory Financial Spending Trend is:
- $1,596,143,119 in 2018-19;
- $1,649,914,487 in 2019-20;
- $4,353,110,032 in 2020-21;
- $1,479,426,075 in 2021-22;
- $1,278,634,689 in 2022-23; and
- $1,280,778,725 in 2023-24.
Voted Financial Spending Trend is:
- $20,019,798,793 in 2018-19;
- $21,189,523,850 in 2019-20;
- $22,473,927,805 in 2020-21;
- $22,815,779,092 in 2021-22;
- $22,848,520,413 in 2022-23; and
- $22,469,829,706 in 2023-24.
Total Financial Spending Trend is:
- $21,615,941,912 in 2018-19;
- $22,839,438,337 in 2019-20;
- $26,827,037,837 in 2020-21;
- $24,295,205,167 in 2021-22;
- $24,127,155,102 in 2022-23; and
- $23,750,608,431 in 2023-24.
Budgetary performance summary for Core Responsibilities and Internal Services (dollars)
| Core Responsibilities and Internal Services | 2020–21 Main Estimates | 2020–21 Planned spending | 2021–22 Planned spending | 2022–23 Planned spending | 2020–21 Total authorities available for use | 2018–19 Actual spending (authorities used) | 2019–20 Actual spending (authorities used) | 2020–21 Actual spending (authorities used) |
|---|---|---|---|---|---|---|---|---|
| Operations | 1,075,628,685 | 1,080,817,402 | 684,095,922 | 688,988,747 | 1,342,474,789 | 1,424,919,741 | 1,044,514,772 | 1,028,857,684 |
| Ready Forces | 9,716,036,927 | 9,760,714,328 | 9,972,852,765 | 10,096,532,908 | 11,722,566,619 | 9,506,982,585 | 9,875,229,209 | 11,719,160,120 |
| Defence Team | 9,416,850,794 | 3,444,253,339 | 3,554,626,936 | 3,591,485,901 | 4,102,372,061 | 2,779,583,406 | 3,365,827,143 | 4,057,640,230 |
| Future Force Design | 840,491,721 | 845,220,905 | 768,019,319 | 779,337,759 | 881,591,666 | 845,573,026 | 758,767,329 | 836,173,606 |
| Procurement of Capabilities | 3,907,432,104 | 3,910,791,611 | 4,741,325,826 | 4,310,164,815 | 4,701,330,194 | 3,069,157,738 | 3,298,055,560 | 4,119,915,713 |
| Sustainable Bases, Information Technology Systems and Infrastructure | 3,665,573,962 | 3,680,697,534 | 3,829,653,614 | 3,899,491,700 | 4,165,436,326 | 3,219,172,782 | 3,651,639,001 | 4,185,750,629 |
| Subtotal | 22,622,014,193 | 22,722,495,119 | 23,550,574,382 | 23,366,001,830 | 26,915,771,655 | 20,845,389,278 | 21,994,033,014 | 25,947,497,982 |
| Internal Services | 695,921,525 | 699,552,288 | 744,630,785 | 761,153,272 | 1,137,790,770 | 770,552,634 | 845,405,323 | 879,539,855 |
| Total | 23,317,935,718 | 23,422,047,407 | 24,295,205,167 | 24,127,155,102 | 28,053,562,425 | 21,615,941,912 | 22,839,438,337 | 26,827,037,837 |
Source: Vice-Chief of the Defence Staff Group / Assistant Deputy Minister (Finance) / Chief Financial Officer Group
Notes:
- Due to rounding, figures may not add up to totals shown.
- Where the actual spending amount is higher than the total authorities, this does not represent an over-expenditure of Parliamentary authorities. Parliamentary authorities are allocated by vote and not by core responsibility and program.
- Significant variances in financial resources are detailed at the core responsibility and program level in the “Supporting information on the program inventory” section of the document. Explanations are provided when the variance is at least 100M or when the difference between the actual and the planned amount is 100%.
Budgetary actual gross spending summary (dollars)
| Core Responsibilities and Internal Services | 2020–21 Actual gross spending |
2020–21 Actual revenues netted against expenditures |
2020–21 Actual net spending (authorities used) |
|---|---|---|---|
| Operations | 1,028,948,799 | 91,115 | 1,028,857,684 |
| Ready Forces | 11,871,664,331 | 152,504,211 | 11,719,160,120 |
| Defence Team | 4,107,266,816 | 49,626,586 | 4,057,640,230 |
| Future Force Design | 836,474,895 | 301,289 | 836,173,606 |
| Procurement of Capabilities | 4,119,983,111 | 67,398 | 4,119,915,713 |
| Sustainable Bases, Information Technology Systems and Infrastructure | 4,337,795,219 | 152,044,590 | 4,185,750,629 |
| Subtotal | 26,302,133,171 | 354,635,189 | 25,947,497,982 |
| Internal Services | 892,123,932 | 12,584,077 | 879,539,855 |
| Total | 27,194,257,103 | 367,219,266 | 26,827,037,837 |
Notes: Due to rounding, figures may not add up to totals shown.
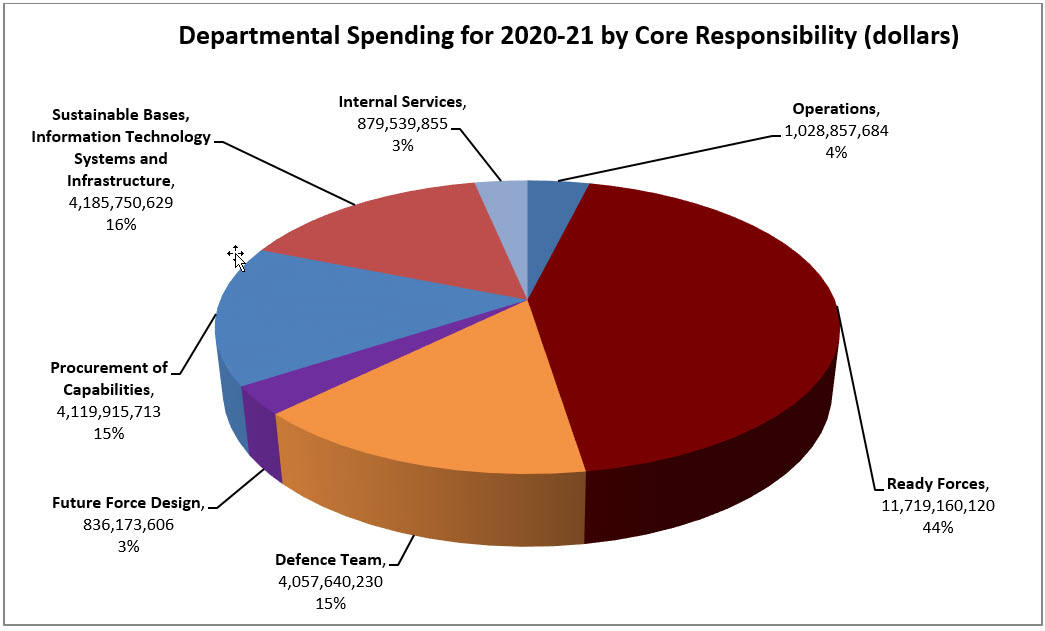
Description of Figure: Departmental Spending for 2020-21 by Core Responsibility (dollars)
This pie chart illustrates the Department of National Defence’s spending for Fiscal Year 2020-21, broken down by Core Responsibility.
The percentages allocated to each section, from largest to smallest, are:
- 44%, $11,719,160,120 for Ready Forces;
- 16%, $4,185,750,629 for Sustainable Bases, Information Technology Systems and Infrastructure;
- 15%, $4,119,915,713 for Procurement of Capabilities;
- 15%, $4,057,640,230 for Defence Team;
- 4%, $1, 028,857,684 for Operations;
- 3%, $879,539,855 for internal Services; and
- 3%, $836,173,606 for Future Force Design.
Actual human resources
The COVID-19 pandemic impacted the CAF’s ability to recruit and train personnel. As a result, the total CAF Regular Force strength declined from 67 500 personnel to 65 554 personnel in FY 2020–21.
The department’s civilian population increased to 25 629 full-time equivalents (FTEs), up from 25 499 from FY 2019–20. This increased capacity helps ensure that we have the right people, in the right place, at the right time while respecting human resources and budget allocations. The department is in a state of growth and is focused on aligning civilian resources to fulfill renewed departmental priorities and supporting SSE.
The following table shows actual, forecast and planned full-time equivalents (FTEs) for each Core Responsibility in the Department of National Defence and the Canadian Armed Forces’ departmental results framework and to Internal Services for the years relevant to the current planning year.
Human resources summary for Core Responsibilities and Internal Services
| Core Responsibilities and Internal Services | 2018–19 Actual full-time equivalents |
2019–20 Actual full-time equivalents |
2020–21 Planned full-time equivalents |
2020–21 Actual full-time equivalents |
2021–22 Planned full-time equivalents |
2022–23 Planned full-time equivalents |
|---|---|---|---|---|---|---|
| Operations | 4,884 | 2,647 | 2,860 | 2,156 | 3,078 | 3,113 |
| Ready Forces | 45,566 | 45,797 | 46,489 | 45,431 | 46,716 | 47,177 |
| Defence Team | 20,123 | 20,407 | 20,838 | 18,902 | 18,059 | 18,223 |
| Future Force Design | 2,421 | 1,930 | 2,223 | 1,883 | 2,086 | 2,072 |
| Procurement of Capabilities | 2,420 | 2,427 | 2,176 | 2,525 | 2,843 | 2,832 |
| Sustainable Bases, Information Technology Systems and Infrastructure | 13,209 | 15,974 | 14,843 | 15,944 | 16,493 | 16,519 |
| Subtotal | 88,623 | 89,182 | 89,429 | 86,841 | 89,275 | 89,936 |
| Internal Services | 3,347 | 4,070 | 5,293 | 4,342 | 4,470 | 4,456 |
| Total | 91,970 | 93,252 | 94,722 | 91,183 | 93,745 | 94,392 |
Total planned human resources – Reserve Force personnel
The Reserve Force is a valued and integrated component of the CAF. It is divided into four distinct sub-components:
- Primary Reserve Force;
- Cadet Organization Administration and Training Service;
- Canadian Rangers; and
- Supplementary Reserve (strategic reserve).
The Primary Reserve consists predominately of part-time professional CAF members, located throughout Canada, ready with reasonable notice to conduct or contribute to domestic and international operations to safeguard the defence and security of Canada. As articulated in Strong, Secure, Engaged: Canada’s Defence Policy, there are 10 independent initiatives and two activities that centre on the Reserve Force. In FY 2020–21, the Central Coordination Authority was established within the Vice Chief of the Defence Staff Group in order to review the existing fiscal framework of these initiatives and activities and to manage access to funding through a single conduit. The Central Coordination Authority will coordinate efforts across the CAF to meet the overall Defence Policy objective of maximizing the operational output of the Reserve Force (full-time capability through part-time service) through the conception, development, funding, sustainment and integration of unique enablers and/or combat multipliers (new or existing).
The Cadet Organization Administration and Training Service completed an organizational restructure and will be maintained at the current approved target of 8 000 personnel.
The Canadian Rangers are an integral CAF northern presence and regularly provide support to local, provincial or territorial authorities for ground search and rescue. They are Canada’s eyes, ears and guides across the country, particularly the sparsely settled northern, coastal and isolated areas of Canada. The Canadian Rangers, as a sub-component of the Reserve Force are separate from the Primary Reserve Force and are unique not only in the skills and expertise they bring to the CAF, but also in the locations in which they operate.
The COVID-19 pandemic resulted in more requests for support from Canadian Rangers compared to previous years. In FY 2020–21, Canadian Rangers contributions included:
- More than 1 100 days of Canadian Rangers supporting their communities as part of either Operations VECTOR or LENTUS;
- More than 60 ground search and rescue; and
- Nineteen patrols to inspect Northern warning system sites.
Canadian Rangers patrol growth was paused in FY 2020–21 in order to limit the risk of transmitting COVID-19 to isolated communities. This growth will resume when restrictions ease.
During FY 2020–21, Canadian Ranger development and enhancement were areas of focus as part of an overall ongoing review of the Canadian Ranger program. This review will seek to optimize the Rangers’ role while modernizing institutional support to operations. In January 2021, the Commander of the CA issued his planning guidance to start the implementation of the Canadian Ranger Enhancement initiative in the second quarter of FY 2021–22.
The following table provides our total planned human resources for Reserve Force personnel for the next three FYs (2020–23).
| Planned 2020–21 | Actual 2020–21 | Difference (actual minus planned) | |
|---|---|---|---|
| Primary Reserve | 28,950 | 23,935 | 5,015 |
| Cadet Organization Administration and Training Service | 8,000 | 6,965 | 1,035 |
| Canadian Rangers | 5,640 | 5,249 | 391 |
Average paid strength (APS) is used to report the strength of the Primary Reserve in the Departmental Results Report as per the guidance and methodology for counting the Primary Reserve, dated 6 March 2017. The guidance and methodology indicate that APS will continue to be used to report to Government, while other metrics are used internally to report to CAF. To enhance accuracy in reporting Primary Reserve strength and capabilities, a harmonized methodology is deemed necessary. To do so, a one-CAF establishment model will set the appropriate framework required to increase efficiency and effectiveness in measuring the Primary Reserve output (trained effective strength) in support of Canada’s Defence Policy (SSE).
Expenditure by vote
For information on the Department of National Defence and the Canadian Armed Forces’ organizational voted and statutory expenditures, consult the Public Accounts of Canada 2020-21Endnote 186.
Government of Canada spending and activities
Information on the alignment of the Department of National Defence and the Canadian Armed Forces’ spending with the Government of Canada’s spending and activities is available in the GC InfoBase Endnote 187.
Financial statements and financial statements highlights
Financial statements
The Department of National Defence and the Canadian Armed Forces’ financial statements (unaudited) for the year ended 31 March 2021 are available on the departmental websiteEndnote 188.
Financial statements highlights
Condensed Statement of Operations (unaudited) for the year ended 31 March 2021 (dollars)
| Financial information | 2020–21 Planned results | 2020–21 Actual results | 2019–20 Actual results | Difference (2020–21 Actual results minus 2020–21 Planned results) | Difference (2020–21 Actual results minus 2019–20 Actual results) |
|---|---|---|---|---|---|
| Total expenses | 22,945,471 | 26,733,836 | 22,840,168 | 3,788,365 | 3,893,668 |
| Total revenues | 424,908 | 387,243 | 428,141 | (37,665) | (40,898) |
| Net cost of operations before government funding and transfers | 22,520,563 | 26,346,593 | 22,412,027 | 3,826,030 | 3,934,566 |
Condensed Statement of Financial Position (unaudited) as of 31 March 2021 (dollars)
| Financial information | 2020–21 | 2019–20 | Difference (2020–21 minus 2019–20) |
|---|---|---|---|
| Total net liabilities | 7,208,305 | 6,219,658 | 988,647 |
| Total net financial assets | 3,664,528 | 3,263,733 | 400,795 |
| Departmental net debt | 3,543,777 | 2,955,925 | 587,852 |
| Total non-financial assets | 43,342,374 | 41,504,280 | 1,838,094 |
| Departmental net financial position | 39,798,597 | 38,548,355 | 1,250,242 |