
Spending and human resources
Spending
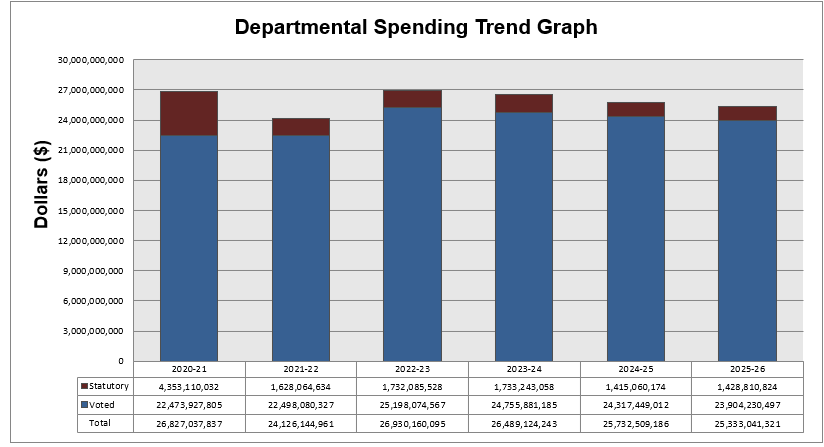
Spending FY 2020-21 to FY 2025-26
The following graph presents planned (voted and statutory) spending over time.
Long description
This bar graph depicts Defence's financial spending trend starting with fiscal year 2020-21.
On the Y-axis are dollars ranging from 0 to 30,000,000,000. On the X-axis is Fiscal Year 2020-21 through 2025-26.
Statutory Financial Spending Trend is:
- $4,353,110,032 in 2020-21;
- $1,628,064,634 in 2021-22;
- $1,732,085,528 in 2022-23;
- $1,733,243,058 in 2023-24;
- $1,415,060,174 in 2024-25; and
- $1,428,810,824 in 2025-26.
Voted Financial Spending Trend is:
- $22,473,927,805 in 2020-21;
- $22,498,080,327 in 2021-22;
- $25,198,074,567 in 2022-23;
- $24,755,811,185 in 2023-24;
- $24,317,449,012 in 2024-25; and
- $23,904,230,497 in 2025-26.
Total Financial Spending Trend is:
- $26,827,037,837 in 2020-21;
- $24,126,144,961 in 2021-22;
- $26,930,160,095 in 2022-23;
- $26,489,124,243 in 2023-24;
- $25,732,509,186 in 2024-25; and
- $25,333,041,321 in 2025-26.
Note: Figures due to rounding may not add up to total shown.
Budgetary performance summary for core responsibilities and internal services (dollars)
The “Budgetary performance summary for core responsibilities and internal services” tablepresents the budgetary financial resources allocated for the Department of National Defence and Canadian Armed Forces’ core responsibilities and for internal services.
| Core responsibilities and Internal Services | 2022–23 Main Estimates | 2022–23 Planned spending | 2023–24 Planned spending | 2024–25 Planned spending | 2022–23 Total authorities available for use | 2020–21 Actual spending (authorities used) | 2021–22 Actual spending (authorities used) | 2022-23 Actual spending (authorities used) |
|---|---|---|---|---|---|---|---|---|
| Operations | 794,902,544 | 794,902,544 | 824,979,602 | 817,028,193 | 2,075,383,096 | 1,028,857,684 | 915,502,440 | 2,019,743,879 |
| Ready Forces | 10,453,990,709 | 10,453,990,709 | 10,775,809,423 | 10,709,780,573 | 10,920,133,852 | 11,719,160,120 | 9,984,959,562 | 10,796,359,609 |
| Defence Team | 3,738,769,207 | 3,738,769,207 | 3,814,885,600 | 3,785,129,629 | 3,902,071,414 | 4,057,640,230 | 3,648,870,768 | 3,914,692,450 |
| Future Force Design | 820,654,966 | 820,654,966 | 887,051,786 | $857,336,604 | 888,627,391 | 836,173,606 | 749,733,042 | 835,360,142 |
| Procurement of Capabilities | 4,792,013,007 | 4,792,013,007 | 4,750,783,217 | 4,177,769,659 | 4,877,192,200 | 4,119,915,713 | 3,747,686,232 | 3,860,260,422 |
| Sustainable Bases, Information Technology Systems and Infrastructure | 4,129,651,499 | 4,129,651,499 | 4,530,903,413 | 4,459,375,205 | 4,288,012,574 | 4,185,750,629 | 3,945,280,646 | 4,097,255,100 |
| Subtotal | 24,729,981,932 | 24,729,981,932 | 25,584,413,041 | 24,806,419,863 | 26,951,420,527 | 25,947,497,982 | 22,992,032,690 | 25,523,671,602 |
| Internal Services | 1,220,365,624 | 1,220,365,624 | 904,711,202 | 926,089,323 | 1,549,612,451 | 879,539,855 | 1,134,112,271 | 1,406,488,493 |
| Total | 25,950,347,556 | 25,950,347,556 | 26,489,124,243 | 25,732,509,186 | 28,501,032,978 | 26,827,037,837 | 24,126,144,961 | 26,930,160,095 |
Source: Vice-Chief of the Defence Staff Group / Assistant Deputy Minister (Finance) / Chief Financial Officer Group
Notes:
- Due to rounding, figures may not add up to totals shown.
- Where the actual spending amount is higher than the total authorities, this does not represent an over-expenditure of Parliamentary authorities. Parliamentary authorities are allocated by vote and not by core responsibility and program.
- Significant variances in financial resources are detailed at the core responsibility and program level in the “Supporting information on the Program Inventory” section of the document. Explanations are provided when the variance is at least 100M or when the difference between the actual and the planned amount is 100 percent.
Budgetary actual gross spending summary (dollars)
The following table reconciles gross planned spending with net spending for FY 2022–23.
| Core responsibilities and Internal Services | 2022–23 Actual gross spending | 2022–23 Actual revenues netted against expenditures | 2022–23 Actual net spending (authorities used) |
|---|---|---|---|
| Operations | 2,019,914,416 | 170,537 | 2,019,743,879 |
| Ready Forces | 10,898,327,028 | 101,967,419 | 10,796,359,609 |
| Defence Team | 3,976,317,120 | 61,624,670 | 3,914,692,450 |
| Future Force Design | 835,597,450 | 237,308 | 835,360,142 |
| Procurement of Capabilities | 3,860,260,422 | 0 | 3,860,260,422 |
| Sustainable Bases, Information Technology Systems and Infrastructure | 4,270,389,112 | 173,134,012 | 4,097,255,100 |
| Subtotal | 25,860,805,548 | 337,133,946 | 25,523,671,602 |
| Internal Services | 1,420,203,682 | 13,715,189 | 1,406,488,493 |
| Total | 27,281,009,230 | 350,849,135 | 26,930,160,095 |
Source: Vice-Chief of the Defence Staff Group / Assistant Deputy Minister (Finance) / Chief Financial Officer Group
Notes:
- Due to rounding, figures may not add up to totals shown.
- Where the actual spending amount is higher than the total authorities, this does not represent an over-expenditure of Parliamentary authorities. Parliamentary authorities are allocated by vote and not by core responsibility and program.
- Significant variances in financial resources are detailed at the core responsibility and program level in the “Supporting information on the Program Inventory” section of the document. Explanations are provided when the variance is at least 100M or when the difference between the actual and the planned amount is 100 percent.
Departmental Spending for 2022-23 by Core Responsibility (dollars)

Long description
This pie chart illustrates the Department of National Defence’s spending for Fiscal Year 2022-23, broken down by Core Responsibility.
The percentages allocated to each section, from largest to smallest, are:
- 40%, $10,796,359,609 for Ready Forces;
- 15%, $4,097,255,100 for Sustainable Bases, Information Technology Systems and Infrastructure;
- 15%, $3,914,692,450 for Defence Team;
- 14%, $3,860,260,422 for Procurement of Capabilities;
- 8%, $2,019,743,879 for Operations;
- 5%, $1,406,488,493 for internal Services; and
- 3%, $835,360,142 for Future Force Design.
Human Resources
The “Human resources summary for core responsibilities and internal services” table presents the full-time equivalents (FTEs) allocated to each of the Department of National Defence and Canadian Armed Forces’ core responsibilities and to internal services.
Human resources summary for core responsibilities and internal services
| Core responsibilities and Internal Services | 2020–21 Actual full-time equivalents | 2021–22 Actual full-time equivalents | 2022–23 Planned full-time equivalents | 2022–23 Actual full-time equivalents | 2023–24 Planned full-time equivalents | 2024–25 Planned full-time equivalents |
|---|---|---|---|---|---|---|
| Operations | 2,156 | 2,103 | 2,151 | 2,686 | 2,201 | 2,252 |
| Ready Forces | 45,431 | 45,281 | 46,143 | 43,777 | 43,946 | 44,899 |
| Defence Team | 18,902 | 19,256 | 19,467 | 18,728 | 20,716 | 21,129 |
| Future Force Design | 1,883 | 1,983 | 1,944 | 2,064 | 1,890 | 1,894 |
| Procurement of Capabilities | 2,525 | 2,457 | 2,122 | 2,339 | 2,523 | 2,541 |
| Sustainable Bases, Information Technology Systems and Infrastructure | 15,944 | 15,642 | 15,589 | 15,614 | 15,068 | 15,230 |
| Subtotal | 86,841 | 86,722 | 87,416 | 85,208 | 86,344 | 87,945 |
| Internal Services | 4,342 | 4,372 | 4,468 | 4,656 | 4,392 | 4,423 |
| Total | 91,183 | 91,094 | 91,884 | 89,864 | 90,736 | 92,368 |
NOTE: Planned Spending for FY 2023-24 and 2024-25 remain the planned figures as reported in the Departmental Plan 2022-23, and do not reflect any updated reduced expenditures or FTE figures.
Human Resources – Reserve Force Personnel
The Reserve Force is a valued and integrated component of the CAF. It is divided into four distinct sub-components:
- Primary Reserve;
- Cadet Organization Administration and Training Service;
- Canadian Rangers; and
- Supplementary Reserve (Strategic Reserve).
The Primary Reserve (P Res) consists predominately of part-time professional CAF members, located throughout Canada, ready with reasonable notice to conduct or contribute to domestic and international operations to safeguard the defence and security of Canada. The COVID-19 pandemic had negatively impacted the P Res ability to recruit and train personnel. As a result, the P Res Average Paid Strength (APS) declined from 22 799 to 22 217 in FY 2022-23. Through significant recruiting and retention efforts, the P Res will return to its growth trajectory to achieve the authorized APS level of 30 000 announced in Strong, Secure, Engaged (SSE): Canada's Defence Policy .
The Cadet Organizations Administration and Training Service (COATS) sub-component consists predominantly of part-time CAF members, located throughout Canada, primarily assigned to duties relating to the supervision, administration, and training of cadets who are members of the Royal Canadian Sea Cadets, Royal Canadian Army Cadets, and Royal Canadian Air Cadets. It is currently comprised of 6 473 CAF members in one of three military occupations; Cadet Instructors Cadre officers, General Service Officers and General Service Non-Commissioned Members (NCMs). The current target strength of 8 000 COATS personnel is required to support the CAF’s responsibility for the department’s Youth Program (Cadets and Junior Canadian Rangers).
In FY 2022-23, the Canadian Army (CA) continued to work toward meeting the requirements of SSE to enhance the effectiveness of the Canadian Rangers (CR). In June 2022, the CA stood up a team under the Director Canadian Rangers to formulate a comprehensive CR enhancement design, including a revised force employment concept. This will result in anew CR direction in 2024 that will enhance and expand the CR to improve their functional capabilities as part of the Canadian Army Modernization Strategy (CAMS), ensure better alignment within the CAF, allies, and relevant OGDs and Agencies. As of 31 March 2023, there were 5 131 Canadian Rangers. During FY 2022-23, the CA started clearing the backlog of releases and have ramped up recruiting efforts to grow the Canadian Rangers.
Canadian Ranger Patrol
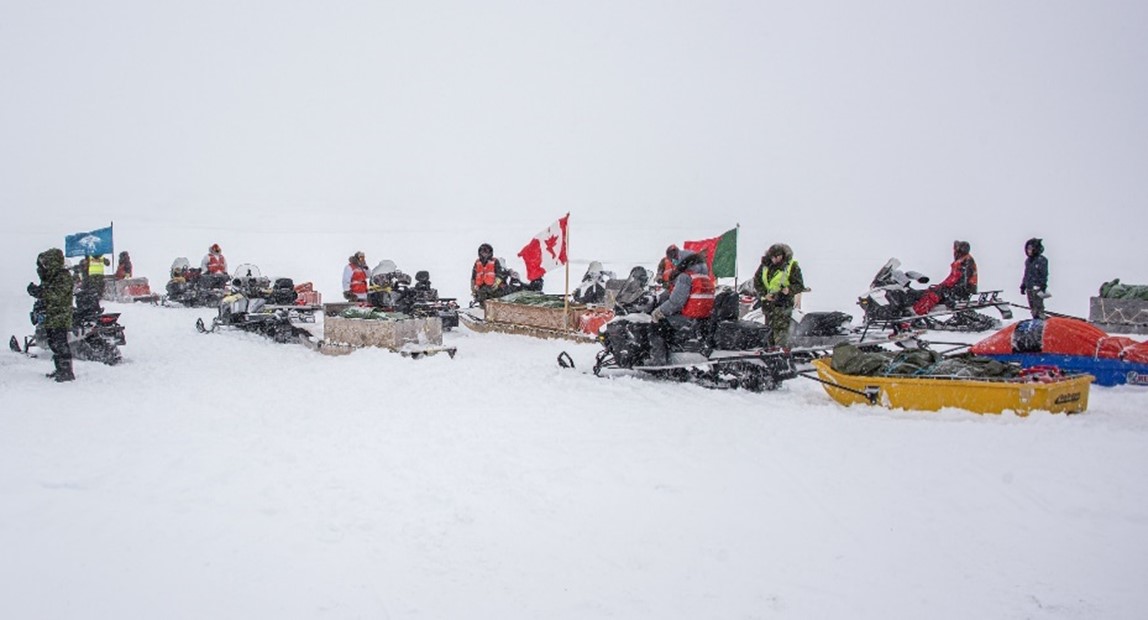
The Canadian Ranger Patrol – Inukjuak from 2nd Canadian Ranger Patrol Group participates in an annual training event designed to refine valuable skills in Inukjuak, an Inuit community, located on the north bank of the Hudson Bay in Nunavik, Northern Quebec, on 7 February 2023.
Photo: MCpl Matthew Tower, Canadian Forces Combat Camera, CAF photo.
The following table summarizes the Department of National Defence and the Canadian Armed Forces total planned and actual human resources for Reserve Force Personnel for FY 2022-23.
| Planned 2022–23 | Actual 2022–23 | Difference (actual minus planned) | |
|---|---|---|---|
| Primary Reserve | 29 550 | 22 217 | (7 333) |
| Cadet Organization Administration and Training Service | 7 250 | 6 173 | (1 077) |
| Canadian Rangers | 5 680 | 5 131 | (549) |
Note:
Prior the pandemic, important initiatives to reduce attrition and to streamline recruitment had resulted in substantial growth of the Primary Reserve (P Res). From FY 2017-18 to FY 2019-20, the P Res Average Paid Strength (APS) increased from 21,898 to 24,442 (+2,569). Under those conditions, the P Res was set to achieve the 30 000 APS in accordance with the target date outlined in the Program Inventory. Since the pandemic, the P Res APS decreased from 24 442 to 22 217 (-2 225), thus lowering the result in percentage as well.
Expenditures by vote
For information on the Department of National Defence and the Canadian Armed Forces’ organizational voted and statutory expenditures, consult the Public Accounts of Canada.
Government of Canada spending and activities
Information on the alignment of the Department of National Defence and the Canadian Armed Forces’ spending with the Government of Canada’s spending and activities is available in the GC InfoBase .
Financial statements and financial statements highlights
Financial statements
The Department of National Defence and the Canadian Armed Forces’ financial statements (unaudited) for the year ended 31 March 2023 are available on the departmental website.
Financial statements highlights
Condensed Statement of Operations (unaudited) for the year ended 31 March 2023 (dollars)
| Financial information | 2022–23 Planned results | 2022–23 Actual results | 2021–22 Actual results | Difference (2022–23 actual results minus 2022–23 Planned results) | Difference (2022–23 actual results minus 2021–22 Actual results) |
|---|---|---|---|---|---|
| Total expenses | 25,390,996,652 | 24,961,956,132 | 22,920,051,213 | (429,040,520) | 2,041,904,919 |
| Total revenues | 407,990,111 | 386,994,574 | 368,511,870 | (20,995,537) | 18,482,704 |
| Net cost of operations before government funding and transfers | 24,983,006,541 | 24,574,961,558 | 22,551,539,343 | (408,044,983) | 2,023,422,215 |
The 2022–23 planned results information is provided in DND and CAF Future-Oriented Statement of Operations and Notes 2022–23.
Condensed Statement of Financial Position (unaudited) as of 31 March 2023 (dollars)
| Financial information | 2022–23 | 2021–22 | Difference (2022–23 minus 2021–22) |
|---|---|---|---|
| Total net liabilities | 10,198,219,615 | 9,469,397,689 | 728,821,927 |
| Total net financial assets | 4,731,359,839 | 3,183,470,542 | 1,547,889,297 |
| Departmental net debt | 5,466,859,776 | 6,285,927,147 | (819,067,370) |
| Total non-financial assets | 48,343,469,088 | 46,146,406,378 | 2,197,062,710 |
| Departmental net financial position | 42,876,609,312 | 39,860,479,232 | 3,016,130,080 |
The FY 2022–23 planned results information is provided in the DND and CAF Future-Oriented Statement of Operations and Notes 2022–23.