
2023-24 Departmental Results Report
About this publication
Publication author : Canada Economic Development for Quebec Regions
Catalogue: Iu90-1/16E-PDF
ISSN: 2561-0015
Publish date: October 17, 2024
Summary: This report deals with Canada Economic Development's principal achievements in regards to its engagements towards the Parliament.
Table of Contents
From the Minister
I am pleased to present the Canada Economic Development for Quebec Regions (CED) 2023-24 Departmental Results Report. The report describes CED’s achievements and the measures it has put in place over the past fiscal year.
CED invested a total of 507.2M$ in 1,171 forward-looking projects to support Quebec’s small and medium-sized enterprises (SMEs) and the regions of Quebec in their transition to a more resilient, sustainable and inclusive economy.
Over the past year, our interventions focused primarily on the post‑pandemic recovery. We completed the implementation of the five pan-Canadian economic recovery initiatives and delivered funding programs, services, knowledge and expertise tailored to the different realities of Quebec’s regions.
Working with local players, CED gave special attention to the regions facing the greatest barriers to development, as well as those dealing with persistent socio-economic challenges, including regional county municipalities (RCM) with low economic growth potential. Specifically, CED committed to investing in projects that will promote the revitalization, attractiveness and sustainable reindustrialization of Montréal’s East End.
At the same time, CED began developing its new approach to the social economy, which will set the Agency apart as a key federal partner in this area. A stakeholder consultation process was launched to gain a better understanding of local needs.
CED also maintained its commitment to foster sustainable and inclusive growth by contributing to the environmental transition of Quebec businesses. It helped businesses fund their green transition and acquire the necessary expertise to make it happen, and supported projects led by Indigenous businesses or members of under‑represented groups. This will have a positive impact on economic development in all communities and regions of Quebec.
Again with the purpose of fostering the long-term growth of the regions of Quebec, CED launched the new Tourism Growth Program, which aims to boost the potential of regional tourism destinations—and those in rural and remote regions in particular—to attract visitors from outside Quebec.
As of October 1, 2023, CED has been directly providing aspiring entrepreneurs and small businesses with referrals and business and strategic market information research services to support their growth. This business information service is part of CED’s integrated approach to providing information, guidance and support pertaining to economic development, and makes CED the preferred gateway for Quebec businesses seeking support from the federal government.
In short, through its presence in the regions of Quebec and its support for SMEs and communities, CED has contributed to the Government of Canada’s efforts to build a sustainable and inclusive economy.
Read on to find out more!

The Honourable Soraya Martinez Ferrada
Minister of Tourism and Minister responsible for the
Economic Development Agency of Canada for the
Regions of Quebec
Results: what we achieved
Core responsibility: Economic Development in Quebec
Core responsibility and internal services
In this section
- Description
- Progress on results
- Key risks
- Resources required to achieve results
- Related government-wide priorities
- Program Inventory
Description
Support economic growth, prosperity and job creation in Quebec by means of clean and inclusive growth; help SMEs grow through trade and innovation; and build on competitive regional strengths.
Progress on results
This section presents details on how the department performed to achieve results and meet targets for the core responsibility to Economic Development in Quebec. Details are presented by departmental result.
In measuring progress toward fulfilling its core responsibility, CED seeks to contribute to, and influence, the three departmental results below. Achieving these results depends on a number of factors, and CED’s interventions contribute to their achievement commensurate with the organization’s budgets.The Departmental Results Framework, a requirement of the Policy on Results, is now reviewed on a 3-year basis.
Table 1: Targets and results for the core responsibility to Economic Development in Quebec
Table 1 provides a summary of the targets and actual results for each indicator associated with the results under the core responsibility to Economic Development in Quebec.
Departmental result 1: Quebec businesses are innovative and growing
| Departmental result indicator | Target | Date to achieve target | Actual results |
|---|---|---|---|
| Number of high-growth businesses in Quebec (by revenue) | 2,900 | March 31, 2024 | 2021-22: 2,840* (2020) 2022-23: 4,020* (2021) 2023-24: Not updated** |
| Value of Quebec’s goods’ exports | $97.2B | March 31, 2024 | 2021-22: $97.2B (2021) 2022-23: $107.5B (2022) 2023-24: $111.9B (2023) |
| Value of Quebec’s cleantech exports | $2.4B | March 31, 2024 | 2021-22: $2.7B* (2020) 2022-23: $2.6B* (2021) 2023-24: $2.3B* (2022) |
| Revenue growth rate of businesses supported by CED programs | 2.0% | March 31, 2024 | 2021-22: 4.4%* (2018) 2022-23: 11.8% (2022) 2023-24: Not updated** |
* The data in the table corresponds to the most recent results published by Statistics Canada. The figures for previous years are those available and can be updated in current or future fiscal years.
** “Not updated” means that the data has not been updated since the last results presented in the table.
Departmental result 2: Communities are economically diversified in Quebec
| Departmental result indicator | Target | Date to achieve target | Actual results |
|---|---|---|---|
| Percentage of SMEs in Quebec that are majority-owned by women, Indigenous Peoples, youth, visible minorities or persons with disabilities |
Women: 16.0% Indigenous Peoples: 1.1% Youth: 14.4% Visible minorities: 4.3% Persons with disabilities: 0.4% |
March 31, 2024 |
Women: Indigenous Peoples: Youth: Visible minorities: Persons with disabilities: |
| Percentage of professional jobs in science and technology in the Quebec economy | 38.0% | March 31, 2024 |
2021-22: 37.1% (2021) |
| Amount leveraged per dollar invested by CED in community projects | $2.20 | March 31, 2024 |
2021-22: $2.23 (2022) |
* The data in the table corresponds to the most recent results published by Statistics Canada. The figures for previous years are those available and can be updated in current or future fiscal years.
** “Not updated” means that the data has not been updated since the last results presented in the table.
Departmental result 3: Businesses invest in the development and commercialization of innovative technologies in Quebec
| Departmental result indicator | Target | Date to achieve target | Actual results |
|---|---|---|---|
| Amount of R&D spending by businesses receiving CED program funding | $25M | March 31, 2024 |
2021-22: NA* |
| Percentage of businesses that collaborate with Quebec institutions of higher learning | 22% | March 31, 2024 |
2021-22: 23.1%** (2017–19) |
* NA indicates that data was not available based on the desired methodology, which CED had recently reviewed in order to make improvements. This data will be available starting with the next Departmental Results Report.
** The data in the table corresponds to the most recent results published by Statistics Canada. The figures for previous years are those available and can be updated in current or future fiscal years.
*** “Not updated” means that the data has not been updated since the last results presented in the table.
More detailed results and performance information relating to CED’s Program Inventory can be found on GC InfoBase.
Details on results
The following section describes the results for the 2023-24 core responsibility to Economic Development in Quebec, compared with the expected results set out in CED’s 2023-24 Departmental Plan.
Departmental result 1: Quebec businesses are innovative and growing
- Through the Regional Economic Growth through Innovation (REGI) program and related temporary initiatives, CED contributed to the growth and innovative capacity of Quebec businesses by helping them become more productive and competitive and reach new markets. In concrete terms, this translates into $289.1M in funding for 623 projects carried out by SMEs or non-profit organizations (NPO) that support SMEs.
- CED continued to fund the green transition of SMEs and regional economies, with a particular focus on strategic investments in clean technologies, organizations that incorporate eco-responsible practices into their operations, and regional ecosystems that support SMEs taking action. Through the REGI and its associated temporary initiatives, CED provided $121.4M in funding for 227 projects that support the environmental transition.
- The Jobs and Growth Fund (JGF) provided funding for 85 projects, for a total of $52.4M granted under the REGI program to improve business competitiveness, create jobs and help SMEs transition to a green and inclusive economy.
- Quebec’s business incubators and accelerators are drivers of innovation and regional economic development, which is why CED supported 22 projects, for a total investment of almost $8.6M, to help them reach their full potential.
- CED worked hard to promote Quebec’s capabilities among prime contractors with a view to increasing the opportunities generated by the Industrial and Technological Benefits (ITR) Policy in Quebec. At defence and security industry events held in Canada and abroad, CED coordinated networking meetings attended by SMEs and prime contractors in order to maximize the economic benefits in Quebec. For example, at CANSEC, Canada’s largest defence trade show, CED organized a networking evening attended by over 200 people.
Example of a Project
Where:Port-Cartier – Served by the Côte-Nord BO
Who:9474-9785 Québec inc. (Carbonity inc.) is a startup that plans to implement a unique, innovative technology to add value to forest biomass used in biochar production.
What:The $3M repayable contribution will serve to acquire and set up production equipment at the new plant. Natural Resources Canada is also a partner in the project.
Departmental result 2: Communities are economically diversified in Quebec
- Through the Quebec Economic Development Program (QEDP) and associated temporary initiatives, CED supported 479 projects, for a total of $183.8M in funding, to help communities pursue promising economic development and diversification opportunities going forward.
- In 2023-24, through the Canada Community Revitalization Fund (CCRF), CED provided a total of $45.7M in funding for 196 projects from communities all across Quebec involving the construction or upgrading of community facilities, to help these communities rebound from the effects of the COVID-19 pandemic.
- CED continued to support the tourism sector, notably through the Tourism Relief Fund (TRF) ($12M for 77 projects); the Major Festivals and Events Support Initiative (MFESI) ($35M for 8 projects); and the new Tourism Growth Program (TGP) launched in 2024.
- CED also provided $13.4M under the initiative for the development of regional economic infrastructure in Quebec (IDI) for six tourism infrastructure projects that contribute to the economic vitality and attractiveness of Quebec communities, and one project under the transportation stream.
- Through the Hurricane Fiona Recovery Fund (HFRF), designed to help SMEs and communities in eastern Quebec get back on their feet, and to support their economic recovery efforts, CED provided approximately $5.6M in funding for 23 projects over the course of the past fiscal year.
- CED maintained its commitment to foster the environmental transition of Quebec businesses, specifically by helping them fund their green transition and acquire the necessary expertise to make it happen. Through the QEDP stream, CED supported 16 projects that contribute to sustainable development, for a total investment of $16M.
- By providing financial assistance under the Jobs and Growth Fund (JGF), CED was able to help bolster the competitiveness of businesses and organizations, create jobs, and support businesses in their transition to a green and inclusive economy. A total of $8.8M in funding was awarded for 5 projects under the QEDP stream.
- Under the Lac-Mégantic Economic Recovery Initiative (LMERI), CED provided $3.6M in funding for 8 projects that supported the economic and commercial recovery of the town of Lac-Mégantic following the railway accident on July 6, 2013. In total, CED awarded $35.4M in funding under this initiative, which ended on March 31, 2024, for 44 projects targeting the economic recovery of the town of Lac-Mégantic.
- CED pursued the following initiatives aimed at promoting an inclusive economy in all regions of Quebec:
- Economic Development Initiative – Official Languages (EDI-OL): $1.4M for 9 NPO projects
- Black Entrepreneurship Program (BEP) – National Ecosystem Fund: $7.3M for 10 projects
- TRF – Indigenous communities: $3.2M in 11 Indigenous projects
- Strategic Partnerships Initiative – Energy Transition for Indigenous Businesses: 18 projects administered jointly with Indigenous Services Canada for a total of $3M.
- The annual investment of $33.4M through the Community Futures Program (CFP) allowed the Community Futures Development Corporations (CFDCs) and Business Development Centres (BDCs) to support local projects and pursue their mission of supporting the economic development of rural regions.
- CED pursued the implementation of the Inuit Nunangat Policy, in place since April 2022, to ensure that the Agency’s interventions are based on an understanding of the specific needs and circumstances of the Inuit, and that this understanding is reflected in its services, programs and initiatives. CED has been building on the long-standing relationship developed over the years between the CED business office responsible for Nunavik and various partners. CED representatives also held meetings in Kuujjuaq with the main economic development actors to learn more about how the Agency can further support economic development in Nunavik.
Example of a Project
Where: Maria – Served by the Gaspésie–Îles-de-la-Madeleine BO
Who: Accès MicroCrédit Gaspésie–Îles-de-la-Madeleine (AMCGÎM) is a non-profit organization that provides technical support, local assistance and financing for entrepreneurs with limited access to conventional resources to allow them to carry out their business projects and participate in the economic development of their communities.
What: The aim of the $252,152 non-repayable contribution is to provide an assistance and technical support service for English-speaking entrepreneurs in the Gaspésie–Îles-de-la-Madeleine region, with a specific focus on youth, women and First Nations.
Departmental result 3: Businesses invest in the development and commercialization of innovative technologies in Quebec
- In 2023-24, CED provided $11.3M in funding for 90 projects targeting the commercialization of innovative products and services, specifically to help businesses improve their capacity to identify market opportunities, access potential clients, manage business relationships, penetrate national and international markets, integrate global value chains, and access public markets and Industrial and Technological Benefits (ITB).
- CED also provided $52M for 117 different projects by 100 NPOs that assist businesses with their business projects, involving technology development, adoption, adaptation and commercialization, from a growth perspective.
- By providing $59.6M in funding for 26 projects through the Aerospace Regional Recovery Initiative (ARRI), CED has helped SMEs in the Quebec aerospace industry emerge from the pandemic by building their competitiveness on the world stage and making their operations more environmentally friendly, notably through the adoption of environmentally sustainable practices.
- As part of the National Quantum Strategy (NQS), CED provided $6.2M in funding for a dozen or so projects under the regional quantum innovation (RQI) initiative, a component of the Commercialization stream of the NQS, to help Quebec businesses expand and to commercialize quantum technologies through the main regional hubs of quantum expertise.
- Through the research component of the Infrastructure Development Initiative, CED provided a total of $8.7M in funding for 3 projects.
- As of October 1, 2023, Quebec’s small businesses and aspiring entrepreneurs have had access to CED’s one-stop Business Information Services, where they can obtain guidance, assistance and referrals to appropriate resources—including CED’s programs—to support their development projects, in co-operation with ecosystem players. After a smooth transition, having been previously provided by two different organizations, this service is now provided directly by CED and boasts high quality standards (96% satisfaction rate). Since the introduction of the service, there have been over 3,000 interventions with entrepreneurs who have been able to easily access information on various programs and resources, as well as strategic business and market information to support their growth.
Example of a Project
Where? Montréal (Montréal’s East End) – Served by the Greater Montréal BO
Who? Centre C3i is an organization that supports life sciences businesses that develop and commercialize cell and gene therapies.
What? The $2.5M non-repayable contribution covers equipment acquisition and professional fees to increase the organization’s capacity to transfer technology to businesses that specialize in cell therapy and cancer immunotherapy.
CED also continued to track its $3B investment portfolio by continuing to engage with entrepreneurs regarding projects approved in previous years, i.e., ensuring their completion and managing the collection of repayable contributions.
Key risks
Risk 1: Information Technology (IT) security
Cybercriminals are using increasingly sophisticated means to infiltrate technological infrastructure and gain access to sensitive information. Government organizations, in particular, are prime targets.
With a view to mitigating these risks, CED pursued active cybersecurity measures. The organization also implemented a cybersecurity awareness and training strategy to equip and prepare staff to adopt the right reflexes when dealing with situations involving cybersecurity issues.
Risk 2: Workforce health, wellness and management
Over the past few years, staff have had to deal with various factors that affect workload and the ways things are done at the Agency. The substantial number of recovery initiatives in place since 2021‑22 has put pressure on CED staff, a situation that has been exacerbated by labour shortages in several job categories within the organization. At the same time, the transition to a hybrid work model required adaptation on the part of both labour and management. This context of profound change in recent years prompted the organization to identify a risk relating to workforce health and wellness.
In response to these issues, and in keeping with its commitment to foster a diverse, inclusive, barrier‑free and accessible workplace, CED has taken steps to address workload challenges and promote employee wellness. To maximize opportunities for employees to participate in the advancement of CED’s mission, and to foster dialogue, CED created an internal discussion forum where all staff get together on a regular basis, and implemented an EDI strategy and committee to ensure the application of the guidelines associated with the Call to Action on Anti-Racism, Equity, and Inclusion in the Federal Public Service. Champions have also been appointed to promote wellness and mental health, and values and ethics, within the organization. CED shared its commitment to values and ethics, in line with the Clerk of the Privy Council’s priorities, by informing and educating staff about this issue. Finally, CED has developed a new integrated human resources plan for the next three years, and has adopted recruitment best practices to address labour shortages, in order to pursue its ongoing efforts to attract and retain a skilled and diverse workforce.
Risk 3: Program delivery
The economic slowdown is likely to negatively impact Quebec businesses, notably because of a decline in orders and the reorganization of supply chains. Labour shortages and high inflation are putting further pressure on business’s resources. This situation fuels the risk that businesses, now more indebted, will cancel or delay their investment projects required for the modernization of their operations. There is also a risk that CED’s programs will not be sufficiently tailored to the changing needs of SMEs, and this could have negative repercussions on CED’s capacity to provide strategic and ongoing support for SMEs’ business projects.
To help Quebec businesses deal with the upheaval of this new economic context, CED tailored the implementation of its regular programs to meet emerging needs based on regional realities, and in so doing has contributed to the vitality of Quebec communities. Through its 12 regional business offices and its integrated approach to information, assistance and investment monitoring, CED supports businesses (including NPOs Indigenous organizations and social economy enterprises) in the development and diversification of the economies of Quebec’s regions.
Resources required to achieve results
Table 2: Snapshot of resources required for the core responsibility to Economic Development in Quebec
Table 2 provides a summary of the planned and actual spending and full-time equivalents (FTEs) required to achieve results.
| Resource | Planned | Actual |
|---|---|---|
| Spending | 461,433,534 | 536,169,207 |
| Full-time equivalents | 205 | 215 |
Complete financial and human resources information pertaining to CED’s Program Inventory can be found on GC InfoBase.
Related government-wide priorities
Gender-based analysis plus (GBA+)
CED pursued the implementation of its gender-based analysis plus (GBA+) policy and organizational governance framework to increase the consideration of gender and diversity in policy development, program design, internal practices and client services. To this end, in 2023-24, CED continued to incorporate GBA+ into the design and implementation of two new initiatives. As concerns the first of these, namely the Initiative to Support Economic Development in Montréal’s East End (ISEDMEE), GBA+ allowed for the development of delivery parameters that help increase the inclusion and participation of various under-represented groups in the economy of Montréal’s East End. In the case of the second initiative, the Tourism Growth Program (TGP), launched in February 2024, new GBA+ performance measurement indicators were developed for results tracking and reporting on support for Indigenous communities/recipients, and rural or remote regions.
Furthermore, with a view to improving its ability to report on the impact of its programs and initiatives on under-represented groups, in line with GBA+, CED worked with the intermediary groups it supports to improve the reliability of the data they collect on their clients. CED reviewed its annual data collection tools used by the intermediary groups it supports to ensure that these tools adequately capture its interventions targeting the new categories of under-represented groups introduced in 2021.
CED also pursued the implementation of its equity, diversity and inclusion (EDI) approach, which applies to all its clients and programs and stems from the findings of CED’s GBA+ analyses:
- EDI appendix to the funding application, to educate CED clients about the importance of EDI and to provide an estimate of its integration: Of the 468 SME and NPO project proponents that completed the form, 331 (71%) indicated that their organizational practices would include an EDI component, or that they planned to start taking steps in this regard.
- Client resources: Pages on the CED website that promote EDI as a lever for growth, as well as awareness tools about the benefits of an EDI approach, are among the most visited pages on the CED website.
GBA+: Highlights of our investments in 2023-24
CED reports on its funding for under-represented groups, primarily based on the data collected in the voluntary self-identification form, in which clients applying for funding are asked to indicate whether they belong to one or more of the target groups. However, although indicative, this data is incomplete. Completing the self-identification form is voluntary, which means that there may be gaps in the data if the self-identification is incomplete, inaccurate or insufficient.
Funding for SMEs: $40.4M in funding for 144 projects by SMEs whose majority owners belong to under-represented groups, representing 21% and 28% of the total SME funding and the total number of SME projects, respectively.
Funding for NPOs: $89M in funding for 233 projects by NPOs led or predominately led by members of under-represented groups, representing 28% and 36% of the total NPO funding and the total number of NPO projects, respectively.
The following is a breakdown of 2023-24 funding for the nine categories of under‑represented groups identified by CED. Definitions can be found on the CED website. The amounts below should not be added up, since clients may self-identify as belonging to more than one group.
- 2SLGBTQI+: 9 SME projects ($1.4M) and 20 NPO projects ($5.4M)
- Indigenous Peoples: 18 SME projects ($9.4M) and 52 NPO projects ($13.8M)
- Women: 77 SME projects ($15.3M) and 172 NPO projects ($68.9M)
- Youth: 58 SME projects ($7.4M) and 62 NPO projects ($15.2M)
- Racialized communities: 14 SME projects ($3.9M) and 10 NPO projects ($3.3M)
- Black communities: 4 SME projects ($449,623) and 15 NPO projects ($8.7M)
- Official language minority communities (OLMCs): 7 SME projects ($4.8M) and 36 NPO projects ($7.7M)
- Newcomers to Canada and immigrants: 15 SME projects ($14.5M) and 20 NPO projects ($6M)
- People with disabilities: 1 SME project ($42,031) and 15 NPO projects ($3.5M)
For more information on CED’s intervention with respect to GBA+ and under-represented groups, please refer to the Gender-based Analysis Plus Supplementary Information Table.
United Nations’ 2030 Agenda for Sustainable Development and the Sustainable Development Goals
More information on CED’s contributions to Canada’s Federal Implementation Plan on the 2030 Agenda and the Federal Sustainable Development Strategy can be found in our Departmental Sustainable Development Strategy.
Program Inventory
The core responsibility to Economic Development in Quebec is supported by the following programs:
- Regional Innovation
- Community Vitality
- Targeted or Temporary Support
Additional information pertaining to CED’s Program Inventory, as concerns the core responsibility to Economic Development in Quebec, can be found on the Results page of GC InfoBase.
Internal services
In this section
- Description
- Progress on results
- Resources required to achieve results
- Contracts awarded to Indigenous businesses
Description
Internal services are the services that are provided within a department so that it can meet its corporate obligations and deliver its programs. There are 10 categories of internal services:
- management and oversight services
- communications services
- legal services
- human resource management services
- fiscal management services
- information management services
- information technology services
- real property management services
- materiel management services
- acquisition management services
Progress on results
This section presents details on how the department performed to achieve results and meet targets for internal services.
The 2023-24 fiscal year marked the third and final year of the Imagining 2024 initiative, an internal management framework aimed at achieving concrete organizational results based on three pillars: an engaged team in a healthy and modern environment; a recognized contribution; and responsive services. To fulfill its mission more effectively, CED focused on modernizing its processes and tools, being innovative and continuously improving the way it operates.
Over the past year, progress has been made in a number of areas in line with Imagining 2024. Achievements include:
The successful shift to the hybrid work model
CED implemented various activities to foster staff buy-in for the hybrid work model and to optimize its benefits. Specifically, the Agency initiated an organizational dialogue on improving professional practices and the work environment. Drawing on the lessons learned from its Future of Work pilot project, CED created safe, modern on-site spaces, as well as collaborative areas adapted to internal needs. The success of the shift to the hybrid work model bears witness to CED’s ongoing commitment to adjust to changing realities and meet its strategic imperatives.
A vision and a plan for the new digital era
The digital shift is fundamentally transforming the way we work and interact. The launch of the 2024-27 Digital Strategy has allowed the Agency to achieve its vision by strengthening its agility, transparency and innovative capacity with a view to shaping a modern workplace that lives up to its aspirations. Following a targeted call for proposals, CED implemented a portal for external clients that modernizes the client experience for this type of project submission process. The portal will be continuously upgraded with a view to maintaining easy, secure client access and optimizing the Agency’s management practices.
Sustained support for learning
Strengthening digital skills is a key initiative for CED. Drawing on up-to-date learning roadmaps, managers and employees were able to take advantage of targeted learning opportunities, including training specifically designed to equip them with the digital skills needed to meet the challenges of societal transformation, including the challenges associated with the emergence of telework and new technologies. The various digital dexterity tools available on the intranet meet a number of current and future staff training needs.
Resources required to achieve results
Table 3: Resources required to achieve results for internal services this year
Table 3 provides a summary of the planned and actual spending and full-time equivalents (FTEs) required to achieve results.
| Resource | Planned | Actual |
|---|---|---|
| Spending | 23,236,106 | 27,013,595 |
| Full-time equivalents | 178 | 164 |
Complete financial and human resources information pertaining to CED’s Program Inventory can be found on GC InfoBase.
Contracts awarded to Indigenous businesses
Government of Canada departments must meet a target of awarding at least 5% of the total value of contracts to Indigenous businesses each year. This commitment must be fully implemented by the end of 2024–25.
Canada Economic Development for Quebec Regions’ result for 2023-24
Table 4: Total value of contracts awarded to Indigenous businesses*
As shown in Table 4, CED awarded 9.45% of the total value of all contracts to Indigenous businesses for the fiscal year.
| Contracting performance indicators | 2023–24 results |
|---|---|
| Total value of contracts awarded to Indigenous businesses** (A) | $330,932.49 |
| Total value of contracts awarded to Indigenous and non-Indigenous businesses*** (B) | $3,500,481.72 |
| Value of exceptions approved by the deputy head (C) | $0.00 |
| Proportion of contracts awarded to Indigenous businesses [A/(B - C) × 100] | 9.45% |
* For the purposes of measuring performance against the minimum 5% target for FY 2023-24, the data in this table is based on how Indigenous Services Canada (ISC) defines “Indigenous business”, which is one that is owned and operated by Elders, band or tribal councils; registered in the Indigenous Business Directory; or registered on a modern treaty beneficiary business list.
** Includes contract amendments to contracts with Indigenous businesses and contracts that were entered into with Indigenous businesses by means of acquisition cards above $10,000 ($10K), and may include sub-contracts with Indigenous businesses.
*** Includes contract amendments and contracts that were entered into by means of acquisition cards above $10K.
In its 2023-24 Departmental Plan, CED projected that, by the end of the 2023-24 fiscal year, 5% of the total value of its contracts will have been awarded to Indigenous businesses.
This result exceeds the 5% target for 2023-24, owing to the collaboration of the various directorates and the strategies implemented by the Department, including:
- Organizing in-house awareness sessions on the obligation to use Indigenous businesses whenever possible to meet our needs in terms of goods and services, and the importance of doing so.
- Adding a section related to the Procurement Strategy for Indigenous Businesses (PSIB) to our strategic procurement plan, including the following measures to ensure the objective is achieved:
- Systematically identifying, early in the process, the capacity of the Indigenous market to meet the need
- Consulting the Indigenous Business Directory to identify qualified suppliers in various industries
- Using mandatory standing offers / supply arrangements (SO/SA) for the acquisition of goods
- Using set-aside methods (mandatory, voluntary and conditional set-asides)
- Targeting and inviting Indigenous businesses to take part in open solicitations or invitations to tender
- Developing a training curriculum specifically designed for business owners that includes the Canada School of Public Service course “Indigenous Considerations in Procurement (COR409)” for a better understanding of the strategy.
Spending and human resources
In this section
Spending
This section presents an overview of the Department’s planned and actual spending from 2021-22 to 2026–27.
Budgetary performance summary
Table 5: Actual three-year spending on the core responsibility and internal services (dollars)
Table 5 shows how much CED spent over the past three years in its operating budget and its grant and contribution budget to carry out its core responsibility and ensure the delivery of its internal services.
| Core responsibility and internal services | 2023–24 Main Estimates | 2023–24 total authorities available for use | Actual spending over three years (authorities used) |
|---|---|---|---|
| Economic Development in Quebec | 461,433,534 | 565,633,453 |
|
| Internal services | 23,236,106 | 26,469,531 |
|
| Total | 484,669,640 | 592,102,984 |
|
Analysis of the past three years of spending
CED’s budget consists of recurrent funding for the delivery of regular programs and one-time funding for targeted temporary initiatives. The recurring budget remains stable over the years, while temporary budgets vary based on the additional programs and initiatives that CED needs to put in place to address the economic situation and events that significantly impact businesses or communities.
CED delivered a considerable number of grant and contribution programs and initiatives in 2023-24 associated with its core responsibility to Economic Development in Quebec. Fiscal years 2022-23 and 2023-24 were marked by the implementation of temporary and targeted economic recovery initiatives. The variation of $74.7M (16.2%) between planned and actual spending in 2023-24 is primarily attributable to the carryover of unused funds from 2022-23 for certain temporary and targeted initiatives, to keep up with the rate at which proponents were completing their projects:
- Canada Community Revitalization Fund (CCRF)
- Major Festivals and Events Support Initiative (MFESI)
- Aerospace Regional Recovery Initiative (ARRI)
- Quebec Infrastructure Development Initiative (IDI)
Other initiatives were also approved during the year, increasing initial spending plans:
- Hurricane Fiona Recovery Fund (HFRF)
- Tourism Growth Program (TGP)
Spending on internal services for fiscal years 2021-22 and 2022-23 has remained stable. However, a number of collective agreements were renewed in 2023-24, resulting in a payroll increase.
Overall, actual spending remained stable in 2022-23 and 2023-24; this can be explained by the pursuit and end of economic recovery initiatives that generated the bulk of spending in these years.
More detailed financial information from previous years is available in the Finances section on the department’s GC InfoBase page.
Table 6: Planned three-year spending on the core responsibility and internal services (dollars)
Table 6 shows how much CED plans to spend over the next three years to carry out its core responsibility and for internal services.
| Core responsibility and internal services | 2024–25 planned spending | 2025–26 planned spending | 2026–27 planned spending |
|---|---|---|---|
| Economic Development in Quebec | 293,604,291 | 287,612,733 | 192,652,361 |
| Internal services | 22,330,430 | 22,065,502 | 20,067,652 |
| Total | 315,934,721 | 309,678,235 | 212,720,013 |
Analysis of the next three years of spending
For the next few years, CED will revert to pre-pandemic spending forecasts, since the last COVID-19 and economic recovery initiatives ended in 2023-24. Spending forecasts will remain constant over the next two years.
The reduction in planned spending for 2026-27 is largely due to the review of the mechanism for reinvesting repayable contribution reimbursements, which, up to 2023-24, made up a sizable proportion of recurring funding. A transitional measure will maintain funding for fiscal years 2024-25 and 2025-26. At the time this report was written, no measures had yet been confirmed for subsequent years.
Over the next few years, CED is forecasting expenditures for the following temporary and targeted initiatives, in addition to its regular programs:
- Black Entrepreneurship Program (BEP) [2024-25]
- Tourism Growth Program (TGP) [2025-26]
- Regional quantum innovation initiative (RQI) [2027-28]
- Hurricane Fiona Recovery Fund (HFRF) [2024-25]
More detailed financial information from previous years is available in the Finances section on the department’s GC InfoBase page.
Funding
This section provides an overview of the department’s voted and statutory funding for its core responsibility and internal services. For further information on funding authorities, please refer to the Government of Canada budgets and expenditures webpage.
Graph 1 summarizes the department’s approved voted and statutory funding from 2021-22 to 2026-27.
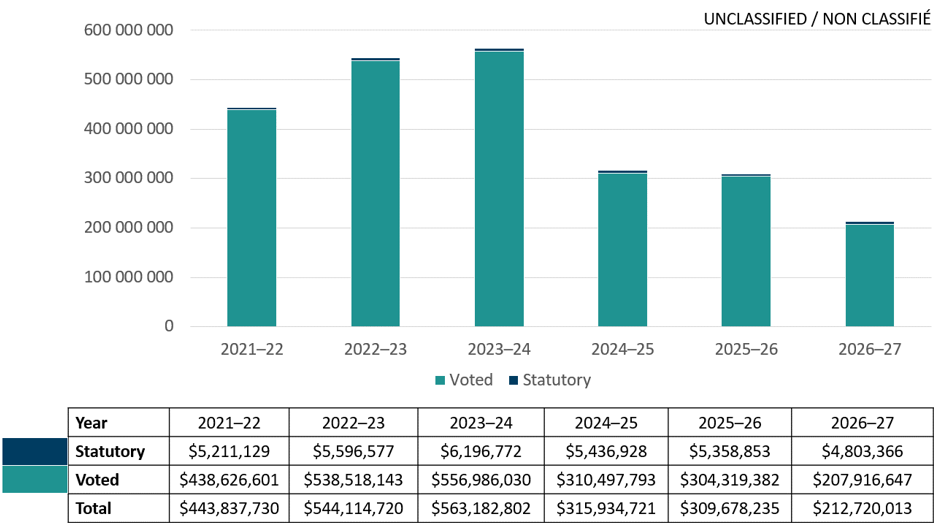
Text version: Approved funding (statutory and voted) over a six-year period
From 2021-2022 to 2026-27, spending and forecasts for statutory items:
- $5,211,129 in 2021-22
- $5,596,577 in 2022-23
- $6,196,772 in 2023-24
- $5,436,928 in 2024–25
- $5,358,853 in 2025–26
- $4,803,366 in 2026–27
From 2021-22 to 2026–27, spending and forecasts by voted appropriations:
- $438,626,601 in 2021-22
- $538,518,143 in 2022-23
- $556,986,030 in 2023-24
- $310,497,793 in 2024–25
- $304,319,382 in 2025–26
- $207,916,647 in 2026–27
From 2021-22 to 2026–27, total spending and forecasts:
- $443,837,730 in 2021-22
- $544,114,720 in 2022-23
- $563,182,802 in 2023-24
- $315,934,721 in 2024–25
- $309,678,235 in 2025–26
- $212,720,013 in 2026–27
Analysis of statutory and voted funding over a six-year period
During the pandemic years, CED played an active role in limiting the impact of COVID-19 on businesses and fostering the economic recovery through various temporary and targeted initiatives. The year 2021-2022 marked the launch of a number of economic recovery initiatives.
The increase in spending in 2022-23 can be attributed to the pursuit of economic recovery initiatives and the carryover of grant and contribution funds from unused budgets in 2021-22 to keep up with the rate at which proponents were completing their projects.
Although most of the recovery initiatives were slated to end in 2022-23, some were extended into 2023-24 to meet the needs of clients that needed more time to complete their projects. Funds were carried over from unused budgets in 2022-23 to finance these projects.
As a result, a steady increase in grant and contribution spending was reported in fiscal years 2021-22, 2022-23 and 2023-24, mainly due to the many temporary and targeted economic recovery initiatives and the additional resources allocated for their implementation.
The sharp drop in spending projected for 2024–25 and 2025–26 is attributable to the end of the economic recovery initiatives. CED is essentially going back to its pre-pandemic grant and contribution spending levels.
NB: Spending forecasts for 2026–27 may be adjusted going forward, based on future budgetary decisions.
For further information on CED’s voted and statutory expenditures, please refer to the Public Accounts of Canada.
Financial statement highlights
CED’s complete financial statements (unaudited) for the year ended March 31, 2024, are posted on the CED website.
The following highlights provide an overview of CED’s financial position and operations. The unaudited financial statements are prepared in accordance with the government’s accounting policies, which are based on Canadian generally accepted accounting principles for the public sector.
The expenditures presented in the tables in the other sections of the report were prepared using cash accounting, whereas the financial highlights below were prepared using accrual accounting. Tables reconciling these two accounting methods can be found in the notes to CED’s financial statements.
A more detailed Future-Oriented Statement of Operations and Notes, including a reconciliation of net operating costs and requested authorities, is available on the CED website.
Table 7: Condensed Statement of Operations (unaudited or audited) for the year ended March 31, 2024 (dollars)
Table 7 summarizes the expenses and revenues for 2023–24 which net to the cost of operations before government funding and transfers.
| Financial information | 2023–24 actual results | 2023–24 planned results | Difference (actual results minus planned) |
|---|---|---|---|
| Total expenses | 375,422,471 | 318,618,000 | 56,804,471 |
| Total revenues | 0 | 0 | 0 |
| Net cost of operations before government funding and transfers | 375,422,471 | 318,618,000 | 56,804,471 |
The 2023–24 planned results information is provided in CED’s Future-Oriented Statement of Operations and Notes 2023–24.
Table 8: Summary of Actual Expenses and Revenues (dollars)
Table 8 summarizes actual expenses and revenues which net to the cost of operations before government funding and transfers.
| Financial information | 2023–24 actual results | 2022–23 actual results | Difference (2023-24 minus 2022-23) |
|---|---|---|---|
| Total expenses | 375,422,471 | 402,994,064 | -27,571,593 |
| Total revenues | 0 | 0 | 0 |
| Net cost of operations before government funding and transfers | 375,422,471 | 402,994,064 | -27,571,593 |
Table 9: Condensed Statement of Financial Position (unaudited) as on March 31, 2024 (dollars)
Table 9 provides a brief snapshot of the department’s liabilities (what it owes) and assets (what the department owns), which helps to indicate its ability to carry out programs and services.
| Financial information | Actual fiscal year (2023–24) | Previous fiscal year (2022–23) | Difference (2023–24 minus 2022–23) |
|---|---|---|---|
| Total net liabilities | 66,418,840 | 37,335,846 | 29,082,994 |
| Total net financial assets | 62,115,140 | 32,905,270 | 29,208,870 |
| Departmental net debt | 4,303,689 | 4,430,576 | 126,887 |
| Total non-financial assets | 2,003,712 | 2,556,832 | (553,120) |
| Departmental net financial position | (2,299,977) | (1,873,744) | (426,233) |
Human resources
This section presents an overview of the department’s actual and planned human resources from 2021-22 to 2026–27.
Table 10: Actual human resources for the core responsibility and internal services
Table 10 shows a summary of human resources, in full-time equivalents (FTEs), for CED’s core responsibility and for its internal services for the previous three fiscal years.
| Core responsibility and internal services | 2021–22 actual FTEs | 2022–23 actual FTEs | 2023–24 actual FTEs |
|---|---|---|---|
| Economic Development in Quebec | 213 | 212 | 215 |
| Internal services | 180 | 168 | 164 |
| Total | 393 | 380 | 379 |
Analysis of human resources over the past three years
In 2021-22, CED received additional budgets to implement temporary and targeted initiatives related to the COVID-19 pandemic, and new budgets for economic recovery initiatives. In 2021-22, funding received for COVID-19 pandemic initiatives ended, whereas funding for economic recovery initiatives ended on March 31, 2024.
Table 11: Human resources planning summary for the core responsibility and internal services
Table 11 shows information on human resources, in full-time equivalents (FTEs), for CED’s core responsibility and for its internal services planned for the next three years. Human resources for the current fiscal year are forecasted based on year-to-date data.
| Core responsibility and internal services | 2024–25 planned FTEs | 2025–26 planned FTEs | 2026–27 planned FTEs |
|---|---|---|---|
| Economic Development in Quebec | 216 | 214 | 191 |
| Internal services | 167 | 165 | 147 |
| Total | 383 | 379 | 339 |
Analysis of human resources for the next three years
The slight increase in the number of FTEs in 2024-25 compared with 2023-24 stems from the fact that CED went back to providing its business information services expertise in house, which required the hiring of additional staff. As of October 1, 2023, business information services (BIS), which had previously been outsourced, have been provided directly by CED employees, the objective being to strengthen the Agency’s direct contribution to economic development for all regions of Quebec, while drawing on CED’s continuum of services and network of collaborators.
The marked reduction in the number of FTEs in 2026–27 can be attributed to the end of capacity building, i.e., a temporary approval of voted authorities to cover operating expenses associated with the monitoring of COVID-19 and economic recovery initiatives.
Corporate information
Departmental profile
Appropriate minister: The Honourable Soraya Martinez Ferrada
Institutional head: Sony Perron
Ministerial portfolio: Economic Development Agency of Canada for the Regions of Quebec
Enabling instrument: Economic Development Agency of Canada for the Regions of Quebec Act
Year of incorporation/commencement: 2005
Departmental contact information
Mailing address:
800 René Lévesque Blvd. West, Suite 500
Montréal, Quebec
H3B 1X9
Telephone: 514-283-6412
Fax: 514-283-3302
Website: http://www.ced.canada.ca
Supplementary information tables
The following supplementary information tables are available on the CED website:
- Details on transfer payment programs >
- Gender-based analysis plus
- Response to Parliamentary committees and external audits
- United Nations 2030 Agenda for Sustainable Development and the Sustainable Development Goals
Federal tax expenditure
The tax system can be used to achieve public policy objectives through the application of specific measures, such as preferential tax rates, exemptions, deductions, deferrals and tax credits. Every year, the Department of Finance Canada publishes cost estimates and projections for government-wide tax expenditures in its Report on Federal Tax Expenditures. This report also provides detailed background information on tax expenditures, including descriptions, objectives, historical information and references to related federal spending programs, as well as GBA Plus evaluations and results associated with tax expenditures.
Definitions
appropriation (crédit)
Any authority of Parliament to pay money out of the Consolidated Revenue Fund.
budgetary expenditures (dépenses budgétaires)
Operating and capital expenditures; transfer payments to other levels of government, departments or individuals; and payments to Crown corporations.
core responsibility (responsabilité essentielle)
An enduring function or role performed by a department. The intentions of the department with respect to a core responsibility are reflected in one or more related departmental results that the department seeks to contribute to or influence.
Departmental Plan (plan ministériel)
A report on the plans and expected performance of an appropriated department over a 3-year period. Departmental Plans are usually tabled in Parliament each spring.
departmental priority (priorité)
A plan or project that a department has chosen to focus and report on during the planning period. Priorities represent the things that are most important or what must be done first to support the achievement of the desired departmental results.
departmental result (résultat ministériel)
A consequence or outcome that a department seeks to achieve. A departmental result is often outside departments’ immediate control, but it should be influenced by program-level outcomes.
departmental result indicator (indicateur de résultat ministériel)
A quantitative measure of progress on a departmental result.
departmental results framework (cadre ministériel des résultats)
A framework that connects the department’s core responsibilities to its departmental results and departmental result indicators.
Departmental Results Report (rapport sur les résultats ministériels)
A report on a department’s actual accomplishments against the plans, priorities and expected results set out in the corresponding Departmental Plan.
Full-time equivalent (équivalent temps plein)
A measure of the extent to which an employee represents a full person-year charge against a departmental budget. For a particular position, the full-time equivalent figure is the ratio of the number of hours the person actually works divided by the standard number of hours set out in the person’s collective agreement.
gender-based analysis plus (GBA Plus) (analyse comparative entre les sexes plus [ACS Plus])
An analytical tool used to assess support the development of responsive and inclusive how different groups of women, men and gender-diverse people experience policies, programs and policies, programs, and other initiatives. GBA Plus is a process for understanding who is impacted by the issue or opportunity being addressed by the initiative; identifying how the initiative could be tailored to meet the diverse needs of the people most impacted; and anticipating and mitigating any barriers to accessing or benefiting from the initiative. GBA Plus is an intersectional analysis that goes beyond biological (sex) and socio-cultural (gender) differences to consider other factors, such as age, disability, education, ethnicity, economic status, geography (including rurality), language, race, religion, and sexual orientation.
government-wide priorities (priorités pangouvernementales)
For the purpose of the 2023–24 Departmental Results Report, government-wide priorities are the high-level themes outlining the government’s agenda in the November 23, 2021, Speech from the Throne: building a healthier today and tomorrow; growing a more resilient economy; bolder climate action; fight harder for safer communities; standing up for diversity and inclusion; moving faster on the path to reconciliation; and fighting for a secure, just and equitable world.
horizontal initiative (initiative horizontale)
An initiative where two or more federal departments are given funding to pursue a shared outcome, often linked to a government priority.
non-budgetary expenditures (dépenses non budgétaires)
Net outlays and receipts related to loans, investments and advances, which change the composition of the financial assets of the Government of Canada.
performance (rendement)
What a department did with its resources to achieve its results, how well those results compare to what the department intended to achieve, and how well lessons learned have been identified.
performance indicator (indicateur de rendement)
A qualitative or quantitative means of measuring an output or outcome, with the intention of gauging the performance of a department, program, policy or initiative respecting expected results.
plan (plan)
The articulation of strategic choices, which provides information on how a department intends to achieve its priorities and associated results. Generally, a plan will explain the logic behind the strategies chosen and tend to focus on actions that lead to the expected result.
planned spending (dépenses prévues)
For Departmental Plans and Departmental Results Reports, planned spending refers to those amounts presented in Main Estimates. A department is expected to be aware of the authorities that it has sought and received. The determination of planned spending is a departmental responsibility, and departments must be able to defend the expenditure and accrual numbers presented in their Departmental Plans and Departmental Results Reports.
program (programme)
Individual or groups of services, activities or combinations thereof that are managed together within the department and focus on a specific set of outputs, outcomes or service levels.
program inventory (répertoire des programmes)
Identifies all the department’s programs and describes how resources are organized to contribute to the department’s core responsibilities and results.
result (résultat)
A consequence attributed, in part, to a department, policy, program or initiative. Results are not within the control of a single department, policy, program or initiative; instead, they are within the area of the department’s influence.
Indigenous business (entreprise autochtones)
For the purpose of the Directive on the Management of Procurement Appendix E: Mandatory Procedures for Contracts Awarded to Indigenous Businesses and the Government of Canada’s commitment that a mandatory minimum target of 5% of the total value of contracts is awarded to Indigenous businesses, a department that meets the definition and requirements as defined by the Indigenous Business Directory.
statutory expenditures (dépenses législatives)
Expenditures that Parliament has approved through legislation other than appropriation acts. The legislation sets out the purpose of the expenditures and the terms and conditions under which they may be made.
target (cible)
A measurable performance or success level that a department, program or initiative plans to achieve within a specified time period. Targets can be either quantitative or qualitative.
voted expenditures (dépenses votées)
Expenditures that Parliament approves annually through an appropriation act. The vote wording becomes the governing conditions under which these expenditures may be made.