
Quarterly Financial Report for the quarter ended September 30, 2021
About this publication
Publication author: Canada Economic Development for Quebec Regions
Catalogue: Iu90-1/19E-PDF
ISSN: 2368-6545
Publish date: November 26, 2021
Summary: Financial report of the Agency on its spending trends for the 2nd quarter of 2021.
Table of Contents
1. Introduction
This quarterly financial report has been prepared by Canada Economic Development for Quebec Regions (CED) as required under section 65.1 of the Financial Administration Act and in the form and manner prescribed by the Treasury Board.
This report should be read in conjunction with the 2021–22 Estimates and the 2021–2022 Departmental Plan. These documents provide a brief description of CED’s mandate and programs.
This report has not been subject to an external audit or review.
1.1 Authority, mandate and programs
The mission of Canada Economic Development for Quebec Regions (CED) is to promote the long-term economic development of the regions of Quebec by giving special attention to those where slow economic growth is prevalent or opportunities for productive employment are inadequate.
CED is the key federal player in Quebec for the promotion of economic development in the regions and among small and medium-sized businesses (SMEs). To achieve its core responsibility, which consists of developing the Quebec economy, CED fosters business startups and performance. It helps businesses become more innovative and enhance their productivity and competitiveness. It also supports community engagement efforts in the various regions of Quebec and helps attract investments aimed at boosting economic prosperity in Quebec and Canada.
CED contributes to the economic vitality of all Quebec regions by leveraging their regional competitive advantages. It supports the transition and diversification of communities that remain dependent on a limited number of sectors, or that have been affected by an economic shock, such as the closure of the chrysotile mines.
CED achieves its results by supporting businesses—primarily SMEs—and non-profit organizations (NPOs) by means of strategic investments. Through its 12 business offices located in the various regions of Quebec, and the ties it has developed with the other economic development players, CED stays abreast of the needs of the regions and businesses and is able to provide financial support for the delivery of projects that support businesses and communities in their economic development efforts.
CED has three programs that support its core responsibility:
- Regional Innovation
- Community Vitality
- Targeted or Temporary Support
Additional information on CED’s authority, mandate and programs can be found in the 2021–22 Main Estimates and the 2021–2022 Departmental Plan.
1.2 Basis of presentation
This quarterly report was prepared by CED using an expenditure basis of accounting. The accompanying Statement of Authorities includes CED’s spending authorities granted by Parliament and those used by CED, consistent with the 2021–2022 Main Estimates. This quarterly report was prepared using a special-purpose financial reporting framework designed to meet financial information needs with respect to the use of spending authorities.
Prior authority from Parliament is required before funds can be spent by the Government. Authorities available for use are given through appropriation acts in the form of annually approved limits, or through legislation in the form of statutory spending authorities for specific purposes.
When Parliament is dissolved for the purposes of holding a general election, section 30 of the Financial Administration Act authorizes the Governor General, under certain conditions, to issue a special warrant authorizing the government to withdraw funds from the Consolidated Revenue Fund. A special warrant is deemed to be an appropriation for the fiscal year in which it is issued.
CED uses the full accrual method of accounting to prepare and present its annual financial statements that make up part of the departmental results reporting process. However, the spending authorities voted by Parliament remain on an expenditure basis.
1.3 Financial structure of Canada Economic Development for Quebec Regions (CED)
There are two annual appropriations for CED’s expenditures management:
- Vote 1 – Net operating expenditures, which include CED authorities related to personnel costs, and operating and maintenance expenses
- Vote 5 – Grants and contributions, which include all authorities related to transfer payments
Costs under statutory authorities, which represent payments made under legislation approved previously by Parliament and which are not part of the annual appropriations bills, include such items as the employer’s share of the employee benefit plan, and transfer payments under the Public Health Events of National Concern Payments Act. Exceptionally in 2020–2021, CED is using a temporary statutory appropriation to administer its Regional Relief and Recovery Fund (RRRF) associated with the COVID-19 pandemic.
2. Highlights of fiscal quarter and fiscal year-to-date results
This section presents a variety of financial information as at September 30, 2021, including the authorities available for the year and expenditures incurred during the second quarter, as compared with the previous fiscal year.
The explanation of variances in the amounts is based on the premise that discrepancies of less than 5% have a minimal impact on the interpretation of the results.
The details of this financial information are provided in sections 2.1 and 2.2, and in the tables in the Appendix.
NB: Because of the exceptional situation caused by the COVID-19 pandemic in 2020–21, the House of Commons continued to review the 2020–2021 Main Estimates until December 2020. Full appropriations were only received in December 2020.
IN LIGHT OF THESE CIRCUMSTANCES, COMPARISONS WITH THE PREVIOUS FISCAL YEAR ARE NOT REPRESENTATIVE.
2.1 Authorities analysis
Authorities as at September 30, 2021, totalled $439.7M, compared with $438.2M as at June 30, 2021. The $1.5M (3.4%) variance is considered insignificant.
On a cumulative basis, a year-over-year decrease was reported in CED’s total annual authorities, which stood at $454.1M as at September 30, 2020.
The noted $14.4M (3.2%) downward variance is due to the following changes:
- Vote 1 – Net operating expenditures of +$10.5M;
- Vote 5 – Grants and contributions of +$67.2M;
- Budgetary statutory authorities: -$92.1M.
NB: *In the report, totals may not add up due to rounding.
The chart below shows the annual budgetary appropriation authorities as at September 30, 2021, compared with the previous fiscal year.
Annual budgetary appropriation authorities as at September 30, fiscal year 2021–2022, compared with 2020–2021
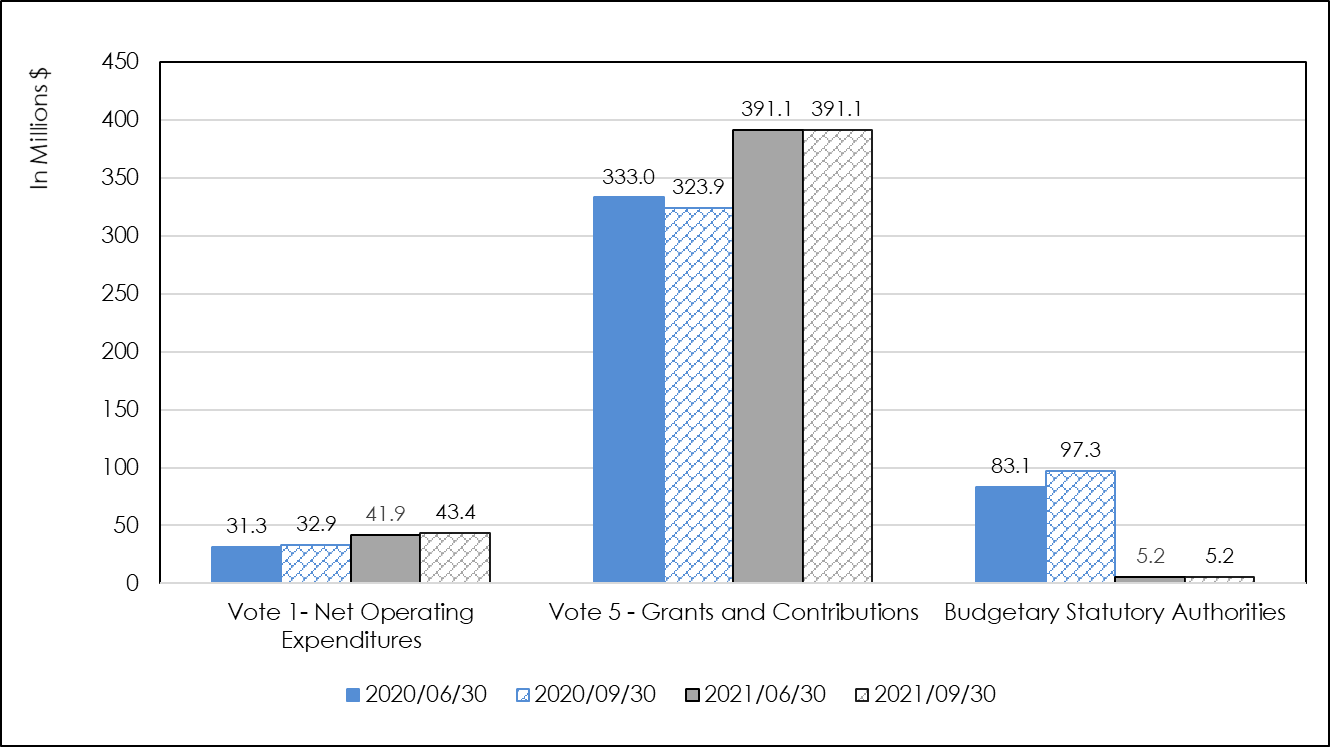
Graph 1 - Long description
Analysis of annual budgetary appropriation authorities: subdivided into three sections, this graph provides an overview of net available budgetary authorities (Vote 1 – Net Operating Expenditures; Vote 5 – Grants and Contributions; and Budgetary Statutory Authorities) as at June 30 and as at September 30, 2021, including a comparison as at June 30 and as at September 30, 2020.
As at September 30, 2021, annual authorities under Vote 1 – Net Operating Expenditures, Vote 5 – Grants and Contributions, and Budgetary Statutory Authorities, totalled $43.4M ($32.9M in 2020–2021); $391.1M ($323.9M in 2020–2021); and $5.2M ($97.3M in 2020–2021), respectively.
As at June 30, 2021, annual authorities under Vote 1 – Net Operating Expenditures, Vote 5 – Grants and Contributions, and Budgetary Statutory Authorities, totalled $41.9M ($31.3M in 2020–2021); $391.1M ($333.0M in 2020–2021); and $5.2M ($83.1M in 2020–2021), respectively.
Vote 1 authorities (Net Operating Expenditures)
As at September 30, 2021, authorities totalled $43.4M, compared with $32.9M as at September 30, 2020; this represents a yearly increase of $10.5 million (31.9%).
As previously noted, in 2020–21, only 75% of the appropriations in the 2020–2021 Main Estimates had been allocated as at September 30, 2020. The remaining appropriations were received in December 2020, which largely explains this variance.
Vote 5 authorities (Grants and contributions)
As at September 30, 2021, authorities totalled $391.1M, compared with $323.9M as at September 30, 2020. This represents an increase of $67.2 million (20.7%).
This variance consists of a number of components—both upward and downward—resulting in a net increase of $67.2 million:
- Increase In funding
- Interim supply not received in the second quarter of 2020–2021: +$63.9M
- Regional Air Transportation Initiative: +$43.1M
- Regional economic infrastructure development initiative: +$17.4M;
- Increase in repayable contribution reimbursements: +$9.1M;
- Black Entrepreneurship Program: +$3.8M;
- Decrease in funding
- RRRF – REGI: -$52.1M;
- RRRF – CFP: -$9.3M;
- Federal jobs and tourism strategy: -$7.5M;
- Other intergovernmental transfers and adjustments: -$1.2M.
Budgetary statutory authorities
As at September 30, 2021, authorities totalled $5.2M, compared with $97.3M as at September 30, 2020. This represents a net decrease of $92.1M. CED does not have any G&C statutory appropriations this year.
- Decrease in funding
- RRRF – CFP: -$65M in transfer payments in the form of statutory appropriations;
- RRRF – REGI: -$25M in transfer payments in the form of statutory appropriations;
- Canadian Seafood Stabilization Fund: -$2.2M in transfer payments in the form of statutory appropriations;
- Increase In funding
- Employee benefit plan: +$0.1M.
2.2 Analysis of expenditures
CED expenditures in the second quarter of 2021–2022 totalled $66.2M, compared with $90.5M for the same period last year. This represents a net decrease of $24.3M (26.9%) year-over-year.
This variance can be broken down as follows:
- Vote 1 – Net operating expenditures of +$1.7M;
- Vote 5 – Grants and contributions of -$1.4M;
- Budgetary statutory authorities: -$24.6M.
On a cumulative basis as at September 30, 2021, expenditures amounted to $139.2M, compared with $173.8M for the same period last year. This represents a drop of $34.5M this year.
This variance can be broken down as follows:
- Vote 1 – Net operating expenditures of +$3.2M;
- Vote 5 – Grants and contributions of +$40.2M;
- Budgetary statutory authorities: -$77.9M.
The chart below shows expenditures in the second quarter of 2021–2022 by budgetary appropriation, compared with the previous fiscal year.
Second-quarter expenditures by budgetary appropriation, 2021–2022, compared with 2020–2021
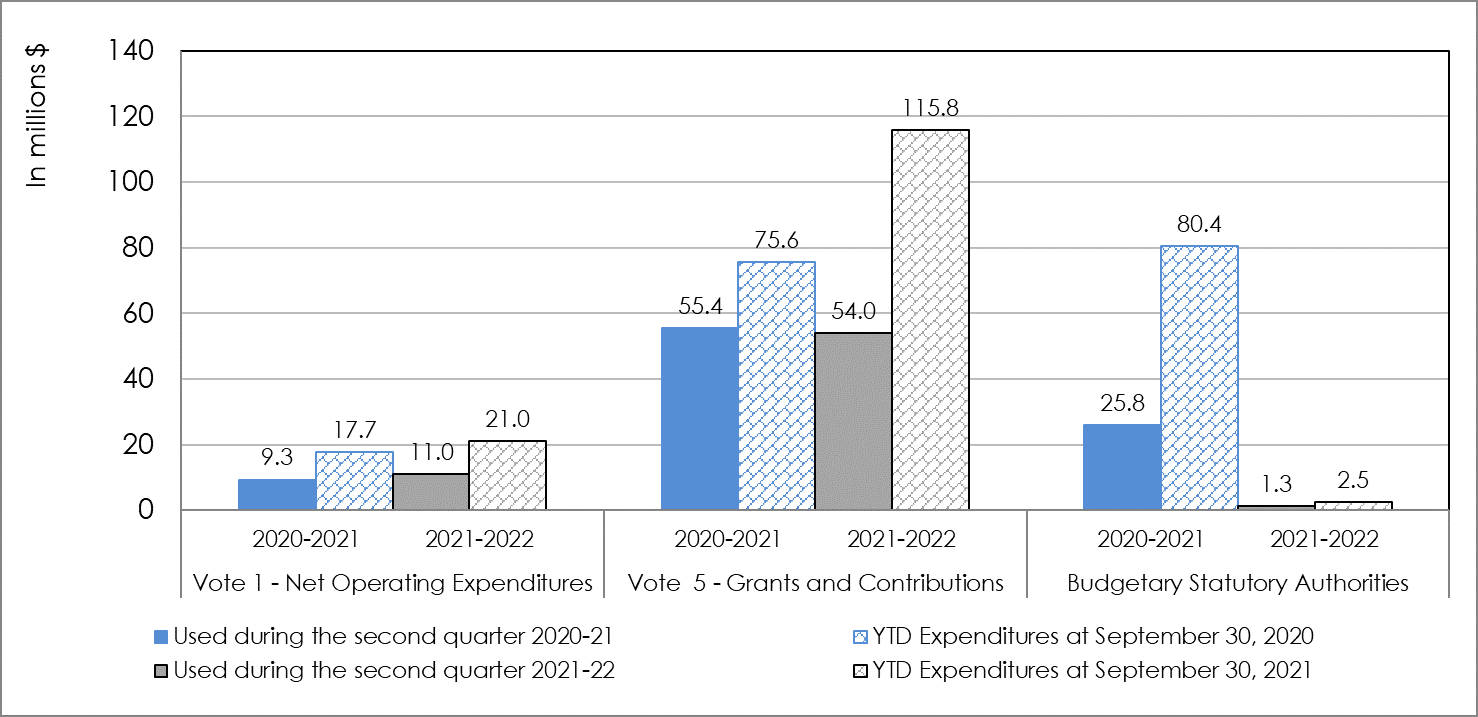
Figures may differ from the total indicated because of rounding.
Graph 2 - Long description
Analysis of second-quarter expenditures and presentation of year-to-date expenditures by budgetary appropriation as at September 30, fiscal year 2021–2022, compared with 2020-2021: subdivided into three sections, namely Vote 1 – Net Operating Expenditures, Vote 5 – Grants and Contributions, and Budgetary Statutory Authorities. This graph shows expenditures incurred during the second quarter of 2021–2022, as well as year-to-date expenditures as at September 30, 2021, and includes a comparison with fiscal year 2020–2021.
In the second quarter of 2021–2022, expenditures under Vote 1 (Net Operating Expenditures), Vote 5 (Grants and Contributions), and Budgetary Statutory Authorities, amounted to $11.0M ($9.3M in 2020–2021); $54.0M ($55.4M in 2020–2021); and $1.3M ($25.8M in 2020–2021), respectively.
Year-to-date expenditures as at September 30, 2021, under Vote 1 (Net Operating Expenditures), Vote 5 (Grants and Contributions), and Budgetary Statutory Authorities, totalled $21.0M ($17.7M in 2020–2021); $115.8M ($75.6M in 2020–2021); and $2.5M ($80.4M in 2020–2021), respectively.
Vote 1 expenditures (Net operating expenditures)
CED’s net operating expenditures for the second quarter of 2021–2022 totalled $11.0M, compared with $9.3M in 2020–2021. This represents an increase of $1.7M this year. The increase is largely attributable to a rise in salary expenditures, since additional staff had to be hired to deliver new temporary initiatives and specific COVID-19 initiatives. The lump-sum payments that had to be made to employees this year as compensation for problems with the Phoenix payroll system also contributed to the increase in expenditures. Finally, the renewal of certain collective agreements this year resulted in an increase in salary expenditures.
Cumulative expenditures totalled $21.0M as at September 30, 2021, compared with $17.7M as at September 30, 2020. This represents an increase of $3.2M (18.1%) this year, mainly due to salary and professional services expenditures, for which the pace of payments has increased this year. The gap in professional services is expected to be resolved by the end of the fiscal year.
(For further details on these expenditures, see the table entitled “Departmental budgetary expenditures by standard object” in Appendix 6.2.)
Vote 5 expenditures (Grants and contributions)
Grant and contribution expenditures for the second quarter of 2021–2022 totalled $54.0 million, compared with $55.4M in 2020–2021. The decrease of $1.4M (2.5%) is considered insignificant.
On a cumulative basis as at September 30, 2021, expenditures totalled $115.8M, compared with $75.6M as at September 30, 2020. This represents an increase in spending this year of $40.2M (53.2%).
Primarily, spending on the regular REGI program and the QEDP increased by approximately $14.5M this year. In addition, RRRF (REGI and CFP) spending rose by approximately $25.7M.
Expenditures under budgetary statutory authorities
Spending on statutory authorities in the second quarter of 2021–2022 totalled $1.3M, compared with $25.8M during the same period in 2020–2021. This represents a year-over-year decrease of $24.5M. This difference can be attributed to the $24.6M decrease in transfer payments this year under the RRRF-REGI (statutory appropriations). As was noted above, CED does not have any G&C statutory appropriations this year.
Cumulative expenditures as at September 30, 2021 stood at $2.5M and consist solely of payments under the employee benefit plan. As at September 30, 2020, expenditures amounted to $80.4M. This amount was made up of $2.4M for the employee benefit plan and $78M in G&C statutory appropriation payments under the RRRF-REGI.
(For further details on these expenditures, see the table entitled “Departmental budgetary expenditures by standard object” in Appendix 6.2.)
3. Risks and uncertainties
The consequences of COVID-19 remain at the epicentre of the organization’s risks and uncertainties. The financial solidity of Quebec businesses, both during and after the pandemic, and the repercussions on the global economy, are still key issues. This situation fuels the risk that companies, now more indebted and having exhausted their contingency funds, will be unable to invest in order to pursue their efforts to modernize and ensure the productivity gains needed for their survival and growth.
Programs have been put in place to provide emergency funding for SMEs and economic organizations in all sectors of the economy to allow them to stay in business. This particular type of investment in new industries for the organization and a new clientele during the pandemic increases the risk of non-repayment of contributions, and potentially the workload associated with recovering amounts owing in future years.
Furthermore, the unprecedented volume of these new programs and the speed with which they are being rolled out could pose a risk in that the programs may not include certain preventive and post-processing controls designed to prevent major errors.
To reduce this risk, CED has introduced mitigation strategies to ensure that control measures are sufficient. Agreement management processes have also been simplified as much as possible, for the benefit of clients.
Some technology solutions are reaching the end of their useful life, particularly those related to financial management. There is thus a risk related to the integrity of available data. To mitigate this risk, CED has undertaken a project to replace its financial system with the enterprise solution (SAP) selected by the Office of the Comptroller General. In the meantime, the state of technological solutions is being monitored on an ongoing basis. Controls, specific processes and monitoring have been put in place to ensure that the integrity of financial information is maintained.
At the internal management level, CED will continue to develop financial risk mitigation measures by managing its budgetary and allocation processes through a well-defined framework supported by a series of financial controls. Internal controls over financial reporting, such as entity controls, general IT controls, and business process controls, are only a few examples of mitigation measures designed to support the sound management of public funds by the Department.
4. Significant changes in relation to operations, personnel and programs
In 2020–2021, the Government of Canada set up the Regional Relief and Recovery Fund (RRRF), an ad hoc targeted initiative, initially put in place for one year, with a total budget of $223.6M for CED, in response to the COVID-19 pandemic.
In 2021-2022, the RRRF was extended, and the following funding was added:
- Funding to support small and medium-sized businesses: $39.8M;
- Funding for the Community Futures Network: $6.0M.
Also, since not all of the amounts allocated in 2020–2021 were spent on grants and contributions, the following amounts were carried over to 2021–2022, in addition to the new funding received:
- Funding to support small and medium-sized businesses: $23.0M;
- Funding for the Community Futures Network: $3.0M.
Also in 2021–2022, CED will continue to implement other ad hoc initiatives set up in response to COVID-19, such as the Regional Air Transportation Initiative, the Black Entrepreneurship Program and the Canadian Seafood Stabilization Fund.
Finally, Maxime Garon took up the position of Vice-President of Corporate Services on October 1, 2021; he had previously held this position on an acting basis.
5. Approval of senior officials
The purpose of this section is to provide the approval of senior officials, as required by the Policy on Financial Management, as follows:
Approved by:
Original signed by
_____________________________________
Manon Brassard
President
Montreal, Canada
November 12, 2021
Original signed by
__________________________________
Maxime Garon
Chief Financial Officer
Montreal, Canada
November 12, 2021
6. Appendices
6.1 Statement of authorities (unaudited)
| Total available for use for the year ending March 31, 2022* | Used during the quarter ended September 30, 2021 | Year-to-date used at quarter-end | |
|---|---|---|---|
| Vote 1 – Net Operating expenditures | 43,371 | 11,018 | 20,956 |
| Vote 5 – Grants and contributions | 391,102 | 53,960 | 115,781 |
| Total budgetary statutory authorities | 5,218 | 1,250 | 2,501 |
| Total authorities | 439,691 | 66,228 | 139,238 |
| Total available for use for the year ending March 31, 2021* | Used during the quarter ended September 30, 2020 | Year-to-date used at quarter-end | |
|---|---|---|---|
| Vote 1 – Net Operating expenditures | 32,915 | 9,273 | 17,737 |
| Vote 5 – Grants and contributions | 323,869 | 55,365 | 75,616 |
| Total budgetary statutory authorities | 97,272 | 25,845 | 80,429 |
| Total authorities | 454,056 | 90,483 | 173,782 |
* Includes only authorities available for use and granted by Parliament at quarter-end.
6.2 Departmental budgetary expenditures by standard object (unaudited)
| Planned expenditures for the year ending March 31, 2022* | Expenditures during the quarter ended September 30, 2021 | Year-to-date used at quarter-end | |
|---|---|---|---|
| Expenditures: | |||
| Personnel* | 40,781 | 10,557 | 20,377 |
| Transport and communication | 902 | 78 | 88 |
| Information | 289 | 109 | 115 |
| Professional and special services | 4,844 | 1,045 | 2024 |
| Leasing | 620 | 126 | 406 |
| Repairs and maintenance services | 32 | 10 | 10 |
| Public utilities, materials and supplies | 219 | 7 | 10 |
| Acquisition of land, buildings and works | 0 | 0 | 0 |
| Acquisition of machinery and equipment | 901 | 345 | 387 |
| Transfer payments | 391,102 | 53,960 | 115,781 |
| Other grants and payments | 0 | -8 | 40 |
| Total net budgetary expenditures | 439,690 | 66,229 | 139,238 |
* Includes employee benefit plans (EBPs).
| Planned expenditures for the year ending March 31, 2021* | Expenditures during the quarter ended September 30, 2020 | Year-to-date used at quarter-end | |
|---|---|---|---|
| Expenditures: | |||
| Personnel* | 32,120 | 9,279 | 18,119 |
| Transport and communication | 525 | 16 | 27 |
| Information | 156 | 29 | 36 |
| Professional and special services | 4,241 | 1,068 | 1,410 |
| Leasing | 324 | 103 | 413 |
| Repair and maintenance services | 14 | 0 | 4 |
| Public utilities, materials and supplies | 137 | 12 | 14 |
| Acquisition of machinery and equipment | 514 | 0 | 81 |
| Transfer payments | 416,019 | 79,996 | 153,616 |
| Other grants and payments | 4 | -23 | 62 |
| Total net budgetary expenditures | 454,054 | 90,480 | 173,782 |
* Includes employee benefit plans (EBPs)