
Quarterly Financial Report for the Quarter Ended
September 30, 2023
About this publication
Publication author: Canada Economic Development for Quebec Regions
Publish date: November 29, 2023
Table of contents
- Introduction
- Highlights of Fiscal Quarter and Fiscal Year-to-Date Results
- Risks and Uncertainties
- Significant Changes to Operations, Personnel and Programs
- Approval by Senior Officials
- Appendices
1. Introduction
This quarterly financial report has been prepared by Canada Economic Development for Quebec Regions (CED) as required under section 65.1 of the Financial Administration Act and in the form and manner prescribed by the Treasury Board.
This report should be read in conjunction with the 2023–2024 Estimates and the 2023–2024 Departmental Plan.
This document has not been subject to external audit or review.
1.1 Authorities, mandate and programs
The mission of Canada Economic Development for Quebec Regions (CED) is to promote the long-term economic development of the regions of Quebec by giving special attention to those where slow economic growth is prevalent or opportunities for productive employment are inadequate.
CED is the key federal player in Quebec for the promotion of economic development in the regions and among small and medium-sized businesses (SMEs). To achieve its core responsibility, which consists of developing the Quebec economy, CED fosters business startups and performance. It helps businesses become more innovative and enhance their productivity and competitiveness. It also supports community engagement efforts in the various regions of Quebec and helps attract investment aimed at boosting economic prosperity in Quebec and Canada.
CED contributes to the economic vitality of all Quebec regions by leveraging their regional competitive advantages. It supports the transition and diversification of communities that remain dependent on a limited number of sectors, or that have been affected by an economic shock, such as the closure of the chrysotile mines.
CED achieves its results by supporting businesses—primarily SMEs and non-profit organizations (NPOs)—by means of strategic investments. Through its 12 business offices located in the various regions of Quebec, and the ties it has developed with the other economic development players, CED stays abreast of the needs of the regions and businesses and is able to provide financial support for the delivery of projects that support businesses and local communities in their economic development efforts.
CED has three categories of programs that support its core responsibility:
- Regional Innovation
- Community Vitality
- Targeted or Temporary Support
Additional information about CED’s authority, mandate and programs can be found in the 2023–2024 Estimates and the 2023–2024 Departmental Plan.
1.2 Basis of presentation
This quarterly report was prepared by CED using an expenditure basis of accounting. The accompanying Statement of Authorities includes CED’s spending authorities granted by Parliament and used by CED, consistent with the 2023–2024 Main Estimates. This quarterly report was prepared using a special-purpose financial reporting framework designed to meet financial information needs with respect to the use of spending authorities.
Prior authority from Parliament is required before funds can be spent by the Government. Authorities available for use are given through appropriation acts in the form of annually approved limits or through legislation in the form of statutory authority for specific purposes.
When Parliament is dissolved for the purposes of a general election, section 30 of the Financial Administration Act authorizes the Governor General, under certain conditions, to issue a special warrant authorizing the government to withdraw funds from the Consolidated Revenue Fund. A special warrant is deemed to be an appropriation for the fiscal year in which it is issued.
CED uses the full accrual method of accounting to prepare and present its annual financial statements which are part of the process of preparing the departmental results report. However, the spending authorities voted by Parliament remain on an expenditure basis.
1.3 Financial structure of Canada Economic Development for Quebec Regions (CED)
There are two annual appropriations for the management of CED’s expenditures:
- Vote 1 – Net operating expenditures, which includes CED authorities related to personnel costs and operating and maintenance expenditures
- Vote 5 – Grants and contributions, which includes all authorities related to transfer payments.
Expenses under statutory authorities, for which payments are made under legislation previously approved by Parliament and which are not part of the annual appropriations bills, include items such as the employer’s share of the employee benefit plan.
2. Highlights of fiscal quarter and fiscal year-to-date results
This section presents various financial information as at September 30, 2023, including the authorities available for the year and expenditures incurred during the second quarter, as compared with the previous fiscal year.
The explanation of variances in the amounts is based on the premise that discrepancies of less than 5% have a minimal impact on the interpretation of results.
The details of this financial information are provided in sections 2.1 and 2.2, and in the tables in the Appendix.
2.1 Analysis of authorities
Authorities as at September 30, 2023, totalled $486.2M, compared with $484.7M as at June 30, 2023. The $1.5M (0.3%) variance is considered not significant.
On a cumulative basis, CED’s total annual authorities decreased year-over-year, down from $562.8M as at September 30, 2022.
The noted downward variance of $76.6M (-13.6%) is attributed to the following changes:
- Vote 1 – Net operating expenditures: -$0.4M
- Vote 5 – Grants and contributions: -$76.2M
NB: Totals in the report may not add up due to rounding.
The chart below shows the annual budgetary appropriation authorities as at September 30, 2023, compared with the previous fiscal year.
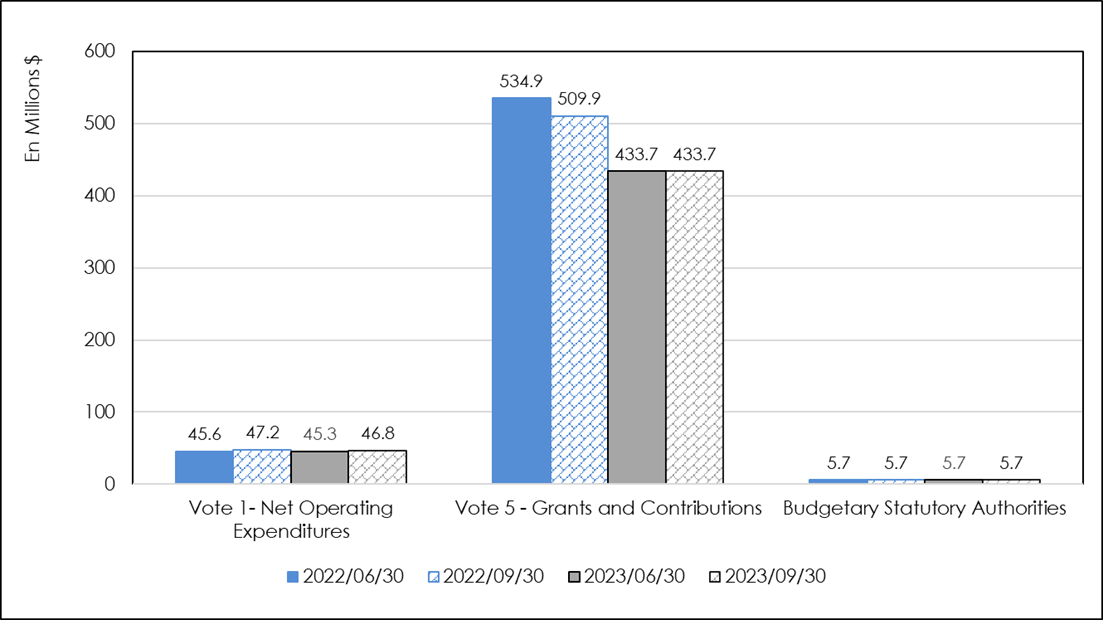
Image 1 - Text Version :
Analysis of annual budgetary appropriation authorities: subdivided into three sections, this graph provides an overview of net available budgetary authorities (Vote 1 – Net Operating Expenditures; Vote 5 – Grants and Contributions; and Budgetary Statutory Authorities) as at June 30 and as at September 30, 2023, including a comparison as at June 30 and as at September 30, 2022.As at September 30, 2023, annual authorities under Vote 1 – Net Operating Expenditures, Vote 5 – Grants and Contributions, and Budgetary Statutory Authorities, totalled $46.8M ($47.2M in 2022–2023); $433.7M ($509.9M in 2022–2023); and $5.7M ($5.7M in 2022–2023), respectively.
As at June 30, 2023, annual authorities under Vote 1 – Net Operating Expenditures, Vote 5 – Grants and Contributions, and Budgetary Statutory Authorities, totalled $45.3M ($45.6M in 2022–2023); $433.7M ($534.9M in 2022–2023); and $5.7M ($5.7M in 2022–2023), respectively.
Vote 1 authorities (Net operating expenditures)
As at September 30, 2023, authorities totalled $46.8M, compared with $47.2M as at September 30, 2022; this represents an non significant decrease of $0.4M (-0.8%) this year.
Vote 5 authorities (Grants and contributions)
As at September 30, 2023, authorities totalled $433.7M, compared with $509.9M as at September 30, 2022. This represents a decrease of $76.2M (-14.9%).
This variance is made up of a number of items, some of which varied upward, others downward, for a net decrease of $76.2M:
-
- Increase in funding (+$53.2M)
- Reinvestment of repayable contributions:* +$42.5M
- Regional Air Transportation Initiative (RATI): +$8.0M
- International Sustainability Standards Board (ISSB): +$2.7M
- Increase in funding (+$53.2M)
-
- Decrease in funding (-$129.4M) **
- Tourism Relief Fund: -$46.6M
- Major Festivals and Events Support Initiative: -$23.9M
- Canada Community Revitalization Fund: -$20.3M
- Regional Economic Growth through Innovation program top-up: -$14.6M
- Jobs and Growth Fund: -$10.4M
- Initiative for the development of regional economic infrastructure in Quebec: -$8.2M
- Capacity building:** -$5.9M
- Women Entrepreneurship Strategy: -$3.4M
- Miscellaneous elements: -$2.0M
- Decrease in funding (-$129.4M) **
*In 2020–2021, CED granted its clients a moratorium on the reimbursement of repayable contributions for a period of 9 months as a measure to mitigate the consequences of the COVID-19. These reimbursements being reinvested in regular programming two years after collection, DEC thus shows a shortfall in 2022-2023. These funds will be recovered over a longer period than initially planned.
Budgetary statutory authorities
As at September 30, 2023, authorities totalled $5.7M; a total of $5.7M was also reported as at September 30, 2022. The situation, therefore, is stable.
2.2 Analysis of expenditures
CED expenditures in the second quarter of 2023–2024 totalled $78.0M, compared with $71.4M for the same period a year ago. This represents a net increase of $6.6M (9.2%) compared with the previous fiscal year.
This variance can be broken down as follows:
- Vote 1 – Net operating expenditures: -$2.6M
- Vote 5 – Grants and contributions: +$9.6M
- Budgetary statutory authorities: -$0.4M
On a cumulative basis, expenditures as at September 30, 2023, amounted to $117.4M, compared with $106.5M for the same period in the previous year. This represents an increase of $10.9M (10.2%) this year.
This variance can be broken down as follows:
- Vote 1 – Net operating expenditures: -$2.7M
- Vote 5 – Grants and contributions: +$13.6M
The chart below shows expenditures in the second quarter of 2023–2024 by budgetary appropriation, compared with the previous fiscal year.
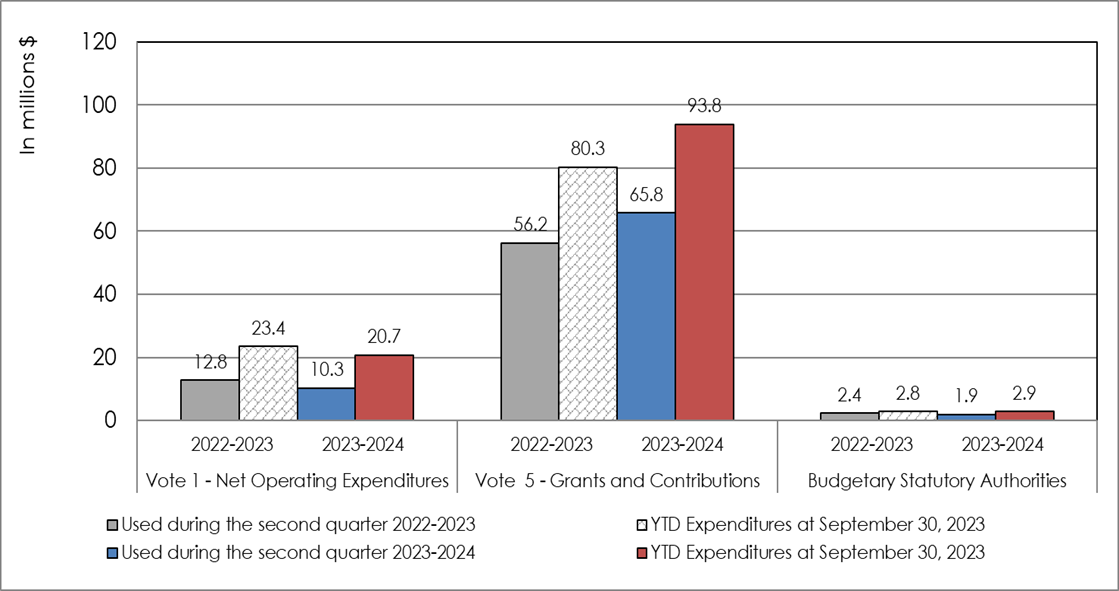
Image 2 - Text Version :
Analysis of second-quarter expenditures and presentation of year-to-date expenditures by budgetary appropriation as at September 30, fiscal year 2023–2024, compared with 2022 2023: subdivided into three sections, namely Vote 1 – Net Operating Expenditures, Vote 5 – Grants and Contributions, and Budgetary Statutory Authorities. This graph shows expenditures incurred during the second quarter of 2023–2024, as well as year-to-date expenditures as at September 30, 2023, and includes a comparison with fiscal year 2022–2023.In the second quarter of 2023–2024, expenditures under Vote 1 (Net Operating Expenditures), Vote 5 (Grants and Contributions), and Budgetary Statutory Authorities, amounted to $10.3M ($12.8M in 2022–2023); $65.8M ($56.2M in 2022–2023); and $1.9M ($2.4M in 2022–2023), respectively.
Year-to-date expenditures as at September 30, 2022, under Vote 1 (Net Operating Expenditures), Vote 5 (Grants and Contributions), and Budgetary Statutory Authorities, totalled $20.7M ($23.4M in 2022–2023); $93.8M ($80.3M in 2022–2023); and $2.9M ($2.8M in 2022–2023), respectively.
Vote 1 expenditures (Net operating expenditures)
CED’s net operating expenditures for the second quarter of 2023–2024 totalled $10.3M, compared with $12.8M in 2022–2023. This represents a decrease of $2.5M (-19.5%) this year.
The variance can be primarily attributed to a drop in salary expenditures during the second quarter, the decrease being explained by the high number of vacant positions within the organization. A drop in spending on professional services and computer licenses was also noted, as a number of contracts were not renewed.
On a cumulative basis, expenditures totalled $20.7M as at September 30, 2023, compared with $23.4M as at September 30, 2022, representing a decrease of $2.7M (-11.5%) this year, primarily a result of the salary expenditures, professional services and licenses referred to above.
(For further details on these expenditures, see the table entitled “Departmental budgetary expenditures by standard object” in Appendix 6.2.)
Vote 5 expenditures (Grants and contributions)
Grant and contribution expenditures for the second quarter of 2023–2024 totalled $65.8M, compared with $56.2M in 2022–2023, representing a $9.6M (17.1%) spending increase this year.
This increase can be attributed to the delayed launch of certain initiatives as well as issues in the supply chain in 2022 2023. The labour shortage, the scarcity of subcontractors, and issues with the supply of materials have all been aggravating factors. Due to these obstacles, several projects had to be postponed to 2023-2024, therefore pushing back disbursements. The following initiatives were affected: the Aerospace Regional Recovery Initiative (ARRI); the Canada Community Revitalization Fund (CCRF); the Major Festivals and Events Support Initiative (MFESI); and the support for Regional Quantum Innovation initiative.
On a cumulative basis, as at September 30, 2023, expenditures amounted to $93.8M, compared with $80.3M as at September 30, 2022. This represents a $13.5M (16.8%) increase in spending this year, for the same reasons as those noted above.
Expenditures under budgetary statutory authorities
Spending on statutory authorities in the second quarter of 2023–2024 totalled $1.9M, compared with $2.4M as at September 30, 2022. This represents a year-over-year decrease of $0.5M. This variance is a result of the previous year’s delay in the remittance of employee benefit payments to the Treasury Board Secretariat owing to the rollout of the new SAP financial system on April 1, 2022.
Cumulative expenditures as at September 30, 2022, amounted to $2.9M, compared with $2.8M as at September 30, 2022. These amounts consist solely of employee benefit remittances to the Treasury Board Secretariat.
(For further details on these expenditures, see the table entitled “Departmental budgetary expenditures by standard object” in Appendix 6.2.)
3. Risks and uncertainties
The post-pandemic context marked by an anticipated economic slowdown is compounding the risk that businesses, now more indebted and having exhausted their contingency funds, will cancel their investment projects in order to modernize their operations. Businesses have also had to deal with related challenges, such as supply chain disruptions, rising interest rates and operating expenses, and labour shortages. To help Quebec businesses in this new and changing economic context, CED will continue to implement some of the economic recovery initiatives announced in Budget 2021. Furthermore, to facilitate the delivery of services to its clients, CED will be setting up a new client portal and reviewing its continuum of services.
CED manages the allocation of resources within a well-defined framework of accountability, policies and procedures. The organization will continue to develop financial risk mitigation measures by rigorously managing its budgetary and allocation processes, supported by a series of financial controls. Internal controls over financial reporting, such as entity controls, general IT controls, and business process controls, are only a few examples of mitigation measures designed to support the sound management of public funds, within the limits of available resources and parliamentary authorities.
CED is also pursuing the stabilization of the SAP solution and the development of complementary tools. It should be noted that the rollout of the new SAP system has had a significant impact on the business intelligence required for G&C program delivery. To mitigate this risk, a governance structure has been put in place to ensure better planning and to optimize investment in the development of management reports and dashboards.
4. Significant changes to operations, personnel, and programs
The most noteworthy changes for CED in 2023–2024 are changes resulting from the end of the various economic recovery initiatives announced in Budget 2021—both in terms of the management of the end of these initiatives and the monitoring of the many contributions, which will continue for a number of years:
- Canada Community Revitalization Fund
- Aerospace Regional Recovery Initiative
- Major Festivals and Events Support Initiative
- Tourism Relief Fund
- Jobs and Growth Fund
- Black Entrepreneurship Program
As part of the July 26, 2023, Cabinet shuffle, Prime Minister Justin Trudeau named Soraya Martinez Ferrada as Minister of Tourism and Minister responsible for the Economic Development Agency of Canada for the Regions of Quebec.
Sony Perron was appointed as Deputy Minister / President, effective September 11, 2023, following the departure of Manon Brassard, who has taken up a position with the Immigration and Refugee Board.
5. Approval by Senior Officials
The purpose of this section is to provide the approval of senior officials, as required by the Policy on Financial Management, as follows:
Approved by :
Original signed by
_____________________________________
Sony Perron
Deputy Minister / President
Montréal, Canada
November 15, 2023
Original signed by
__________________________________
Maxime Garon
Chief Financial Officer
Montréal, Canada
November 15, 2023
6. Appendices
6.1 Statement of authorities (unaudited)
| Total available for use for the year ended March 31, 2024* | Used during the quarter ended September 30, 2023 | Year-to-date used at quarter-end | |
|---|---|---|---|
| Vote 1 – Net Operating expenditures | 46,824 | 10,297 | 20,699 |
| Vote 5 – Grants and contributions | 433,653 | 65,819 | 93,841 |
| Total budgetary statutory authorities | 5,734 | 1,911 | 2,867 |
| Total authorities | 486,211 | 78,027 | 117,407 |
| Total available for use for the year ended March 31, 2023* | Used during the quarter ended September 30, 2022 | Year-to-date used at quarter-end | |
|---|---|---|---|
| Vote 1 – Net Operating expenditures | 47,227 | 12,841 | 23,429 |
| Vote 5 – Grants and contributions | 509,878 | 56,231 | 80,260 |
| Total budgetary statutory authorities | 5,662 | 2,359 | 2,831 |
| Total authorities | 562,767 | 71,431 | 106,520 |
| * Includes only authorities available for use and granted by Parliament at quarter-end. | |||
6.2 Departmental budgetary expenditures by standard object (unaudited)
| Planned expenditures for the year ended March 31, 2024 | Expenditures during the quarter ended September 30, 2023 | Year-to-date used at quarter-end | |
|---|---|---|---|
| Expenses: | |||
| Personnel* | 45,253 | 11,117 | 20,809 |
| Transport and communications | 356 | 259 | 397 |
| Information | 308 | 54 | 92 |
| Professional and special services | 4,615 | 643 | 1,588 |
| Leasing | 886 | 118 | 575 |
| Repairs and maintenance | 28 | 10 | 32 |
| Public utilities, materials and supplies | 102 | 16 | 25 |
| Acquisition of land and buildings, and works | 0 | 0 | 0 |
| Acquisition of machinery and equipment | 1 010 | 52 | 69 |
| Transfer payments | 433,653 | 65,819 | 93,841 |
| Other grants and payments | 0 | -61 | -20 |
| Total net budgetary expenditures | 486,211 | 78027 | 117,408 |
| * Includes employee benefit plans (EBPs). | |||
| Planned expenditures for the year ended March 31, 2023 | Expenditures during the quarter ended September 30, 2022 | Year-to-date used at quarter-end | |
|---|---|---|---|
| Expenses: | |||
| Personnel* | 45,006 | 12,865 | 22,360 |
| Transport and communications | 759 | 116 | 201 |
| Information | 265 | 89 | 106 |
| Professional and special services | 5,011 | 1,265 | 2,344 |
| Leasing | 717 | 520 | 1,003 |
| Repairs and maintenance | 26 | 8 | 11 |
| Public utilities, materials and supplies | 180 | -12 | 10 |
| Acquisition of land and buildings, and works | 0 | 0 | 0 |
| Acquisition of machinery and equipment | 925 | 65 | 93 |
| Transfer payments | 509,878 | 56,231 | 80,260 |
| Other grants and payments | 0 | 284 | 132 |
| Total net budgetary expenditures | 562,767 | 71,431 | 106,520 |
| * Includes employee benefit plans (EBPs). | |||