
Employment Equity Act: Annual report 2018
On this page
- Message from the Minister
- Introduction
- Section 1 – The federally regulated private sector
- Section 2 – Designated groups profiles
- Section 3 - Employment equity program highlights
- Conclusion
- Appendix A
- Appendix B
Alternate format

Employment Equity Act: Annual Report 2018
[PDF - 2.08 MB]
Large print, braille, MP3 (audio), e-text and DAISY formats are available on demand by ordering online or calling 1 800 O-Canada (1-800-622-6232). If you use a teletypewriter (TTY), call 1-800-926-9105.
Message from the Minister
2018
The Government of Canada believes that Canada’s strength lies in its diversity. Creating equitable, diverse and inclusive workplaces will help grow our middle class and build a country where every Canadian has a real and fair chance to succeed and contribute to our economy and to succeed.
As the Minister responsible for Labour, I present the Employment Equity Act: Annual Report 2018. The report demonstrates the ongoing efforts of employers in the federally regulated private sector to ensure equity in workplaces across the country for the four groups designated under the Employment Equity Act—women, Indigenous peoples, persons with disabilities and members of visible minorities. Highlights show that the representation of women, Indigenous peoples and members of visible minorities have increased in senior management positions. In addition, women approached parity and members of visible minorities exceeded labour market availability in senior management positions.
We know that increasing representation of these in the workplace is great for business and the economy. In support of employers’ efforts, we took action by introducing proactive pay equity legislation that will ensure that women and men in federally regulated workplaces receive equal pay for work of equal value. We also introduced legislation to bring federal labour standards into the 21st century. Modern labour standards will better protect Canadian workers and help set the stage for good-quality jobs. Both of these important pieces of legislation received Royal Assent on December 13, 2018.
We are also addressing the wage gaps that affect women, Indigenous peoples, persons with disabilities and members of visible minorities through pay transparency measures which will help to highlight those employers who model equitable pay practices. Through Bill C-65, which also received Royal Assent, we amended the Canada Labour Code to better prevent and address workplace harassment and violence. While no one is immune, women and other under‑represented groups are more likely than others to experience these behaviours, which can act as a barrier to their equal participation in the workforce. Needless to say, 2018 has been a year full of accomplishments.
I encourage employers in the federal jurisdiction and all other employers to continue their efforts in creating equitable, inclusive and respectful workplaces that better represent Canadians. I do believe that we—the Government of Canada, employers, workers and the labour movement—can do this together.
The Honourable Patty A. Hajdu, P.C., M.P.
Minister of Employment, Workforce Development and Labour
Introduction
The purpose of the Act is to achieve equality in the workplace so that no person shall be denied employment opportunities or benefits for reasons unrelated to ability. In the fulfilment of that goal, the Act seeks to correct the conditions of disadvantage in employment experienced by women, Aboriginal peoples, persons with disabilities and members of visible minorities.
The Act gives effect to the principle that employment equity means more than treating persons in the same way but also requires special measures and the accommodation of differences.
Under the Employment Equity Act (the Act), the Minister responsible for Labour is mandated to submit an annual report to Parliament on the status of employment equity in the federally regulated private sectorFootnote 1. This document consolidates and highlights the statistical results achieved by employers subject to the Legislated Employment Equity ProgramFootnote 2 during the 2017 calendar year for the four designated groups: women, Aboriginal peoples, persons with disabilities and members of visible minorities. While qualitative data from employers is not consolidated in this report, it is used in program and policy development to support employers in achieving employment equity.
Data from 2016 is included throughout the report to allow for year-to-year comparisons.
Federally regulated private sectors
Employers are organized by sector, based on the classification of the majority of their workforce using the North American Industry Classification System (NAICS). The federally regulated private-sector workforce comprises four sectors:
- Banking and financial services: Includes all major Canadian banks and other establishments primarily engaged in financial transactions or in facilitating transactions.
- Communications: Comprises businesses that operate radio and television broadcasting studios and facilities, as well as telecommunications services providers.
- Transportation: Consists of employers in the air, rail, bus, water and pipeline transportation industries; inter-provincial trucking; postal service; couriers; as well as warehousing and storage.
- ‘Other’: Encompasses a diverse group of employers working in industries such as nuclear power generation; metal ore mining; professional, scientific and technical services; investigation and security services; construction; food and wood manufacturing; wholesale trade; arts, entertainment and recreation; and public administration.
About the data
Employment equity encourages the establishment of working conditions that are free of barriers, corrects the conditions of disadvantage in employment and promotes the principle that equality requires special measures and the accommodation of differences.
The most common quantitative measure of employment equity is the extent to which the representation of members of designated groups in the employers’ workforce meets their representation in the Canadian workforce. The representation of each of the four designated groups is compared to their availability in the Canadian labour market—referred to as labour market availability (LMA). A workforce is considered fully representative when the representation of designated group members is equal to their LMA.
The extent to which the representation of a particular designated group approaches, meets or surpasses LMA is referred to as the attainment rate of LMA. This indicator allows for the identification of gaps between the representation of a particular designated group and its LMA. For example, if a designated group’s representation is below the LMA, the attainment rate of LMA will be less than 100% and further analysis may be required to understand if barriers to employment exist and where appropriate measures would need to be implemented.
Progress has been made when the gap between a designated group’s representation and LMA narrows (in other words the attainment rate approaches 100%) or when a group’s representation equals or exceeds LMA (in other words the attainment rate equals or surpasses 100%).
Other quantitative indicators of equality include salary ranges, as well as shares of hires, promotions and terminations. This report provides details on each of these indicators for the four designated groups.
The current LMA data for women, Aboriginal peoples and members of visible minorities is obtained from Statistics Canada’s 2011 National Household Survey. Data for persons with disabilities is obtained from the 2012 Canadian survey on disability, also conducted by Statistics Canada. Additional information regarding data used for employment equity purposes can be found in Appendix B.
Representation is the share of designated groups in a given labour force (for example the entire federally regulated private-sector workforce, the banking and financial services sector or an individual bank).
Labour market availability refers to the share of designated group members in the workforce from which the employers could hire.
Attainment rate of labour market availability refers to the extent to which representation approaches, meets or exceeds labour market availability by dividing the representation rate by the LMA rate.
Section 1 – The federally regulated private sector
Overview
For the 2017 calendar year, 561 employers submitted a report to the Minister responsible for Labour. Together, these employers had a total of 740,420 employees across Canada, which represents approximately 3.8%Footnote 3 of the Canadian workforce. Of these submissions, 99 were from employers that reported for the first time and were only required to include statistical reports by gender (in other words no data was required to be included on Aboriginal peoples, persons with disabilities and members of visible minorities), comprising 20,123 employees.
Table 1A provides the data submitted from the 462 employers with a total of 720,297 employees that did not report for the first time. It excludes the 99 employers that reported for the first time, since they were not required to submit complete statistics on all four designated groups. It indicates that the representation of women decreased, while that of Aboriginal peoples and of persons with disabilities remained the same between 2016 and 2017. Members of visible minorities made progress, increasing their overall representation by 0.7 of a percentage point. This designated group was the only one whose representation continued to surpass Canadian LMA, with an overall attainment rate of LMA increasing from 124.7% in 2016 to 128.2% in 2017.
| Federally regulated private sector (Overall) | 462 employers in 2017 | |||
|---|---|---|---|---|
| Women | Aboriginal peoples | Persons with disabilities | Members of visible minorities | |
| 2016 Representation | 40.7 | 2.3 | 3.3 | 22.2 |
| 2017 Representation | 40.2 | 2.3 | 3.3 | 22.8 |
| Change in representation** | -0.6 | 0.0 | 0.0 | +0.7 |
| 2016 Attainment rate of Canadian LMA | 84.4 | 65.7 | 67.3 | 124.7 |
| 2017 Attainment rate of Canadian LMA | 83.3 | 66.1 | 67.6 | 128.2 |
| Canadian LMA | 48.2 | 3.5 | 4.9 | 17.8 |
Sources:
* Statistics Canada, 2011 National Household Survey and 2012 Canadian survey on disability.
** Change values may not equal the differences between the representation rates due to rounding.
Table 1B shows the results from all 561 employers that submitted reports this year, including the 99 employers that reported for the first time and were only required to submit statistical reports by gender. Based on the overall submitted data, the representation of women decreased by 0.9 of a percentage point with an attainment rate of Canadian LMA decreasing from 84.4% in 2016 to 82.5% in 2017. Table 1B: Representation and attainment rate of Canadian LMA* of women in the federally regulated private sector, 2016 and 2017 (%)
| Federally regulated private sector (Overall) | 561 employers in 2017 |
|---|---|
| Women | |
| 2016 Representation | 40.7 |
| 2017 Representation | 39.8 |
| Change in representation** | -0.9 |
| 2016 Attainment rate of Canadian LMA | 84.4 |
| 2017 Attainment rate of Canadian LMA | 82.5 |
| Canadian LMA | 48.2 |
Sources:
* Statistics Canada, 2011 National Household Survey and 2012 Canadian survey on disability.
** Change values may not equal the differences between the representation rates due to rounding.
From this point forward, this annual report will only include information on the 462 employers that did not report for the first time (in other words exclude the 99 employers who reported for the first time). Next year, these new employers will be expected to submit their workforce data on all four designated groups and their results will be included in the 2019 annual report.
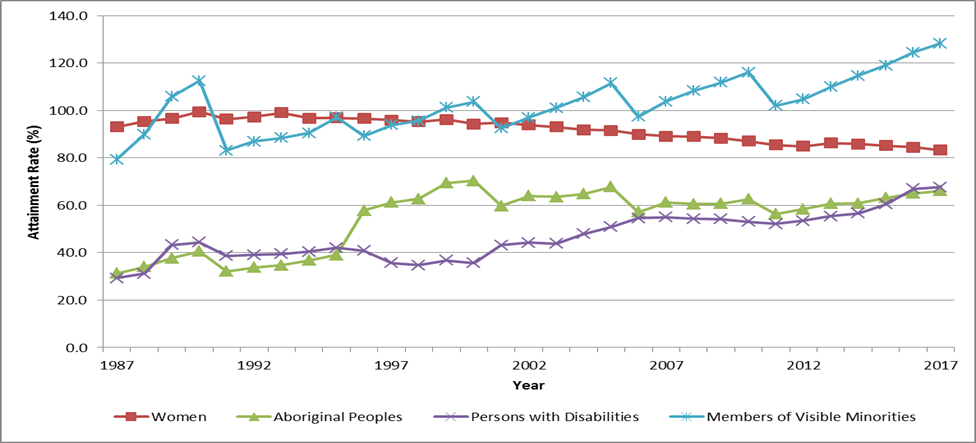
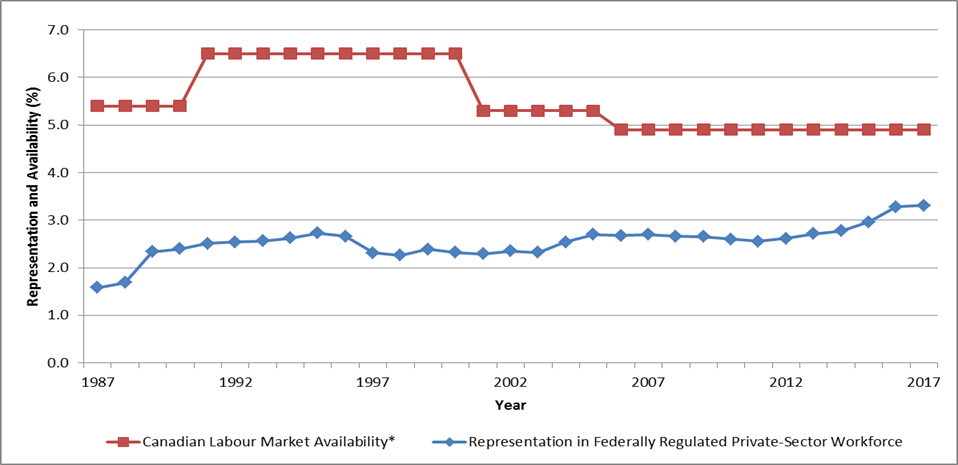
Chart 1 provides an overview of the extent to which representation approaches, meets or exceeds LMA for the four designated groups covered by the Act. The chart shows that Aboriginal peoples and persons with disabilities have made progress towards LMA since 1987, when employers started reporting under the Act, and members of visible minorities have surpassed LMA since 2007.
The attainment rate of Canadian LMA for women has been declining since reaching its highest attainment rate in 1990 (99.4%), and 2017 marked the lowest attainment rate of Canadian LMA (83.3%) for women. The attainment rate of Canadian LMA for Aboriginal peoples has been stable since 1997 and remains the lowest of all four designated groups in the past two years reaching 66.1% in 2017. The attainment rate of Canadian LMA for persons with disabilities has more than doubled since 1987, but only reached 67.6% in 2017. The only group whose representation has continued to surpass LMA is members of visible minorities, making additional progress from 2016 (124.7%) to 2017 (128.2%).
Source: * Statistics Canada, 1986 to 2006 Census; 1986 and 1991 Health and Activity Limitation Survey; 2001 andp 2006 Participation and Activity Limitation Survey; 2011 National Household Survey; and 2012 Canadian survey on disability.
Show data table
| Year | Women | Aboriginal peoples | Persons with disabilities | Members of visible minorities |
|---|---|---|---|---|
| 1987 | 93.0 | 31.4 | 29.4 | 79.3 |
| 1988 | 95.3 | 34.0 | 31.2 | 90.0 |
| 1989 | 96.6 | 37.7 | 43.3 | 105.9 |
| 1990 | 99.4 | 40.6 | 44.3 | 112.5 |
| 1991 | 96.3 | 32.1 | 38.6 | 83.1 |
| 1992 | 97.3 | 33.7 | 39.1 | 86.9 |
| 1993 | 99.1 | 34.8 | 39.5 | 88.5 |
| 1994 | 96.7 | 36.7 | 40.4 | 90.4 |
| 1995 | 96.9 | 39.1 | 42.0 | 97.1 |
| 1996 | 96.6 | 57.9 | 40.9 | 89.3 |
| 1997 | 96.0 | 61.3 | 35.6 | 93.9 |
| 1998 | 95.2 | 62.7 | 34.8 | 95.7 |
| 1999 | 96.1 | 69.4 | 36.8 | 101.2 |
| 2000 | 94.3 | 70.3 | 35.7 | 103.6 |
| 2001 | 94.8 | 59.8 | 43.2 | 92.6 |
| 2002 | 93.9 | 63.9 | 44.3 | 97.0 |
| 2003 | 93.0 | 63.6 | 43.8 | 101.0 |
| 2004 | 91.8 | 64.7 | 48.0 | 105.5 |
| 2005 | 91.5 | 67.8 | 50.9 | 111.6 |
| 2006 | 89.9 | 57.1 | 54.5 | 97.5 |
| 2007 | 89.2 | 61.2 | 55.0 | 103.8 |
| 2008 | 88.9 | 60.5 | 54.3 | 108.3 |
| 2009 | 88.2 | 60.8 | 54.2 | 111.9 |
| 2010 | 87.0 | 62.7 | 53.1 | 116.1 |
| 2011 | 85.5 | 56.4 | 52.2 | 102.1 |
| 2012 | 84.9 | 58.4 | 53.5 | 104.7 |
| 2013 | 86.2 | 60.7 | 55.4 | 110.0 |
| 2014 | 85.8 | 60.9 | 56.6 | 114.7 |
| 2015 | 85.1 | 63.1 | 60.4 | 119.0 |
| 2016 | 84.5 | 65.1 | 67.0 | 124.4 |
| 2017 | 83.3 | 66.1 | 67.6 | 128.2 |
Note: In 1996, the Census methodology for calculating LMA of Aboriginal peoples changed, causing a drop in LMA. In 2001, Statistics Canada began using the World Health Organization’s International Classification of Functioning, Disability and Health framework to define disability rather than the 1980 International Classification of Impairments, Disabilities, and Handicaps; this resulted in a drop in LMA for persons with disabilities.
Table 2 shows that women in permanent full-time positions in the federally regulated private sector were more likely to make salaries below $50,000 than men or any other groups of employees whether or not they belonged to any of the other three designated groups.
| Salary Range | Women | Men | Aboriginal peoples | Non-aboriginal peoples |
|---|---|---|---|---|
| Cumulative* | Cumulative* | Cumulative* | Cumulative* | |
| Under $15,000 | 0.3 | 0.5 | 0.8 | 0.4 |
| $15,000 - $19,999 | 0.4 | 0.6 | 1.2 | 0.5 |
| $20,000 - $24,999 | 1.0 | 1.0 | 1.9 | 1.0 |
| $25,000 - $29,999 | 3.3 | 2.2 | 4.2 | 2.6 |
| $30,000 - $34,999 | 7.4 | 4.5 | 8.3 | 5.5 |
| $35,000 - $39,999 | 14.2 | 8.5 | 14.1 | 10.6 |
| $40,000 - $44,999 | 23.0 | 14.4 | 20.7 | 17.6 |
| $45,000 - $49,999 | 32.0 | 20.4 | 27.6 | 24.7 |
| $50,000 - $59,999 | 51.0 | 35.3 | 44.5 | 41.2 |
| $60,000 - $69,999 | 64.7 | 50.1 | 59.2 | 55.6 |
| $70,000 - $84,999 | 77.2 | 66.1 | 74.1 | 70.2 |
| $85,000 - $99,999 | 85.6 | 76.5 | 83.4 | 79.9 |
| $100,000 and over | 100.0 | 100.0 | 100.0 | 100.0 |
| Salary range | Persons with disabilities | Persons without disabilities | Members of visible minorities | Non-visible minority members |
|---|---|---|---|---|
| Cumulative* | Cumulative* | Cumulative* | Cumulative* | |
| Under $15,000 | 0.2 | 0.4 | 0.3 | 0.4 |
| $15,000 - $19,999 | 0.4 | 0.5 | 0.4 | 0.6 |
| $20,000 - $24,999 | 0.8 | 1.0 | 0.8 | 1.1 |
| $25,000 - $29,999 | 2.2 | 2.6 | 2.7 | 2.6 |
| $30,000 - $34,999 | 5.9 | 5.5 | 6.1 | 5.4 |
| $35,000 - $39,999 | 12.4 | 10.6 | 12.0 | 10.3 |
| $40,000 - $44,999 | 20.1 | 17.6 | 20.0 | 16.9 |
| $45,000 - $49,999 | 27.6 | 24.7 | 28.0 | 23.8 |
| $50,000 - $59,999 | 45.8 | 41.1 | 44.4 | 40.3 |
| $60,000 - $69,999 | 59.7 | 55.5 | 57.9 | 55.0 |
| $70,000 - $84,999 | 74.5 | 70.1 | 72.1 | 69.7 |
| $85,000 - $99,999 | 83.5 | 79.8 | 82.2 | 79.3 |
| $100,000 and over | 100.0 | 100.0 | 100.0 | 100.0 |
Source: * Each figure in the Cumulative % columns represents the cumulative total percentage of each designated group in the identified salary range or lower.
Federally regulated private sectors
This section provides an analysis of the composition of the federally regulated private sector by each of the sectors that comprise it.
Table 3 shows that overall, the number of employers decreased by -3.1% and the number of employees remained stable between 2016 and 2017. The banking and financial services sector continued to account for less than 10% of employers in the federally regulated private sector but employed about a third of all federally regulated private-sector employees. Communications was the third largest sector, comprising 11.3% of employers and 18.4% of employees in the federally regulated private sector. While the transportation sector continued to have the largest number of employers and of employees, with a majority of this workforce operating in the ground transportation subsector, the air transportation subsector experienced the highest increase in the number of employees (+3.9%). The ‘other’ sector saw a decrease in the number of employers and of employees by -1.6% and -0.9% respectively, but there was an increase in the number of employees (+2.0%) in the service industries subsector.
| Sectors | Employers* | Employees | ||||||||
|---|---|---|---|---|---|---|---|---|---|---|
| 2016 | 2017 | Change (%) | 2016 | 2017 | Change (%) | |||||
| # | % | # | % | # | % | # | % | |||
| Banking and financial Services | 36 | 7.5 | 36 | 7.8 | 0.0 | 237,225 | 32.9 | 237,016 | 32.9 | -0.1 |
| Communications | 53 | 11.1 | 52 | 11.3 | -1.9 | 133,492 | 18.5 | 132,890 | 18.4 | -0.5 |
| Transportation | 326 | 68.3 | 313 | 67.7 | -4.0 | 293,113 | 40.7 | 294,612 | 40.9 | +0.5 |
| Air transportation | 84 | 25.8 | 84 | 26.8 | 0.0 | 83,751 | 28.6 | 86,987 | 29.5 | +3.9 |
| Ground transportation | 207 | 63.5 | 194 | 62.0 | -6.3 | 191,601 | 65.4 | 190,024 | 64.5 | -0.8 |
| Water transportation | 35 | 10.7 | 35 | 11.2 | 0.0 | 17,761 | 6.1 | 17,601 | 6.0 | -0.9 |
| 'Other' | 62 | 13.0 | 61 | 13.2 | -1.6 | 56,262 | 7.8 | 55,779 | 7.7 | -0.9 |
| Production industries | 28 | 45.2 | 27 | 44.3 | -3.6 | 30,229 | 53.7 | 29,237 | 52.4 | -3.3 |
| Service industries | 34 | 54.8 | 34 | 55.7 | 0.0 | 26,033 | 46.3 | 26,542 | 47.6 | +2.0 |
| All sectors | 477 | 462 | -3.1 | 720,092 | 720,297 | 0.0 | ||||
Source: * The number of employers in the federally regulated private sector can change from year to year as a result of mergers, acquisitions, closures, start-ups or organizations fluctuating above or below the 100-employee threshold.
Table 4A shows that in the banking and financial services sector between 2016 and 2017, the representation of women decreased and the representation of members of visible minorities increased, but both designated groups’ representation continued to surpass Canadian LMA. The representation of Aboriginal peoples decreased to 1.2% and remained below the Canadian LMA (3.5%). The representation of persons with disabilities and of members of visible minorities both continued to surpass sector LMA, with an attainment rate above 100%.
| Banking and financial services sector | Women | Aboriginal peoples | Persons with disabilities | Members of visible minorities |
|---|---|---|---|---|
| 2016 representation | 58.8 | 1.3 | 4.5 | 31.3 |
| 2017 representation | 57.7 | 1.2 | 4.5 | 31.6 |
| Change in representation** | -1.1 | 0.0 | 0.0 | +0.3 |
| 2016 Attainment rate of sector LMA | 95.0 | 81.3 | 136.4 | 118.1 |
| 2017 Attainment rate of sector LMA | 93.2 | 76.4 | 136.2 | 119.1 |
| Banking and financial services sector LMA | 61.9 | 1.6 | 3.3 | 26.5 |
| 2016 Attainment rate of Canadian LMA | 122.0 | 37.1 | 91.8 | 175.8 |
| 2017 Attainment rate of Canadian LMA | 119.7 | 34.9 | 91.7 | 177.3 |
| Canadian LMA | 48.2 | 3.5 | 4.9 | 17.8 |
Sources:
* Statistics Canada, 2011 National Household Survey and 2012 Canadian survey on disability.
** Change values may not equal the differences between the representation rates due to rounding.
Table 4B indicates that in the communications sector between 2016 and 2017, the representation of members of visible minorities continued to surpass both the Canadian and the sector LMA, with an attainment rate above 100%. Overall, the representation of the other three designated groups remained stable and was below both Canadian and sector LMA in 2017.
| Communications sector | Women | Aboriginal peoples | Persons with disabilities | Members of visible minorities |
|---|---|---|---|---|
| 2016 representation | 35.7 | 2.3 | 3.4 | 22.6 |
| 2017 representation | 35.2 | 2.2 | 3.5 | 23.2 |
| Change in representation ** | -0.5 | 0.0 | +0.1 | +0.5 |
| 2016 attainment rate of sector LMA | 79.3 | 100.0 | 66.7 | 163.8 |
| 2017 attainment rate of sector LMA | 78.2 | 96.2 | 69.1 | 167.8 |
| Communications sector LMA | 45.0 | 2.3 | 5.1 | 13.8 |
| 2016 attainment rate of Canadian LMA | 74.1 | 65.7 | 69.4 | 127.0 |
| 2017 attainment rate of Canadian LMA | 73.0 | 63.2 | 71.9 | 130.1 |
| Canadian LMA | 48.2 | 3.5 | 4.9 | 17.8 |
Sources:
* Statistics Canada, 2011 National Household Survey and 2012 Canadian survey on disability.
** Change values may not equal the differences between the representation rates due to rounding.
Table 4C indicates that in the transportation sector, representation remained stable from 2016 to 2017. While none of the designated groups reached or surpassed Canadian LMA, the representation of women continued to exceed sector LMA with an attainment rate of over 100%. The representation of persons with disabilities remained low in 2017 compared to both sector and Canadian LMA.
| Transportation sector | Women | Aboriginal peoples | Persons with disabilities | Members of visible minorities |
|---|---|---|---|---|
| 2016 representation | 30.7 | 2.8 | 2.5 | 16.0 |
| 2017 representation | 30.4 | 2.9 | 2.5 | 17.0 |
| Change in representation ** | -0.3 | +0.2 | 0.0 | +1.0 |
| 2016 attainment rate of transportation sector LMA | 119.5 | 84.8 | 42.4 | 82.1 |
| 2017 attainment rate of transportation sector LMA | 118.2 | 88.3 | 42.2 | 87.4 |
| Transportation sector LMA | 25.7 | 3.3 | 5.9 | 19.5 |
| 2016 attainment rate of Canadian LMA | 63.7 | 80.0 | 51.0 | 89.9 |
| 2017 attainment rate of Canadian LMA | 63.0 | 83.3 | 50.8 | 95.7 |
| Canadian LMA | 48.2 | 3.5 | 4.9 | 17.8 |
Sources:
* Statistics Canada, 2011 National Household Survey and 2012 Canadian survey on disability.
** Change values may not equal the differences between the representation rates due to rounding.
Table 4D indicates that the representation of women increased in the air and the water transportation subsectors but decreased in the ground transportation subsector. Women’s representation continued to surpass the transportation sector LMA in the air and the ground transportation subsectors but remained below the transportation sector LMA in the water transportation subsector. The representation of Aboriginal peoples continued to surpass the transportation sector LMA in the water transportation subsector. The representation of persons with disabilities remained well below LMA across all subsectors, with the highest level of attainment reaching 48.8% in the ground transportation subsector in 2017. The representation of members of visible minorities remained below the transportation sector LMA across the three subsectors but remained closest to full LMA attainment in the air transportation subsector.
| Transportation Subsectors | Women | Aboriginal peoples | Persons with disabilities | Members of visible minorities |
|---|---|---|---|---|
| Air transportation subsector | ||||
| 2016 representation | 38.0 | 2.9 | 1.8 | 17.9 |
| 2017 representation | 38.6 | 2.9 | 1.6 | 18.9 |
| Change in representation ** | +0.6 | +0.1 | -0.2 | +1.0 |
| 2016 attainment rate of transportation sector LMA | 147.9 | 87.9 | 30.5 | 91.8 |
| 2017 attainment rate of transportation sector LMA | 150.2 | 88.8 | 27.7 | 97.0 |
| Ground transportation subsector | ||||
| 2016 representation | 28.9 | 2.6 | 2.7 | 15.4 |
| 2017 representation | 27.9 | 2.8 | 2.9 | 16.4 |
| Change in representation ** | -0.9 | +0.2 | +0.2 | +1.0 |
| 2016 attainment rate of transportation sector LMA | 112.5 | 78.8 | 45.8 | 79.0 |
| 2017 attainment rate of transportation sector LMA | 108.7 | 83.8 | 48.8 | 84.3 |
| Water transportation subsector | ||||
| 2016 representation | 15.7 | 3.9 | 2.6 | 13.8 |
| 2017 representation | 16.0 | 4.5 | 2.5 | 14.2 |
| Change in representation ** | +0.3 | +0.5 | -0.1 | +0.4 |
| 2016 attainment rate of transportation sector LMA | 61.1 | 118.2 | 44.1 | 70.8 |
| 2017 attainment rate of transportation sector LMA | 62.3 | 135.2 | 42.4 | 72.9 |
| Transportation sector LMA | 25.7 | 3.3 | 5.9 | 19.5 |
Sources:
* Statistics Canada, 2011 National Household Survey and 2012 Canadian survey on disability.
** Change values may not equal the differences between the representation rates due to rounding.
Table 4E shows that in the ‘other’ sector, the representation of Aboriginal peoples decreased (-0.1%) but remained above Canadian LMA, the only designated group for whom this is the case, with an attainment rate of 114.9% in 2017. When compared to sector LMA, the representation of members of visible minorities continued to exceed the LMA in 2017, with an attainment rate of 111.7%.
| 'Other' sector | Women | Aboriginal peoples | Persons with disabilities | Members of visible minorities |
|---|---|---|---|---|
| 2016 representation | 28.9 | 4.1 | 2.1 | 14.4 |
| 2017 representation | 29.3 | 4.0 | 2.1 | 15.4 |
| Change in representation ** | +0.5 | -0.1 | 0.0 | +1.0 |
| 2016 attainment rate of 'Other' sector LMA | 81.9 | 95.3 | 55.3 | 104.3 |
| 2017 attainment rate of 'Other' sector LMA | 83.1 | 93.6 | 56.5 | 111.7 |
| 'Other' sector LMA | 35.3 | 4.3 | 3.8 | 13.8 |
| 2016 attainment rate of Canadian LMA | 60.0 | 117.1 | 42.9 | 80.9 |
| 2017 attainment rate of Canadian LMA | 60.9 | 114.9 | 43.8 | 86.6 |
| Canadian LMA | 48.2 | 3.5 | 4.9 | 17.8 |
Sources:
* Statistics Canada, 2011 National Household Survey and 2012 Canadian survey on disability.
** Change values may not equal the differences between the representation rates due to rounding.
Table 4F shows that the representation of women and members of visible minorities continued to exceed the sector LMA in the service industries subsector. The representation of Aboriginal peoples also continued to surpass the sector LMA in the production industries subsector. The attainment rate of sector LMA was the lowest for persons with disabilities across both subsectors of the ‘other’ sector in 2016 and 2017.
| 'Other' sector subsectors | Women | Aboriginal peoples | Persons with disabilities | Members of visible minorities |
|---|---|---|---|---|
| Production industries | ||||
| 2016 representation | 23.1 | 5.3 | 2.3 | 11.6 |
| 2017 representation | 22.9 | 5.2 | 2.4 | 12.2 |
| Change in representation ** | -0.3 | -0.1 | +0.1 | +0.6 |
| 2016 attainment rate of 'Other' sector LMA | 65.4 | 123.3 | 60.5 | 84.1 |
| 2017 attainment rate of 'Other' sector LMA | 64.8 | 120.9 | 64.2 | 88.4 |
| Service industries | ||||
| 2016 representation | 35.6 | 2.8 | 1.9 | 17.7 |
| 2017 representation | 36.5 | 2.7 | 1.8 | 18.9 |
| Change in representation ** | +0.9 | -0.1 | -0.1 | +1.2 |
| 2016 attainment rate of 'Other' sector LMA | 100.8 | 65.1 | 50.0 | 128.3 |
| 2017 attainment rate of 'Other' sector LMA | 103.3 | 63.4 | 48.1 | 137.3 |
| 'Other' sector LMA | 35.3 | 4.3 | 3.8 | 13.8 |
Sources:
* Statistics Canada, 2011 National Household Survey and 2012 Canadian survey on disability.
** Change values may not equal the differences between the representation rates due to rounding. Additional data on the representation, hires, promotions and terminations of employees by designated group and sector is provided in Appendix A.
Section 2 – Designated groups profiles
Women
The representation of women in the federally regulated private sector decreased from 40.7% in 2016 to 40.2% in 2017. In the banking and financial services sector and the communications sector, where the majority of women were employed (63.4%) in 2017, more women continued to leave than enter the workforce. Since 2013, this trend has affected and led to the decline in the representation of women at the overall level.
The decrease in representation of women in the federally regulated private sector follows a similar downward trend in the overall representation of employed women in Canada. Based on Statistics Canada’s Labour force characteristics from 2016 to 2017, the representation of women aged 15 years and over who were employed across the country remained at 47.7%, but decreased in certain industries which might fall under federal jurisdiction such as wholesale trade; transportation and warehousing; finance and insurance; and mining, quarrying and oil and gas extractionFootnote 4.
Progress was observed for women in some areas in the federally regulated private sector. For instance, the representation of women in the Senior managers occupational group increased between 2016 and 2017, almost reaching full representation with an attainment rate of 99.6%. During the same time period, although the representation of women in the Middle and other managers occupational group decreased, it continued to surpass LMA at a 107.8% attainment rate.
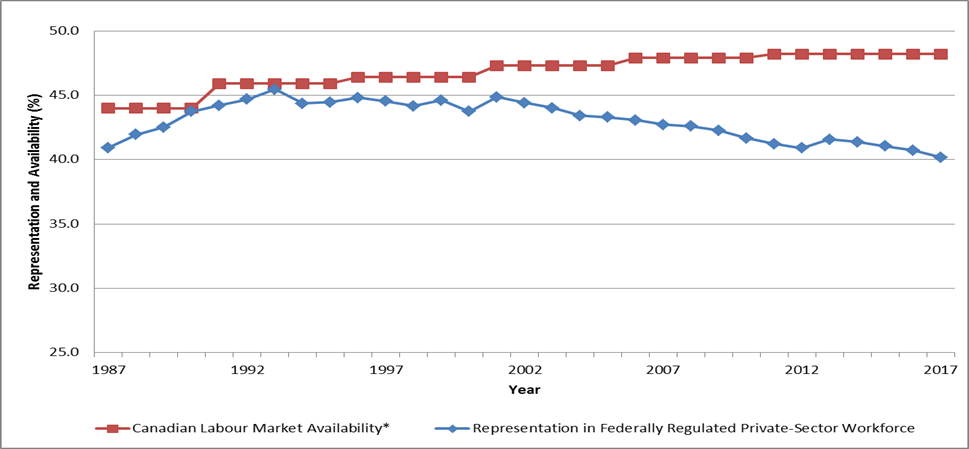
Chart 2 shows that since 1987, the representation of women increased and peaked in 1993; however, it has been on a mostly downward trend since the early 2000s. The representation of women in 2017 (40.2%) was 0.7 of a percentage point below what it was in 1987 (40.9%).
Source: * Statistics Canada, 1986 to 2006 Census and 2011 National Household Survey.
Show data table
| Year | All employees | Women | ||
|---|---|---|---|---|
| Total | Representation | Availability | ||
| # | % | % | ||
| 1987 | 595,417 | 243,744 | 40.9 | 44.0 |
| 1988 | 613,688 | 257,417 | 41.9 | 44.0 |
| 1989 | 631,015 | 268,340 | 42.5 | 44.0 |
| 1990 | 631,423 | 276,161 | 43.7 | 44.0 |
| 1991 | 615,135 | 271,927 | 44.2 | 45.9 |
| 1992 | 602,265 | 269,089 | 44.7 | 45.9 |
| 1993 | 582,363 | 264,804 | 45.5 | 45.9 |
| 1994 | 599,311 | 265,950 | 44.4 | 45.9 |
| 1995 | 588,047 | 261,437 | 44.5 | 45.9 |
| 1996 | 571,883 | 256,250 | 44.8 | 46.4 |
| 1997 | 571,138 | 254,325 | 44.5 | 46.4 |
| 1998 | 589,218 | 260,204 | 44.2 | 46.4 |
| 1999 | 588,759 | 262,629 | 44.6 | 46.4 |
| 2000 | 600,220 | 262,602 | 43.8 | 46.4 |
| 2001 | 634,759 | 284,720 | 44.9 | 47.3 |
| 2002 | 629,916 | 279,817 | 44.4 | 47.3 |
| 2003 | 621,457 | 273,496 | 44.0 | 47.3 |
| 2004 | 651,048 | 282,747 | 43.4 | 47.3 |
| 2005 | 672,652 | 291,198 | 43.3 | 47.3 |
| 2006 | 698,210 | 300,747 | 43.1 | 47.9 |
| 2007 | 733,789 | 313,385 | 42.7 | 47.9 |
| 2008 | 744,011 | 316,937 | 42.6 | 47.9 |
| 2009 | 743,837 | 314,430 | 42.3 | 47.9 |
| 2010 | 755,966 | 315,109 | 41.7 | 47.9 |
| 2011 | 768,547 | 316,755 | 41.2 | 48.2 |
| 2012 | 772,480 | 315,930 | 40.9 | 48.2 |
| 2013 | 738,053 | 306,763 | 41.6 | 48.2 |
| 2014 | 740,740 | 306,397 | 41.4 | 48.2 |
| 2015 | 730,485 | 299,789 | 41.0 | 48.2 |
| 2016 | 720,092 | 293,262 | 40.7 | 48.2 |
| 2017 | 720,297 | 289,327 | 40,2 | 48,2 |
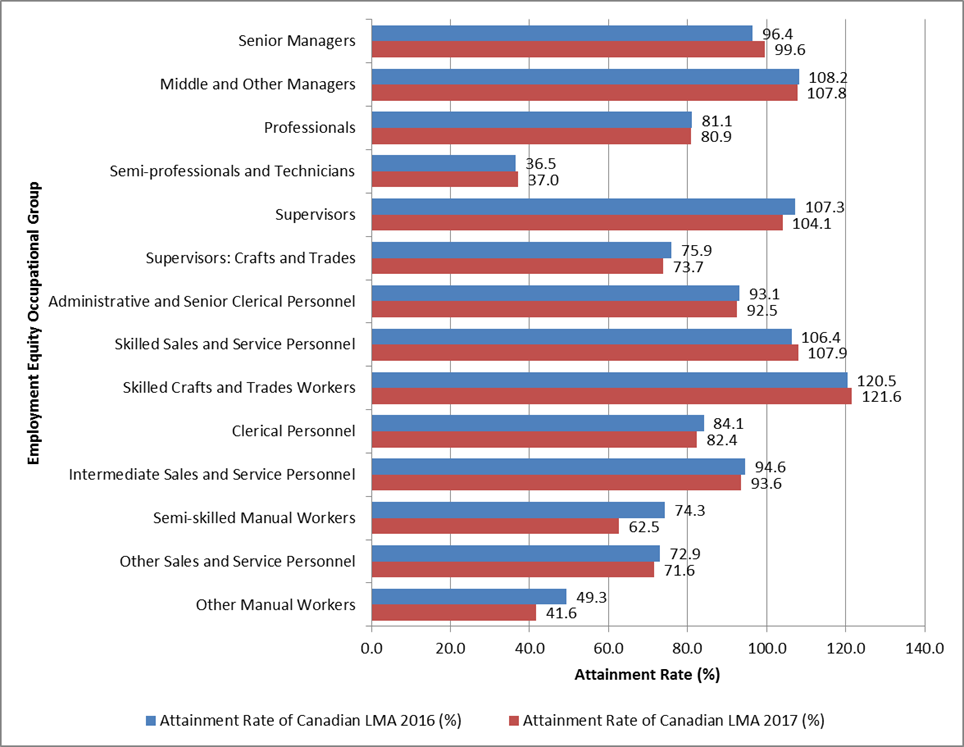
Chart 3 illustrates that the attainment rate of Canadian LMA of women is particularly low for the following two occupational groups: Semi-professionals and technicians and other manual workers. However, the LMA attainment rates of women in management categories approached or exceeded the overall Canadian LMA (Senior managers, middle and other managers and Supervisors). Of all occupational groups, the attainment rate is highest for women in the Skilled crafts and trades workers group.
Source: * Statistics Canada, 2011 National Household Survey.
Show data table
| Occupational group | Women | |||||
|---|---|---|---|---|---|---|
| Representation | Availability* | Change | Attainment rate of Canadian LMA | |||
| 2016 | 2017 | 2011 | 2016 | 2017 | ||
| Senior managers | 26.4 | 27.3 | 27.4 | 0.9 | 96.4 | 99.6 |
| Middle and other managers | 42.1 | 42.0 | 38.9 | -0.1 | 108.2 | 107.8 |
| Professionals | 44.6 | 44.5 | 55.0 | -0.1 | 81.1 | 80.9 |
| Semi-professionals and technicians | 19.0 | 19.2 | 52.0 | 0.2 | 36.5 | 37.0 |
| Supervisors | 60.6 | 58.8 | 56.5 | -1.7 | 107.3 | 104.1 |
| Supervisors: crafts and trades | 8.5 | 8.3 | 11.2 | -0.2 | 75.9 | 73.7 |
| Administrative and senior clerical personnel | 76.9 | 76.4 | 82.6 | -0.5 | 93.1 | 92.5 |
| Skilled sales and service personnel | 53.1 | 53.9 | 49.9 | 0.8 | 106.4 | 107.9 |
| Skilled crafts and trades workers | 4.7 | 4.7 | 3.9 | 0.1 | 120.5 | 121.6 |
| Clerical personnel | 57.5 | 56.4 | 68.4 | -1.2 | 84.1 | 82.4 |
| Intermediate sales and service personnel | 63.2 | 62.5 | 66.8 | -0.6 | 94.6 | 93.6 |
| Semi-skilled manual workers | 13.3 | 11.2 | 17.9 | -2.1 | 74.3 | 62.5 |
| Other sales and service personnel | 41.9 | 41.1 | 57.5 | -0.8 | 72.9 | 71.6 |
| Other manual workers | 11.2 | 9.5 | 22.7 | -1.8 | 49.3 | 41.6 |
| Total | 26.4 | 27.3 | 27.4 | 0.9 | 96.4 | 99.6 |
Table 5 provides a more in-depth analysis of women’s occupational group representation as compared to their respective sector LMA. The representation of women in the Senior managers occupational group continued to surpass sector occupational LMA in all four sectors, the only occupational group for which this is the case.
| Occupational group | Banking and financial services | Communications | ||||
|---|---|---|---|---|---|---|
| Attainment rate of sector LMA | Change ** | Attainment rate of sector LMA | Change ** | |||
| 2016 | 2017 | 2016 | 2017 | |||
| Senior managers | 113.3 | 117.1 | +3.8 | 110.2 | 108.5 | -1.7 |
| Middle and other managers | 89.7 | 88.8 | -0.9 | 92.1 | 92.1 | 0.0 |
| Professionals | 107.1 | 106.2 | -0.9 | 85.6 | 85.6 | 0.0 |
| Semi-professionals and technicians | 88.2 | 92.5 | +4.3 | 82.8 | 84.0 | +1.2 |
| Supervisors | 96.3 | 93.6 | -2.7 | 75.0 | 72.5 | -2.6 |
| Supervisors: crafts and trades | 41.7 | 123.3 | +81.6 | 54.7 | 52.2 | -2.5 |
| Administrative and senior clerical personnel | 99.7 | 99.6 | -0.1 | 99.5 | 98.3 | -1.2 |
| Skilled sales and service personnel | 97.8 | 97.4 | -0.4 | 82.1 | 81.3 | -0.8 |
| Skilled crafts and trades workers | 91.7 | 84.9 | -6.8 | 65.9 | 63.7 | -2.2 |
| Clerical personnel | 86.9 | 87.6 | +0.7 | 87.4 | 86.2 | -1.2 |
| Intermediate sales and service personnel | 96.4 | 94.4 | -2.0 | 87.0 | 85.3 | -1.7 |
| Semi-skilled manual workers | 106.8 | 108.7 | +1.9 | 108.4 | 107.5 | -0.9 |
| Other sales and service personnel | 42.4 | 40.7 | -1.7 | 107.2 | 112.7 | +5.5 |
| Other manual workers | 80.4 | 80.4 | 0.0 | 274.0 | 228.6 | -45.4 |
Sources:
* Statistics Canada, 2011 National Household Survey.
** Change values may not equal the differences between the attainment rates due to rounding.
| Occupational group | Transportation | 'Other' | ||||
|---|---|---|---|---|---|---|
| Attainment rate of sector LMA | Change ** | Attainment rate of sector LMA | Change ** | |||
| 2016 | 2017 | 2016 | 2017 | |||
| Senior managers | 109.9 | 117.1 | +7.2 | 105.4 | 104.9 | -0.5 |
| Middle and other managers | 106.4 | 109.3 | +2.8 | 85.5 | 89.0 | +3.6 |
| Professionals | 104.2 | 104.1 | -0.1 | 92.0 | 92.8 | +0.8 |
| Semi-professionals and technicians | 87.9 | 89.1 | +1.2 | 61.9 | 64.3 | +2.4 |
| Supervisors | 115.8 | 114.2 | -1.6 | 91.9 | 86.6 | -5.3 |
| Supervisors: crafts and trades | 77.1 | 74.1 | -3.0 | 65.7 | 68.5 | +2.8 |
| Administrative and senior clerical personnel | 91.2 | 89.9 | -1.3 | 101.2 | 101.4 | +0.2 |
| Skilled sales and service personnel | 71.6 | 72.9 | +1.3 | 31.0 | 28.7 | -2.3 |
| Skilled crafts and trades workers | 119.4 | 125.2 | +5.8 | 187.9 | 199.3 | +11.4 |
| Clerical personnel | 103.3 | 101.5 | -1.8 | 105.2 | 104.9 | -0.3 |
| Intermediate sales and service personnel | 111.9 | 112.2 | +0.3 | 74.9 | 79.7 | +4.8 |
| Semi-skilled manual workers | 115.8 | 96.7 | -19.1 | 56.4 | 56.4 | 0.0 |
| Other sales and service personnel | 128.0 | 131.3 | +3.3 | 107.4 | 94.6 | -12.8 |
| Other manual workers | 43.9 | 37.9 | -6.0 | 57.9 | 46.5 | -11.4 |
Sources:
* Statistics Canada, 2011 National Household Survey.
** Change values may not equal the differences between the attainment rates due to rounding.
Banking and financial services sector
The attainment rate of sector occupational LMA of women increased from 2016 to 2017 in the Senior managers, Semi-professionals and technicians, Supervisors: crafts and trades, Clerical personnel and Semi-skilled manual workers occupational groups. The increase for the Supervisors: crafts and trades occupational group is particularly noticeable at +81.6 percentage points, but this is a very small occupational group, as only two women of a total of 15 employees were reported for 2017. The representation of women was above sector occupational LMA in the Senior managers, Professionals, Supervisors: crafts and trades and Semi-skilled manual workers occupational groups in 2017. However, the representation of women was well below sector occupational LMA in the Other sales and service personnel, a small occupational group that consisted of 10 women and of 39 total employees for 2017.
Communications sector
The attainment rate of sector occupational LMA of women improved from 2016 to 2017 in the Semi-professionals and technicians and Other sales and service personnel occupational groups. Although the attainment rate decreased by 45.4 percentage points in the Other manual workers occupational group, this is a very small occupational group with only one woman of a total of six reported employees for 2017. The representation of women was above sector occupational LMA in the Senior managers, Semi-skilled manual workers, Other sales and service personnel and Other manual workers occupational groups in 2017. However, women in this sector have the lowest level of attainment of sector occupational LMA in the Professionals, Supervisors, Supervisors: crafts and trades, Skilled crafts and trades workers and Clerical personnel occupational groups.
Transportation sector
The attainment rate of sector occupational LMA of women increased in seven of the 14 occupational groups from 2016 to 2017. In 2017, the representation of women was also above sector occupational LMA in eight of the occupational groups, making this sector the most successful at reaching full representation for women at the occupational group level, compared to sector-specific occupational level LMA.
‘Other’ sector
Between 2016 and 2017, the attainment rate of sector occupational LMA of women increased in seven of the occupational groups. In 2017, the representation of women surpassed sector occupational LMA in the Senior managers, Administrative and senior clerical personnel, Skilled crafts and trades workers and Clerical personnel occupational groups. However, women in this sector have the lowest level of attainment of sector occupational LMA in the Senior managers, Semi-professionals and technicians, Skilled sales and service personnel, Intermediate sales and service personnel and Semi-skilled manual workers occupational groups.
Additional data on the representation, hires, promotions and terminations of employees by designated group and sector is provided in Appendix A.
Aboriginal peoples
Between 2016 and 2017, the representation of Aboriginal peoples in the federally regulated private sector remained at 2.3%. At the overall sector level and in the transportation sector, more Aboriginal employees entered the workforce than left it.
Source: * Statistics Canada, 1986 to 2006 Census and 2011 National Household Survey.
Show data table
| Year | All employees | Aboriginal peoples | ||
|---|---|---|---|---|
| Total | Representation | Availability | ||
| # | % | % | ||
| 1987 | 595,417 | 3,921 | 0.7 | 2.1 |
| 1988 | 613,688 | 4,386 | 0.7 | 2.1 |
| 1989 | 631,015 | 4,993 | 0.8 | 2.1 |
| 1990 | 631,423 | 5,387 | 0.9 | 2.1 |
| 1991 | 615,135 | 5,923 | 1.0 | 3.0 |
| 1992 | 602,265 | 6,092 | 1.0 | 3.0 |
| 1993 | 582,363 | 6,079 | 1.0 | 3.0 |
| 1994 | 599,311 | 6,600 | 1.1 | 3.0 |
| 1995 | 588,047 | 6,895 | 1.2 | 3.0 |
| 1996 | 571,883 | 6,955 | 1.2 | 2.1 |
| 1997 | 571,138 | 7,354 | 1.3 | 2.1 |
| 1998 | 589,218 | 7,764 | 1.3 | 2.1 |
| 1999 | 588,759 | 8,581 | 1.5 | 2.1 |
| 2000 | 600,220 | 8,867 | 1.5 | 2.1 |
| 2001 | 634,759 | 9,865 | 1.6 | 2.6 |
| 2002 | 629,916 | 10,468 | 1.7 | 2.6 |
| 2003 | 621,457 | 10,276 | 1.7 | 2.6 |
| 2004 | 651,048 | 10,956 | 1.7 | 2.6 |
| 2005 | 672,652 | 11,854 | 1.8 | 2.6 |
| 2006 | 698,210 | 12,364 | 1.8 | 3.1 |
| 2007 | 733,789 | 13,920 | 1.9 | 3.1 |
| 2008 | 744,011 | 13,958 | 1.9 | 3.1 |
| 2009 | 743,837 | 14,013 | 1.9 | 3.1 |
| 2010 | 755,966 | 14,686 | 1.9 | 3.1 |
| 2011 | 768,547 | 15,166 | 2.0 | 3.5 |
| 2012 | 772,480 | 15,778 | 2.0 | 3.5 |
| 2013 | 738,053 | 15,669 | 2.1 | 3.5 |
| 2014 | 740,740 | 15,786 | 2.1 | 3.5 |
| 2015 | 730,485 | 16,145 | 2.2 | 3.5 |
| 2016 | 720,092 | 16,406 | 2.3 | 3.5 |
| 2017 | 720,297 | 16,671 | 2.3 | 3.5 |
Note: In 1996, the Census methodology for calculating LMA of Aboriginal peoples changed, causing a drop in LMA
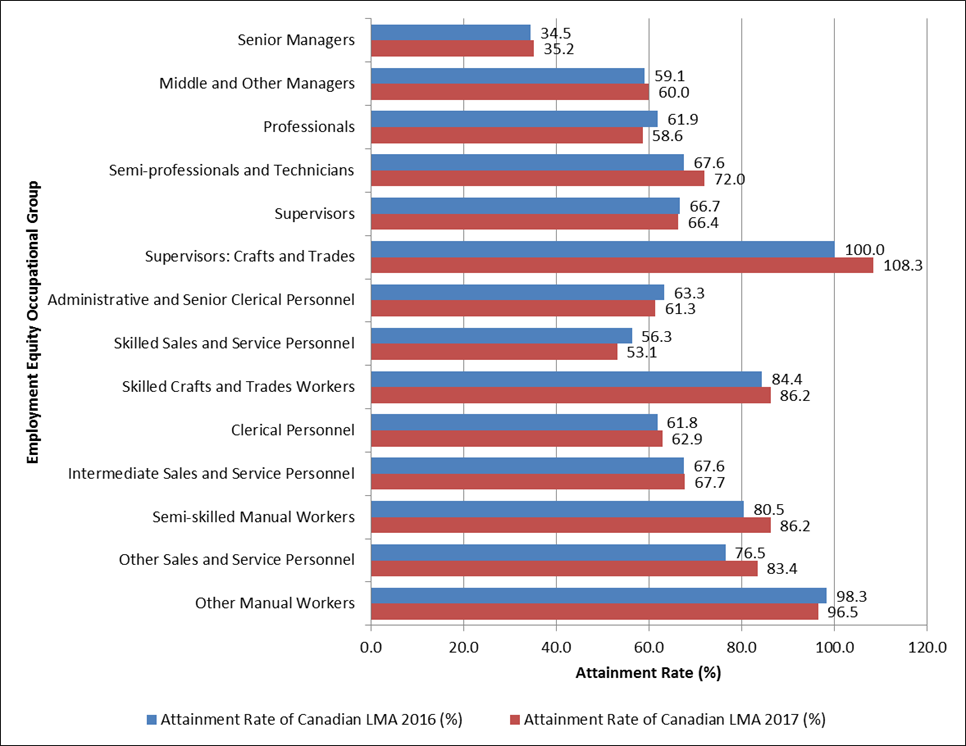
Chart 5 shows that the representation of Aboriginal peoples continued to be significantly short of reaching full representation at the Senior Managers occupational group level. Aboriginal peoples’ representation in the other supervisory and management occupations were also below Canadian LMA but to a lesser extent, with the exception of Supervisors: crafts and trades which is the only occupational group in which Aboriginal peoples continued to be fully represented.
Source: * Statistics Canada, 2011 National Household Survey.
Show data table
| Occupational group | Aboriginal peoples | |||||
|---|---|---|---|---|---|---|
| Representation | Availability* | Change | Attainment rate of Canadian LMA | |||
| 2016 | 2017 | 2011 | 2016 | 2017 | ||
| Senior managers | 1.0 | 1.0 | 2.9 | 0.1 | 34.5 | 35.2 |
| Middle and other managers | 1.3 | 1.3 | 2.2 | 0.0 | 59.1 | 60.0 |
| Professionals | 1.3 | 1.2 | 2.1 | 0.0 | 61.9 | 58.6 |
| Semi-professionals and technicians | 2.5 | 2.6 | 3.7 | 0.1 | 67.6 | 72.0 |
| Supervisors | 2.4 | 2.4 | 3.6 | 0.0 | 66.7 | 66.4 |
| Supervisors: crafts and trades | 3.7 | 4.0 | 3.7 | 0.2 | 100.0 | 108.3 |
| Administrative and senior clerical personnel | 1.9 | 1.9 | 3.0 | -0.1 | 63.3 | 61.3 |
| Skilled sales and service personnel | 1.8 | 1.7 | 3.2 | -0.1 | 56.3 | 53.1 |
| Skilled crafts and trades Workers | 3.8 | 3.9 | 4.5 | 0.1 | 84.4 | 86.2 |
| Clerical personnel | 2.1 | 2.1 | 3.4 | 0.1 | 61.8 | 62.9 |
| Intermediate sales and service personnel | 2.5 | 2.5 | 3.7 | 0.0 | 67.6 | 67.7 |
| Semi-skilled manual workers | 3.3 | 3.5 | 4.1 | 0.2 | 80.5 | 86.2 |
| Other sales and service personnel | 3.9 | 4.2 | 5.1 | 0.3 | 76.5 | 83.4 |
| Other manual workers | 5.9 | 5.8 | 6.0 | -0.1 | 98.3 | 96.5 |
| Total | 1.0 | 1.0 | 2.9 | 0.1 | 34.5 | 35.2 |
Table 6 provides a more in-depth analysis of Aboriginal peoples’ occupational group representation as compared to their respective sector LMA.
| Occupational group | Banking and financial services | Communications | ||||
|---|---|---|---|---|---|---|
| Attainment rate of sector LMA | Change ** | Attainment rate of sector LMA | Change ** | |||
| 2016 | 2017 | 2016 | 2017 | |||
| Senior managers | 87.5 | 87.5 | 0.0 | 30.0 | 26.9 | -3.1 |
| Middle and other managers | 84.6 | 86.9 | +2.3 | 106.7 | 109.6 | +2.9 |
| Professionals | 90.0 | 89.6 | -0.4 | 126.7 | 111.4 | -15.3 |
| Semi-professionals and technicians | 54.5 | 88.7 | +34.2 | 79.3 | 79.1 | -0.2 |
| Supervisors | 100.0 | 100.2 | +0.2 | 192.3 | 179.4 | -12.9 |
| Supervisors: crafts and trades | 0.0 | 0.0 | 0.0 | 61.1 | 69.8 | +8.7 |
| Administrative and senior clerical personnel | 88.2 | 76.2 | -12.0 | 79.2 | 68.6 | -10.6 |
| Skilled sales and service personnel | 121.4 | 110.0 | -11.4 | 140.0 | 118.7 | -21.3 |
| Skilled crafts and trades workers | 256.7 | 240.5 | -16.2 | 130.4 | 126.3 | -4.1 |
| Clerical personnel | 77.8 | 71.9 | -5.9 | 108.0 | 100.3 | -7.7 |
| Intermediate sales and service personnel | 79.2 | 76.6 | -2.6 | 108.7 | 108.7 | 0.0 |
| Semi-skilled manual workers | 54.5 | 56.0 | +1.5 | 325.0 | 317.6 | -7.4 |
| Other sales and service personnel | 0.0 | 0.0 | 0.0 | 31.6 | 66.2 | +34.6 |
| Other manual workers | 0.0 | 0.0 | 0.0 | 476.2 | 400.0 | -76.2 |
Sources:
* Statistics Canada, 2011 National Household Survey.
** Change values may not equal the differences between the attainment rates due to rounding.
| Occupational group | Transportation | 'Other' | ||||
|---|---|---|---|---|---|---|
| attainment rate of sector LMA | Change ** | attainment rate of sector LMA | Change ** | |||
| 2016 | 2017 | 2016 | 2017 | |||
| Senior managers | 171,4 | 212,7 | +41,3 | 24,1 | 20,0 | -4,1 |
| Middle and other managers | 89,5 | 86,4 | -3,1 | 62,5 | 61,1 | -1,4 |
| Professionals | 127,3 | 145,3 | +18,0 | 80,0 | 83,2 | +3,2 |
| Semi-professionals and technicians | 92,3 | 98,9 | +6,6 | 107,3 | 109,5 | +2,2 |
| Supervisors | 88,6 | 88,2 | -0,4 | 90,9 | 88,0 | -2,9 |
| Supervisors: crafts and trades | 140,7 | 152,4 | 11,7 | 102,3 | 97,2 | -5,1 |
| Administrative and senior clerical personnel | 84,6 | 80,8 | -3,8 | 76,6 | 82,1 | +5,5 |
| Skilled sales and service personnel | 207,7 | 224,3 | +16,6 | 53,7 | 64,9 | +11,2 |
| Skilled crafts and trades workers | 103,0 | 111,5 | +8,5 | 155,1 | 151,2 | -3,9 |
| Clerical personnel | 78,6 | 83,1 | +4,5 | 100,0 | 86,4 | -13,6 |
| Intermediate sales and service personnel | 118,5 | 121,0 | +2,5 | 48,9 | 48,4 | -0,5 |
| Semi-skilled manual workers | 83,3 | 90,2 | +6,9 | 210,0 | 211,9 | +1,9 |
| Other sales and service personnel | 96,0 | 91,4 | -4,6 | 33,7 | 43,5 | +9,8 |
| Other manual workers | 58,0 | 63,7 | +5,7 | 98,9 | 79,2 | -19,7 |
Sources:
* Statistics Canada, 2011 National Household Survey.
** Change values may not equal the differences between the attainment rates due to rounding.
Banking and financial services sector
The attainment rate of sector occupational LMA of Aboriginal peoples increased from 2016 to 2017 in the Middle and other managers, Semi-professionals and technicians, Supervisors and Semi-skilled manual workers occupational groups. The representation of Aboriginal peoples continued to be above sector occupational LMA in Supervisors, Skilled sales and service personnel and Skilled crafts and trades workers occupational groups in 2017.
Communications sector
The attainment rate of sector occupational LMA of Aboriginal peoples improved in Middle and other managers, Supervisors: crafts and trades and Other sales and service personnel occupational groups between 2016 and 2017. Although the attainment rate decreased by 76.2 percentage points in the Other manual workers occupational group, this is a very small occupational group with only one Aboriginal employee of a total of six reported employees for 2017. Aboriginal peoples’ attainment rate of sector LMA in the Senior managers occupational group decreased from 2016 to 2017, remaining below full representation. However, the representation of Aboriginal peoples in nine out of the 14 occupational groups continued to be above sector occupational LMA in 2017.
Transportation sector
The attainment rate of sector occupational LMA of Aboriginal peoples increased in 10 of the 14 occupational groups from 2016 to 2017. The attainment rate of sector occupational LMA continued to be above 100% in six occupational groups, including in the Senior managers and Professionals occupational groups.
‘Other’ sector
The attainment rate of sector occupational LMA of Aboriginal peoples increased in six occupational groups between 2016 and 2017 but remained low in the Senior managers occupational group. Aboriginal employees in this sector continued to be well represented in the following three occupational groups in 2017: Semi-professionals and technicians, Skilled crafts and trades workers and Semi-skilled manual workers
Additional data on the representation, hires, promotions and terminations of employees by designated group and sector is provided in Appendix A.
Persons with disabilities
Between 2016 and 2017, the representation of persons with disabilities in the federally regulated private sector remained at 3.3%. Overall and in all four sectors, more persons with disabilities left than entered the workforce.
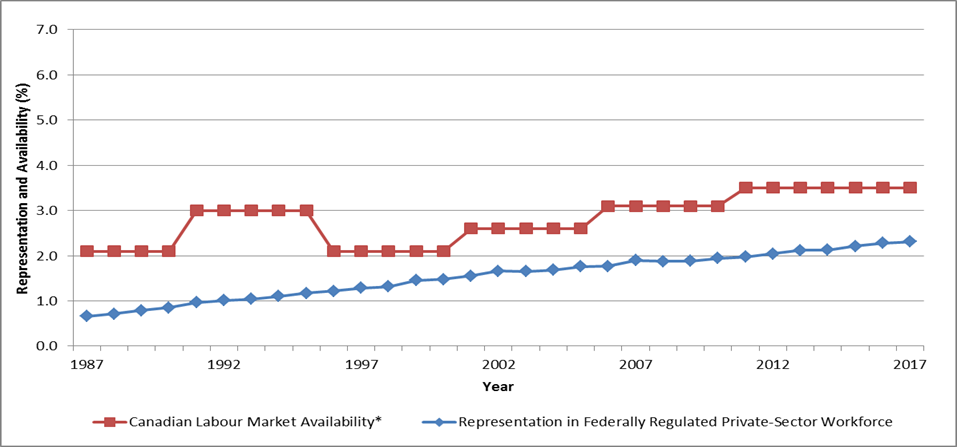
Chart 6 illustrates that the representation of persons with disabilities reached its highest level at 3.3% in 2016 and continued to be at this level in 2017, a significant increase from the initial low of 1.6% in 1987. The 2017 representation rate remained 1.6 percentage points below the 4.9% LMA.
Source: * Statistics Canada, 1986 and 1991 Health and Activity Limitation Survey; 2001 and 2006 Participation and Activity Limitation Survey; and 2012 Canadian survey on disability.
Show data table
| Year | All employees | Persons with disabilities | ||
|---|---|---|---|---|
| Total | Representation | Availability | ||
| # | % | % | ||
| 1987 | 595,417 | 9,440 | 1.6 | 5.4 |
| 1988 | 613,688 | 10,343 | 1.7 | 5.4 |
| 1989 | 631,015 | 14,746 | 2.3 | 5.4 |
| 1990 | 631,423 | 15,119 | 2.4 | 5.4 |
| 1991 | 615,135 | 15,438 | 2.5 | 6.5 |
| 1992 | 602,265 | 15,318 | 2.5 | 6.5 |
| 1993 | 582,363 | 14,937 | 2.6 | 6.5 |
| 1994 | 599,311 | 15,736 | 2.6 | 6.5 |
| 1995 | 588,047 | 16,063 | 2.7 | 6.5 |
| 1996 | 571,883 | 15,207 | 2.7 | 6.5 |
| 1997 | 571,138 | 13,228 | 2.3 | 6.5 |
| 1998 | 589,218 | 13,319 | 2.3 | 6.5 |
| 1999 | 588,759 | 14,068 | 2.4 | 6.5 |
| 2000 | 600,220 | 13,929 | 2.3 | 6.5 |
| 2001 | 634,759 | 14,519 | 2.3 | 5.3 |
| 2002 | 629,916 | 14,793 | 2.3 | 5.3 |
| 2003 | 621,457 | 14,425 | 2.3 | 5.3 |
| 2004 | 651,048 | 16,558 | 2.5 | 5.3 |
| 2005 | 672,652 | 18,163 | 2.7 | 5.3 |
| 2006 | 698,210 | 18,662 | 2.7 | 4.9 |
| 2007 | 733,789 | 19,777 | 2.7 | 4.9 |
| 2008 | 744,011 | 19,786 | 2.7 | 4.9 |
| 2009 | 743,837 | 19,758 | 2.7 | 4.9 |
| 2010 | 755,966 | 19,658 | 2.6 | 4.9 |
| 2011 | 768,547 | 19,649 | 2.6 | 4.9 |
| 2012 | 772,480 | 20,232 | 2.6 | 4.9 |
| 2013 | 738,053 | 20,053 | 2.7 | 4.9 |
| 2014 | 740,740 | 20,556 | 2.8 | 4.9 |
| 2015 | 730,485 | 21,627 | 3.0 | 4.9 |
| 2016 | 720,092 | 23,636 | 3.3 | 4.9 |
| 2017 | 720 297 | 23,860 | 3.3 | 4.9 |
Note: In 2001, Statistics Canada began using the World Health Organization’s International classification of functioning, disability and health framework to define disability rather than the 1980 International classification of impairments, cisabilities, and handicaps; this resulted in a drop in LMA.
Chart 7 shows that the attainment rate of Canadian LMA of persons with disabilities is low in all occupational groups, with the exceptions of Administrative and senior clerical personnel and Skilled sales and service personnel. The attainment rate of persons with disabilities continued to be particularly low in the Supervisors and Supervisors: crafts and trades occupational groups.
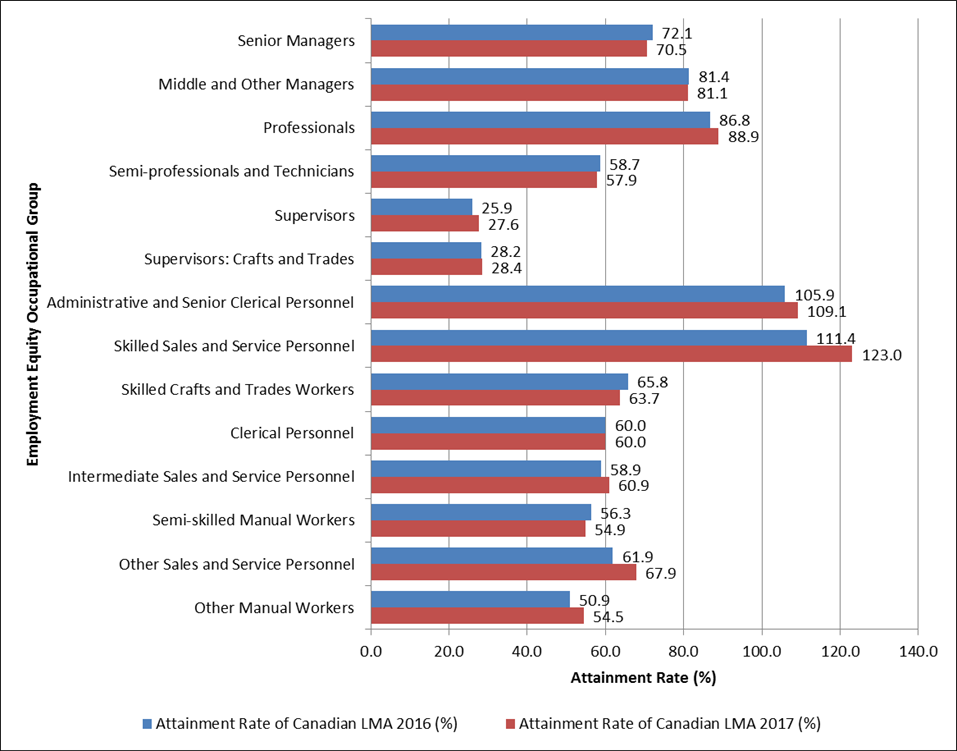
Source: * Statistics Canada, 2012 Canadian survey on disability.
Show data table
| Occupational group | Persons with disabilities | |||||
|---|---|---|---|---|---|---|
| Representation | Availability* | Change | Attainment rate of Canadian LMA | |||
| 2016 | 2017 | 2011 | 2016 | 2017 | ||
| Senior managers | 3,1 | 3,0 | 4,3 | -0,1 | 72,1 | 70,5 |
| Middle and other managers | 3,5 | 3,5 | 4,3 | 0,0 | 81,4 | 81,1 |
| Professionals | 3,3 | 3,4 | 3,8 | 0,0 | 86,8 | 88,9 |
| Semi-professionals and technicians | 2,7 | 2,7 | 4,6 | 0,0 | 58,7 | 57,9 |
| Supervisors | 3,6 | 3,8 | 13,9 | 0,2 | 25,9 | 27,6 |
| Supervisors: crafts and trades | 2,2 | 2,2 | 7,8 | 0,0 | 28,2 | 28,4 |
| Administrative and senior clerical personnel | 3,6 | 3,7 | 3,4 | 0,1 | 105,9 | 109,1 |
| Skilled sales and service personnel | 3,9 | 4,3 | 3,5 | 0,4 | 111,4 | 123,0 |
| Skilled crafts and trades workers | 2,5 | 2,4 | 3,8 | -0,1 | 65,8 | 63,7 |
| Clerical personnel | 4,2 | 4,2 | 7,0 | 0,0 | 60,0 | 60,0 |
| Intermediate sales and service personnel | 3,3 | 3,4 | 5,6 | 0,1 | 58,9 | 60,9 |
| Semi-skilled manual workers | 2,7 | 2,6 | 4,8 | -0,1 | 56,3 | 54,9 |
| Other sales and service personnel | 3,9 | 4,3 | 6,3 | 0,4 | 61,9 | 67,9 |
| Other manual workers | 2,7 | 2,9 | 5,3 | 0,2 | 50,9 | 54,5 |
| Total all employees | 3,1 | 3,0 | 4,3 | -0,1 | 72,1 | 70,5 |
Data on the attainment rate of sector occupational LMA of persons with disabilities is not available as numbers are negligible.
Additional data on the representation, hires, promotions and terminations of employees by designated group and sector is provided in Appendix A.
Members of visible minorities
The representation of members of visible minorities in the federally regulated private sector increased from 22.2% in 2016 to 22.8% in 2017. All sectors combined and in each sector, except for the banking and financial services sector, more members of visible minorities entered than left the workforce. This designated group also received a higher share of promotions than their representation level at the overall level and in each sector, with the exception of the ‘other’ sector.
Chart 8 illustrates that since 1987, the representation of members of visible minorities has been increasing steadily; this designated group has made the most progress in overall representation since 1987.

Source: * Statistics Canada, 1986 to 2006 Census and 2011 National Household Survey
Show data table
| Year | All employees | Members of visible minorities | ||
|---|---|---|---|---|
| Total | Representation | Availability | ||
| # | % | % | ||
| 1987 | 595,417 | 29,760 | 5.0 | 6.3 |
| 1988 | 613,688 | 34,785 | 5.7 | 6.3 |
| 1989 | 631,015 | 42,092 | 6.7 | 6.3 |
| 1990 | 631,423 | 44,768 | 7.1 | 6.3 |
| 1991 | 615,135 | 46,542 | 7.6 | 9.1 |
| 1992 | 602,265 | 47,618 | 7.9 | 9.1 |
| 1993 | 582,363 | 46,895 | 8.1 | 9.1 |
| 1994 | 599,311 | 49,324 | 8.2 | 9.1 |
| 1995 | 588,047 | 51,967 | 8.8 | 9.1 |
| 1996 | 571,883 | 52,600 | 9.2 | 10.3 |
| 1997 | 571,138 | 55,236 | 9.7 | 10.3 |
| 1998 | 589,218 | 58,078 | 9.9 | 10.3 |
| 1999 | 588,759 | 61,379 | 10.4 | 10.3 |
| 2000 | 600,220 | 64,072 | 10.7 | 10.3 |
| 2001 | 634,759 | 74,049 | 11.7 | 12.6 |
| 2002 | 629,916 | 76,952 | 12.2 | 12.6 |
| 2003 | 621,457 | 79,119 | 12.7 | 12.6 |
| 2004 | 651,048 | 86,572 | 13.3 | 12.6 |
| 2005 | 672,652 | 94,573 | 14.1 | 12.6 |
| 2006 | 698,210 | 104,114 | 14.9 | 15.3 |
| 2007 | 733,789 | 116,491 | 15.9 | 15.3 |
| 2008 | 744,011 | 123,262 | 16.6 | 15.3 |
| 2009 | 743,837 | 127,302 | 17.1 | 15.3 |
| 2010 | 755,966 | 134,256 | 17.8 | 15.3 |
| 2011 | 768,547 | 139,665 | 18.2 | 17.8 |
| 2012 | 772,480 | 143,968 | 18.6 | 17.8 |
| 2013 | 738,053 | 144,488 | 19.6 | 17.8 |
| 2014 | 740,740 | 151,185 | 20.4 | 17.8 |
| 2015 | 730,485 | 154,732 | 21.2 | 17.8 |
| 2016 | 720,092 | 159,514 | 22.2 | 17.8 |
| 2017 | 720,297 | 164,382 | 22.8 | 17.8 |
Chart 9 shows that members of visible minorities had attainment rates of Canadian LMA that are above the 100% threshold in 10 of the 14 occupational groups in 2017, including reaching full representation and the highest attainment rate of Canadian LMA of all four designated groups in the Senior managers occupational group. This designated group’s representation also continued to surpass Canadian LMA in important feeder groups to the Senior managers occupational group.
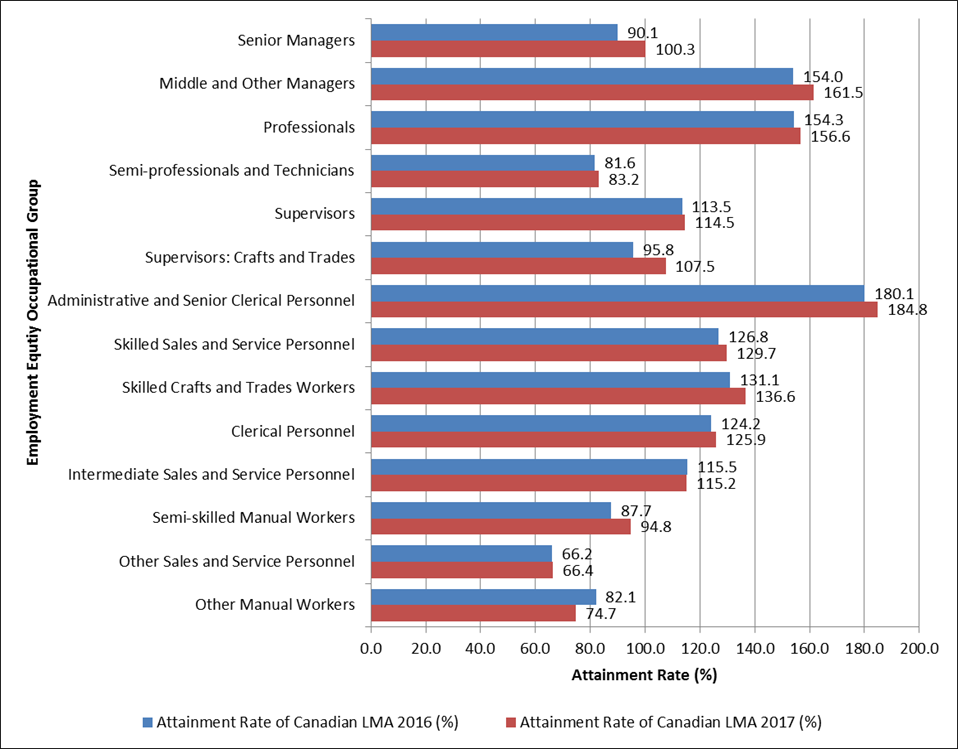
Source: * Statistics Canada, 2011 National Household Survey.
Show data table
| Occupational group | Members of visible minorities | |||||
|---|---|---|---|---|---|---|
| Representation | Availability* | Change | Attainment rate of Canadian LMA | |||
| 2016 | 2017 | 2011 | 2016 | 2017 | ||
| Senior managers | 9.1 | 10.1 | 10.1 | 1.0 | 90.1 | 100.3 |
| Middle and other managers | 23.1 | 24.2 | 15.0 | 1.2 | 154.0 | 161.5 |
| Professionals | 30.7 | 31.2 | 19.9 | 0.5 | 154.3 | 156.6 |
| Semi-professionals and technicians | 13.3 | 13.6 | 16.3 | 0.3 | 81.6 | 83.2 |
| Supervisors | 21.0 | 21.2 | 18.5 | 0.3 | 113.5 | 114.5 |
| Supervisors: crafts and trades | 9.1 | 10.2 | 9.5 | 1.1 | 95.8 | 107.5 |
| Administrative and senior clerical personnel | 25.4 | 26.1 | 14.1 | 0.7 | 180.1 | 184.8 |
| Skilled sales and service personnel | 28.9 | 29.6 | 22.8 | 0.7 | 126.8 | 129.7 |
| Skilled crafts and trades workers | 13.5 | 14.0 | 10.3 | 0.5 | 131.1 | 136.6 |
| Clerical personnel | 23.6 | 23.9 | 19.0 | 0.3 | 124.2 | 125.9 |
| Intermediate sales and service personnel | 23.9 | 23.9 | 20.7 | 0.0 | 115.5 | 115.2 |
| Semi-skilled manual workers | 16.4 | 17.7 | 18.7 | 1.3 | 87.7 | 94.8 |
| Other sales and service personnel | 14.5 | 14.6 | 21.9 | 0.1 | 66.2 | 66.4 |
| Other manual workers | 14.2 | 12.9 | 17.3 | -1.2 | 82.1 | 74.7 |
| Total | 9.1 | 10.1 | 10.1 | 1.0 | 90.1 | 100.3 |
Table 7 provides a more in-depth analysis of members of visible minorities’ occupational group representation as compared to their respective sector LMA.
| Occupational group | Banking and financial services | Communications | ||||
|---|---|---|---|---|---|---|
| Attainment rate of sector LMA | Change ** | Attainment rate of sector LMA | Change ** | |||
| 2016 | 2017 | 2016 | 2017 | |||
| Senior managers | 104.5 | 112.8 | +8.3 | 61.8 | 73.7 | +11.9 |
| Middle and other managers | 119.7 | 125.4 | +5.7 | 111.4 | 115.6 | +4.2 |
| Professionals | 113.4 | 113.7 | +0.3 | 101.6 | 106.0 | +4.4 |
| Semi-professionals and technicians | 116.5 | 119.7 | +3.2 | 87.0 | 89.6 | +2.6 |
| Supervisors | 141.2 | 143.9 | +2.7 | 119.1 | 122.7 | +3.6 |
| Supervisors: crafts and trades | - | - | - | 62.6 | 62.7 | +0.1 |
| Administrative and senior clerical personnel | 144.3 | 147.8 | +3.5 | 113.8 | 122.1 | +8.3 |
| Skilled sales and service personnel | 130.5 | 130.3 | -0.2 | 80.1 | 83.6 | +3.5 |
| Skilled crafts and trades workers | 0.0 | 0.0 | 0.0 | 100.0 | 98.6 | -1.4 |
| Clerical personnel | 120.9 | 123.4 | +2.5 | 102.4 | 107.1 | +4.7 |
| Intermediate sales and service personnel | 91.8 | 86.3 | -5.5 | 90.9 | 90.9 | 0.0 |
| Semi-skilled manual workers | 280.6 | 277.1 | -3.5 | 121.2 | 115.5 | -5.7 |
| Other sales and service personnel | 200.0 | 230.2 | +30.2 | 33.6 | 35.7 | +2.1 |
| Other manual workers | 0.0 | 0.0 | 0.0 | 212.8 | 177.8 | -35.0 |
Sources:
* Statistics Canada, 2011 National Household Survey.
** Change values may not equal the differences between the attainment rates due to rounding. “_” Amount is negligible.
| Occupational Group | Transportation | 'Other' | ||||
|---|---|---|---|---|---|---|
| Attainment Rate of Sector LMA | Change ** | Attainment Rate of Sector LMA | Change ** | |||
| 2016 | 2017 | 2016 | 2017 | |||
| Senior managers | 64.8 | 73.8 | +9.0 | 66.7 | 62.4 | -4.3 |
| Middle and other managers | 86.1 | 91.6 | +5.5 | 130.1 | 145.2 | +15.1 |
| Professionals | 92.3 | 95.5 | +3.2 | 103.4 | 108.2 | +4.9 |
| Semi-professionals and technicians | 70.6 | 72.1 | +1.5 | 58.2 | 61.7 | +3.5 |
| Supervisors | 77.6 | 80.5 | +2.9 | 84.0 | 83.8 | -0.2 |
| Supervisors: crafts and trades | 95.9 | 108.7 | +12.8 | 93.8 | 109.9 | +16.1 |
| Administrative and senior clerical personnel | 125.7 | 129.3 | +3.6 | 87.7 | 99.4 | +11.7 |
| Skilled sales and service personnel | 64.8 | 53.3 | -11.5 | 42.1 | 47.6 | +5.5 |
| Skilled crafts and trades workers | 96.9 | 104.5 | +7.6 | 124.4 | 137.6 | +13.2 |
| Clerical personnel | 86.1 | 91.3 | +5.2 | 85.9 | 91.7 | +5.8 |
| Intermediate sales and service personnel | 88.8 | 93.4 | +4.6 | 109.2 | 116.0 | +6.8 |
| Semi-skilled manual workers | 78.7 | 85.0 | +6.3 | 63.0 | 66.0 | +3.0 |
| Other sales and service personnel | 43.9 | 51.2 | +7.3 | 155.3 | 130.9 | -24.4 |
| Other manual workers | 100.7 | 96.9 | -3.8 | 106.9 | 84.8 | -22.1 |
Sources:
* Statistics Canada, 2011 National Household Survey.
** Change values may not equal the differences between the attainment rates due to rounding. “_” Amount is negligible.
Banking and financial services sector
From 2016 to 2017, the attainment rate of sector occupational LMA of members of visible minorities increased in all but three occupational groups where the sector reported representation in 2017. Only in the Intermediate sales and service personnel occupational group did the representation of members of visible minorities remain below the sector occupational LMA.
Communications sector
The attainment rate of sector occupational LMA of members of visible minorities improved in 10 of the 14 occupational groups between 2016 and 2017. Although the attainment rate decreased by ‑35.0 percentage points in the Other manual workers occupational group, this is a very small occupational group with only one visible minority employee of a total of six reported employees for 2017. The representation of members of visible minorities was above sector occupational LMA in seven occupational groups in 2017.
Transportation sector
Between 2016 and 2017, the attainment rate of sector occupational LMA of members of visible minorities increased in 12 occupational groups. The representation of this designated group only exceeded sector occupational LMA in the Supervisors: crafts and trades, Administrative and senior clerical personnel and Skilled crafts and trades workers occupational groups.
‘Other’ sector
The attainment rate of sector occupational LMA of members of visible minorities improved in 10 of the occupational groups from 2016 to 2017. This designated group’s representation exceeded sector occupational LMA in six of the occupational groups, including the Middle and other managers and Professionals occupational groups.
Additional data on the representation, hires, promotions and terminations of employees by designated group and sector is provided in Appendix A.
Section 3 - Employment equity program highlights
Under the Act, in addition to ensuring compliance with the annual reporting requirements of federally regulated private-sector employers, the Minister of Labour is mandated a number of responsibilities including:
- administrating the Federal Contractors Program
- undertaking research and developing information programs that foster understanding and promote employment equity
- recognizing private-sector employers that demonstrate outstanding achievement and efforts in implementing employment equity
This section provides an overview of the Labour Program’s activities as they relate to the Federal Contractors Program, the Workplace opportunities: removing barriers to equity grants and contributions program, pay transparency and the Employment Equity Achievement Awards.
Federal contractors program
The Federal Contractors Program (FCP) was created following the enactment of the Act. The FCP seeks to generate positive social change by ensuring that organizations that do business with the Government of Canada implement employment equity in their workplace. It applies to provincially regulated employers that have a workforce in Canada of 100 or more employees and that received a federal government goods and services contract valued at $1 million or more (including applicable taxes).
As part of their obligations, contractors must collect and analyze data about their workforce and, where gaps in representation exist, establish goals to increase representation for the four designated groups: women, Aboriginal peoples, persons with disabilities and members of visible minorities. Contractors are required to make reasonable efforts to ensure that reasonable progress is made towards meeting their goals and achieving an equitable workforce.
As of December 31, 2017, 294 certified and eight voluntary employers were covered under the FCP. A total of 45 (40 certified and five voluntary) employers were added during the 2017 calendar year.
Contractors are subject to compliance assessments to ensure that they fulfill their commitment to implement employment equity. A first compliance assessment is conducted one year after an employer has been awarded a contract. Subsequent assessments may be conducted four years after the contract award date and every three years thereafter to verify that progress is being made. In 2017, the Workplace Equity Division of the Labour Program completed 48 first-year compliance assessments and four subsequent assessments, with all contractors being found in compliance.
Workplace opportunities: removing barriers to equity
Workplace opportunities: removing barriers to equity is a grants and contributions program that was launched on July 17, 2014, and designed to support employers subject to the Act in their efforts to improve the representation of the four designated groups in areas experiencing low representation through partnerships, information sharing and implementation of industry-tailored strategies. In total, $500,000 per fiscal year is available through Workplace Opportunities.
A total of nine projects have been funded through Workplace opportunities to date. Four grant projects were completed by the end of 2016. Two of the contribution agreements concluded in the 2017 calendar year (see Box 1) and the remaining three on March 31, 2018 (see Box 2 and 3).
Box 1: Highlights of the workplace opportunities projects completed in 2017
National Educational Association of Disabled Students (NEADS)
Breaking through barriers
Funding: $161,010 (June 2015 to August 2017)
The project aimed at connecting recent graduates with disabilities and employers in the federally regulated sector, through nation-wide in-person workshops and a unique web portal designed to create on-going relationships and resource-sharing between graduates and employers.
The workshops took place in several cities such as Montréal, Ottawa, Regina and Vancouver. They addressed the project’s objective of engaging post-secondary students and graduates with disabilities as mentors to private-sector employers so that they may learn first-hand of the challenges faced by persons with disabilities. The sessions enabled employers and career professionals to share their successes and challenges in equity hiring, retention and accommodation with students/graduates. Data was collected from each of the workshops and was used to develop an employment portal, serving persons with disabilities and employers ⁄career professionals with unique online tools that have not been available previously. The portal was launched at the end of September 2017.
BC Centre for Ability Association
Abilities at work
Funding: $449,367 (June 2015 to November 2017)
The goal of the project was to connect persons with disabilities to employment opportunities and enhance their employability in the transportation sector. The project activities included 37 training workshops with more than 739 participants and enhanced outcomes around the attraction, hiring and retention of persons with disabilities for the four participating employer partners (Rocky Mountaineer, CHC Helicopter, Seaspan and Vancouver Airport Authority). The project developed a “community of practice” providing methods and lessons for other employers and trained human resources personnel, hiring managers and supervisors on best practices in attracting, interviewing, hiring and retaining persons with disabilities.
The business partners used information and resources gained from the project to enhance the activities in their existing diversity committees. All four participating employer partners now include inclusive practice information in orientation of new employees to the workplace.
Box 2: Highlights of the workplace opportunities projects completed in 2018 Trucking Human Resources Canada
Trucking workplace opportunities
Funding: $409,440 (December 2015 to March 2018)
Through the development of two national working groups, the project contributed to increased awareness among trucking industry employers regarding barriers to inclusion faced by Aboriginal peoples and persons with disabilities. An inventory of successful initiatives, a webinar series and a user-friendly guide to recruiting and retaining Aboriginal peoples were developed to help inform human resources policies and initiatives in the workplace contributing to the hiring and retention of Aboriginal peoples. Physical demand assessments for key occupations were developed and presented at five key events to gather additional employer input. These assessments identified the physical job requirements for specific occupations. Once employers are aware of the physical requirements of the job, current employees and new hires can be assessed to determine if they can perform the physical duties or if there are potential accommodations and modifications that can be put in place to allow workers to not only perform, but thrive, in their roles.
The physical demand assessments are available on Trucking Human Resources Canada’s website.
The project’s report “Changing Workforce: The case for diversity in Canada’s trucking industry” (PDF version, 2.26 MB) provides information on best practices in attaining diversity with a focus on Aboriginal peoples, persons with disabilities and members of visible minorities.
Canadian Apprenticeship Forum (CAF)
Best practices for retaining Aboriginal apprentices
Funding: $210,000 (June 2015 to March 2018)
The project aimed to identify and disseminate successful workplace practices on hiring and retaining Aboriginal apprentices. The project targeted Aboriginal apprentices in all four sectors covered by the Act (in other words banking, communications, transportation and ‘other’). The organization completed workshops and webinars in English and French with industry representatives in Nova Scotia, Ontario, Alberta, British Columbia and the Northwest Territories in order to develop an action plan to promote hiring and retaining of Aboriginal peoples.
The action plan is available on the CAF Reports and Resources page in English (PDF version 11.98 MB) and French (PDF version, 12.01 MB).
Several related webinars are also available.
Box 3: Highlights of the Workplace Opportunities Projects Completed in 2018
Paqtnkek Mi’kmaw Nation
Paqtnkek Lukwaqn (work/labour) project
Funding: $269,950 (June 2015 to March 2018)
The project created and strengthened partnerships with large-scale employers in Nova Scotia, particularly those in sectors such as banking and communications where Aboriginal peoples have traditionally been under-represented. It identified barriers to existing partnerships in industry-specific areas between federally regulated employers and Aboriginal organizations and implemented strategies to increase capacity of employers to hire Aboriginal peoples.
Key participants in the project were members of the Paqtnkek First Nation in Nova Scotia, and a primary focus was on youth in this community. An Employer Expo was held on March 8, 2017. A toolkit for human resources use in industry was created. The toolkit includes strategic suggestions for workplace environment and retention and how to build authentic engagement and relationship.
In addition, the Labour Program recently entered into an agreement in support of one new project:
- Ryerson University
Align Network for Employment EquityFunding: $1,500,000 (November 2018 to October 2021)
The project will use a coordinated national network to mobilize industry-tailored strategies to improve the representation of women, Aboriginal peoples and persons with disabilities in the financial services, communications and transportation sectors by broadening the pool of qualified candidates.
Pay transparency
Budget 2018 announced $3 million over five years to introduce pay transparency, including the provision of accessible, online information on comparative gender wage gaps for federally regulated private-sector employers on a Government of Canada website. Wage gap information will also be provided with respect to Aboriginal peoples, persons with disabilities and members of visible minorities. Wage gaps are important indicators of economic inequalities. It is widely recognized that pay transparency is a key step towards addressing wage gaps. Pay transparency will provide further incentive for employers to examine their practices and show leadership in reducing unfair wage gaps, helping to shift business culture and expectations towards greater equality.
Despite narrowing educational and work experience gaps, the gap in wages between men and women persists among workers in Canada. According to Statistics CanadaFootnote 5, women earned 87.9 cents on the dollar compared to men in terms of their average effective hourly wage in the first quarter of 2017, up from 74.2 cents in 1984. In addition, wage gaps exist for a number of disadvantaged groups such as Aboriginal peoples, persons with disabilities and members of visible minorities. In the federally regulated private sector in 2017, the earnings of women in permanent full-time positions belonging to these disadvantaged groups are consistently lower than those of men:
- 48.6% of women earned a salary of $60,000 or more, whereas 63.8% of men were at this threshold
- 41.5% of Aboriginal women earned a salary of $60,000 or more, compared to 63.0% of Aboriginal men
- 45.7% of women with disabilities earned a salary of $60,000 or more, compared to 61.0% of men with disabilities
- 48.4% of visible minority women earned a salary of $60,000 or more, compared to 60.5% of visible minority men
According to the Organisation for Economic Co-operation and Development (OECD), Canada’s gender wage gap was higher than the OECD average in 2016. Canada has an 18% difference between the median earnings of men and women, relative to the OECD average of 14%Footnote 6.
International jurisdictions including Austria, Belgium, Germany, Iceland, Portugal and the United Kingdom have already put pay transparency measures in place. For example, in the United Kingdom as of April 2017, employers with 250 or more employees are required each year to calculate and publish on a government website, and their own websites, six different metrics on the gender pay gap.
Closing the wage gaps in Canada will require leadership and a collaborative approach, involving multiple initiatives. Pay transparency will involve converting existing pay information filed by federally regulated employers into accessible user-friendly online content, with specific attention paid to making existing wage gaps more evident. It is believed that this transparency will prompt employers to take action to close their wage gaps. To this end, the Labour Program will be conducting stakeholder consultations across Canada in the 2019 calendar year to ensure that different perspectives are heard and taken into account when developing the new salary reporting requirements under the Act.
2018 Employment equity achievement awards
On October 3, 2018, the third annual Employment Equity Achievement Awards (EEAA) ceremony was held in Ottawa. The awards recognized federally regulated private-sector employers and federal contractors for their outstanding achievements in employment equity and their commitment to creating diverse and inclusive workplaces. A new award category, the Employment Equity Champion award, was introduced in 2018 to celebrate business leaders who champion employment equity in their organization.
The EEAA one-day event featured the following:
- an award ceremony with the Minister of Employment, Workforce Development and Labour
- a keynote address delivered by Zahra Al-Harazi, an entrepreneur and transformative leadership expert
- a panel of employers sharing their experience in equity, diversity and inclusion
- a leaders panel followed by discussions
Following an application process, two champion award recipients and 15 private-sector employers (see Box 4) were recognized for their efforts in advancing employment equity, as well as promoting diversity and inclusiveness in the workplace in the following categories:
- Employment Equity Champion: this award recognizes an executive or executive team of an employer for their proven track record of championing employment equity within their organization, as well as their overall contribution to diversity and inclusiveness in the workplace.
- Sector distinction: this award recognizes employers who are inspirational role models in their sector. In addition to demonstrating a strong commitment and achieving success in implementing employment equity in their own organization, these employers also champion employment equity for the sector.
- Outstanding commitment: this award recognizes employers who have demonstrated outstanding commitment in implementing their employment equity plans by instituting measures to remove barriers, adopting special measures and/or establishing positive policies and practices to achieve tangible results.
- Innovation: this award recognizes employers who have been innovative in the implementation of employment equity. This can include creativity in the design and implementation of measures to remove barriers, adoption of special measures, establishment of positive policies or practices, forward-thinking in human resources practices and/or development of new or unique initiatives.
The awards provided a forum to highlight the Government’s commitment to continue to work with employers to make further progress on equity and inclusion for the four designated groups covered under the Act. It also provided an opportunity for employers to create and strengthen networks, as well as discuss challenges and opportunities in achieving employment equity.
Box 4: 2018 Employment Equity Achievement Awards recipients
Employment Equity Champion
- Barb Mason (Bank of Nova Scotia)
- Craig Richmond (Vancouver Airport Authority)
Sector distinction
- Canadian Imperial Bank of Commerce
- Cogeco Connexion Inc.
- Defence Construction Canada
- Jazz Aviation LP
- Kindersley Transport Ltd.
- Vancouver Airport Authority
Outstanding commitment
- Bell Canada
- Capital One Bank (Canada)
- Gardewine LLP
- HSBC Bank Canada
- Marine Atlantic Inc.
- Royal Bank of Canada
Innovation
- ATCO Structures & Logistics Ltd.
- Atlantic Towing Limited
- Queen’s University
Conclusion
This report contains a high-level analysis of the results that employers have achieved in implementing employment equity in their workplaces for the 2017 calendar year. It has been 30 years since the collection of employment equity data commenced under the Act, when 373 employers reported on their 1987 workforce data, which was composed of 595,417 employees. This year’s report includes submissions received from 462 employers with a combined workforce of 720,297 employees—an increase of 21.0% in the workforce coverage.
Since 1987, the representation of members of visible minorities has improved significantly and exceeds labour market availability but women, Aboriginal peoples and persons with disabilities continue to be under-represented. The data reported for the 2017 calendar year indicates that while the overall representation of these under-represented groups either decreased or continued to be at the same level as in 2016, some increases were observed at the sector and occupational group levels. Although members of visible minorities continue to be the most successful designated group, they are still under-represented in certain sectors and occupational groups.
The 2018 Employment Equity Achievement Awards gained increased interest from employers. Two champion award recipients and 15 private-sector employers were recognized for their successes and accomplishments in implementing employment equity, diversity and inclusion. Three Workplace Opportunities: Removing Barriers to Equity projects successfully concluded this year and one new agreement has been put in place. These projects, tools, information sharing and learning help strengthen employers’ efforts and support them in implementing measures to remove barriers and improve their workplaces.
It will be a busy year ahead. The Labour Program has commenced work on making regulatory changes and on addressing wage gaps through pay transparency for the four designated groups. In addition, consultations on regulatory changes with stakeholders from across the country will be undertaken at the beginning of the 2019 calendar year. It is encouraging to see the level of interest and commitment to diversity and inclusion demonstrated by employers, and we will continue to support their efforts.
Appendix A
Tables – Federally regulated private-sector employers
The following tables consolidate data from the annual reports submitted by federally regulated private-sector employers. To allow for comparative analysis, some of the data from 1987 (the year data was first collected) is included with 2016 and 2017 data.
Tables 1 to 3 in this appendix present data aggregated to include permanent full-time, permanent part-time and temporary employees. Table 4 summarizes information for the four industrial sectors, including: number, representation, hires, promotions, terminations and the net effect of hires less terminations. Tables 5 and 6 present salary data for permanent full-time and permanent part-time employees respectively.
List of tables
- Table 1: Representation (1987, 2016 and 2017) and availability (2011/2012) of Federally regulated private-sector employees by designated group, Census Metropolitan Area, Province and Territory (%)
- Table 2: Representation (2016 and 2017) and availability (2011/2012) of Federally regulated private-sector employees by designated group and occupational group (%)
- Table 3: Distribution (2017 and 2018) of Federally regulated private-sector employees by designated group and occupational group (%)
- Table 4: Federally regulated private-sector employees by designated group and sector: number, representation, hires, promotions, terminations and net effect (2016 and 2017)
- Table 5: Federally regulated private-sector employees in permanent full-time employment by designated group, gender and salary range as of December 31, 2017
- Table 6: Federally regulated private-sector employees in permanent part-time employment by designated group, gender and salary range as of December 31, 2017
| Census metropolitan area and Province/Territory | Women | Aboriginal peoples | Persons with disabilities | Members of visible minorities | ||||||||||||
|---|---|---|---|---|---|---|---|---|---|---|---|---|---|---|---|---|
| Representation | Availability* | Representation | Availability* | Representation | Availability* | Representation | Availability* | |||||||||
| 1987 | 2016 | 2017 | 2011 | 1987 | 2016 | 2017 | 2011 | 1987 | 2016 | 2017 | 2012 | 1987 | 2016 | 2017 | 2011 | |
| Halifax | 41.2 | 41.7 | 41.2 | 49.6 | 0.5 | 2.4 | 2.4 | 2.6 | 1.6 | 5.3 | 5.4 | n/a | 1.9 | 8.4 | 9.0 | 7.6 |
| Montréal | 39.0 | 40.9 | 40.4 | 48.4 | 0.3 | 0.9 | 0.9 | 0.7 | 1.1 | 2.2 | 2.3 | n/a | 3.0 | 16.6 | 17.2 | 18.0 |
| Toronto | 47.1 | 44.5 | 44.2 | 48.7 | 0.6 | 1.0 | 1.0 | 0.6 | 1.5 | 3.4 | 3.4 | n/a | 12.0 | 37.5 | 37.9 | 44.1 |
| Winnipeg | 32.7 | 33.3 | 32.2 | 48.8 | 0.8 | 6.8 | 7.2 | 9.0 | 1.8 | 3.2 | 3.4 | n/a | 2.9 | 18.9 | 19.8 | 18.9 |
| Regina | 42.9 | 47.6 | 48.4 | 48.6 | 0.4 | 3.2 | 2.8 | 7.2 | 2.4 | 4.0 | 3.8 | n/a | 1.6 | 15.8 | 17.2 | 9.8 |
| Calgary | 47.6 | 44.0 | 43.5 | 47.1 | 0.5 | 2.0 | 2.1 | 2.5 | 1.9 | 3.2 | 3.2 | n/a | 5.6 | 22.9 | 23.6 | 25.7 |
| Edmonton | 44.5 | 39.6 | 38.5 | 47.1 | 0.7 | 3.0 | 3.1 | 4.5 | 2.0 | 3.2 | 3.3 | n/a | 4.4 | 21.9 | 23.0 | 21.0 |
| Vancouver | 40.4 | 37.9 | 37.5 | 48.6 | 0.5 | 2.2 | 2.2 | 2.1 | 1.5 | 3.4 | 3.1 | n/a | 7.9 | 35.7 | 36.3 | 41.8 |
| Newfoundland and Labrador | 38.4 | 44.4 | 44.6 | 48.2 | 0.6 | 5.5 | 6.0 | 6.7 | 1.0 | 3.1 | 3.0 | 5.6 | 0.7 | 2.4 | 2.2 | 1.3 |
| Prince Edward Island | 38.0 | 37.1 | 32.3 | 49.5 | 0.2 | 1.1 | 0.9 | 1.4 | 1.2 | 2.8 | 2.2 | 5.7 | 1.0 | 3.0 | 2.9 | 2.4 |
| Nova Scotia | 34.4 | 43.6 | 42.5 | 49.2 | 0.4 | 2.4 | 2.5 | 3.4 | 3.5 | 5.2 | 5.3 | 7.2 | 1.3 | 7.3 | 7.7 | 4.5 |
| New Brunswick | 32.2 | 48.2 | 47.7 | 48.3 | 0.4 | 1.3 | 1.4 | 2.6 | 1.8 | 3.7 | 4.2 | 5.3 | 1.1 | 3.4 | 4.0 | 2.2 |
| Quebec | 39.8 | 39.7 | 39.2 | 47.9 | 0.4 | 1.2 | 1.1 | 1.6 | 1.1 | 2.1 | 2.2 | 3.0 | 2.6 | 13.9 | 14.4 | 9.8 |
| Ontario | 44.2 | 42.9 | 42.4 | 48.7 | 0.7 | 1.5 | 1.5 | 2.1 | 1.6 | 3.6 | 3.7 | 5.5 | 7.3 | 27.9 | 28.6 | 24.4 |
| Manitoba | 30.5 | 32.6 | 31.9 | 48.0 | 1.0 | 7.8 | 8.1 | 12.1 | 1.7 | 3.3 | 3.3 | 5.9 | 2.6 | 15.8 | 16.8 | 13.2 |
| Saskatchewan | 35.1 | 37.1 | 36.8 | 47.3 | 1.4 | 7.9 | 7.4 | 10.4 | 1.8 | 3.2 | 3.1 | 5.6 | 1.2 | 9.7 | 10.1 | 6.3 |
| Alberta | 45.3 | 41.7 | 41.1 | 46.6 | 0.7 | 2.7 | 2.8 | 4.7 | 1.9 | 3.3 | 3.3 | 4.9 | 4.0 | 20.0 | 20.8 | 17.3 |
| British Columbia | 41.5 | 37.8 | 37.2 | 48.5 | 0.7 | 3.1 | 3.2 | 4.6 | 1.7 | 3.6 | 3.4 | 5.8 | 6.2 | 28.3 | 29.0 | 25.8 |
| Yukon | 31.4 | 41.4 | 41.5 | 49.5 | 3.8 | 8.5 | 7.3 | 19.0 | 0.8 | 3.1 | 2.9 | 6.9 | 1.4 | 11.4 | 12.0 | 5.9 |
| Northwest Territories | 21.9 | 25.7 | 25.7 | 47.8 | 9.6 | 8.2 | 8.6 | 40.3 | 1.4 | 1.9 | 1.8 | 3.6 | 2.5 | 10.8 | 12.2 | 7.8 |
| Nunavut | n/a | 26.1 | 25.3 | 46.9 | n/a | 38.4 | 29.9 | 75.1 | n/a | 1.9 | 1.9 | 2.6 | n/a | 8.0 | 7.1 | 2.6 |
| Canada | 40.9 | 40.7 | 40.2 | 48.2 | 0.7 | 2.3 | 2.3 | 3.5 | 1.6 | 3.3 | 3.3 | 4.9 | 5.0 | 22.2 | 22.8 | 17.8 |
Source: * Statistics Canada, 2011 National Household Survey and 2012 Canadian survey on disability.
Occupational group |
Women | Aboriginal peoples | Persons with disabilities | Members of visible minorities | ||||||||
|---|---|---|---|---|---|---|---|---|---|---|---|---|
| Representation | Availability* | Representation | Availability* | Representation | Availability* | Representation | Availability* | |||||
| 2016 | 2017 | 2011 | 2016 | 2017 | 2011 | 2016 | 2017 | 2012 | 2016 | 2017 | 2011 | |
| Senior managers | 26.4 | 27.3 | 27.4 | 1.0 | 1.0 | 2.9 | 3.1 | 3.0 | 4.3 | 9.1 | 10.1 | 10.1 |
| Middle and other managers | 42.1 | 42.0 | 38.9 | 1.3 | 1.3 | 2.2 | 3.5 | 3.5 | 4.3 | 23.1 | 24.2 | 15.0 |
| Professionals | 44.6 | 44.5 | 55.0 | 1.3 | 1.2 | 2.1 | 3.3 | 3.4 | 3.8 | 30.7 | 31.2 | 19.9 |
| Semi-professionals and technicians | 19.0 | 19.2 | 52.0 | 2.5 | 2.6 | 3.7 | 2.7 | 2.7 | 4.6 | 13.3 | 13.6 | 16.3 |
| supervisors | 60.6 | 58.8 | 56.5 | 2.4 | 2.4 | 3.6 | 3.6 | 3.8 | **13.9 | 21.0 | 21.2 | 18.5 |
| Supervisors: crafts and trades | 8.5 | 8.3 | 11.2 | 3.7 | 4.0 | 3.7 | 2.2 | 2.2 | **7.8 | 9.1 | 10.2 | 9.5 |
| Administrative and senior clerical personnel | 76.9 | 76.4 | 82.6 | 1.9 | 1.9 | 3.0 | 3.6 | 3.7 | 3.4 | 25.4 | 26.1 | 14.1 |
| Skilled sales and service personnel | 53.1 | 53.9 | 49.9 | 1.8 | 1.7 | 3.2 | 3.9 | 4.3 | 3.5 | 28.9 | 29.6 | 22.8 |
| Skilled crafts and trades workers | 4.7 | 4.7 | 3.9 | 3.8 | 3.9 | 4.5 | 2.5 | 2.4 | 3.8 | 13.5 | 14.0 | 10.3 |
| Clerical personnel | 57.5 | 56.4 | 68.4 | 2.1 | 2.1 | 3.4 | 4.2 | 4.2 | 7.0 | 23.6 | 23.9 | 19.0 |
| Intermediate sales and service personnel | 63.2 | 62.5 | 66.8 | 2.5 | 2.5 | 3.7 | 3.3 | 3.4 | 5.6 | 23.9 | 23.9 | 20.7 |
| Semi-skilled manual workers | 13.3 | 11.2 | 17.9 | 3.3 | 3.5 | 4.1 | 2.7 | 2.6 | 4.8 | 16.4 | 17.7 | 18.7 |
| Other sales and service personnel | 41.9 | 41.1 | 57.5 | 3.9 | 4.2 | 5.1 | 3.9 | 4.3 | 6.3 | 14.5 | 14.6 | 21.9 |
| Other manual workers | 11.2 | 9.5 | 22.7 | 5.9 | 5.8 | 6.0 | 2.7 | 2.9 | **5.3 | 14.2 | 12.9 | 17.3 |
| Total | 40.7 | 40.2 | 48.2 | 2.3 | 2.3 | 3.5 | 3.3 | 3.3 | 4.9 | 22.2 | 22.8 | 17.8 |
Sources:
* Statistics Canada, 2011 National Household Survey and 2012 Canadian survey on disability.
** Use with caution. The coefficient of variation of the estimate is between 16.5% and 33.3%.
| Administrative and senior clerical personnel | Women | Men | Aboriginal peoples | Non-aboriginal peoples | ||||
|---|---|---|---|---|---|---|---|---|
| 2016 | 2017 | 2016 | 2017 | 2016 | 2017 | 2016 | 2017 | |
| Senior managers | 0.6 | 0.6 | 1.1 | 1.0 | 0.4 | 0.4 | 0.9 | 0.9 |
| Middle and other managers | 11.2 | 11.5 | 10.6 | 10.7 | 6.3 | 6.3 | 11.0 | 11.1 |
| Professionals | 20.7 | 21.7 | 17.7 | 18.2 | 10.5 | 10.3 | 19.1 | 19.9 |
| Semi-professionals and technicians | 3.1 | 3.2 | 9.1 | 9.0 | 7.4 | 7.6 | 6.7 | 6.7 |
| Supervisors | 5.0 | 4.8 | 2.2 | 2.2 | 3.6 | 3.4 | 3.4 | 3.3 |
| Supervisors: crafts and trades | 0.3 | 0.3 | 2.3 | 2.2 | 2.5 | 2.5 | 1.5 | 1.4 |
| Administrative and senior clerical personnel | 5.4 | 5.3 | 1.1 | 1.1 | 2.4 | 2.2 | 2.9 | 2.8 |
| Skilled sales and service personnel | 4.2 | 4.8 | 2.5 | 2.8 | 2.6 | 2.6 | 3.2 | 3.6 |
| Skilled crafts and trades workers | 0.9 | 1.0 | 13.0 | 13.2 | 13.3 | 13.9 | 7.9 | 8.2 |
| Clerical personnel | 18.8 | 17.8 | 9.5 | 9.2 | 12.1 | 11.7 | 13.3 | 12.7 |
| Intermediate sales and service personnel | 24.8 | 24.9 | 9.9 | 10.0 | 17.2 | 17.3 | 15.9 | 16.0 |
| Semi-skilled manual workers | 4.3 | 3.5 | 19.3 | 18.7 | 19.0 | 19.0 | 13.1 | 12.4 |
| Other sales and service personnel | 0.5 | 0.4 | 0.4 | 0.4 | 0.8 | 0.8 | 0.4 | 0.4 |
| Other manual workers | 0.2 | 0.2 | 1.1 | 1.1 | 1.9 | 1.8 | 0.7 | 0.7 |
| Total | 100.0 | 100.0 | 100.0 | 100.0 | 100.0 | 100.0 | 100.0 | 100.0 |
Occupational group |
Persons with disabilities | Persons without disabilities | Members of visible minorities | Non-visible minority members | ||||
|---|---|---|---|---|---|---|---|---|
| 2016 | 2017 | 2016 | 2017 | 2016 | 2017 | 2016 | 2017 | |
| Senior managers | 0.8 | 0.8 | 0.9 | 0.9 | 0.4 | 0.4 | 1.0 | 1.0 |
| Middle and other managers | 11.6 | 11.6 | 10.8 | 11.0 | 11.3 | 11.7 | 10.7 | 10.8 |
| Professionals | 19.2 | 20.0 | 18.9 | 19.6 | 26.3 | 26.9 | 16.9 | 17.5 |
| Semi-professionals and technicians | 5.4 | 5.4 | 6.7 | 6.7 | 4.0 | 4.0 | 7.4 | 7.5 |
| Supervisors | 3.7 | 3.8 | 3.3 | 3.2 | 3.2 | 3.0 | 3.4 | 3.3 |
| Supervisors: crafts and trades | 1.0 | 1.0 | 1.5 | 1.5 | 0.6 | 0.7 | 1.8 | 1.7 |
| Administrative and senior clerical personnel | 3.2 | 3.2 | 2.9 | 2.8 | 3.3 | 3.2 | 2.8 | 2.7 |
| Skilled sales and service personnel | 3.8 | 4.6 | 3.2 | 3.5 | 4.2 | 4.6 | 2.9 | 3.3 |
| Skilled crafts and trades workers | 6.2 | 6.0 | 8.1 | 8.4 | 4.9 | 5.1 | 8.9 | 9.3 |
| Clerical personnel | 17.1 | 16.0 | 13.2 | 12.5 | 14.2 | 13.2 | 13.1 | 12.5 |
| Intermediate sales and service personnel | 16.1 | 16.4 | 16.0 | 16.0 | 17.2 | 16.7 | 15.6 | 15.8 |
| Semi-skilled manual workers | 10.9 | 10.0 | 13.3 | 12.7 | 9.8 | 9.8 | 14.2 | 13.4 |
| Other sales and service personnel | 0.5 | 0.5 | 0.5 | 0.4 | 0.3 | 0.3 | 0.5 | 0.5 |
| Other manual workers | 0.6 | 0.6 | 0.7 | 0.7 | 0.5 | 0.4 | 0.8 | 0.8 |
| Total | 100.0 | 100.0 | 100.0 | 100.0 | 100.0 | 100.0 | 100.0 | 100.0 |
| All employees | Women | Aboriginal peoples | Persons with disabilities | Members of visible minorities | ||||||
|---|---|---|---|---|---|---|---|---|---|---|
| 2016 | 2017 | 2016 | 2017 | 2016 | 2017 | 2016 | 2017 | 2016 | 2017 | |
| Banking and financial services (number) | ||||||||||
| Employees | 237,225 | 237,016 | 139,466 | 136,762 | 3,004 | 2,899 | 10,654 | 10,651 | 74,223 | 74,811 |
| Hires | 34,740 | 38,007 | 17,284 | 19,124 | 347 | 378 | 1,000 | 1,227 | 9,226 | 9,803 |
| Promotions | 29,015 | 31,924 | 15,926 | 17,686 | 364 | 364 | 938 | 1,054 | 10,037 | 11,002 |
| Terminations | 37,281 | 39,326 | 21,230 | 22,514 | 565 | 553 | 1,569 | 1,913 | 10,415 | 10,898 |
| Net effect ** | -2,541 | -1,319 | -3,946 | -3,390 | -218 | -175 | -569 | -686 | -1,189 | -1,095 |
| Banking and financial services (percent) | ||||||||||
| Representation | 100.0 | 100.0 | 58.8 | 57.7 | 1.3 | 1.2 | 4.5 | 4.5 | 31.3 | 31.6 |
| Share of hires | 100.0 | 100.0 | 49.8 | 50.3 | 1.0 | 1.0 | 2.9 | 3.2 | 26.6 | 25.8 |
| Share of promotions | 100.0 | 100.0 | 54.9 | 55.4 | 1.3 | 1.1 | 3.2 | 3.3 | 34.6 | 34.5 |
| Share of terminations | 100.0 | 100.0 | 56.9 | 57.2 | 1.5 | 1.4 | 4.2 | 4.9 | 27.9 | 27.7 |
| Communications (number) | ||||||||||
| Employees | 133,492 | 132,890 | 47,625 | 46,740 | 3,009 | 2,941 | 4,588 | 4,680 | 30,194 | 30,773 |
| Hires | 16,198 | 20,084 | 6,079 | 7,623 | 298 | 585 | 462 | 643 | 4,397 | 5,242 |
| Promotions | 5,369 | 6,706 | 2,109 | 2,635 | 158 | 154 | 193 | 206 | 1,431 | 1,889 |
| Terminations | 23,389 | 21,665 | 9,495 | ,430 | 440 | 594 | 668 | 747 | 5,245 | 5,103 |
| Net effect | -7,191 | -1,581 | -3,416 | -807 | -142 | -9 | -206 | -104 | -848 | 139 |
| Communications(percent) | ||||||||||
| Representation | 100.0 | 100.0 | 35.7 | 35.2 | 2.3 | 2.2 | 3.4 | 3.5 | 22.6 | 23.2 |
| Share of hires | 100.0 | 100.0 | 37.5 | 38.0 | 1.8 | 2.9 | 2.9 | 3.2 | 27.1 | 26.1 |
| Share of promotions | 100.0 | 100.0 | 39.3 | 39.3 | 2.9 | 2.3 | 3.6 | 3.1 | 26.7 | 28.2 |
| Share of terminations | 100.0 | 100.0 | 40.6 | 38.9 | 1.9 | 2.7 | 2.9 | 3.4 | 22.4 | 23.6 |
| Transportation (number) | ||||||||||
| Employees | 293,113 | 294,612 | 89,918 | 89,460 | 8,069 | 8,587 | 7,198 | 7,331 | 46,981 | 50,201 |
| Hires | 42,644 | 55,793 | 11,357 | 14,488 | 1,360 | 2,176 | 696 | 970 | 8,346 | 12,209 |
| Promotions | 9,588 | 11,070 | 3,033 | 3,293 | 259 | 264 | 178 | 209 | 1,727 | 2,107 |
| Terminations | 49,888 | 53,502 | 13,443 | 13,628 | 1,633 | 1,868 | 1,197 | 1,315 | 8,498 | 9,794 |
| Net effect | -7,244 | 2,291 | -2,086 | 860 | -273 | 308 | -501 | -345 | -152 | 2,415 |
| Transportation (percent) | ||||||||||
| Representation | 100.0 | 100.0 | 30.7 | 30.4 | 2.8 | 2.9 | 2.5 | 2.5 | 16.0 | 17.0 |
| Share of hires | 100.0 | 100.0 | 26.6 | 26.0 | 3.2 | 3.9 | 1.6 | 1.7 | 19.6 | 21.9 |
| Share of promotions | 100.0 | 100.0 | 31.6 | 29.7 | 2.7 | 2.4 | 1.9 | 1.9 | 18.0 | 19.0 |
| Share of terminations | 100.0 | 100.0 | 26.9 | 25.5 | 3.3 | 3.5 | 2.4 | 2.5 | 17.0 | 18.3 |
| 'Other' (number) | ||||||||||
| Employees | 56,262 | 55,779 | 16,253 | 16,365 | 2,324 | 2,244 | 1,196 | 1,198 | 8,116 | 8,597 |
| Hires | 8,094 | 8,244 | 2,190 | 2,462 | 226 | 278 | 91 | 97 | 1,860 | 1,959 |
| Promotions | 2,637 | 2,746 | 850 | 901 | 103 | 100 | 30 | 66 | 364 | 323 |
| Terminations | 7,717 | 8,277 | 2,118 | 2,302 | 347 | 345 | 161 | 180 | 1,340 | 1,603 |
| Net effect | 377 | -33 | 72 | 160 | -121 | -67 | -70 | -83 | 520 | 356 |
| 'Other' (percent) | ||||||||||
| Representation | 100.0 | 100.0 | 28.9 | 29.3 | 4.1 | 4.0 | 2.1 | 2.1 | 14.4 | 15.4 |
| Share of hires | 100.0 | 100.0 | 27.1 | 29.9 | 2.8 | 3.4 | 1.1 | 1.2 | 23.0 | 23.8 |
| Share of promotions | 100.0 | 100.0 | 32.2 | 32.8 | 3.9 | 3.6 | 1.1 | 2.4 | 13.8 | 11.8 |
| Share of terminations | 100.0 | 100.0 | 27.4 | 27.8 | 4.5 | 4.2 | 2.1 | 2.2 | 17.4 | 19.4 |
| All sectors (number) | ||||||||||
| Employees | 720,092 | 720 ,297 | 293,262 | 289,327 | 16,406 | 16,671 | 23,636 | 23,860 | 159,514 | 164,382 |
| Hires | 101,676 | 122,128 | 36,910 | 43,697 | 2,231 | 3,417 | 2,249 | 2,937 | 23,829 | 29,213 |
| Promotions | 46,609 | 52,446 | 21,918 | 24,515 | 884 | 882 | 1,339 | 1,535 | 13,559 | 15,321 |
| Terminations | 118,275 | 122,770 | 46,286 | 46,874 | 2,985 | 3,360 | 3,595 | 4,155 | 25,498 | 27,398 |
| Net effect | -16,599 | -642 | -9,376 | -3,177 | -754 | 57 | -1,346 | -1,218 | -1,669 | 1,815 |
| All sectors (percent) | ||||||||||
| Representation | 100.0 | 100.0 | 40.7 | 40.2 | 2.3 | 2.3 | 3.3 | 3.3 | 22.2 | 22.8 |
| Share of hires | 100.0 | 100.0 | 36.3 | 35.8 | 2.2 | 2.8 | 2.2 | 2.4 | 23.4 | 23.9 |
| Share of promotions | 100.0 | 100.0 | 47.0 | 46.7 | 1.9 | 1.7 | 2.9 | 2.9 | 29.1 | 29.2 |
| Share of terminations | 100.0 | 100.0 | 39.1 | 38.2 | 2.5 | 2.7 | 3.0 | 3.4 | 21.6 | 22.3 |
Sources:
* The number of employees and representation of the designated groups cover permanent full-time, permanent part-time and temporary employees. The hires, promotions, terminations and net effect data cover only permanent full-time and permanent part-time employees.
** The number of employees hired reduced by those terminated.
Salary range |
All Employees | Aboriginal peoples | Persons with disabilities | Members of visible minorities | ||||||||||||
|---|---|---|---|---|---|---|---|---|---|---|---|---|---|---|---|---|
| Total | Men | Women | (%) | Total | (%) | Men | Women | Total | (%) | Men | Women | Total | (%) | Men | Women | |
| Under $15.000 | 2,411 | 1,755 | 656 | 27.2 | 116 | 4.8 | 79 | 37 | 51 | 2.1 | 41 | 10 | 436 | 18.1 | 325 | 111 |
| $15.000 - $19.999 | 890 | 628 | 262 | 29.4 | 48 | 5.4 | 40 | 8 | 35 | 3.9 | 19 | 16 | 165 | 18.5 | 123 | 42 |
| $20.000 - $24.999 | 2,860 | 1,400 | 1,460 | 51.0 | 97 | 3.4 | 51 | 46 | 79 | 2.8 | 37 | 42 | 551 | 19.3 | 251 | 300 |
| $25.000 - $29.999 | 9,933 | 4,556 | 5,377 | 54.1 | 328 | 3.3 | 163 | 165 | 291 | 2.9 | 135 | 156 | 2,611 | 26.3 | 1,304 | 1,307 |
| $30.000 - $34.999 | 18,094 | 8,663 | 9,431 | 52.1 | 576 | 3.2 | 255 | 321 | 746 | 4.1 | 305 | 441 | 4,821 | 26.6 | 2,367 | 2,454 |
| $35.000 - $37.499 | 14,122 | 7,004 | 7,118 | 50.4 | 351 | 2.5 | 182 | 169 | 567 | 4.0 | 241 | 326 | 3,628 | 25.7 | 1,823 | 1,805 |
| $37.500 - $39.999 | 17,448 | 8,624 | 8,824 | 50.6 | 458 | 2.6 | 239 | 219 | 773 | 4.4 | 338 | 435 | 4,659 | 26.7 | 2,217 | 2,442 |
| $40.000 - $44.999 | 42,775 | 22,194 | 20,581 | 48.1 | 928 | 2.2 | 472 | 456 | 1,559 | 3.6 | 712 | 847 | 11,234 | 26.3 | 5,716 | 5,518 |
| $45.000 - $49.999 | 44,032 | 23,022 | 21,010 | 47.7 | 966 | 2.2 | 539 | 427 | 1,539 | 3.5 | 699 | 840 | 11,360 | 25.8 | 5,824 | 5,536 |
| $50.000 - $59.999 | 101,287 | 56,890 | 44,397 | 43.8 | 2,372 | 2.3 | 1,327 | 1,045 | 3,716 | 3.7 | 1,829 | 1,887 | 23,012 | 22.7 | 12,658 | 10,354 |
| $60.000 - $69.999 | 88,694 | 56,677 | 32,017 | 36.1 | 2,076 | 2.3 | 1,386 | 690 | 2,851 | 3.2 | 1,599 | 1,252 | 19,030 | 21.5 | 11,561 | 7,469 |
| $70.000 - $84.999 | 90,005 | 60,731 | 29,274 | 32.5 | 2,090 | 2.3 | 1,525 | 565 | 3,010 | 3.3 | 1,849 | 1,161 | 19,971 | 22.2 | 12,592 | 7,379 |
| $85.000 - $99.999 | 59,500 | 39,726 | 19,774 | 33.2 | 1,302 | 2.2 | 947 | 355 | 1,833 | 3.1 | 1,113 | 720 | 14,263 | 24.0 | 9,006 | 5,257 |
| $100.000 and over | 123,363 | 89,816 | 33,547 | 27.2 | 2,328 | 1.9 | 1,884 | 444 | 3,381 | 2.7 | 2,298 | 1,083 | 25,011 | 20.3 | 17,053 | 7,958 |
| Total | 615,414 | 381,686 | 233,728 | 38.0 | 14,036 | 2.3 | 9,089 | 4,947 | 20,431 | 3.3 | 11,215 | 9,216 | 140,752 | 22.9 | 82,820 | 57,932 |
Salary Range |
All employees | Aboriginal peoples | Persons with disabilities | Members of visible minorities | ||||||||||||
|---|---|---|---|---|---|---|---|---|---|---|---|---|---|---|---|---|
| Total | Men | Women | % | Total | % | Men | Women | Total | % | Men | Women | Total | % | Men | Women | |
| Under $5.000 | 2,682 | 1,606 | 1,076 | 40.1 | 77 | 2.9 | 39 | 38 | 69 | 2.6 | 42 | 27 | 690 | 25.7 | 473 | 217 |
| $5.000 - $7.499 | 1,731 | 744 | 987 | 57.0 | 52 | 3.0 | 18 | 34 | 50 | 2.9 | 25 | 25 | 303 | 17.5 | 166 | 137 |
| $7.500 - $9.999 | 2,169 | 1,025 | 1,144 | 52.7 | 90 | 4.1 | 32 | 58 | 88 | 4.1 | 33 | 55 | 374 | 17.2 | 228 | 146 |
| $10.000 - $12.499 | 6,357 | 3,373 | 2,984 | 46.9 | 176 | 2.8 | 83 | 93 | 231 | 3.6 | 106 | 125 | 1,446 | 22.7 | 935 | 511 |
| $12.500 - $14.999 | 7,207 | 3,572 | 3,635 | 50.4 | 152 | 2.1 | 64 | 88 | 208 | 2.9 | 88 | 120 | 1,746 | 24.2 | 975 | 771 |
| $15.000 - $17.499 | 7,303 | 3,503 | 3,800 | 52.0 | 217 | 3.0 | 101 | 116 | 250 | 3.4 | 94 | 156 | 1,918 | 26.3 | 1,024 | 894 |
| $17.500 - $19.999 | 7,719 | 3,607 | 4,112 | 53.3 | 257 | 3.3 | 128 | 129 | 250 | 3.2 | 100 | 150 | 2,016 | 26.1 | 1,074 | 942 |
| $20.000 - $22.499 | 7,107 | 3,059 | 4,048 | 57.0 | 173 | 2.4 | 71 | 102 | 253 | 3.6 | 85 | 168 | 1,662 | 23.4 | 864 | 798 |
| $22.500 - $24.999 | 9,593 | 5,056 | 4,537 | 47.3 | 265 | 2.8 | 117 | 148 | 345 | 3.6 | 158 | 187 | 2,784 | 29.0 | 1,856 | 928 |
| $25.000 - $29.999 | 13,520 | 4,979 | 8,541 | 63.2 | 323 | 2.4 | 126 | 197 | 528 | 3.9 | 165 | 363 | 3,107 | 23.0 | 1,482 | 1,625 |
| $30.000 - $34.999 | 10,762 | 4,227 | 6,535 | 60.7 | 256 | 2.4 | 101 | 155 | 384 | 3.6 | 121 | 263 | 2,505 | 23.3 | 1,248 | 1,257 |
| $35.000 - $39.999 | 7,981 | 3,346 | 4,635 | 58.1 | 177 | 2.2 | 68 | 109 | 275 | 3.4 | 88 | 187 | 1,636 | 20.5 | 815 | 821 |
| $40.000 - $49.999 | 9,383 | 4,531 | 4,852 | 51.7 | 196 | 2.1 | 72 | 124 | 246 | 2.6 | 87 | 159 | 1,846 | 19.7 | 1,058 | 788 |
| $50.000 and over | 5,406 | 2,701 | 2,705 | 50.0 | 122 | 2.3 | 62 | 60 | 183 | 3.4 | 80 | 103 | 935 | 17.3 | 554 | 381 |
| Total | 98,920 | 45,329 | 53,591 | 54.2 | 2,533 | 2.6 | 1,082 | 1,451 | 3,360 | 3.4 | 1,272 | 2,088 | 22,968 | 23.2 | 12,752 | 10,216 |
Appendix B
Technical notes
Employers covered under the Employment Equity Act
The Act covers:
- organizations that employ 100 or more employees in the federally regulated private sector, federal Crown corporations and other federal government business enterprises (i.e. Montreal Port Authority, PortsToronto and Vancouver Fraser Port Authority);
- core public administration organizations listed under Schedule I or IV of the Financial Administration Act (FAA) (federal government departments and agencies);
- separate employer organizations in the federal public sector with 100 or more employees, listed in Schedule V of the FAA (separate agencies);
- other public-sector employer organizations with 100 or more employees, including the Canadian Forces (officers and non-commissioned members in the Regular and Reserve Forces) and the Royal Canadian Mounted Police (regular and civilian members, excluding federal public service employees); and
- federal contractor organizations that are provincially regulated suppliers of goods and services with at least 100 permanent full-time and/or permanent part-time employees in Canada that receive contracts of $1 million or more from the federal government.
Limitations of the employment equity data
This report provides the most recent information on employment equity data for the federally regulated private sector, with the following limitations:
- To measure progress of the designated groups covered by the Act, their representation (i.e. the number of designated group employees divided by the number of all employees) in the federally regulated private sector is compared to their availability in the workforce population. Availability data is obtained from censuses or surveys conducted every five years by Statistics Canada. As a result, there is a time lag in measuring representation gaps. The current labour market availability (LMA) is based on the 2011 National Household Survey and the 2012 Canadian survey on disability. More information on LMA can be found in the 2011 Employment Equity Data Report.
- Data is received annually from employers; however, the number of employers can differ from one year to the next.
- The Treasury Board of Canada Secretariat is responsible for reporting on employment equity in the federal departments, agencies and commissions that make up the core public administration. This information is available on the Canada.ca website. Other areas of the federal public sector are responsible for preparing their own reports on employment equity, which can be found on their respective websites or obtained upon request. Federal contractors are not required to report annually.