
Addressing labour shortages
From: Employment and Social Development Canada
Alternate formats

Addressing labour shortages (complete version) [PDF – 591 KB]
Current labour market conditions
Unemployment rates have been falling and job vacancies increasing in most regions, leading to labour shortages
- 30.3 million – Size of the total working age (15 and above) population in Canada
- 19.8 million – Size of the labour force, reflecting a 65.4% participation rate
- 18.7 million – Number of employed, reflecting a 61.6% employment rate
- 1.16 million – Number of unemployed, a 5.8% unemployment rate
- 527 thousand – Number of vacant jobs, reflecting 3.2% of labour demand
- 0.6 percent – Average real hourly wage growth in 2018. Suggests there is little evidence of significant upward pressure, despite higher shortages in some regions

Figure 1 – Text version
| Province | Unemployed to job vacancy ratio | Labour shortage characterization |
|---|---|---|
| British Columbia | 1.1 | Higher |
| Alberta | 2.9 | Medium |
| Saskatchewan | 3.0 | Medium |
| Manitoba | 2.3 | Higher |
| Ontario | 2.1 | Higher |
| Quebec | 1.7 | Higher |
| New Brunswick | 3.3 | Medium |
| Nova Scotia | 2.7 | Medium |
| Prince Edward Island | 3.8 | Lower |
| Newfoundland and Labrador | 6.7 | Lower |
Note: Provinces characterized with having “Higher” labour shortages are those who have 2.5 or less unemployed persons per job vacancy. Provinces with between 2.5 and 3.5 unemployed persons per job vacancy are deemed to have Medium labour shortages and provinces with more than 3.5 unemployed persons per job vacancy are characterized as having Lower labour shortages.
Source: Statistics Canada, Labour Force Survey and Job Vacancy and Wage Survey.
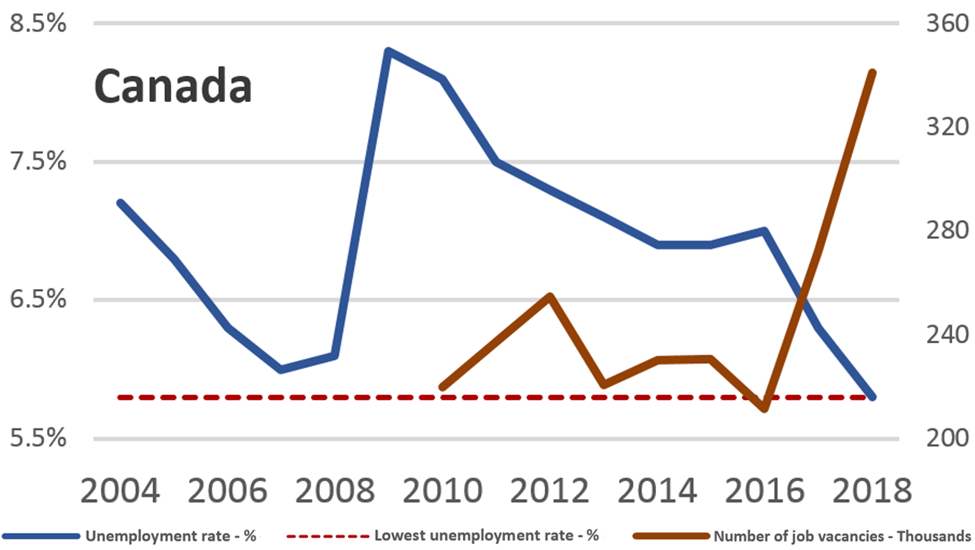
Figure 1.1 – Text version
| Year | Unemployment rate (Percent) | Lowest unemployment rate since 1976 (Percent) | Job vacancies (Thousands) |
|---|---|---|---|
| 2004 | 7.2% | 5.8% | N/A |
| 2005 | 6.8% | 5.8% | N/A |
| 2006 | 6.3% | 5.8% | N/A |
| 2007 | 6.0% | 5.8% | N/A |
| 2008 | 6.1% | 5.8% | N/A |
| 2009 | 8.3% | 5.8% | N/A |
| 2010 | 8.1% | 5.8% | N/A |
| 2011 | 7.5% | 5.8% | 237.1 |
| 2012 | 7.3% | 5.8% | 254.5 |
| 2013 | 7.1% | 5.8% | 220.8 |
| 2014 | 6.9% | 5.8% | 230 |
| 2015 | 6.9% | 5.8% | 230.8 |
| 2016 | 7.0% | 5.8% | 211.4 |
| 2017 | 6.3% | 5.8% | 272.3 |
| 2018 | 5.8% | 5.8% | 340.9 |
Source: Survey of Employment, Payrolls and Hours from Statistics Canada
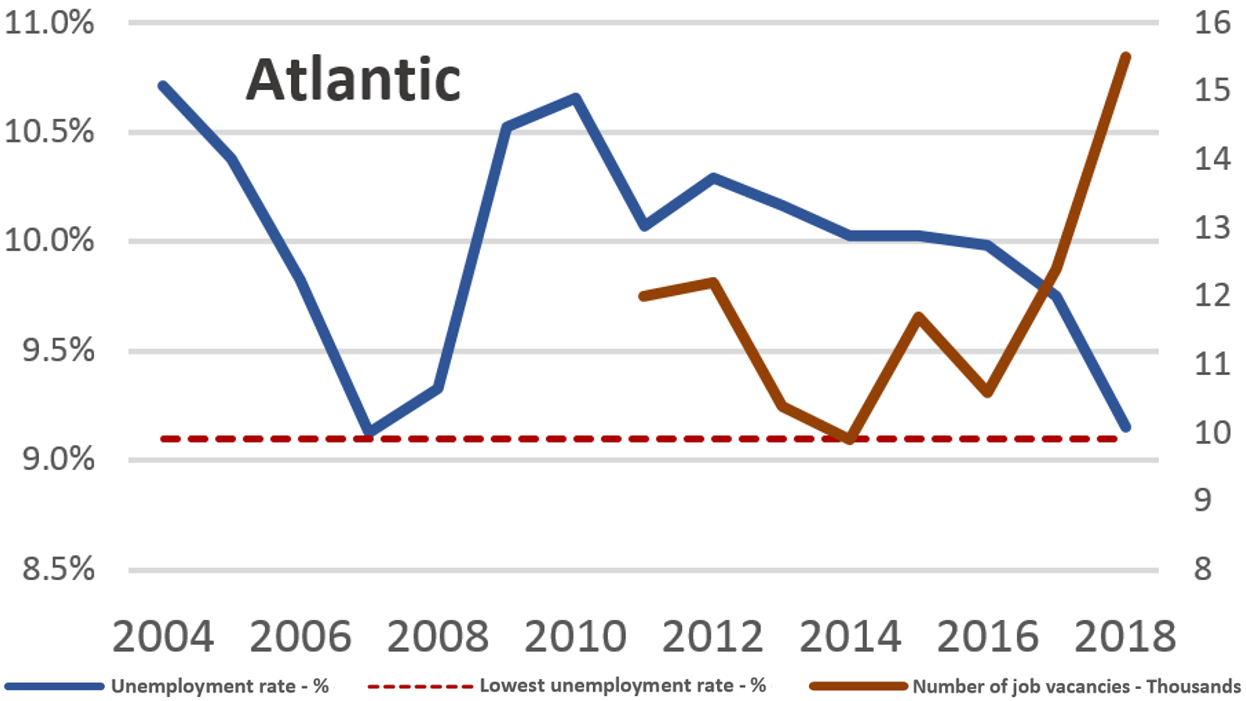
Figure 1.2 – Text version
| Year | Unemployment rate (Percent) | Lowest unemployment rate since 1976 (Percent) | Job vacancies (Thousands) |
|---|---|---|---|
| 2004 | 10.7% | 9.1% | N/A |
| 2005 | 10.4% | 9.1% | N/A |
| 2006 | 9.8% | 9.1% | N/A |
| 2007 | 9.1% | 9.1% | N/A |
| 2008 | 9.3% | 9.1% | N/A |
| 2009 | 10.5% | 9.1% | N/A |
| 2010 | 10.7% | 9.1% | N/A |
| 2011 | 10.1% | 9.1% | 12 |
| 2012 | 10.3% | 9.1% | 12.2 |
| 2013 | 10.2% | 9.1% | 10.4 |
| 2014 | 10.0% | 9.1% | 9.9 |
| 2015 | 10.0% | 9.1% | 11.7 |
| 2016 | 10.0% | 9.1% | 10.6 |
| 2017 | 9.7% | 9.1% | 12.4 |
| 2018 | 9.2% | 9.1% | 15.5 |
Note: The Atlantic region here consists of the provinces of Newfoundland and Labrador, New Brunswick, Prince Edward Island and Nova Scotia.
Source: Survey of Employment, Payrolls and Hours from Statistics Canada
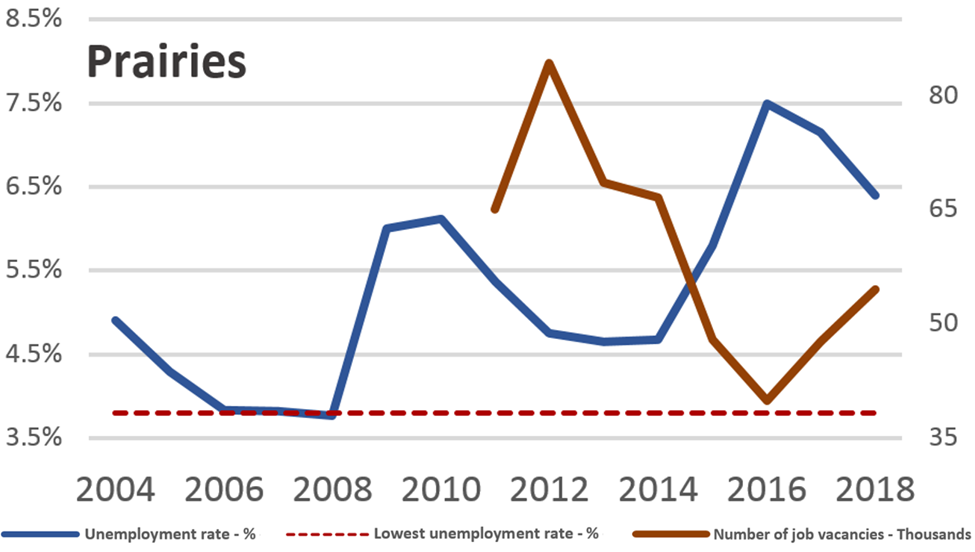
Figure 1.3 – Text version
| Year | Unemployment rate (Percent) | Lowest unemployment rate since 1976 (Percent) | Job vacancies (Thousands) |
|---|---|---|---|
| 2004 | 4.9% | 3.8% | N/A |
| 2005 | 4.3% | 3.8% | N/A |
| 2006 | 3.8% | 3.8% | N/A |
| 2007 | 3.8% | 3.8% | N/A |
| 2008 | 3.8% | 3.8% | N/A |
| 2009 | 6.0% | 3.8% | N/A |
| 2010 | 6.1% | 3.8% | N/A |
| 2011 | 5.4% | 3.8% | 65 |
| 2012 | 4.7% | 3.8% | 84.2 |
| 2013 | 4.7% | 3.8% | 68.5 |
| 2014 | 4.7% | 3.8% | 66.6 |
| 2015 | 5.8% | 3.8% | 47.9 |
| 2016 | 7.5% | 3.8% | 39.9 |
| 2017 | 7.2% | 3.8% | 47.7 |
| 2018 | 6.4% | 3.8% | 54.5 |
Note: The Prairies here consist of the provinces of Manitoba, Saskatchewan and Alberta.
Source: Survey of Employment, Payrolls and Hours from Statistics Canada

Figure 1.4 – Text version
| Year | Unemployment rate (Percent) | Lowest unemployment rate since 1976 (Percent) | Job vacancies (Thousands) |
|---|---|---|---|
| 2004 | 7.2% | 5.6% | N/A |
| 2005 | 6.8% | 5.6% | N/A |
| 2006 | 6.5% | 5.6% | N/A |
| 2007 | 6.3% | 5.6% | N/A |
| 2008 | 7.0% | 5.6% | N/A |
| 2009 | 8.7% | 5.6% | N/A |
| 2010 | 8.3% | 5.6% | N/A |
| 2011 | 7.7% | 5.6% | 159.0 |
| 2012 | 7.6% | 5.6% | 157.0 |
| 2013 | 7.3% | 5.6% | 140.6 |
| 2014 | 7.2% | 5.6% | 150.4 |
| 2015 | 6.9% | 5.6% | 170.0 |
| 2016 | 6.5% | 5.6% | 160.3 |
| 2017 | 5.8% | 5.6% | 211.4 |
| 2018 | 5.6% | 5.6% | 269.9 |
Note: British Columbia, Ontario and Quebec were grouped due to similar recent trends in unemployment and job vacancies.
Source: Survey of Employment, Payrolls and Hours from Statistics Canada
… population aging will continue to put downward pressure on labour force participation and labour force growth

Figure 2 – Text version
| Year | Participation rate (Actual) | Participation rate (Projected) | Share of Canadian working age population aged 55 and above (Actual) | Share of Canadian working age population aged 55 and above (Projected) |
|---|---|---|---|---|
| 1990 | 67.1 | N/A | 24.9 | N/A |
| 1991 | 66.6 | N/A | 25 | N/A |
| 1992 | 65.7 | N/A | 25.1 | N/A |
| 1993 | 65.3 | N/A | 25.2 | N/A |
| 1994 | 65.2 | N/A | 25.3 | N/A |
| 1995 | 64.8 | N/A | 25.4 | N/A |
| 1996 | 64.7 | N/A | 25.5 | N/A |
| 1997 | 64.9 | N/A | 25.7 | N/A |
| 1998 | 65.1 | N/A | 26 | N/A |
| 1999 | 65.5 | N/A | 26.2 | N/A |
| 2000 | 65.8 | N/A | 26.5 | N/A |
| 2001 | 65.9 | N/A | 27.2 | N/A |
| 2002 | 66.9 | N/A | 27.7 | N/A |
| 2003 | 67.6 | N/A | 28.3 | N/A |
| 2004 | 67.5 | N/A | 28.8 | N/A |
| 2005 | 67.1 | N/A | 29.2 | N/A |
| 2006 | 67 | N/A | 29.8 | N/A |
| 2007 | 67.4 | N/A | 30.3 | N/A |
| 2008 | 67.6 | N/A | 30.8 | N/A |
| 2009 | 67.1 | N/A | 31.3 | N/A |
| 2010 | 66.9 | N/A | 32 | N/A |
| 2011 | 66.7 | N/A | 32.6 | N/A |
| 2012 | 66.5 | N/A | 33.2 | N/A |
| 2013 | 66.5 | N/A | 33.9 | N/A |
| 2014 | 66 | N/A | 34.6 | N/A |
| 2015 | 65.8 | N/A | 35.4 | N/A |
| 2016 | 65.7 | N/A | 36 | N/A |
| 2017 | 65.8 | N/A | 36.6 | N/A |
| 2018 | 65.4 | 65.4 | 37.1 | 37.1 |
| 2019 | N/A | 65.7 | N/A | 37.7 |
| 2020 | N/A | 65.5 | N/A | 38.2 |
| 2021 | N/A | 65.3 | N/A | 38.6 |
| 2022 | N/A | 65.1 | N/A | 38.8 |
| 2023 | N/A | 64.9 | N/A | 39 |
| 2024 | N/A | 64.7 | N/A | 39.2 |
| 2025 | N/A | 64.5 | N/A | 39.4 |
| 2026 | N/A | 64.3 | N/A | 39.6 |
| 2027 | N/A | 64.1 | N/A | 39.7 |
| 2028 | N/A | 63.9 | N/A | 39.8 |
Source: Calculated using Statistics Canada’s Labour Force Survey and the Demographic Projections from Statistics Canada, ESDC COPS 2019 Projections (2019 to 2028).
Possible pathways to address labour shortages
New labour market participants
Increasing skilled immigration levels and improving immigrant participation rates would help address labour shortages. However, new graduates will continue to be the largest source of new labour...
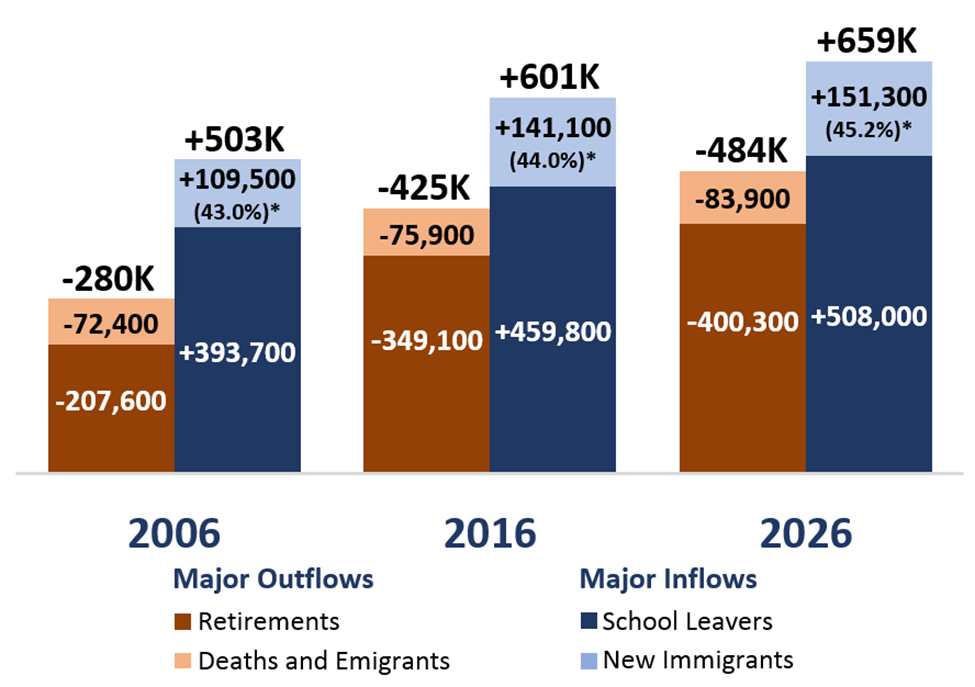
Figure 3 – Text version
| Labour force flows | 2006 | 2016 | 2026 |
|---|---|---|---|
| Total outflows | -280,000 | -425,000 | -484,200 |
| Deaths and emigrants | -72,400 | -75,900 | -83,900 |
| Retirements | -207,600 | -349,100 | -400,300 |
| Total inflows | 503,200 | 600,900 | 659,300 |
| New immigrants* (percent of total immigration) | 109,500 (43.0%)* | 141,100 (44.0%)* | 151,300 (45.2%)* |
| School leavers | 393,700 | 459,800 | 508,000 |
Source: Statistics Canada, ESDC Canadian Occupational Projection System (COPS) 2017 Projections
*Note: This percentage reflects the share of all new immigrants that are non-students aged 15 and over who are participating in the labour force.
...but, they may not be adequately prepared to meet labour market needs.
- 83% of educators say yes
- 44% of graduates say yes
- 34% of employers say yes
Source: McKinsey & Company, 2015
Women, older workers and underrepresented groups
Narrowing the participation gap of groups underrepresented in the labour force would help mitigate the decline in participation rates.

Figure 4 – Text version
| Underrepresented and comparator groups | Participation rate (Percentage) | Participation rate gap (Percentage) | Potential additional workers if the participation rate gap were closed (thousands)* | Share of the labour force represented by the potential workers added to the labour market if the participation rate gap were closed (Percentage) |
|---|---|---|---|---|
| Women aged 15 years and above | 61.3% | 8.3% | 1,200 | 6.1% |
| Men aged 15 years and above | 69.6% | N/A | N/A | N/A |
| Canadian older workers aged 55 years and above | 37.8% | 9.2% | 1,000 | 5.2% |
| Japanese older workers aged 55 years and above | 47.0% | N/A | N/A | N/A |
| Persons with disabilities with the potential to work aged 25 to 64 years | 64.7% | 20.3% | 445 | 2.3% |
| Persons without disabilities aged 25 to 64 years | 85.0% | N/A | N/A | N/A |
| Canadian older workers aged 55 years and above | 37.8% | 9.2% | 369 | 1.9% |
| Japanese older workers aged 55 years and above | 47.0% | N/A | N/A | N/A |
| Immigrants aged 15 years and above | 63.8% | 2.3% | 206 | 1.0% |
| Canadian born aged 15 years and above | 66.1% | N/A | N/A | N/A |
| Indigenous People aged 15 years and above on and off reserve | 61.4% | 4% | 48 | 0.2% |
| Non-Indigenous People aged 15 years and above | 65.4% | N/A | N/A | N/A |
*Note: These illustrative figures cannot be summed as they are not mutually exclusive, leading to double or triple counting.
Source: Census Data, Labour Force Survey, and Canada Survey on Disability from Statistics Canada; Organization for Economic Cooperation and Development (OECD) data.
Increasing permanently new immigration by 80K (or 25%) would have the same impact on the labour force after 10 years than that obtained from closing a third of all the participation rate gaps. However, additional immigrants would also raise the demand for labour and therefore have a smaller impact on reducing labour shortages.

Figure 5 – Text version
| Year | Overall labour market participation rate (Percentage) | Projected change in the overall participation rate between 2018 and 2028 (Percentage points) |
|---|---|---|
| 2018 | 65.4% | N/A |
| 2028 (Projection) | 63.9% | -1.50 |
| Underrepresented group | Gross impact on the overall participation rate of closing a third of the participation rate gaps by 2028 (Percentage points) | Net impact on the overall participation rate of closing a third of the participation rate gaps by 2028 (Percentage points) |
|---|---|---|
| Women | +0.7 | +0.7 |
| Older workers | +0.5 | +0.4 |
| Persons with disabilities | +0.2 | +0.1 |
| Immigrants | +0.2 | +0.1 |
| Indigenous people | +0.04 | +0.02 |
| Residual between the net impact on the overall participation rate of closing a third of the participation rate gaps of all underrepresented groups by 2028 and the difference in the projected overall participation rate between 2018-2028. | +0.2 | +0.2 |
*Note: Estimates are approximates. Some individuals can belong to two or more underrepresented groups. For example, there could be older immigrant women with a disability. Efforts were made to count these individuals only once. The overlay of the bars intends to reflect this overlap.
Source: COPS 2019 Projections, ESDC; and author’s calculations using the Labour Force Survey, 2016 Census and the 2017 Canadian Survey on Disability from Statistics Canada.
Technology will contribute to closing the remaining gap
Technological innovation will affect the size and composition of labour demand in the future.

Figure 6 – Text version
| Year | Annual worldwide supply of industrial robots (Actual) | Annual worldwide supply of industrial robots (Forecast) | Percent change between 2017 to 2021 |
|---|---|---|---|
| 2009 | 60 | N/A | N/A |
| 2010 | 121 | N/A | N/A |
| 2011 | 166 | N/A | N/A |
| 2012 | 159 | N/A | N/A |
| 2013 | 178 | N/A | N/A |
| 2014 | 221 | N/A | N/A |
| 2015 | 254 | N/A | N/A |
| 2016 | 294 | N/A | N/A |
| 2017 | 381 | N/A | N/A |
| 2018 | N/A | 421 | N/A |
| 2019 | N/A | 484 | N/A |
| 2020 | N/A | 553 | N/A |
| 2021 | N/A | 630 | 65.4% |
Source: International Federation of Robotics, 2018
New technologies will require a workforce that is adaptable and capable of upskilling/reskilling and could result in a significant disruption to the labour market (see Changing Nature of Work placemat).