
The changing nature of work
From: Employment and Social Development Canada
Overall summary
The labour market is quite strong, highly educated workers are now more in demand, and they experience stronger labour market outcomes than workers with less education. While an increase in the incidence of non-standard work could pose challenges for workers, over the past 20 years the incidence of this type of work has not increased, but it may rise in the future.
Moving forward there is the potential for change as a number of forces are impacting the labour market, including the aging population, technological advancements, and globalization. These are creating both challenges and opportunities and are leading to: 1) slower labour force growth and labour/skills shortages, 2) an increasing premium for high-skill workers and 3) new forms of employment. While continued change is expected, there is considerable uncertainty regarding its pace and the extent of disruption on jobs and wages.
Given this uncertainty, it will be important for policies and programs to be robust and nimble.
Alternate formats

The changing nature of work (complete version) [PDF – 452 KB]
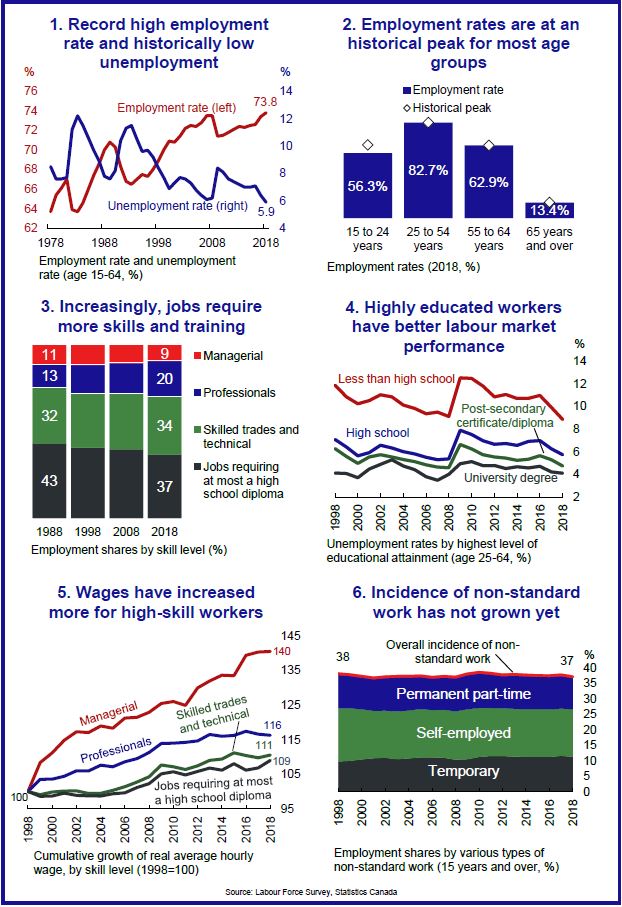
Figure 1 – Text version
1. Record high employment rate and historically low unemployment
For Canadians aged 15 to 64, from 1978 to 2018 the employment rate increased from 63.7% to 73.8% while the unemployment rate decreased from 8.5% to 5.9%.
| Year | Unemployment rate (%) | Employment rate (%) |
|---|---|---|
| 1978 | 8.5% | 63.7% |
| 1979 | 7.6% | 65.4% |
| 1980 | 7.6% | 66.1% |
| 1981 | 7.7% | 67.0% |
| 1982 | 11.2% | 63.9% |
| 1983 | 12.2% | 63.7% |
| 1984 | 11.5% | 64.6% |
| 1985 | 10.6% | 66.0% |
| 1986 | 9.7% | 67.4% |
| 1987 | 8.9% | 68.6% |
| 1988 | 7.8% | 70.0% |
| 1989 | 7.6% | 70.8% |
| 1990 | 8.2% | 70.3% |
| 1991 | 10.4% | 68.3% |
| 1992 | 11.3% | 66.8% |
| 1993 | 11.5% | 66.5% |
| 1994 | 10.5% | 67.0% |
| 1995 | 9.6% | 67.5% |
| 1996 | 9.7% | 67.3% |
| 1997 | 9.2% | 68.0% |
| 1998 | 8.4% | 68.9% |
| 1999 | 7.7% | 70.0% |
| 2000 | 6.9% | 70.9% |
| 2001 | 7.3% | 70.8% |
| 2002 | 7.7% | 71.4% |
| 2003 | 7.6% | 72.2% |
| 2004 | 7.3% | 72.5% |
| 2005 | 6.8% | 72.4% |
| 2006 | 6.4% | 72.8% |
| 2007 | 6.1% | 73.5% |
| 2008 | 6.2% | 73.5% |
| 2009 | 8.4% | 71.4% |
| 2010 | 8.1% | 71.5% |
| 2011 | 7.6% | 71.8% |
| 2012 | 7.4% | 72.1% |
| 2013 | 7.2% | 72.4% |
| 2014 | 7.0% | 72.3% |
| 2015 | 7.0% | 72.5% |
| 2016 | 7.1% | 72.6% |
| 2017 | 6.4% | 73.4% |
| 2018 | 5.9% | 73.8% |
2. Employment rates are at an historical peak for most age groups
In 2018 employment rates for most age groups were at historical peaks, including for those aged 25 to 54 years old (employment rate of 82.7% in 2018), those aged 55 to 64 years old (employment rate of 62.9% in 2018), and those aged 65 years and over, who were close to their historical peak of 13.5% - in 2018 their employment rate was 13.4%.
| Age group | Employment rate in 2018 (%) | Historical peak (%) |
|---|---|---|
| 15 to 24 years | 56.3% | 63.4% |
| 25 to 54 years | 82.7% | 82.7% |
| 55 to 64 years | 62.9% | 62.9% |
| 65 years and over | 13.4% | 13.5% |
3. Increasingly, jobs require more skills and training
From 1988 to 2018, the share of jobs requiring at most a high school diploma decreased from 43% to 37%, while managerial, professional, and skilled trades/technical positions increased from 56% to 63%.
| Skill Level (%) | 1988 | 1998 | 2008 | 2018 |
|---|---|---|---|---|
| Managerial | 11% | 12% | 10% | 9% |
| Professionals | 13% | 16% | 17% | 20% |
| Skilled trades and technical | 32% | 32% | 32% | 34% |
| Jobs requiring at most a high school diploma |
43% | 41% | 40% | 37% |
4. Highly educated workers have better labour market performance
From 1998 to 2018, workers with high levels of education have consistently had lower unemployment rates than less educated workers. For example, in 2018, those with less than a high school education had an unemployment rate of 8.8%, compared to 5.7% for those with high school education, 4.8% for those with post-secondary certificate/diploma and 4.1% for those with a university degree.
| Year | Less than high school | High school | Postsecondary certificate or diploma | University degree |
|---|---|---|---|---|
| 1998 | 11.9% | 7.1% | 6.3% | 4.1% |
| 1999 | 10.8% | 6.4% | 5.6% | 4.1% |
| 2000 | 10.2% | 5.6% | 5.0% | 3.7% |
| 2001 | 10.5% | 5.9% | 5.6% | 4.5% |
| 2002 | 11.0% | 6.6% | 5.8% | 4.9% |
| 2003 | 10.8% | 6.3% | 5.5% | 5.3% |
| 2004 | 10.1% | 6.0% | 5.3% | 4.7% |
| 2005 | 9.8% | 5.8% | 5.1% | 4.4% |
| 2006 | 9.4% | 5.5% | 4.8% | 3.8% |
| 2007 | 9.5% | 5.3% | 4.7% | 3.5% |
| 2008 | 9.1% | 5.4% | 4.6% | 4.0% |
| 2009 | 12.5% | 7.9% | 6.6% | 5.0% |
| 2010 | 12.5% | 7.5% | 6.3% | 5.1% |
| 2011 | 11.8% | 7.0% | 5.7% | 4.8% |
| 2012 | 10.8% | 6.7% | 5.5% | 4.8% |
| 2013 | 11.1% | 6.7% | 5.4% | 4.5% |
| 2014 | 10.7% | 6.6% | 5.3% | 4.7% |
| 2015 | 10.7% | 6.9% | 5.4% | 4.6% |
| 2016 | 11.0% | 7.0% | 5.7% | 4.7% |
| 2017 | 9.9% | 6.3% | 5.3% | 4.2% |
| 2018 | 8.8% | 5.7% | 4.8% | 4.1% |
5. Wages have increased more for high-skill workers
From 1998 to 2018, wages of high-skill workers have increased more than lower-skilled workers. For example, wages for workers in managerial roles increased by 40% over this time period while wages for workers in jobs requiring at most a high school diploma rose by 9%.
| Year | Managerial | Professionals | Skilled trades and technical | Jobs requiring at most a high school diploma |
|---|---|---|---|---|
| 1998 | 100.0 | 100.0 | 100.0 | 100.0 |
| 1999 | 108.3 | 103.5 | 99.1 | 98.6 |
| 2000 | 111.2 | 103.6 | 99.8 | 98.7 |
| 2001 | 114.8 | 104.4 | 100.1 | 99.5 |
| 2002 | 117.3 | 106.0 | 100.2 | 98.9 |
| 2003 | 117.0 | 105.9 | 99.4 | 98.8 |
| 2004 | 119.0 | 107.6 | 99.5 | 98.7 |
| 2005 | 118.3 | 107.1 | 100.3 | 99.4 |
| 2006 | 121.2 | 108.6 | 101.4 | 99.6 |
| 2007 | 121.4 | 109.5 | 102.7 | 101.1 |
| 2008 | 122.9 | 111.3 | 104.3 | 102.3 |
| 2009 | 125.4 | 113.9 | 107.7 | 105.1 |
| 2010 | 126.0 | 114.0 | 107.1 | 105.7 |
| 2011 | 124.9 | 114.2 | 106.4 | 104.8 |
| 2012 | 129.9 | 114.6 | 107.4 | 105.8 |
| 2013 | 131.9 | 116.5 | 109.0 | 106.8 |
| 2014 | 133.6 | 116.0 | 109.4 | 106.2 |
| 2015 | 133.5 | 116.2 | 111.2 | 108.0 |
| 2016 | 139.4 | 117.4 | 110.4 | 106.2 |
| 2017 | 140.3 | 116.6 | 109.8 | 106.8 |
| 2018 | 140.5 | 116.3 | 110.6 | 109.0 |
6. Incidence of non-standard work has not grown yet
In 1998, 38% of employment was in non-standard work, this declined slightly to 37.1% in 2018. However, the composition of non-standard work has changed, from 1998 to 2018 permanent part-time employment decreased from 11.1% to 10.5%, self-employment decreased from 17.2% to 15.3%, and temporary employment increased from 9.8% to 11.3%.
| Year | Permanent part-time | Self-employed | Temporary | Non-Standard |
|---|---|---|---|---|
| 1998 | 11.1% | 17.2% | 9.8% | 38.0% |
| 1999 | 10.8% | 17.0% | 10.0% | 37.7% |
| 2000 | 10.6% | 16.1% | 10.5% | 37.2% |
| 2001 | 10.6% | 15.3% | 10.8% | 36.7% |
| 2002 | 10.9% | 15.2% | 11.0% | 37.1% |
| 2003 | 11.3% | 15.4% | 10.5% | 37.2% |
| 2004 | 11.0% | 15.4% | 10.8% | 37.2% |
| 2005 | 10.7% | 15.6% | 11.1% | 37.4% |
| 2006 | 10.6% | 15.3% | 11.1% | 36.9% |
| 2007 | 10.7% | 15.5% | 11.0% | 37.2% |
| 2008 | 11.1% | 15.6% | 10.4% | 37.0% |
| 2009 | 11.4% | 16.1% | 10.5% | 38.0% |
| 2010 | 11.5% | 15.8% | 11.2% | 38.5% |
| 2011 | 11.2% | 15.5% | 11.6% | 38.2% |
| 2012 | 10.8% | 15.4% | 11.5% | 37.7% |
| 2013 | 11.1% | 15.4% | 11.4% | 37.9% |
| 2014 | 11.0% | 15.3% | 11.3% | 37.7% |
| 2015 | 10.8% | 15.4% | 11.3% | 37.5% |
| 2016 | 10.9% | 15.3% | 11.2% | 37.4% |
| 2017 | 10.8% | 15.2% | 11.6% | 37.7% |
| 2018 | 10.5% | 15.3% | 11.3% | 37.1% |
Source: Labour Force Survey, Statistics Canada
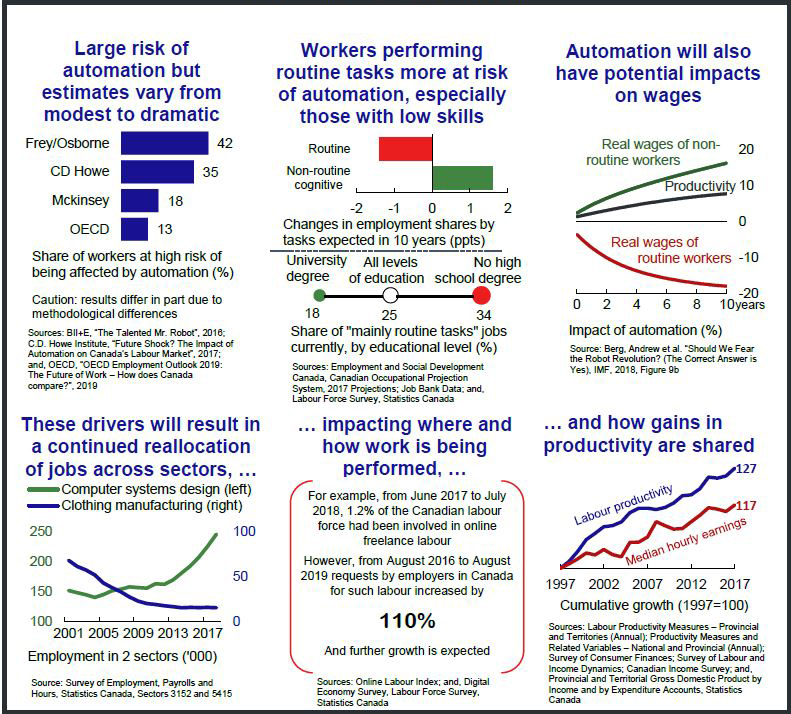
Figure 2 – Text version
Key drivers of change: Technology and globalization
Large risk of automation but estimates vary from modest to dramatic
Researchers, using varying methodologies, have come to different estimates of the impact of automation on workers. For example, applying the Frey/Osborne methodology to Canadian data, it is estimated that 42% of workers are at high risk of being affected by automation, while the OECD predicts that 13% are at high risk of being affected by automation.
| Researcher/ Institution | % |
|---|---|
| Frey/Osborne | 42% |
| C.D. Howe | 35% |
| McKinsey | 18% |
| OECD | 13% |
Caution: results differ in part due to methodological differences.
Sources: BII+E, “The Talented Mr. Robot”, 2016; C.D. Howe Institute, “Future Shock? The Impact of Automation on Canada’s Labour Market”, 2017; and, OECD, “OECD Employment Outlook 2019: The Future of Work – How does Canada compare?”, 2019
Workers performing routine tasks more at risk of automation, especially those with low skills
In the next 10 years it is estimated that the employment share of routine tasks will decrease by 1.4 percentage points (PPTS) and the employment share of non-routine cognitive tasks will increase by 1.6 percentage points.
| Type of Work | Change in employment share over the next 10 years (PPTS) |
|---|---|
| Routine | -1.4 |
| Non-routine cognitive |
1.6 |
Source: Employment and Social Development Canada, Canadian Occupational Projection System, 2017 Projections
Lower educated workers are more likely to be in jobs which are comprised of routine tasks. For example, 18% of workers with a university degree are in a job involving mainly routine tasks, while 34% of workers without a high school degree are in such a job.
| Education Level | Share of mainly routine tasks jobs (%) |
|---|---|
| University degree | 18% |
| All levels of education | 25% |
| No high school degree | 34% |
Sources: Employment and Social Development Canada, Job Bank Data; and, Labour Force Survey, Statistics Canada
Automation will also have potential impacts on wages
It is estimated that over 10 years automation could increase real wages of non-routine workers by 16.3% and could decrease the real wages of routine workers by 18.1% along with increasing productivity by 7.8%.
| Year | Change in real wages of routine workers (%) | Change in Productivity (%) | Change in real wages of non-routine workers (%) |
|---|---|---|---|
| 0 | -3.6% | 1.1% | 2.3% |
| 1 | -7.4% | 2.3% | 4.6% |
| 2 | -10.1% | 3.2% | 6.5% |
| 3 | -12.2% | 4.0% | 8.1% |
| 4 | -13.8% | 4.6% | 9.5% |
| 5 | -15.0% | 5.3% | 10.8% |
| 6 | -15.9% | 5.8% | 12.0% |
| 7 | -16.6% | 6.4% | 13.1% |
| 8 | -17.2% | 6.9% | 14.2% |
| 9 | -17.7% | 7.3% | 15.2% |
| 10 | -18.1% | 7.8% | 16.3% |
Source: Berg, Andrew et al. Should We Fear the Robot Revolution? (The Correct Answer is Yes), IMF, 2018, Figure 9b
These drivers will result in a continued reallocation of jobs across sectors, …
From 2001 to 2018 jobs in cut and sew clothing manufacturing declined from 67,879 to 15,151 while jobs in computer systems design and related services increased from 151,477 to 245,518.
| Year | Employment in cut and sew clothing manufacturing | Employment in computer systems design and related services |
|---|---|---|
| 2001 | 67,879 | 151,477 |
| 2002 | 60,928 | 147,796 |
| 2003 | 57,209 | 144,406 |
| 2004 | 51,573 | 139,947 |
| 2005 | 42,594 | 144,714 |
| 2006 | 37,542 | 151,230 |
| 2007 | 32,888 | 153,645 |
| 2008 | 27,195 | 157,618 |
| 2009 | 22,465 | 156,395 |
| 2010 | 19,782 | 155,558 |
| 2011 | 18,904 | 162,843 |
| 2012 | 17,388 | 161,717 |
| 2013 | 16,345 | 168,921 |
| 2014 | 15,182 | 180,863 |
| 2015 | 15,638 | 192,585 |
| 2016 | 15,337 | 207,216 |
| 2017 | 15,514 | 225,521 |
| 2018 | 15,151 | 245,518 |
Source: Survey of Employment, Payrolls and Hours, Statistics Canada, Sectors 3152 and 5415
…Impacting where and how work is being performed, …
For example, from June 2017 to July 2018, 1.2% of the Canadian labour force had been involved in online freelance labour. However, from August 2016 to August 2019 requests by employers in Canada for such labour increased by 110%. And it is expected that there will be further growth.
Sources: Online Labour Index; and, Digital Economy Survey, Labour Force Survey, Statistics Canada
…and how gains in productivity are shared
Between 1997 and 2017 labour productivity growth outpaced median hourly earnings growth, labour productivity grew by 27% while median hourly earnings grew by 17%.
| Year | Hourly Labour productivity | Median hourly earnings |
|---|---|---|
| 1997 | 100.0 | 100.0 |
| 1998 | 101.9 | 101.2 |
| 1999 | 104.5 | 102.5 |
| 2000 | 107.7 | 104.2 |
| 2001 | 109.4 | 103.6 |
| 2002 | 111.2 | 105.1 |
| 2003 | 111.5 | 103.7 |
| 2004 | 112.4 | 103.1 |
| 2005 | 115.0 | 107.0 |
| 2006 | 116.2 | 107.1 |
| 2007 | 116.2 | 108.4 |
| 2008 | 115.8 | 112.6 |
| 2009 | 116.4 | 111.5 |
| 2010 | 117.5 | 110.6 |
| 2011 | 119.5 | 110.7 |
| 2012 | 119.8 | 112.5 |
| 2013 | 121.4 | 114.3 |
| 2014 | 124.5 | 116.3 |
| 2015 | 124.2 | 115.9 |
| 2016 | 124.8 | 115.3 |
| 2017 | 126.9 | 117.0 |
Sources: Labour Productivity Measures: Provincial and Territories (Annual); Productivity Measures and Related Variables: National and Provincial (Annual); Survey of Consumer Finances; Survey of Labour and Income Dynamics; Canadian Income Survey; and, Provincial and Territorial Gross Domestic Product by Income and by Expenditure Accounts, Statistics Canada
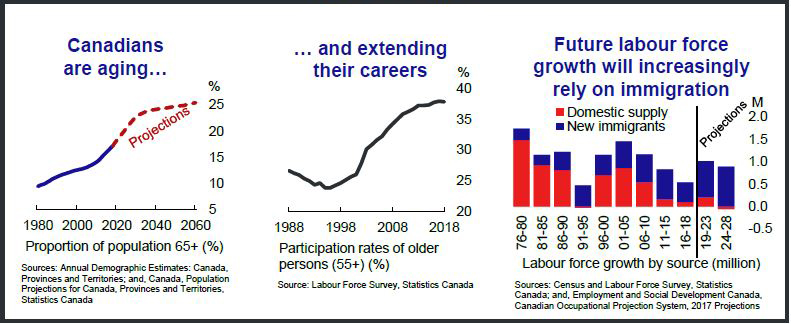
Figure 3 – Text version
Key Drivers of Change: Demographics
Canadians are aging…
Canada’s population is aging. In 1980, 9.4% of the population was over 65, this increased to 17.2% in 2018 and is expected to rise to 25.4% by 2060.
| Year | Canadians over 65 (%) |
|---|---|
| 1980 | 9.4% |
| 1981 | 9.6% |
| 1982 | 9.7% |
| 1983 | 9.9% |
| 1984 | 10.0% |
| 1985 | 10.2% |
| 1986 | 10.5% |
| 1987 | 10.7% |
| 1988 | 10.9% |
| 1989 | 11.1% |
| 1990 | 11.3% |
| 1991 | 11.5% |
| 1992 | 11.6% |
| 1993 | 11.7% |
| 1994 | 11.8% |
| 1995 | 12.0% |
| 1996 | 12.1% |
| 1997 | 12.2% |
| 1998 | 12.3% |
| 1999 | 12.5% |
| 2000 | 12.6% |
| 2001 | 12.6% |
| 2002 | 12.7% |
| 2003 | 12.8% |
| 2004 | 13.0% |
| 2005 | 13.1% |
| 2006 | 13.3% |
| 2007 | 13.4% |
| 2008 | 13.7% |
| 2009 | 13.9% |
| 2010 | 14.1% |
| 2011 | 14.4% |
| 2012 | 14.8% |
| 2013 | 15.3% |
| 2014 | 15.6% |
| 2015 | 16.0% |
| 2016 | 16.4% |
| 2017 | 16.8% |
| 2018 | 17.2% |
| 2019 | 17.7% |
| 2020 | 18.2% |
| 2021 | 18.7% |
| 2022 | 19.2% |
| 2023 | 19.6% |
| 2024 | 20.1% |
| 2025 | 20.6% |
| 2026 | 21.1% |
| 2027 | 21.5% |
| 2028 | 22.0% |
| 2029 | 22.4% |
| 2030 | 22.8% |
| 2031 | 23.1% |
| 2032 | 23.3% |
| 2033 | 23.4% |
| 2034 | 23.6% |
| 2035 | 23.7% |
| 2036 | 23.9% |
| 2037 | 24.0% |
| 2038 | 24.0% |
| 2039 | 24.1% |
| 2040 | 24.2% |
| 2041 | 24.2% |
| 2042 | 24.3% |
| 2043 | 24.3% |
| 2044 | 24.3% |
| 2045 | 24.4% |
| 2046 | 24.5% |
| 2047 | 24.5% |
| 2048 | 24.6% |
| 2049 | 24.7% |
| 2050 | 24.7% |
| 2051 | 24.8% |
| 2052 | 24.8% |
| 2053 | 24.8% |
| 2054 | 24.9% |
| 2055 | 25.0% |
| 2056 | 25.1% |
| 2057 | 25.2% |
| 2058 | 25.3% |
| 2059 | 25.3% |
| 2060 | 25.4% |
Sources: Annual Demographic Estimates: Canada, Provinces and Territories; and, Canada, Population Projections for Canada, Provinces and Territories, Statistics Canada
...and extending their careers
More Canadians aged 55 years and over are participating in the labour force than in the past. For example, in 1988 26.6% of Canadians aged 55 years and over were participating in the labour force, this increased to 37.8% in 2018.
| Year | Canadians aged 55 years and over in the labour force (%) |
|---|---|
| 1988 | 26.6% |
| 1989 | 26.2% |
| 1990 | 25.9% |
| 1991 | 25.3% |
| 1992 | 24.9% |
| 1993 | 24.3% |
| 1994 | 24.6% |
| 1995 | 23.8% |
| 1996 | 23.8% |
| 1997 | 24.2% |
| 1998 | 24.6% |
| 1999 | 25.1% |
| 2000 | 25.6% |
| 2001 | 26.0% |
| 2002 | 27.8% |
| 2003 | 30.1% |
| 2004 | 30.8% |
| 2005 | 31.6% |
| 2006 | 32.2% |
| 2007 | 33.3% |
| 2008 | 34.2% |
| 2009 | 35.0% |
| 2010 | 35.8% |
| 2011 | 36.2% |
| 2012 | 36.6% |
| 2013 | 37.2% |
| 2014 | 37.2% |
| 2015 | 37.3% |
| 2016 | 37.7% |
| 2017 | 37.9% |
| 2018 | 37.8% |
Source: Labour Force Survey, Statistics Canada
Future labour force growth will increasingly rely on immigration
Domestic supply is contributing less to labour force growth than in the past and immigration is contributing more. For example, from 1976 to 1980, domestic growth accounted for an increase in the labour force of 1,477,330 people, while immigration led to an increase of 257,795. It is estimated that from 2024 to 2028 that domestic supply will lead to a reduction in the labour force of 56,965 people while immigration will increase the labour force by 888,565.
| Period | Domestic growth | Immigration |
|---|---|---|
| 1976 to 1980 | 1,477,330 | 257,795 |
| 1981 to 1985 | 925,180 | 221,520 |
| 1986 to 1990 | 814,730 | 403,770 |
| 1991 to 1995 | -27,270 | 471,870 |
| 1996 to 2000 | 697,635 | 455,065 |
| 2001 to 2005 | 854,190 | 596,010 |
| 2006 to 2010 | 582,956 | 575,444 |
| 2011 to 2015 | 222,448 | 605,052 |
| 2016 to 2018 | 99,649 | 435,751 |
| 2019 to 2023 | 203,233 | 809,167 |
| 2024 to 2028 | -56,966 | 888,566 |
Sources: Census and Labour Force Survey, Statistics Canada; and, Employment and Social Development Canada, Canadian Occupational Projection System, 2017 Projections
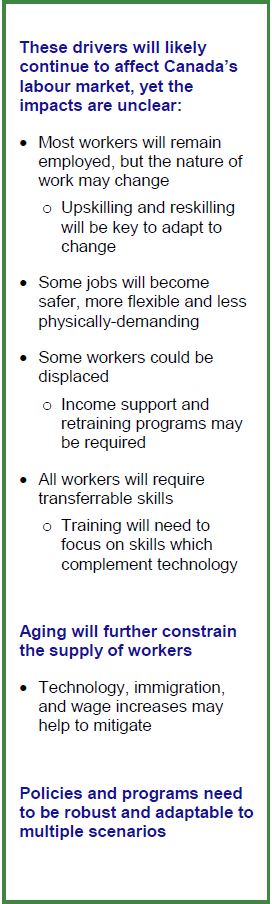
Figure 4 – Text version
- These drivers will likely continue to affect Canada’s labour market, yet the impacts are unclear:
- Most workers will remain employed, but the nature of work may change
- Upskilling and reskilling will be key to adapt to change
- Some jobs will become safer, more flexible and less physically-demanding
- Some workers could be displaced
- Income support and re-training programs may be required
- All workers will require transferrable skills
- Training will need to focus on skills which complement technology
- Most workers will remain employed, but the nature of work may change
- Aging will further constrain the supply of workers
- Technology, immigration, and wage increases may help to mitigate
- Policies and programs need to be robust and adaptable to multiple scenarios