Canadians enjoy high levels of well-being but some challenges remain
From: Employment and Social Development Canada
Overall summary
Overall, compared with other countries, Canada performs well on many measures of well-being. According to the Better Life Index, which is developed by the Organisation for Economic Cooperation and Development (OECD), Canada outperforms the average of OECD countries in each of the eleven topics which comprise the index.
Based on Canada’s Official Poverty Line, the poverty rate has declined through time. Poverty rates have been going down for most sub-segments of the population; however, some groups face continued challenges. For these vulnerable groups, economic and social barriers play a role in preventing them from fully participating in the workforce and contributing to Canada’s prosperity. Some of the barriers faced by members of certain vulnerable groups relate to employment and workforce participation, education, income, and homelessness.
Alternate formats

Canadians enjoy high levels of well-being but some challenges remain (complete version) [PDF – 347 KB]
Canada performs well on many measures of well-being
The Organisation for Economic Cooperation and Development's Better Life Index shows that Canada performs well
- Canada outperforms the OECD average in each of the 7 topic indicators presented
- The 7 topic indicators presented are life satisfaction, jobs, education, housing, community, work-life balance, and income
- Indicators for environment, civic engagement, health and safety have been excluded from the chart
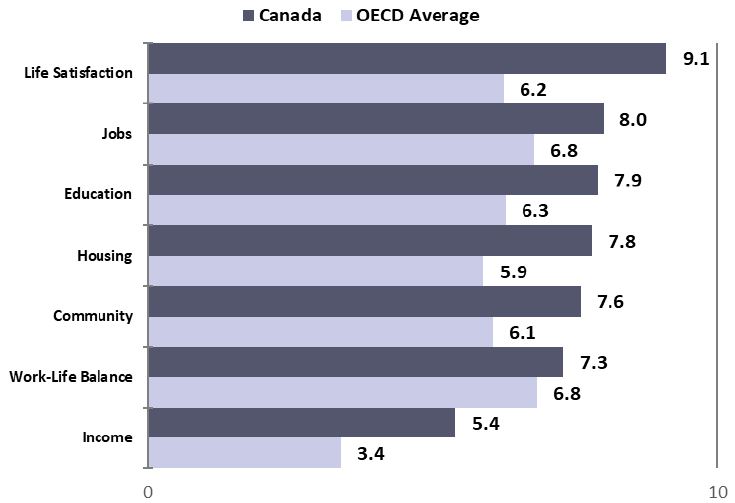
Figure 1 – Text version
| Index topics* | Canada | OECD average |
|---|---|---|
| Life satisfaction | 9.1 | 6.2 |
| Jobs | 8.0 | 6.8 |
| Education | 7.9 | 6.3 |
| Housing | 7.8 | 5.9 |
| Community | 7.6 | 6.1 |
| Work-life balance | 7.3 | 6.8 |
| Income | 5.4 | 3.4 |
* Excludes indicators for Environment, Civic Engagement, Health and Safety.
Source: Organisation for Economic Cooperation and Development, Better Life Index.
The number of Canadians below Canada's Official Poverty Line is declining
The proportion of Canadians living in poverty is declining over time, but some segments of the population face continued challenges
- Based on Canada's Official Poverty Line, Canada's poverty rate has declined from 15.6% in 2006, to 9.5% in 2017
- Segments of the population with lower poverty rates than the national average in 2017 include seniors and children
- Other segments of the population have higher poverty rates than the national average. These groups include recent immigrants, persons with disabilities, Indigenous peoples (off reserve), female lone-parents, and single people (excluding seniors)
- Canada's After-Tax Low Income Measure provides an alternative way of measuring poverty, used by the OECD for international comparisons of poverty. In 2017, 12.7% of Canadians were considered low income by this measure (compared with 12.8% in 2000)
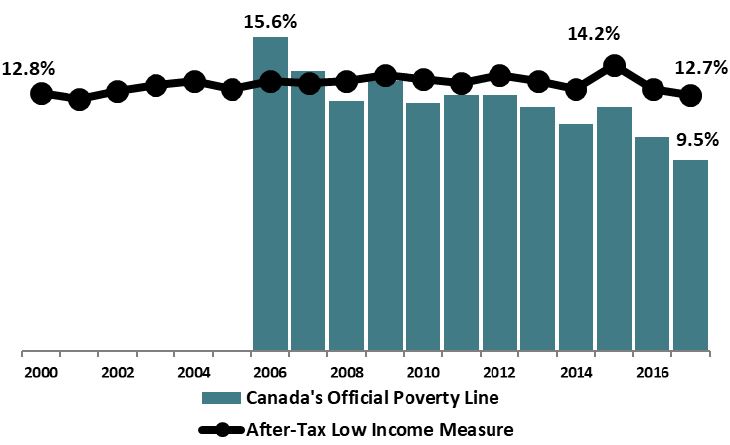
Figure 2 – Text version
| Year | After-tax low income measure | Canada's Official Poverty Line* |
|---|---|---|
| 2000 | 12.8% | N/A |
| 2001 | 12.5% | N/A |
| 2002 | 12.9% | N/A |
| 2003 | 13.2% | N/A |
| 2004 | 13.4% | N/A |
| 2005 | 13.0% | N/A |
| 2006 | 13.4% | 15.6% |
| 2007 | 13.3% | 13.9% |
| 2008 | 13.4% | 12.4% |
| 2009 | 13.7% | 13.4% |
| 2010 | 13.5% | 12.3% |
| 2011 | 13.3% | 12.7% |
| 2012 | 13.7% | 12.7% |
| 2013 | 13.4% | 12.1% |
| 2014 | 13.0% | 11.3% |
| 2015 | 14.2% | 12.1% |
| 2016 | 13.0% | 10.6% |
| 2017 | 12.7% | 9.5% |
*The current Market Basket Measure base year for Canada’s Official Poverty Line is 2008 and this series starts in 2006.
Source: Statistics Canada, Canadian Income Survey.
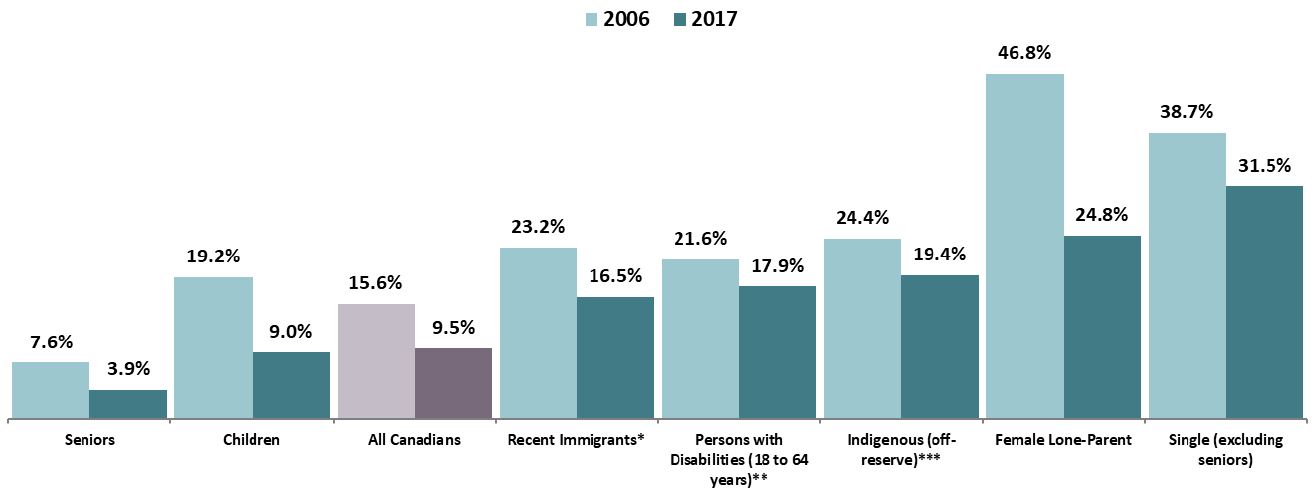
Figure 3 – Text version
| Population sub-segments | 2006 | 2017 |
|---|---|---|
| Seniors | 7.6% | 3.9% |
| Children | 19.2% | 9.0% |
| All Canadians | 15.6% | 9.5% |
| Recent immigrants * | 23.2% | 16.5% |
| Persons with disabilities (18 to 64 years)** | 21.6% | 17.9% |
| Indigenous (off-reserve)*** | 24.4% | 19.4% |
| Female lone-parent | 46.8% | 24.8% |
| Single (excluding seniors) | 38.7% | 31.5% |
* Recent immigrants are those who immigrated to Canada within ten years of the survey year.
** For persons with disabilities, the first year in the series is 2013. No comparable data exist for prior years.
*** There are currently no estimates for Indigenous on-reserve poverty rates based on Canada’s Official Poverty Line. It is expected that Indigenous on-reserve poverty rates are higher than Indigenous off-reserve.
Source: Statistics Canada, Canadian Income Survey.
Vulnerable populations continue to face barriers to fully participating in the workforce and contributing to Canada's prosperity
Canadians’ workforce participation is high but some groups face challenges finding employment
- The proportion of Canadians aged 15 to 64 who are employed has risen from 63% in 1976 to 74% in 2018
- The unemployment rate was 7% in 1976. It rose to 12% in 1983, fell to 8% in 1988, and rose again to 12% in 1993. It has since declined to slightly below 6% in 2018
- Some groups face greater challenges finding employment. Groups with lower rates than the average for all Canadians include persons with disabilities, Indigenous peoples (off reserve), female lone-parents (15 to 54 years), recent immigrants and singles (excluding seniors)
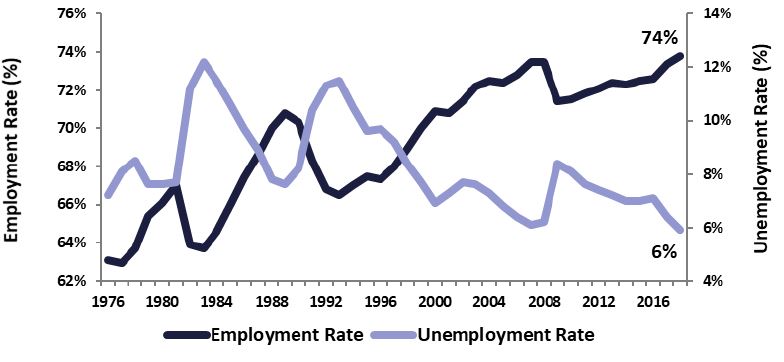
Figure 4 – Text version
| Year | Employment rate | Unemployment rate |
|---|---|---|
| 1976 | 63.1% | 7.2% |
| 1977 | 62.9% | 8.1% |
| 1978 | 63.7% | 8.5% |
| 1979 | 65.4% | 7.6% |
| 1980 | 66.1% | 7.6% |
| 1981 | 67.0% | 7.7% |
| 1982 | 63.9% | 11.2% |
| 1983 | 63.7% | 12.2% |
| 1984 | 64.6% | 11.5% |
| 1985 | 66.0% | 10.6% |
| 1986 | 67.4% | 9.7% |
| 1987 | 68.6% | 8.9% |
| 1988 | 70.0% | 7.8% |
| 1989 | 70.8% | 7.6% |
| 1990 | 70.3% | 8.2% |
| 1991 | 68.3% | 10.4% |
| 1992 | 66.8% | 11.3% |
| 1993 | 66.5% | 11.5% |
| 1994 | 67.0% | 10.5% |
| 1995 | 67.5% | 9.6% |
| 1996 | 67.3% | 9.7% |
| 1997 | 68.0% | 9.2% |
| 1998 | 68.9% | 8.4% |
| 1999 | 70.0% | 7.7% |
| 2000 | 70.9% | 6.9% |
| 2001 | 70.8% | 7.3% |
| 2002 | 71.4% | 7.7% |
| 2003 | 72.2% | 7.6% |
| 2004 | 72.5% | 7.3% |
| 2005 | 72.4% | 6.8% |
| 2006 | 72.8% | 6.4% |
| 2007 | 73.5% | 6.1% |
| 2008 | 73.5% | 6.2% |
| 2009 | 71.4% | 8.4% |
| 2010 | 71.5% | 8.1% |
| 2011 | 71.8% | 7.6% |
| 2012 | 72.1% | 7.4% |
| 2013 | 72.4% | 7.2% |
| 2014 | 72.3% | 7.0% |
| 2015 | 72.5% | 7.0% |
| 2016 | 72.6% | 7.1% |
| 2017 | 73.4% | 6.4% |
| 2018 | 73.8% | 5.9% |
Source: Statistics Canada, Labour Force Survey.
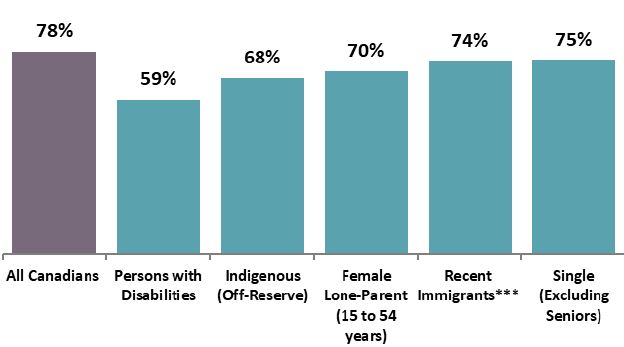
Figure 5 – Text version
| Vulnerable populations | Employment rate |
|---|---|
| All Canadians | 78% |
| Persons with disabilities | 59% |
| Indigenous (off-reserve) | 68% |
| Female lone-parent (15 to 54 years) | 70% |
| Recent immigrants*** | 74% |
| Single (excluding seniors) | 75% |
* The employment rate for Persons with Disabilities is for 2017.
** Unless otherwise specified, such as Female Lone-Parent.
*** Recent immigrants are those who immigrated to Canada within 10 years of the survey year.
Source: Statistics Canada, Labour Force Survey, Canadian Survey on Disability.
Canada has the highest education levels in OECD, but not all groups are participating equally
- On average, people with more education have higher wages
- Some groups have lower proportions with post-secondary education than the Canadian average, including Indigenous peoples (off-reserve), people with disabilities, single people (excluding seniors), and female lone-parents
- The proportion of recent immigrants with post-secondary education is higher than the proportion of all Canadians
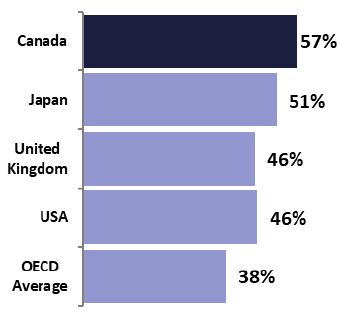
Figure 6 – Text version
| Country | Share of population |
|---|---|
| Canada | 57% |
| Japan | 51% |
| United Kingdom | 46% |
| USA | 46% |
| OECD Average | 38% |
* Refers to OECD definition of Tertiary education which excludes trade and apprenticeship education.
Figures are rounded.
Source: Organisation for Economic Cooperation and Development, Education at a glance: Educational attainment and labour-force status.
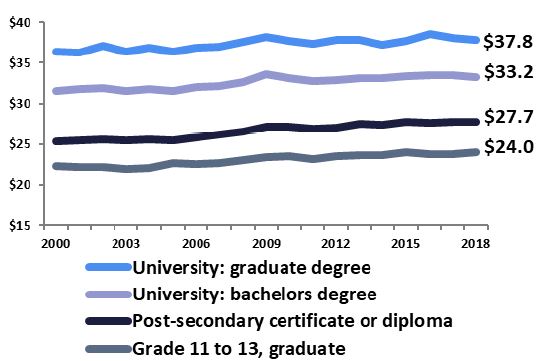
Figure 7 – Text version
| Year | Grade 11 to 13, Graduate | Post-secondary certificate or diploma | University: Bachelors degree | University: Graduate degree |
|---|---|---|---|---|
| 2000 | $22.27 | $25.33 | $31.55 | $36.37 |
| 2001 | $22.24 | $25.44 | $31.79 | $36.22 |
| 2002 | $22.24 | $25.64 | $31.94 | $37.07 |
| 2003 | $21.90 | $25.44 | $31.52 | $36.40 |
| 2004 | $22.08 | $25.55 | $31.76 | $36.89 |
| 2005 | $22.62 | $25.51 | $31.59 | $36.41 |
| 2006 | $22.54 | $25.77 | $32.05 | $36.90 |
| 2007 | $22.70 | $26.21 | $32.12 | $36.97 |
| 2008 | $23.01 | $26.57 | $32.64 | $37.62 |
| 2009 | $23.43 | $27.17 | $33.55 | $38.18 |
| 2010 | $23.55 | $27.22 | $33.10 | $37.69 |
| 2011 | $23.22 | $26.91 | $32.74 | $37.31 |
| 2012 | $23.56 | $27.09 | $32.92 | $37.81 |
| 2013 | $23.62 | $27.51 | $33.17 | $37.88 |
| 2014 | $23.59 | $27.45 | $33.18 | $37.30 |
| 2015 | $23.96 | $27.82 | $33.40 | $37.74 |
| 2016 | $23.72 | $27.70 | $33.52 | $38.54 |
| 2017 | $23.71 | $27.74 | $33.49 | $38.07 |
| 2018 | $23.96 | $27.72 | $33.22 | $37.80 |
Source: Statistics Canada, Labour Force Survey.
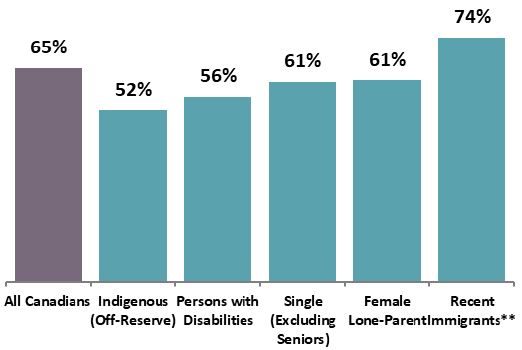
Figure 8 – Text version
| Vulnerable populations | Population share |
|---|---|
| All Canadians | 65% |
| Indigenous (off-reserve) | 52% |
| Persons with disabilities | 56% |
| Single (excluding seniors) | 61% |
| Female lone-parent | 61% |
| Recent immigrants** | 74% |
* Canadian post secondary education includes trades and apprenticeship, college and university.
** Recent immigrants are those who immigrated to Canada within five years of the survey year.
Source: Statistics Canada, 2016 Census of Population, Canadian Survey on Disability.
Canada is a prosperous country but some groups have income significantly below the average
- Real median after-tax incomes increased between 1976 and 2017
- Real median after-tax incomes for families and seniors have improved more than those of single people (excluding seniors)
- Some groups' real incomes are significantly below the national average, including single people (excluding seniors), people with disabilities, female lone parents, recent immigrants, and Indigenous peoples (off-reserve)
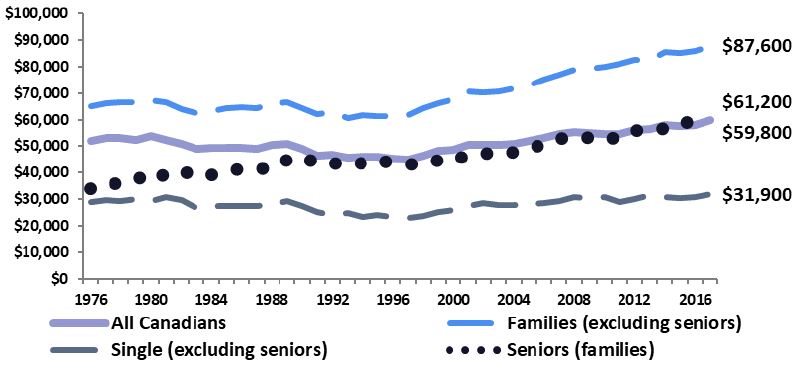
Figure 9 – Text version
| Year | All Canadians | Families (excluding seniors) | Single (excluding seniors) | Seniors (families) |
|---|---|---|---|---|
| 1976 | $52,200 | $65,100 | $28,800 | $34,100 |
| 1977 | $53,100 | $66,300 | $29,600 | $34,600 |
| 1978 | $53,100 | $66,500 | $29,200 | $36,600 |
| 1979 | $52,500 | $66,500 | $30,200 | $36,900 |
| 1980 | $53,800 | $67,400 | $29,300 | $40,500 |
| 1981 | $52,400 | $66,400 | $30,800 | $38,500 |
| 1982 | $50,800 | $64,000 | $29,800 | $40,800 |
| 1983 | $48,900 | $62,500 | $26,600 | $38,700 |
| 1984 | $49,400 | $63,200 | $27,500 | $39,200 |
| 1985 | $49,600 | $64,200 | $27,500 | $40,800 |
| 1986 | $49,300 | $64,600 | $27,400 | $41,300 |
| 1987 | $49,100 | $64,400 | $27,600 | $41,300 |
| 1988 | $50,400 | $66,200 | $28,100 | $41,900 |
| 1989 | $51,100 | $66,600 | $29,400 | $44,700 |
| 1990 | $49,000 | $64,500 | $27,400 | $46,400 |
| 1991 | $46,400 | $62,000 | $25,300 | $43,400 |
| 1992 | $46,900 | $62,700 | $24,100 | $43,600 |
| 1993 | $45,700 | $60,700 | $24,800 | $42,900 |
| 1994 | $46,000 | $61,800 | $23,500 | $43,700 |
| 1995 | $45,900 | $61,300 | $24,300 | $44,700 |
| 1996 | $45,200 | $61,500 | $23,400 | $43,800 |
| 1997 | $45,100 | $61,800 | $23,100 | $43,200 |
| 1998 | $46,300 | $64,500 | $23,700 | $43,000 |
| 1999 | $48,300 | $66,300 | $25,300 | $44,800 |
| 2000 | $48,600 | $67,600 | $26,000 | $44,800 |
| 2001 | $50,600 | $70,600 | $27,300 | $46,600 |
| 2002 | $50,500 | $70,100 | $28,600 | $47,300 |
| 2003 | $50,500 | $70,600 | $27,900 | $46,900 |
| 2004 | $50,800 | $71,600 | $27,800 | $47,800 |
| 2005 | $52,000 | $72,700 | $28,100 | $49,200 |
| 2006 | $53,100 | $75,100 | $28,500 | $50,800 |
| 2007 | $54,600 | $77,100 | $29,400 | $53,100 |
| 2008 | $55,300 | $78,800 | $30,700 | $53,000 |
| 2009 | $55,200 | $79,300 | $30,500 | $53,400 |
| 2010 | $54,700 | $80,000 | $30,700 | $52,200 |
| 2011 | $54,500 | $80,900 | $28,900 | $53,600 |
| 2012 | $56,000 | $82,600 | $30,200 | $56,100 |
| 2013 | $56,400 | $82,500 | $31,700 | $55,800 |
| 2014 | $57,900 | $85,500 | $31,000 | $56,800 |
| 2015 | $57,700 | $85,100 | $30,300 | $59,200 |
| 2016 | $57,900 | $86,100 | $30,800 | $58,700 |
| 2017 | $59,800 | $87,600 | $31,900 | $61,200 |
* Canadian Income Survey income variables are captured for persons 16 years or older.
Figures are rounded.
Source: Statistics Canada, Canadian Income Survey.
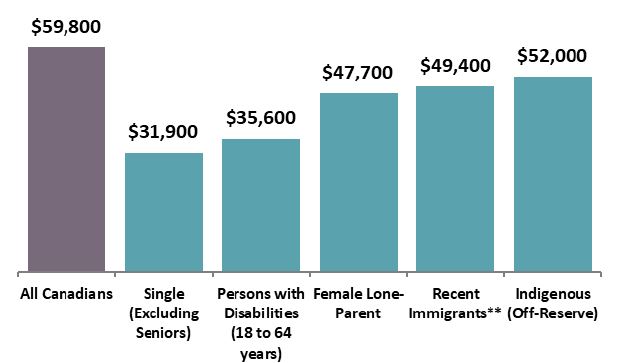
Figure 10 – Text version
| Vulnerable populations | Median income |
|---|---|
| All Canadians | $59,800 |
| Single (excluding seniors) | $31,900 |
| Persons with disabilities (18 to 64 years) | $35,600 |
| Female lone-parent | $47,700 |
| Recent immigrants** | $49,400 |
| Indigenous (off-reserve) | $52,000 |
* Canadian Income Survey income variables are captured for persons 16 years or older.
** Recent immigrants are those who immigrated to Canada within five years of the survey year.
Figures are rounded.
Source: Statistics Canada, Canadian Income Survey.
Homelessness and shelter occupancy rates remain high and some groups are at greater risk
- While the number of annual shelter users declined between 2005 and 2016, occupancy rates in shelters remained near all-time highs in recent years
- Some groups are at greater risk of homelessness. Groups over-represented among users of shelters in 2016 include single people, males, and Indigneous persons; 17% were unaccompanied youth aged 13 to 24
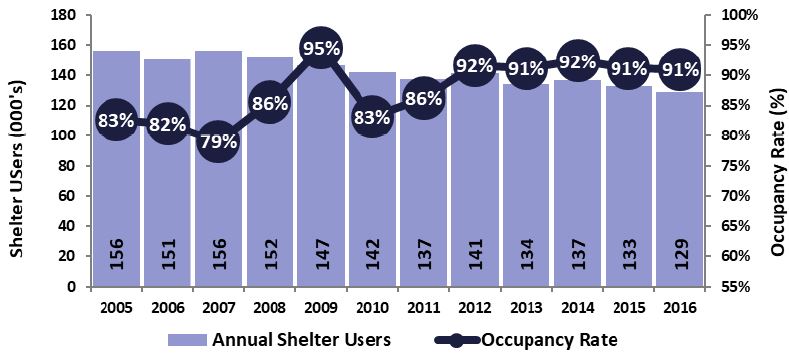
Figure 11 – Text version
| Year | Annual shelter users | Occupancy rate |
|---|---|---|
| 2005 | 156,000 | 83% |
| 2006 | 151,000 | 82% |
| 2007 | 156,000 | 79% |
| 2008 | 152,000 | 86% |
| 2009 | 147,000 | 95% |
| 2010 | 142,000 | 83% |
| 2011 | 137,000 | 86% |
| 2012 | 141,000 | 92% |
| 2013 | 134,000 | 91% |
| 2014 | 137,000 | 92% |
| 2015 | 133,000 | 91% |
| 2016 | 129,000 | 91% |
Source: Employment and Social Development Canada, National Shelter Study, 2005 to 2016.
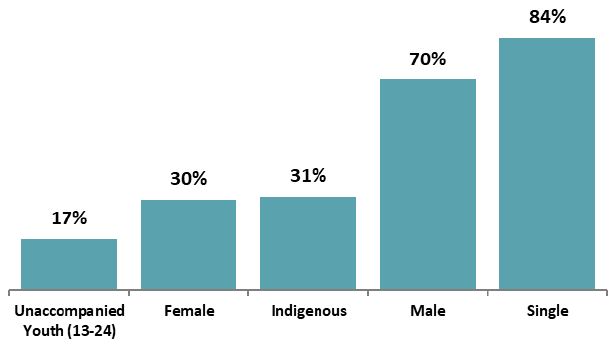
Figure 12 – Text version
| Shelter residents | 2016 |
|---|---|
| Unaccompanied youth (13 to 24) | 17% |
| Female | 30% |
| Indigenous | 31% |
| Male | 70% |
| Single | 84% |
Source: Employment and Social Development Canada, National Shelter Study, 2005 to 2016.
Data are current as of September 20, 2019.