
Youth Employment, Skills and Learning infographic – 2021
Alternate formats

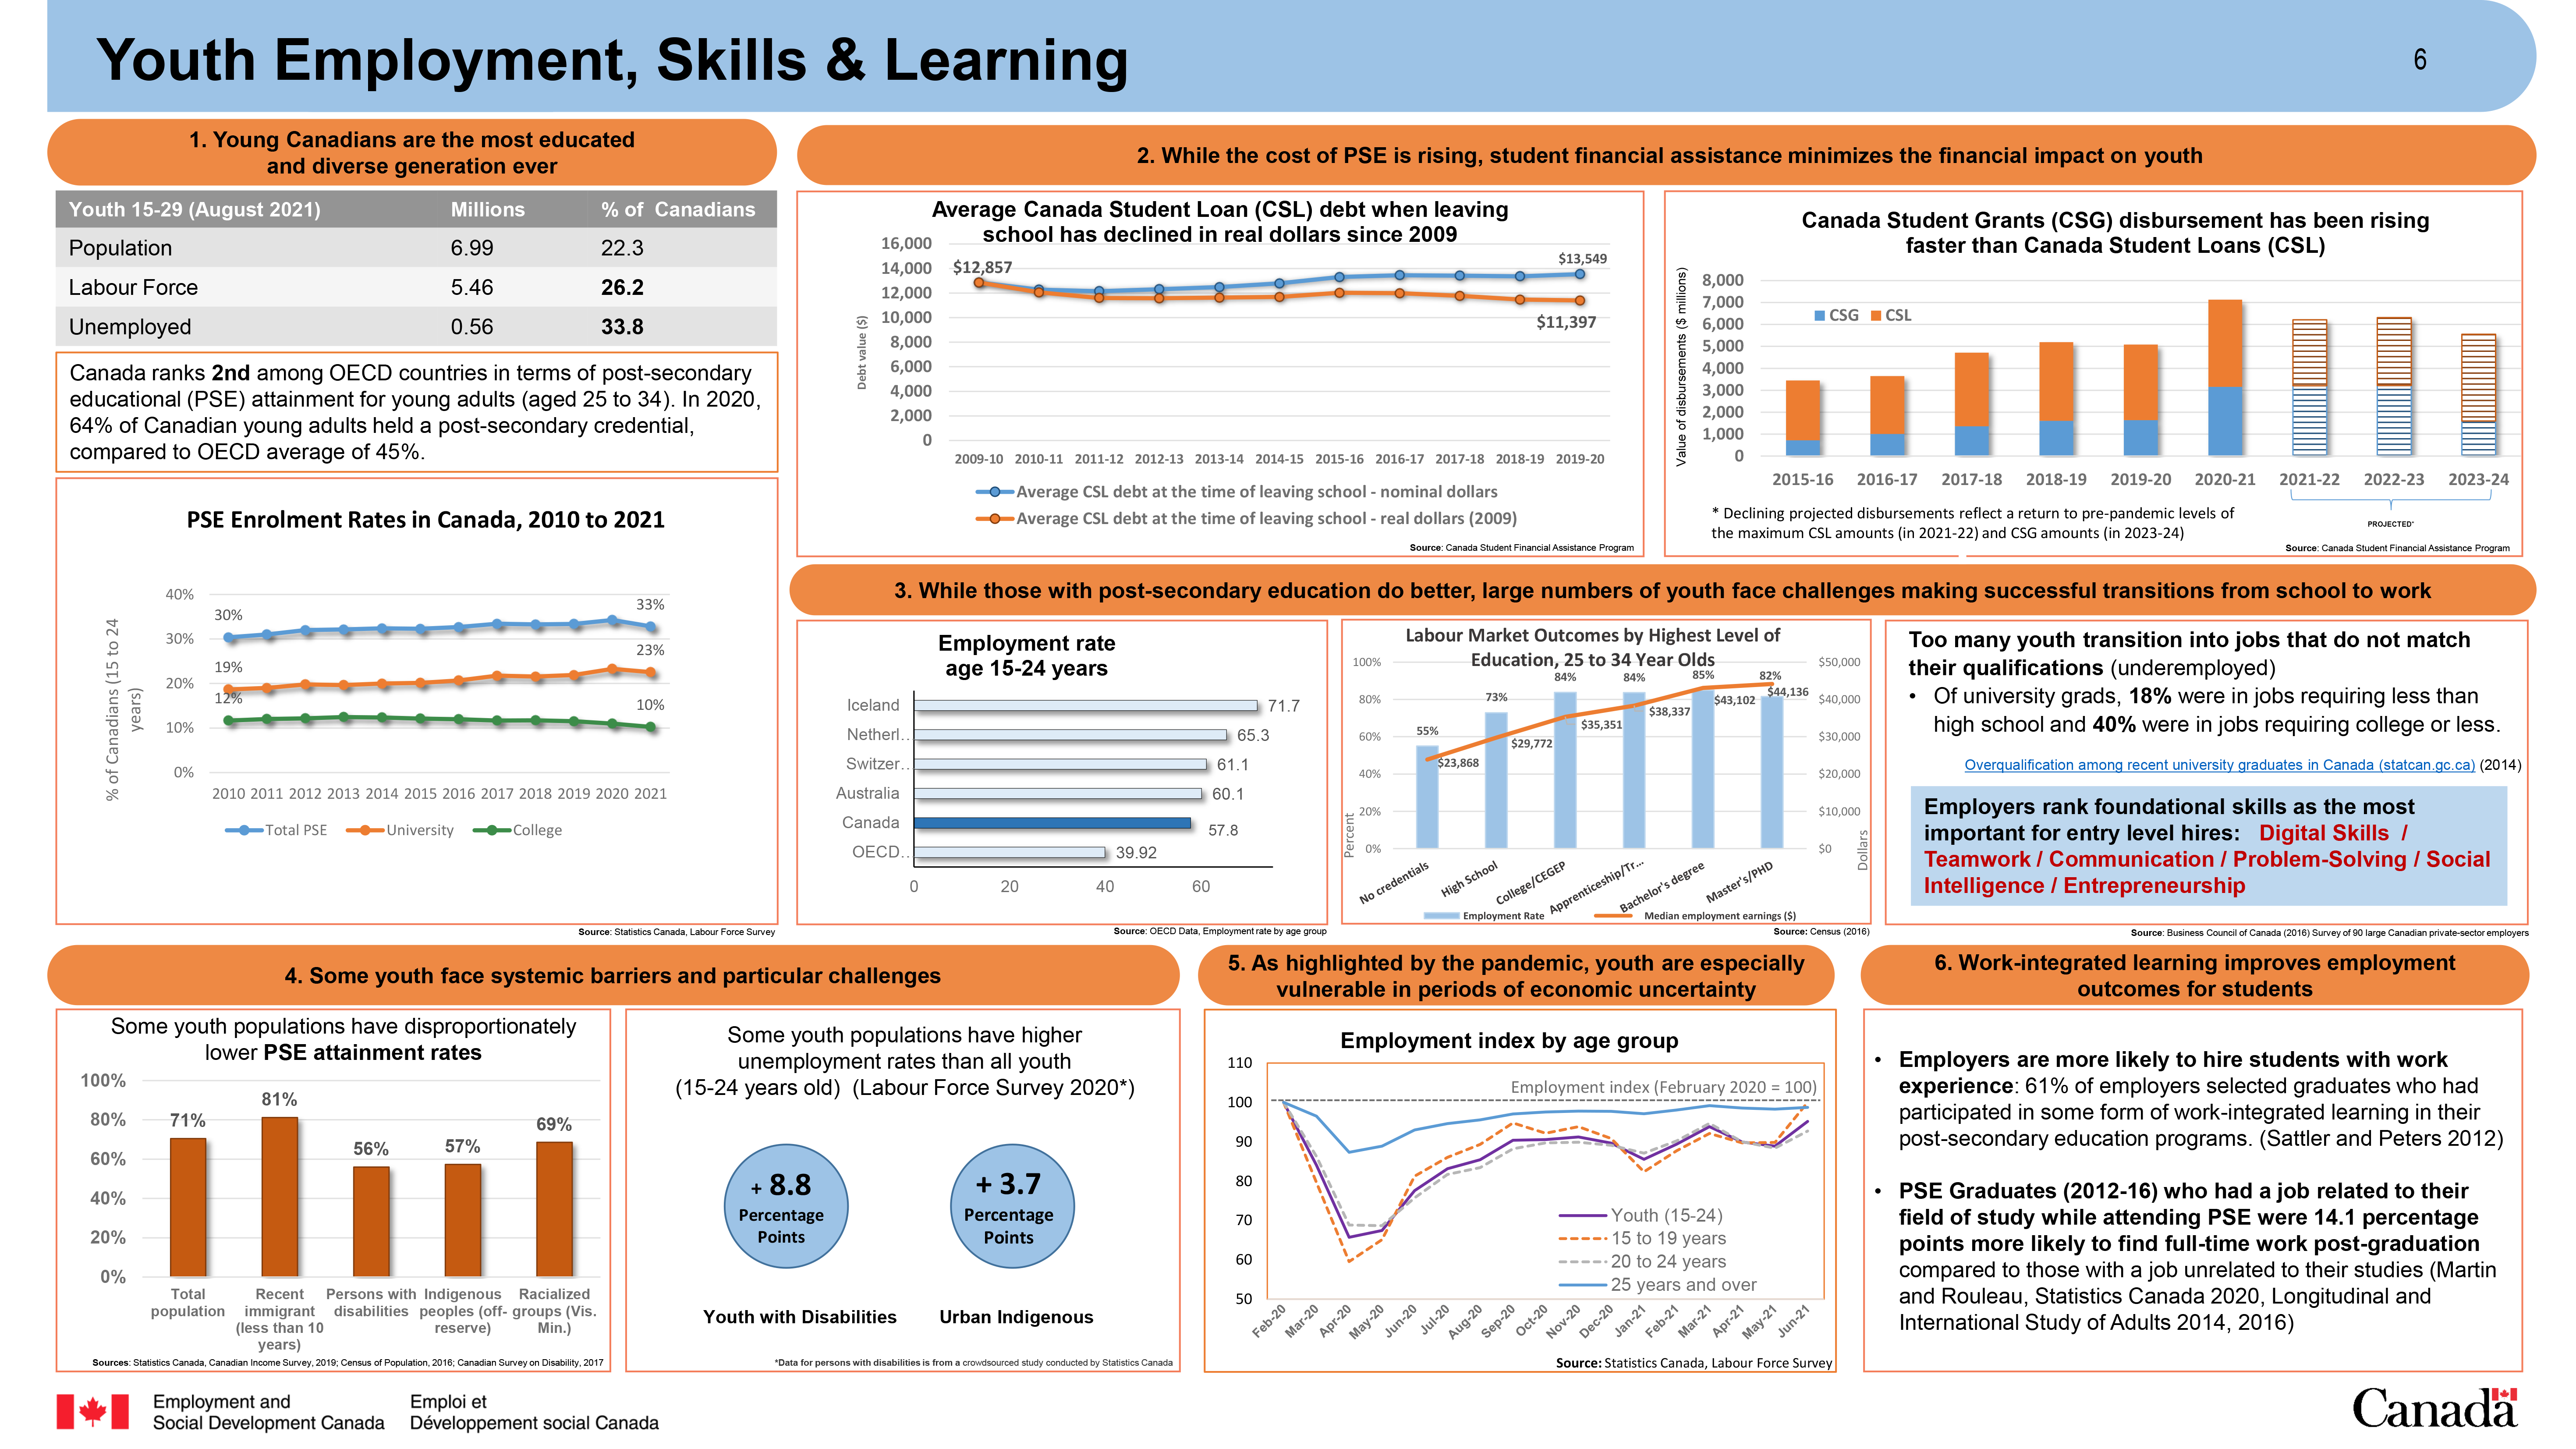
Figure 1: Text description
Youth Employment, Skills and Learning
1. Young Canadians are the most educated and diverse generation ever
Table 1: Youth at a glance| Youth 15 to 29 (August 2021) | Millions | Percent of Canadians |
|---|---|---|
| Population | 6.99 | 22.3 |
| Labour Force | 5.46 | 26.2 |
| Unemployed | 0.56 | 33.8 |
Canada ranks 2nd among the Organisation for Economic Co-operation and Development (OECD) countries in terms of post-secondary educational (PSE) attainment for young adults (aged 25 to 34). In 2020, 64% of Canadian young adults held a post-secondary credential, compared to OECD average of 45%.
Diagram 1 text: PSE Enrolment rates in Canada, 2010 to 2021
Percentage of Canadians (15 to 24 years) enrolled in PSE, 2010 to 2021| Year | College | University | Total PSE |
|---|---|---|---|
| 2010 | 12 | 19 | 30 |
| 2011 | 12 | 19 | 31 |
| 2012 | 12 | 20 | 32 |
| 2013 | 12 | 20 | 32 |
| 2014 | 12 | 20 | 32 |
| 2015 | 12 | 20 | 32 |
| 2016 | 12 | 21 | 33 |
| 2017 | 12 | 22 | 33 |
| 2018 | 12 | 22 | 33 |
| 2019 | 12 | 22 | 33 |
| 2020 | 11 | 23 | 34 |
| 2021 | 10 | 23 | 33 |
Bolded figures in chart:
- In 2010, 12% of Canadians (15 to 24 years) were enrolled in a college in Canada. This has decreased to 10% in 2021.
- In 2010, 19% of Canadians (15 to 24 years) were enrolled in a university in Canada. This has increased to 23% in 2021.
- In 2010, 30% of Canadians (15 to 24 years) were enrolled in post-secondary education in total. This has increased to 33% in 2021.
Source: Statistics Canada, Labour Force Survey
2. While the cost of PSE is rising, student financial assistance minimizes the financial impact on youth
Diagram 2 text: Average Canada Student Loan (CSL) debt when leaving school has declined in real dollars since 2009
Average Canada Student Loan (CSL) debt at the time of leaving school (2009 to 2010 and 2019 to 2020).| Year | Average Canada Student Loan Debt at time of leaving school – nominal dollars | Average Canada Student Loan debt at time of leaving school – real dollars (2009) |
|---|---|---|
| 2009 to 2010 | $12 857 | $12 857 |
| 2010 to 2011 | $12 281 | $12 060 |
| 2011 to 2012 | $12 155 | $11 597 |
| 2012 to 2013 | $12 314 | $11 575 |
| 2013 to 2014 | $12 480 | $11 626 |
| 2014 to 2015 | $12 783 | $11 680 |
| 2015 to 2016 | $13 306 | $12 024 |
| 2016 to 2017 | $13 456 | $11 989 |
| 2017 to 2018 | $13 416 | $11 770 |
| 2018 to 2019 | $13 367 | $11 463 |
| 2019 to 2020 | $13 549 | $11 397 |
Bolded figures in chart:
- In 2009 to 2010, the average CSL debt load at the time of leaving school in nominal dollars was $12,857
- In 2009 to 2010, the average CSL debt load at the time of leaving school in real dollars (2009) was $12,857
- In 2019 to 2020, the average CSL debt load at the time of leaving school in nominal dollars was $13,549
- In 2019 to 2020, the average CSL debt load at the time of leaving school in real dollars (2009) was $11,397
Source: Canada Student Financial Assistance Program
Diagram 3 text: Canada Student Grants (CSGs) disbursement has been rising faster than Canada Student Loans
Actual and Projected value of Canada Student Grants (CSGs) and Canada Student Loans (CSLs) disbursements (2015 to 2016 and 2023 to 2024).| Year | Canada Student Grant disbursement (million) | Canada Student Loan disbursement (million) |
|---|---|---|
| 2014 to 2015 | $717.7 | $2,723.1 |
| 2015 to 2016 | $719.5 | $2,722.3 |
| 2016 to 2017 | $1,014.6 | $2,627.2 |
| 2017 to 2018 | $1,364.9 | $3,352.1 |
| 2018 to 2019 | $1,614.1 | $3,575.4 |
| 2019 to 2020 | $1,634.8 | $3,449.1 |
| 2020 to 2021 | $3,159.6 | $3,968.8 |
| 2021 to 2022 (projected)* | $3,207.0 | $3,006.0 |
| 2022 to 2023 (projected)* | $3,219.0 | $3,096.0 |
| 2023 to 2023 (projected)* | $1,596.0 | $3,956.0 |
* (Asterisk): Declining projected disbursements reflect a return to pre-pandemic levels of the maximum CSL amounts (in 2021 to 2022) and CSG amounts (in 2023 to 2024).
Source: Canada Student Financial Assistance Program
3. While those with post-secondary education do better, large numbers of youth face challenges making successful transitions from school to work
Diagram 4 text: Employment rate of those aged 15 to 24
Canada ranks 5th amongst OECD countries in terms of employment rate by age group in 2019 (15 to 24 year-olds, percent in same age group)- Iceland: 71.7%
- Netherlands: 65.3%
- Switzerland: 61.1%
- Australia: 60.1%
- Canada: 57,8%
- OECD total: 39.92%
Source : OECD Data: Employment rate by age group
Diagram 5 text: Labour market outcomes by highest level of education, 25 to 34 year-olds
Labour market outcomes by highest level of education, 25 to 34 year-olds| Level of education | Employment rate – percentage | Median employment earnings – dollars |
|---|---|---|
| No credentials | 55 | $23,868 |
| High School | 73 | $29,772 |
| College/CEGEP | 84 | $35,351 |
| Apprenticeship | 84 | $38,337 |
| Bachelor’s degree | 85 | $43,102 |
| Master’s/PhD | 82 | $44,136 |
Source: Census, 2016
Too many youth transition into jobs that do not match their qualifications (underemployed):
- Of university grads, 18% were in jobs requiring less than high school and 40% were in jobs requiring college or less.
Source: Statistics Canada, 2014, Overqualification among recent university graduates in Canada.
Employers rank foundational skills as most important for entry level hires: Digital Skills / Teamwork / Communication / Problem-Solving / Social Intelligence / Entrepreneurship
Source: Business Council of Canada (2016) Survey of 90 large Canadian private-sector employers
4. Some youth face systemic barriers and particular challenges
Diagram 6 text: Some youth populations have disproportionately lower PSE attainment rates
The PSE attainment rate for the total population in Canada is 71%. In comparison, the PSE attainment rate for recent immigrants is 81%. The PSE attainment rate for persons with disabilities is 56%, 57% for Indigenous peoples living off-reserve, and 69% for racialized groups.Sources: Statistics Canada, Canadian Income Survey, 2019; Census of Population, 2016; Canadian Survey on Disability, 2017
Some youth populations have higher unemployment rates than all youth (15 to 24 years old) (Labour Force Survey 2020*).
Diagram 7 text: Unemployment rates for youth facing barriers
Unemployment rates for youth facing barriers| Youth with disabilities | plus 8.8 percentage points |
| Urban Indigenous | plus 3.7 percentage points |
*Data for persons with disabilities is from a crowdsourced study conducted by Statistics Canada
5. As highlighted by the pandemic, youth are especially vulnerable in periods of economic uncertainty
Diagram 8 text: Employment index by age group
Employment index by age group| Age | Feb-20 | Apr-20 | Jun-20 | Sep-20 | Jan-21 | Apr-21 | Jun-21 |
|---|---|---|---|---|---|---|---|
| Youth (15 to 24) | 100 | 65.7 | 77.6 | 90.4 | 85.5 | 89.9 | 95.2 |
| 15 to 19 years | 100 | 59.5 | 81.2 | 94.8 | 82.4 | 89.7 | 100.0 |
| 20 to 24 years | 100 | 68.9 | 75.7 | 88.2 | 87.1 | 90.0 | 92.7 |
| 25 years and over | 100 | 87.3 | 93.0 | 97.0 | 97.1 | 98.5 | 98.7 |
Source: Statistics Canada, Labour Force Survey
6. Work-integrated learning improves employment outcomes for students
- Employers are more likely to hire students with work experience: 61% of employers selected graduates who had participated in some form of work-integrated learning in their post-secondary education programs. (Source: Sattler and Peters 2012)
- PSE Graduates between 2012 and 2016 who had a job related to their field of study while attending PSE were 14.1 percentage points more likely to find full-time work post-graduation compared to those with a job unrelated to their studies. (Source: Martin and Rouleau, Statistics Canada 2020, Longitudinal and International Study of Adults 2014, 2016)