
Canada Education Savings Program: Summative Evaluation Report
Official title: Canada Education Savings Program (CESP): Summative Evaluation Report, Final Report, prepared November 6, 2015 by Evaluation Directorate, Strategic and Service Policy Branch, Employment and Social Development Canada.
Executive summary
This summative evaluation of the Canada Education Savings Program (CESP) examines the performance of the CESP. The CESP, which includes the Basic Canada Education Savings Grant (CESG), the Additional-CESG (A-CESG) and the Canada Learning Bond (CLB), provides incentives to save for post-secondary education (PSE) using Registered Education Savings Plans (RESPs). In addition to answering specific evaluation questions, the evaluation examines to what extent the CESP is achieving its objective, which is “…ensuring that families can better save for their children’s future education by providing stronger incentives through the CESP.” Footnote 1
This report summarizes the evidence collected from 15 studies prepared specifically for this evaluation. Many other studies were also used to complement these findings. Preliminary findings from the evaluation were presented at the Departmental Evaluation Committee meeting in March 2014.
Main findings
Program relevance
Do PSE costs justify the need for the CESP? Do the objectives of the CESP align with federal government priorities? How do grants and bonds motivate people to save?
The rationale for the CESP is still justified by the continuous increase in PSE-related costs. Government of Canada and Employment and Social Development (ESDC) priorities emphasize the importance of the program and PSE. To achieve more savings for PSE among low-income families, the literature and international comparison have demonstrated that matching contributions (i.e. grants) – such as the CESG – may be the most appropriate incentive to increase saving for PSE.
CESP use
Are more low-income families saving for PSE in RESPs? What are the take-up rates and their trends? Has there been a further change in savings patterns since the A-CESG and CLB were implemented?
The cumulative level of RESP assets has increased from $2.4 billion in 1997 to $40.5 billion in 2013. In 2013, $883 million in grants were disbursed via the CESP. The number of low-income families with RESPs continues to increase – reaching 400,000 families with children in 2012.
The proportion of children under 18 years of age who received the CESG at least once in their life has increased from 9.7% in 1998 to 47.1% in 2013 (i.e. of the roughly 6.9 million children under the age of 18 in Canada in 2013, over 3.2 million had an RESP and had received the Basic CESG). Almost 2.5 million of these beneficiaries, or 75.3%, made a contribution and received the Basic CESG in 2013. Of these, 860,000 (or about 35%) received the A-CESG. The number of A-CESG beneficiaries receiving an additional 10% or 20% grant in a given year increased from 120,000 in 2005 to 860,000 in 2013. As a proportion of the entire population of A-CESG eligible children in a given year, this represents an increase from 2.7% in 2005 to 17.4% in 2012.
RESP take-up rates (i.e. the percentage of children under 18 years of age with an RESP) vary significantly by family income, ranging from 25.2% for families with income below $25,000 to 70.1% for families with income over $125,000 in 2012, although RESP take-up quadrupled for low-income families between 1999 and 2012. This four-fold increase may have been caused more by the Basic CESG, as the rate of increase did not change noticeably with the introduction of the A-CESG. However, it was shown that the CLB contributed to a significant increase in RESP take-up among low-income families.
Findings indicated that RESP take-up rates are also strongly influenced by parental aspirations, having a pre-existing savings habit, and having good financial knowledge and awareness of the benefits of using RESPs.
Average annual RESP contributions adjusted for inflation (in $2006 among those who contributed) declined from $1,436 to $1,331 over the 1998 to 2013 period. In 2013, those who only received the Basic CESG had average contributions of $1,491 – about $500 more than those also in receipt of the A-CESG and/or CLB. Contribution levels in 2013 varied significantly by province/territory and were highest in the territories, British Columbia and Ontario (all over $1,600) and lowest in New Brunswick ($1,127).
In addition, it was found that beneficiaries who were registered for the A-CESG were more likely to receive RESP contributions in a given year than other families with RESPs, indicating a positive savings effect for families who take a proactive approach.
PSE savings outside RESPs
To what extent are Canadians saving for PSE outside of an RESP?
In 2013, one-quarter of families with an RESP also saved for PSE using other means, as did 38.6% of families without an RESP. Among the former group, the most common reasons for saving outside of RESPs were ‘diversification’ (21%), ‘easy access to funds’ (17%), and ‘either maximized the annual CESG received or the lifetime RESP maximum of $50,000’ (7%). The most common reasons given by families without RESPs included ‘having accessibility to funds’ (17%), ‘not having gotten around to it yet’ (14%), and a lack of RESP awareness (11%). Among families without RESPs who were surveyed, many showed a lack of understanding of RESPs and of the CESP.
RESP and CESP withdrawals
To what extent is the CESP improving the affordability of PSE? What impact do RESPs and the CESP have on student loan and grant amounts?
Overall, RESP withdrawals reached over $2.7 billion in 2013, of which $1.7 billion were PSE contribution withdrawals and $1 billion were Education Assistance Payments (EAPs). Footnote 2 About 17% of all PSE students made an RESP withdrawal in 2013, up from less than 0.3% in 1998. The average annual RESP withdrawal increased from $3,705 to $7,673 over this period.
Students with RESPs had smaller student loans on average. This result may in part be explained by the fact that RESP withdrawals reduce student loans dollar for dollar, except for a $100 per week in-study exemption for EAPs and other sources of income. A new federal policy is currently being rolled out to exempt contribution withdrawals from student loan calculations. However, information on the effect of RESP withdrawals on eligibility for student loans and grants is not readily available to the public.
Efficiency and economy
To what extent does CESP funding go to people who would not otherwise have saved for PSE? What is happening with RESP contributions at the higher income levels? How efficient is the CESP delivery model?
Families with higher incomes require little encouragement to save for the PSE of their children as they have significantly more financial resources at their disposal and they were already saving for PSE prior to the introduction of the CESP in 1998. Results show that although 60.0% of families with children aged 17-18 years old (and with a household income of $80,000 or more) had PSE savings in 1999, only 11.5% had RESPs. Due to CESP rules Footnote 3 , most of these children were never eligible for the CESG. By 2012, RESP take-up among these families with children of all ages had increased to 63.8%. Therefore, it appears that much of the increase in RESP take-up for these families is due to a change in the way they save for PSE.
Furthermore, it was estimated that over $400 million in grants (or 49% of all CESP expenditures) were distributed to families with a household income of $90,000 or more in 2013, of which $280 million (or 32% of CESP expenditures) went to families earning $125,000 or more.
Regarding the effectiveness of the CESP delivery model, the CESP appears to be efficiently delivered (in collaboration with external stakeholders).
Recommendations
- Explore ways for funds to more effectively reach families with the greatest need for assistance and encouragement to save for their children’s future PSE.
- Complement outreach efforts on promoting awareness with promoting understanding of the CESP savings incentives in order to support increased participation among all Canadian families.
Management response
Management acknowledges the contribution of those who participated in the summative evaluation of the Canada Education Savings Program (CESP). Management agrees with the evaluation findings and proposes the following Management Response.
Since its introduction in 1998, the CESP has provided savings incentives to encourage and reinforce the importance of early and sustained saving for a child’s post-secondary education (PSE), specifically using Registered Education Savings Plans (RESPs). The CESP provides two savings incentives linked to RESPs: the Canada Education Savings Grant (CESG) and the Canada Learning Bond (CLB).
The results of the Summative Evaluation of the CESP show that the CESP has been effective in encouraging savings for children’s PSE and that the CESP has achieved some notable results. The program’s design and outreach efforts are especially focused towards lower income families. The evaluation shows that the proportion of beneficiaries from lower-income families has been improving considerably, and the proportion of program disbursements to lower-income families has also been increasing. The Additional Canada Education Savings Grant (A-CESG) and the CLB explicitly direct more funds to lower income families and there are limits to the grants that one can receive to mitigate extra gains by high income savers.
In addition, given the CESP’s unique program delivery model, there are constraints within which it must function: over ninety RESP promoters interface directly with Canadians (subscribers and beneficiaries), RESP policy is under the purview of the Department of Finance and administered by the Canada Revenue Agency (CRA) under the Income Tax Act. The roles of these various program delivery partners are a significant consideration.
The CESP has made considerable progress by ensuring newly eligible families are informed of their CLB eligibility through direct, quarterly mailings including information on how to access the CLB. The CESP has established strong partnerships with community-based organizations (CBOs) to address and mitigate barriers to accessing the CLB including local sign-up events supported by Service Canada and RESP promoters. In addition, the CESP has targeted specific, large RESP promoters to ensure existing clients, who had already overcome the barriers and opened a RESP, were accessing the CLB (based on their eligibility).
Key findings
Total savings in RESPs
- The CESG and the CLB have encouraged Canadians to amass a substantial amount of savings in RESPs, rising to $40.5 billion as of 2013.
- The rise in the amount of RESP funds to assist the PSE of Canadian students has been equally striking with nearly $3 billion available to help with the financing of any PSE course of studies as of 2013.
Program take-up
- The evaluation has shown that the CESP has encouraged an increasing number of Canadians (47.1% as of 2013) to open RESPs and receive CESP benefits.
- This increase in take-up has been widespread across all economic groups. The growth in RESP take-up for families in the lowest income bracket ($0 to $24,999 in family income) grew fourfold in 2012, while doubling in the highest income brackets.
- Growth in take-up for those in permanently low-income families (i.e. families who remained below the lowest A-CESG threshold) increased by more than six times between 1999 and 2012.
- The Evaluation’s Survey of RESP Subscribers and Non-Subscribers found that Government support (via either the CESG or CLB) was the most oft-cited reason given by respondents (approximately 60% of all cases) for using an RESP.
- The research also showed that cultural and attitudinal factors are important in encouraging access to PSE, and that holding and building savings over the long-term may play a role in fostering aspirations and expectations for PSE.
Balancing CESP disbursements
- The improvement in the CESP’s reach to families who are most in need of financial assistance to help save for their children’s future PSE is shown by the fact that the proportion of the CESP’s disbursements directed to lower-income families (under $45,000 in income in 2012) has been increasing (8.9 percentage points between 1999 and 2012). As a result, families who are above the A-CESG thresholds (over $90,000 in income in 2012) have received a decreasing share of payments (3 percentage points), while the share of their population grew significantly (by 9.4 percentage points).
- The proportion of disbursements going to families with incomes greater than $125,000 stayed the same despite having an almost 100% increase in the proportion of the population in this income group over the same period.
- Undoubtedly, the introduction of the A-CESG benefits helped to improve the balance in Government of Canada disbursements to Canadian families.
Take-up of additional CESG and CLB
- The evaluation found that some 34% of eligible A-CESG families who made RESP contributions in 2012 did not receive this additional grant. Similarly, about 23% of CLB-eligible families who had an RESP did not receive the CLB. The program recognized this as an issue, and in 2013 the CESP introduced a new simplified application form in which subscribers are automatically tested for the A-CESG and the CLB (i.e. “opt-in” design). This approach leverages conclusions from the field of behavioural economics, namely that providing the opportunity to “opt in” as a default in the application process strengthens access and participation. The overall trends shown in the evaluation demonstrate the ability of the program to encourage a significant portion of all Canadians, even persistently low-income families, to save for their children’s PSE, demonstrating the important contribution the CESP has made in encouraging savings in RESPs for children’s future PSE. The Department can foresee a future where the majority of children will have RESPs available to help pay for their PSE.
Recommendations
-
Explore ways for funds to more effectively reach families with the greatest need for assistance and encouragement to save for their children’s future post-secondary education.
- This recommendation is in-line with the Canada Education Savings Act (CESA) which requires that “The Minister shall take measures necessary to carry out the purpose set out in section 3, including making known to Canadians, through informational and promotional activities, the existence of CES grants and Canada Learning Bonds and any terms and conditions.”
- Management agrees that it is necessary to focus its efforts to attempt to reach out to families with the greatest need. The CESP will continue to adopt innovative approaches that will foster and sustain new partnerships with community-based organizations, RESP promoters and other federal and provincial departments, including the Financial Consumer Agency of Canada (FCAC), with a focus on targeted community based activities. This will include sustained efforts and support to build on the success of the first ever Education Savings Week held in November 2014.
- The CESP will work with the ESDC’s Innovation Change Lab to pilot new approaches and products to better encourage enrollment in the CLB.
-
Continue to undertake outreach efforts on promoting both awareness and understanding of the CESP savings incentives to support increased participation among Canadian families.
- The CESP management agrees that awareness will always be an important initial step, but will explore ways to improve understanding (and reduce misunderstanding) about its savings incentives.
- In support of these efforts the CESP, in partnership with the Public Affairs and Stakeholder Relations Branch (PASRB) will develop a new three-year communications and engagement strategy.
1. Introduction
Following the implementation of the Canada Education Savings Grant (CESG) in 1998, which was introduced to encourage Canadians to save for the post-secondary education (PSE) of their children in Registered Education Savings Plans (RESPs), a first formative evaluation of the program was completed in April 2003. The report indicated that the CESG encouraged saving for the PSE of children, as savings in RESPs increased considerably following the introduction of the grant. However, the evaluation also noted that awareness of (and participation in) the program was significantly lower among low-income families.
As a response to the finding of low participation on the part of low-income families, in October 2004 enhancements to the CESG (referred to as the “additional” CESG (A-CESG)) and the creation of the Canada Learning Bond (CLB) were announced. A second formative evaluation of the revised Canada Education Savings Program (CESP – which includes the CESG, A-CESG and CLB) was completed in 2009 and examined the preliminary impacts of these two new measures. Evidence indicated that the full effect of the two new measures had not yet taken place. Therefore, the second formative evaluation recommended that the CESP be re-evaluated when CESG participation growth rates begin to stabilize
Evaluation began developing a framework for a summative evaluation of the CESP. The full list of 51 evaluation questions can be found in Appendix 1, which also indicates where each question is answered in the report and the lines of evidence used. Footnote 4 A brief description of each of the 15 lines of evidence is provided in Appendix 2. An interim evaluation report presenting preliminary findings of the evaluation was presented at the Departmental Evaluation Committee in March 2014.
The CESP logic model, shown in Appendix 3, describes program activities and outputs (e.g. grant payments) and how they lead to desired outcomes. The current evaluation examines the following desired outcomes: 1) families save for their children’s PSE in RESPs; 2) low-income families open RESPs; 3) children under 18 have savings for PSE; 4) Canadians make more informed choices about saving for post-secondary; and 5) Canadians are able to finance their participation in PSE. The examination of the effect of the CESP on the long-term strategic outcome (a skilled, adaptable and inclusive labour force and an efficient labour market) is postponed to a future evaluation, as are the issues of program delivery and the impact of the CESP on PSE access.
1.1 Limitations
It will not be until 2015 that CESG beneficiaries who were born in 1998 will reach the age of 17 and begin attending a PSE institution. They will be the first age cohort that could fully benefit from CESG payments to a subscriber’s RESP for the 17 years that program funding is paid and have the full amount of RESP assets possible. Thus, the full impact of the CESG on some aspects (e.g. RESP assets) cannot be measured yet. In addition, the impact of RESPs on financing PSE and reducing student debt also will not be possible to measure for an even longer period of time.
Another limitation is that some of the lines of evidence use dated Statistics Canada surveys. Footnote 5 However, most of the findings from these surveys were corroborated with more recent data sources, including data from the CESP administrative database, a survey conducted by Evaluation during the 2013-2014 fiscal year, and analyses involving linked Canada Revenue Agency (CRA) T1 income data and CESP administrative data up to and including the 2012 taxation year.
Finally, although random sampling was used for the 2013-2014 Evaluation survey, the survey data are un-weighted and the results should not be extrapolated to the entire population. However, since the regional pattern of response for the actual sample is very close to the distribution of the sample that would be expected, this provides some confidence to the reliability of the random sampling approach.
2. Background information
2.1 RESPs and CESP incentives
RESPs were introduced in 1972 and allow contributions to grow tax-free until beneficiaries attend a PSE institution. Although there is no longer an annual contribution limit, there is a lifetime contribution limit per beneficiary, which has been $50,000 since 2007. Once a beneficiary begins attending a PSE institution, RESP funds can be withdrawn and are paid out as contribution withdrawals (also referred to as Refund of Contributions or ROCs by the Canada Student Loans Program (CSLP)) to the subscriber and Education Assistance Payments (EAPs) to the beneficiary depending on the details of the RESP contract. Footnote 6 EAPs include accumulated investment earnings in the RESP and government education savings incentives. RESP contributions are withdrawn tax-free. However, EAPs are taxable to the beneficiary attending PSE (since many PSE students have little or no income EAPs are often withdrawn tax-free or at a low tax rate).
The CESP encompasses three specific measures: Footnote 7
- the CESG,
- the A-CESG and,
- the CLB.
They are each discussed in turn. Footnote 8
The Basic CESG was introduced in 1998 and provides a grant of 20% on the first $2,500 of annual RESP contributions for children until the end of the calendar year during which they turn 17. Footnote 9 Unused grant room can be carried forward. Footnote 10
The A-CESG came into effect on January 1, 2005. The A-CESG amount depends on the net family income of the beneficiary’s primary caregiver(s):
- If net family income Footnote 11 was below $43,953 in 2013, the A-CESG was 20 cents for every dollar on the first $500 of annual contributions into an RESP (i.e. a maximum of $100); and
- If net family income was between $43,953 and $87,907 in 2013, the A-CESG was 10 cents for every dollar on the first $500 of annual contributions into an RESP (i.e. a maximum of $50).
It should be noted that the unused A-CESG room cannot be carried forward (in contrast to unused CESG grant room).
The CLB was introduced in Budget 2004. To be eligible for the CLB, the beneficiary’s primary caregiver(s) must be receiving the National Child Benefit Supplement and the child must be born on or after January 1, 2004. To receive the CLB, an individual must open an RESP and apply for the CLB, but contributions are not required.
The amount of the CLB is equal to the sum of the following amounts, and can add up to a lifetime maximum of $2,000 per child:
- $500 for the first year of eligibility for the National Child Benefit Supplement, up to and including the child’s 15th year; and
- $100 in each subsequent year, up to and including the child’s 15th year. Footnote 12
2.2 Objectives of CESP measures
The CESG was introduced in Budget 1998 along with enhancements to the Canada Student Loans Program (CSLP) and the creation of the Canada Millennium Scholarship Foundation as part of the Canadian Opportunities Strategy. The strategy proposed action on many fronts, including promoting access to PSE by helping students in financial need cope with rising costs and helping families save for their children’s education in RESPs.
Part of this strategy aimed to address the challenge of “encouraging families to save early for their children’s education”. As stated in the Education Savings Act, the objective of the CESG is to encourage the financing of children’s PSE through savings from early childhood in RESPs. And, according to Budget 1998 (page 13), “…to ensure families can better afford higher education for their children by providing stronger incentives for saving through the new CESG…”
As mentioned in the introduction, the government response to the low RESP participation by low- and middle-income families was the introduction of the A-CESG and CLB. The basic objective of the A-CESG is to strengthen financial assistance for low- and middle-income families who want to save for the PSE of their children. The CLB was implemented with a similar objective to the A-CESG – to help modest-income families to start saving early for the PSE of their children – but without requiring contributions.
3. Relevance of CESP in 2014
This section examines questions related to the relevance of the CESP. Three of the key evaluation questions in this section include:
- Do PSE costs justify the need for the CESP?
- Do the objectives of the CESP align with federal government priorities?
- How do grants and bonds motivate people to save?
3.1 PSE costs
To examine the relevance of the CESP, it is important to outline the context in which it operates. PSE credentials are becoming increasingly important in the labour market. As tuition fees and other PSE-related costs reach several thousands of dollars per year, most parents are expected to pay some portion of the PSE costs of their children (based on the CSLP needs assessment), which can be easier if parents save for PSE. The evaluation acknowledges that not all low-income families should save for PSE, as immediate financial demands (for food, shelter, etc.) can alone be overwhelming when these families face financial hardship. Footnote 13 In this overall context, different levels of government provide financial support for PSE students through different means such as loans, grants, and tax incentives (in addition to providing incentives for parents to save for the PSE of children via the CESP).
Although just one element of total PSE costs, total required fees (tuition and additional fees Footnote 14 ) for full-time domestic undergraduate university students in Canada Footnote 15 were $3,884 in 2000-2001 and estimated at $6,253 in 2013-2014. Footnote 16 This represents a 61% increase, twice that of inflation. Footnote 17 Although average public college tuition fees are not as high as university tuition fees, they increased at roughly the same rate. Footnote 18 In addition to outpacing the rise in prices in the economy, the growth in undergraduate university and college fees has also significantly outpaced the rise in net family income, albeit less so for families in the highest income tercile. Thus, rising tuition and additional fees appear to justify the need for the CESP to encourage PSE savings, although this need is clearly lower for those in the highest income tercile. Footnote 19
Accounting for living expenses as well, TD Canada Trust estimated that the overall cost of pursuing a four-year undergraduate degree starting in 2011 was around $80,000 (for students living away from home all four years). Footnote 20 This estimate is similar to estimates contained in the Actuarial Report on the Canada Student Loans Program (CSLP), where average total student expenses (which includes tuition fees, books, shelter, food and transportation) for 2010-2011 were estimated to be $16,100. Footnote 21 These expenses are projected to first surpass $20,000 annually in 2018-2019 and to eventually hit $36,400 in 2035-2036 (projections based on annual increase ranging from 2.8% to 3.8%). These findings are also in-line with results from the 2013 CESP survey, where parents with children under 18 years of age expected an annual cost of roughly $20,000 per year once their child went onto PSE. Footnote 22
To help cover rising PSE costs, many students (particularly those from low- and middle-income families) might have to rely increasingly on employment income (either while in study or prior to PSE) and student loans and grants. Footnote 23 Not surprisingly, this will have an impact on student debt levels which, according to a 2013 Bank of Montreal Student Survey, are already expected to be $26,297 for current graduating students. Footnote 24 Similarly, a 2012 Canadian University Survey Consortium survey noted that graduating students reported an average total debt of $24,579. Footnote 25 Given projected PSE costs in the future, student debt levels are expected to continue to increase – although this will be somewhat mitigated as more students with RESP savings enter colleges and universities and as parental incomes and starting salaries increase over time.
3.2 Alignment with federal government priorities
The department reiterated the importance of the CESP in the 2013-2014 Report on Plans and Priorities by underlining the importance of “…reducing barriers to education by providing financial assistance to individuals as well as incentives to save for a child’s post-secondary education”. In January 2014, the Minister of State reiterated the importance of RESPs and the CLB by mentioning that “Our government recognizes that access to post-secondary education is vital, not only for a young person’s future, but also for Canada’s long-term growth and prosperity. An RESP, supplemented with the Canada Learning Bond, helps modest-income families make post-secondary education a reality for their children”. Footnote 26 These and other recent references to the CESP and RESPs clearly show that education, a knowledge society and saving for PSE continue to be a priority for the federal government.
3.3 Efficient incentives to increase savings
The effectiveness of grants and bonds in motivating people to save in general is discussed below. This is an important discussion because it speaks to the relevance of the CESP and whether the proper incentive(s) to invest in RESPs are being offered.
Theory suggests that incentives which promote general savings could result in three strategies (or a combination of the three): (i) individuals divert savings from another savings vehicle in order to take advantage of the incentive (i.e. no net increase in total savings); (ii) individuals reduce their consumption to take advantage of the incentive, leading to an increase in overall savings; or (iii) individuals save less of their own money because the incentives enables them to reach the same savings goal without contributing as much of their own money. The two current approaches under the CESP to increase PSE savings are matching individual contributions (CESG) and providing lump sum amounts to account holders (CLB). A third possible approach (default participation that has been tested in other jurisdictions) is also discussed.
Although not specifically related to PSE, the literature on retirement savings indicates that matching contributions had positive but modest effects on participation (e.g. a 25% matching contribution was associated with a 5% participation increase). Footnote 27 Madrian (2012) summarized the results of matching contributions by indicating that “a matching contribution increases savings plan participation and contributions, although the impact is less significant than the impact of non-financial approaches [automatic enrollment, simplification, planning aids, reminders, etc.]”. Although matching contributions are shown to increase savings participation, the effect of matching contributions on the savings rate (i.e. amount saved) was usually found to be small and not always statistically significant.
The matching threshold appears to have a greater impact than the matching rate. For instance, a matching contribution rate of 25% on a higher maximum level of contributions (e.g. $5,000) was associated with higher savings than a matching contribution rate of 50% on a lower maximum level of contributions (e.g. $2,500). Footnote 28
Benjamin and Smart (2011) examined the effect of RESPs/CESP on savings behaviour and their results indicated an increase in RESP balances since the introduction of the CESP, but there was little evidence that overall net financial assets increased among eligible households. In another study, Benjamin and Smart (2012) reiterated this by indicating that “the main effect of the CESP may be to induce substitution between tax-preferred assets, rather than to increase overall household saving or educational attendance.” Footnote 29 Nonetheless, they conclude that “the RESP Program may have its greatest impact in serving to educate households to plan ahead for the financing of university”.
The former Child Trust Fund (CTF) in the United Kingdom offers an example of lump-sum contributions, as well as default participation (i.e. automatic enrolment if an account was not opened within a year). Launched in 2005, the CTF provided a universal benefit (£250 or £500) for children at birth and when children reached seven years of age. Families were eligible to initially contribute up to £1,200 annually (increased to £4,000 later on), and savings grew tax free. Footnote 30
An evaluation of the CTF Footnote 31 indicated that the majority of parents (78%) opened a CTF account by themselves (including 67% of low-income parents) but only about 37% of CTF accounts received an individual contribution. Where accounts were opened automatically by the government, only 9% received individual contributions.
Finally, an experimental study Footnote 32 from Oklahoma showed that those who had a 529 plan Footnote 33 (an education savings plan operated by a state or educational institution designed to help families set aside funds for future college costs) opened for them with an initial deposit, matching incentives, program materials and regular statements were more likely to have received contributions than children who did not benefit from these advantages. Footnote 34 However, evidence was mixed regarding the effect on actual amounts saved. It was shown that the program mainly benefits higher-income families. Footnote 35
The U.K. experience with the CTF and the experimental study in Oklahoma suggest that automatic enrolment (which currently requires income-testing consent on behalf of potential participants) would significantly increase participation in the programs examined, but for the CLB the issue is slightly different as CLB receipt does not require any contributions or savings. The U.K. experience with the CTF suggests that if fully automatic CLB enrolment was feasible/practical (which it currently may not be due to the requirement of income-testing consent on behalf of potential participants), it could significantly increase RESP participation, but it may not necessarily affect individual RESP contributions – thereby not having much impact on encouraging PSE savings using RESPs. These findings are supported by the literature findings from Madrian & Shea (2001), Connelly and Kohler (2004), and Choi, Laibson, and Madrian (2004). Thus, it would not be the most efficient way of encouraging PSE savings using RESPs.
The literature presented here suggests that the current federal approach of grants and bonds provides an appropriate incentive for low-income families to save for PSE. In the case of the CLB, the financial situation of many of these families might preclude them from making RESP contributions. As evidence, the Survey of Household Spending (SHS) study showed that families in the lowest income category spent about 82-85% of their annual family income on basic necessities (i.e. food, shelter, clothing and transportation) compared to roughly 60% and 42% for families in the middle- and highest-income categories, respectively. With such a high percentage of income being spent on the basic necessities by low-income families, their likelihood of generating RESP savings on their own is significantly lower. Nevertheless, others such as grand-parents, relatives, or friends may contribute into the RESP account of children from low-income families and enable them to receive the grants and bonds.
4. CESP performance: RESP savings
This section examines questions related to the performance of the CESP as it relates to the achievement of expected outcomes, namely whether more families (particularly those of low- and middle-income) are opening and saving inside RESPs. Three of the key questions in this section include:
- What are RESP, CLB and A-CESG take-up rates and what is the trend?
- Has there been a further change in savings patterns for PSE in RESPs since the A CESG and CLB were implemented?
- Are more low-income families saving for PSE in RESPs?
As indicated in Section 3.1, some families are unable to generate savings due to financial constraints and/or limited income. The Survey of Approaches to Educational Planning (SAEP) indicated that in 2013 about 68% of children less than 18 years of age had savings for PSE, slightly lower than in 2008 (70%). This was also confirmed by the Canadian Financial Capability Survey (CFCS) which showed that 70% of families with children under 18 had PSE savings in 2009. Footnote 36 A common theme in this survey and in other studies is that around 60% of those not saving for PSE have identified a lack of money as the main reason for not saving for PSE. Not surprisingly, this proportion is higher among families with lower incomes. Footnote 37
Nevertheless, there are families at every income level who are able to save for PSE, even among those with limited financial means. The case studies demonstrated that those who place a high priority on saving for PSE were more often able to generate savings. Technical evaluation reports using Statistics Canada survey data showed that families with a household budget were also more likely to generate savings for PSE. The CESP survey corroborated these findings in that 85% of families with an RESP indicated that saving money each month was important, compared to 70% of families without an RESP. The survey also indicated that even though the vast majority (close to 90%) of families that did not have an RESP knew about RESPs, awareness levels were lower (about 76%) for respondents with a family income of under $45,000.
4.1 RESP participation and savings
The cumulative level of RESP assets has increased from $2.4 billion in 1997 to $40.5 billion in 2013 (refer to Table 1). Footnote 38 RESP asset levels in 2013 increased by $4.9 billion from 2012.
Up to the end of 2013, the cumulative amount of all CESP payments paid into RESPs was $8.5 billion ($7.7 billion in CESGs, $298 million in A-CESGs and $499 million in CLBs).
Since the introduction of the A-CESG, the annual amount of A-CESG payments has increased from $7 million in 2005 to $54 million in 2013, while annual CLB payments have increased from $450,000 in 2005 to $101 million in 2013. Combined with CESG payments of $728 million in 2013, $883 million was disbursed via the CESP in 2013.
| Year | Cumulative RESP Assets ($ billions) | Growth Rate of Cumulative RESP Assets (%) | Basic CESG Payments ($ millions) | A-CESG Payments ($ millions) | CLB Payments ($ millions) |
Total CESP Payments ($ millions) |
|---|---|---|---|---|---|---|
| 1997 | 2.4 | N/A Not Applicable | N/A Not Applicable | N/A Not Applicable | N/A Not Applicable | N/A Not Applicable |
| 1998 | 4.0 | 66.7 | 151 | N/A Not Applicable | N/A Not Applicable | 151 |
| 1999 | 5.6 | 40.0 | 291 | N/A Not Applicable | N/A Not Applicable | 291 |
| 2000 | 7.2 | 28.6 | 318 | N/A Not Applicable | N/A Not Applicable | 318 |
| 2001 | 8.2 | 13.9 | 348 | N/A Not Applicable | N/A Not Applicable | 348 |
| 2002 | 10.0 | 22.0 | 370 | N/A Not Applicable | N/A Not Applicable | 370 |
| 2003 | 12.6 | 26.0 | 389 | N/A Not Applicable | N/A Not Applicable | 389 |
| 2004 | 15.2 | 20.6 | 426 | N/A Not Applicable | N/A Not Applicable | 426 |
| 2005 | 18.0 | 18.4 | 462 | 7 | 0.5 | 470 |
| 2006 | 21.3 | 18.3 | 500 | 14 | 17 | 531 |
| 2007 | 23.4 | 9.9 | 557 | 22 | 34 | 613 |
| 2008 | 22.6 | -3.4 | 575 | 29 | 47 | 651 |
| 2009 | 25.9 | 14.6 | 593 | 35 | 56 | 684 |
| 2010 | 27.6 | 6.6 | 641 | 39 | 65 | 745 |
| 2011 | 31.6 | 14.5 | 670 | 46 | 79 | 795 |
| 2012 | 35.6 | 12.7 | 701 | 52 | 99 | 852 |
| 2013 | 40.5 | 13.8 | 728 | 54 | 101 | 883 |
Text description of table 1
Table 1: Table 1 lists cumulative RESP assets (in $billions), the growth rate of cumulative RESP assets (in %), basic CESG payments made (in $millions), A-CESG payments made (in $millions), CLB payments made (in $millions), and total CESP payments made (in $millions) for each year during the 1997 to 2013 period. The data are based on the CESP Annual Statistical Review 2013 for 1998-2013 data and the CESG Quarterly Statistical Review (January 2001) for 1997 data.
Sources: CESP Annual Statistical Review 2013 for 1998-2013 data, and CESG Quarterly Statistical Review (January 2001) for 1997 data.
Table 2 provides some insight into the share of eligible children under 18 years of age who have ever received the CESG – in 1998, 9.7% of all eligible children had received the CESG at least once. By 2013, the share of eligible children who had received the CESG at least once had increased to 47.1% (i.e. of the roughly 6.9 million children under the age of 18 in Canada in 2013, 3.26 million had an RESP and had received the Basic CESG at least once). Footnote 39 Almost 2.5 million of these 3.26 million beneficiaries, or 75.3%, made a contribution and received the Basic CESG in 2013. Of these, 860,000 (or about 35%) received the A-CESG.
| Year | Cumulative # of CESG Beneficiaries and 18 Years of Age (A) |
# of Children in Canada and 18 Years of Age (B) |
% of CESG Eligible Children who have Received CESG (C) |
# of Children Receiving A-CESG and Basic CESG (D) |
% of A-CESG Eligible Children Receiving A-CESG
Footnote 40
(E) |
# of Children Receiving CLB (F) |
% of CLB Eligible Children who have Received CLB (G) |
|---|---|---|---|---|---|---|---|
| 1998 | 700,000 | 7,190,000 | 9.7 | N/A Not Applicable | N/A Not Applicable | N/A Not Applicable | N/A Not Applicable |
| 1999 | 1,120,000 | 7,160,000 | 15.6 | N/A Not Applicable | N/A Not Applicable | N/A Not Applicable | N/A Not Applicable |
| 2000 | 1,410,000 | 7,140,000 | 19.7 | N/A Not Applicable | N/A Not Applicable | N/A Not Applicable | N/A Not Applicable |
| 2001 | 1,650,000 | 7,120,000 | 23.2 | N/A Not Applicable | N/A Not Applicable | N/A Not Applicable | N/A Not Applicable |
| 2002 | 1,840,000 | 7,100,000 | 25.9 | N/A Not Applicable | N/A Not Applicable | N/A Not Applicable | N/A Not Applicable |
| 2003 | 1,970,000 | 7,050,000 | 27.9 | N/A Not Applicable | N/A Not Applicable | N/A Not Applicable | N/A Not Applicable |
| 2004 | 2,090,000 | 7,020,000 | 29.8 | N/A Not Applicable | N/A Not Applicable | N/A Not Applicable | N/A Not Applicable |
| 2005 | 2,230,000 | 7,010,000 | 31.8 | 120,000 | 2.7 | 800 | <1% |
| 2006 | 2,390,000 | 7,000,000 | 34.1 | 230,000 | 5.0 | 26,700 | 4.7 |
| 2007 | 2,540,000 | 6,980,000 | 36.4 | 350,000 | 7.4 | 66,500 | 11.8 |
| 2008 | 2,660,000 | 6,960,000 | 38.2 | 450,000 | 9.7 | 109,700 | 16.3 |
| 2009 | 2,760,000 | 6,950,000 | 39.7 | 530,000 | 11.7 | 156,800 | 19.3 |
| 2010 | 2,880,000 | 6,940,000 | 41.5 | 580,000 | 13.3 | 205,600 | 21.8 |
| 2011 | 3,020,000 | 6,940,000 | 43.5 | 700,000 | 15.5 | 268,300 | 24.4 |
| 2012 | 3,140,000 | 6,930,000 | 45.3 | 800,000 | 17.4 | 337,700 | 27.5 |
| 2013 | 3,260,000 | 6,920,000 | 47.1 | 860,000 | 19.0** | 384,100 | 29.4 |
Text description of table 2
Table 2 lists the cumulative number of CESG beneficiaries less than 18 years of age, the number of children in Canada less than 18 years of age, the percentage of CESG-eligible children who have received the CESG, the number of children receiving the A-CESG and basic CESG, the percentage of A-CESG eligible children receiving the A-CESG, the number of children receiving the CLB, and the percentage of CLB-eligible children who have received the CLB for each year during the 1997 to 2013 period. The data are based on the CESP Annual Statistical Review 2013, Statistics Canada data (CANSIM table 051-0001), and Canada Revenue Agency data.
Sources: Columns A, D, F and G are derived from the CESP Annual Statistical Review 2013. Column B is derived from Statistics Canada data (CANSIM table 051-0001). Column C is derived from dividing Column A by Column B. Column E is derived from calculations using CRA data and data from Column D. ** Canada Child Tax Benefit data was not yet available for 2013 – the number of A-CESG eligible children in 2012 was used to estimate 2013. Note that the cumulative figures for the A-CESG were not calculated, as the A-CESG is not retroactive like the Basic CESG and CLB.
The number of A-CESG beneficiaries (i.e. those receiving an additional 10% or 20% grant in a given year) increased from 120,000 in 2005 to 860,000 in 2013. As a proportion of the entire population of A-CESG eligible children, this represents an increase from 2.7% in 2005 to 17.4% in 2012. Footnote 41
It is important to note that the percentage of A-CESG eligible children receiving the A-CESG would have been higher if all A CESG eligible children who received contributions into their RESPs in a given year had received the A-CESG. Additional data analysis examining families with children using the CESP administrative data linked with CRA T1 income data (representing 85% of all RESP expenditures Footnote 42 ) indicated that 33.8% of A-CESG eligible families who contributed into an RESP in 2012 and received the CESG did not receive the A-CESG. Footnote 43 The three main reasons for this are: (i) the RESP subscriber did not apply for the A-CESG at their financial institution; and/or (ii) some financial institutions did not offer the A-CESG Footnote 44 ; and/or (iii) some of these children received the A-CESG in the RESP of another relative outside their household. In 2012, 30.9% of A-CESG eligible families who made an RESP contribution were not registered for the A-CESG.
The annual number of CLB beneficiaries has increased from 800 in 2005 to 384,100 in 2013. The cumulative number of CLB beneficiaries has increased to 604,566 in 2013 and the share of all CLB-eligible children who have ever received the CLB has increased from less than 1% in 2005 to 29.4% in 2013. About 23% of CLB-eligible families with an RESP in 2012 did not receive the CLB in 2012, as they were not registered for it at their financial institution or children received the CLB in the RESP of another relative outside their household. Footnote 45 The program’s efforts to promote A CESG and CLB since 2005 have helped to significantly reduce the number of eligible RESP subscribers who did not apply for the A-CESG and/or CLB. Moreover, a new streamlined application form was introduced in 2013 that encourages new subscribers to apply for all CESP incentives (subscribers now have to specifically opt-out of the incentives they do not wish to be considered for).
4.2 Savings patterns in RESPs
The number of children receiving RESP contributions has increased each year since 1998. In 2013, 75.3% of RESP beneficiaries under 18 received a contribution, as not all children with RESPs receive contributions every year. Footnote 46
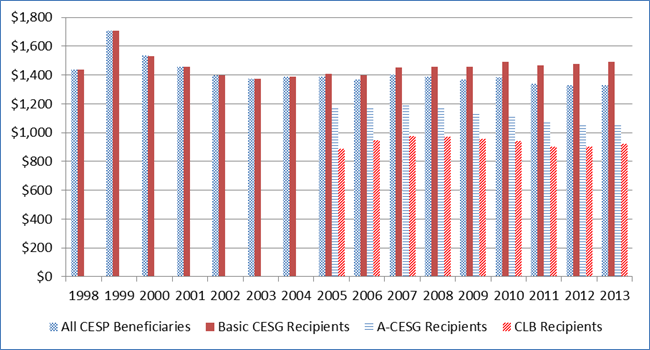
In 2013, the average RESP contribution (among those with a contribution in that year) was $1,497 compared to $1,202 in 1998. Footnote 47 However, average annual RESP contributions adjusted for inflation (in $2006) have declined over this period – from $1,436 in 1998 to $1,331 in 2013 (refer to Graph 1: Average Annual RESP Contributions from 1998 to 2013). Further analysis using the linked CRA-CESP data (i.e. data examining RESP subscribers living with their children and representing 85% of all RESP expenditures) indicated that average contributions adjusted for inflation have declined for all income groups since 2004. Footnote 48
Families receiving only the Basic CESG increased their annual RESP contributions from $1,399 in 2006 to $1,676 in 2013 (or from $1,399 to $1,491 adjusted for inflation). By comparison, the average for those receiving the Basic CESG and the A-CESG changed little, going from $1,170 to $1,181 (or decreasing from $1,170 to $1,050 adjusted for inflation), while the average for those receiving the CLB changed from $947 to $1,039 in 2013 (or decreased from $947 to $923 adjusted for inflation).
Receipt of the CESP incentives and RESP contributions also fluctuate significantly by other factors such as a child’s age, province, parental education and financial literacy.
Text description of graph 1
Graph 1 shows average annual RESP contributions (in 2006 constant dollars) for all CESP beneficiaries, basic CESG recipients, A-CESG recipients, and CLB recipients during each year from 1998 to 2013. Graph 1 is based on a 10% random sample of CESP administrative data of recipients under 18 years old and includes only those with an RESP contribution for that year.
| All CESP Beneficiaries | Constant dollar - 2006 / Basic CESG Recipients |
A-CESG Recipients | All CLB Recipients | CLB Recipients | |
|---|---|---|---|---|---|
| 1998 | 1436 | 1436 | N/A Not Applicable | N/A Not Applicable | N/A Not Applicable |
| 1999 | 1705 | 1705 | N/A Not Applicable | N/A Not Applicable | N/A Not Applicable |
| 2000 | 1533 | 1533 | N/A Not Applicable | N/A Not Applicable | N/A Not Applicable |
| 2001 | 1455 | 1455 | N/A Not Applicable | N/A Not Applicable | N/A Not Applicable |
| 2002 | 1400 | 1400 | N/A Not Applicable | N/A Not Applicable | N/A Not Applicable |
| 2003 | 1372 | 1372 | N/A Not Applicable | N/A Not Applicable | N/A Not Applicable |
| 2004 | 1388 | 1388 | N/A Not Applicable | N/A Not Applicable | N/A Not Applicable |
| 2005 | 1386 | 1409 | 1172 | 656 | 889 |
| 2006 | 1366 | 1399 | 1170 | 886 | 947 |
| 2007 | 1402 | 1453 | 1192 | 896 | 976 |
| 2008 | 1388 | 1455 | 1167 | 859 | 972 |
| 2009 | 1369 | 1457 | 1131 | 818 | 958 |
| 2010 | 1384 | 1491 | 1123 | 781 | 939 |
| 2011 | 1340 | 1468 | 1075 | 737 | 901 |
| 2012 | 1327 | 1474 | 1055 | 732 | 901 |
| 2013 | 1330 | 1489 | 1049 | 741 | 923 |
Source: 10% random sample of CESP administrative data of recipients under 18 years old. Averages include only those with an RESP contribution for that year
4.2.1 Age
In 1998, RESP beneficiaries were, on average, 8 years old at the time that an RESP account was opened for them. By 2009, this average had dropped to 3.6 years – where it has remained since (3.5 years in 2013). Footnote 49
In 2013, the percentage of children who ever received the CESG was higher among families with children aged 6 to 11 years old (52.6%) than among families with younger children (41.3%) or older children (48.3%). Further, children 5 years of age and younger with an RESP account were more likely to have received a contribution in 2013 (84.0%) compared to children aged 6 to 11 years old (75.5%) and children aged 12 to 17 years old (68.0%). However, older children (12-17 years of age) received significantly higher RESP contributions ($1,764) in 2013 than those under 12 years old (roughly $1,375). Plausible explanations for these findings include: (i) older children having older parents who are able to contribute more (and who tend to have higher disposable incomes than younger parents – one factor being no daycare costs, for example); (ii) a sense of urgency among parents of older children to contribute to potential PSE studies that are quickly approaching; and/or (iii) older parents having a clearer idea if their child will go onto PSE.
4.2.2 Province/territory
Ontario and British Columbia had the highest CESG take-up rates in 2013 (slightly above 50%) while the territories (27.6%), Manitoba (34.3%) and Saskatchewan (36.1%) had the lowest. Average annual RESP contributions in 2013 were highest in the territories (between $1,642 and $1,755), British Columbia ($1,700) and Ontario ($1,649) and lowest in New Brunswick ($1,127).
Comparing these figures with average provincial undergraduate tuition fees in 2013, there does not appear to be any correlation between the level of RESP contributions and the level of tuition fees in a particular province (although living costs may be a factor). Thus, there are other factors such as family income levels, parental education, RESP promotional activities, provincial incentives, student financial assistance levels, etc. that might explain provincial differences.
One other factor that might partially explain provincial differences in RESP contribution levels is the country of origin of RESP subscribers. Analysis using the Access to Education and Training Survey (ASETS) indicated that the higher level of RESP contributions in British Columbia is likely due to there being a greater share of Chinese and East Indian immigrants than in other provinces (both groups tend to make much higher RESP contributions than families with two Canadian-born parents even when taking into account other factors such as family income). Footnote 50 For example, in 2008, of households with a family income of $80,000 or more, the average RESP contribution was over $2,700 for families where both parents were of Chinese or East Indian origin and only about $1,600 for families where both parents were born in Canada. The CESP survey corroborated this by showing that foreign-born RESP subscribers were more likely than Canadian-born subscribers to make annual RESP contributions exceeding $2,000.
4.2.3 Parental education and aspirations
The 2013 CESP survey found a correlation between parental education and having an RESP. Findings from the survey showed that close to 70% of parents with an RESP studied in university compared to about 40% of those without an RESP. The survey also indicated that more than 50% of parents with university studies and with an RESP contributed $2,000 or more compared to 25% of parents without university studies. Average RESP asset levels were also significantly higher among those with university studies. These findings essentially confirm those found in studies using older Statistics Canada surveys (the CFCS and ASETS).
Several studies in the literature review showed a correlation between the presence of PSE savings and parental aspirations, findings which were confirmed in the CESP survey (close to 43% of parents with an RESP indicated that having PSE savings was related to how they felt about their child’s potential college or university participation). As well, close to 60% of parents with RESP savings expected their children to go to university compared to 37% of parents without RESP savings. However, the CESP survey showed that some RESP subscribers decided against making further RESP contributions because they did not expect their child to go onto PSE studies – perhaps due to the lack of PSE ambitions of their child and/or weaker-than-expected grades in school.
4.2.4 Financial literacy and savings orientation
Having good general financial knowledge and awareness of the benefits of using RESPs are two additional factors that help explain the likelihood of saving for PSE in an RESP. The CFCS study showed that those who self-identified as having good financial knowledge were 7.5 percentage points more likely to have an RESP than those who did not self-identify as having good financial knowledge. Further, the CESP survey indicated that 46.1% of families not fully aware of the CESP and its benefits indicated that they would now be likely to save in an RESP after the CESP features were explained to them.
Another factor which influences the probability of saving for PSE in an RESP is having a pre-existing savings habit. Studies conducted for the evaluation demonstrate that having an RRSP is correlated to having an RESP and the level of annual RESP contributions. Footnote 51 Findings from the CESP survey revealed that 12-15% of RESP subscribers used funds that would have gone into RRSPs in order to make RESP contributions. However, about 40% of subscribers indicated that a more common way to enable RESP contributions was to cut back on spending, of which the majority cut back on either entertainment (i.e. going out for dinner, going to the movies, etc.) or vacations. The ASETS study and case studies corroborated these results and showed that, not surprisingly, a higher proportion (62.6%) of families with an income below $40,000 had to cut back on spending compared to families with an income between $40,000 and $79,999 (52.3%) and families with an income of $80,000 or more (39.3%). Finally, the CESP survey revealed that less than 2% of subscribers with children under 18 indicated taking out a bank loan or using a line of credit to help make RESP contributions.
4.3 RESP use by income group and contributors
Analysis using CRA T1 income tax data linked to CESP administrative data (the data examined only RESP subscribers living with their children and therefore represents 85% of all RESP expenditures) showed that the 2012 RESP take-up rate varies significantly by net family income, from 25.2% for families with net family income below $25,000 to 70.1% for families with net family income over $125,000. Footnote 52
4.3.1 RESP use by family income level
Each year from 1999 to 2012, the number of families with RESPs increased. Graph 2 examines families with children by income group and shows that the number of families with RESPs increased every year in each income group.
In parallel, more families in the two lowest income categories (of Graph 2) are receiving the A-CESG (as shown in Table 2). The study using linked CRA-CESP data indicated that the RESP take-up rate among families with an income below the lowest A-CESG threshold increased from 7.8% in 1999 to 30.3% in 2012 (a four-fold increase), while the RESP take-up rate among families with an income between the two A-CESG thresholds increased from 15.6% to 47.3% (a three-fold increase), and the RESP take-up rate among families above the highest A-CESG threshold increased from 26.5% to 63.8% (over a two-fold increase). Footnote 53 However, although RESP take-up rates continue to increase, Graph 3 shows that visually, the gap in RESP take-up rates between these three groups of families is not narrowing, even after the introduction of the A-CESG and CLB. Footnote 54

Text description of graph 2
Graph 2 shows the number of families with RESPs for all CESP beneficiaries, basic CESG recipients, A-CESG recipients, and CLB recipients for each year during the 1999 to 2012 period. Graph 2 is based on a 1% sample of families living with children (CRA T1 income tax data linked with CESP administrative data with 545,274 observations from 1999-2012).
Sources: 1% sample of families living with children (CRA T1 income tax data linked with CESP administrative data with 545,274 observations from 1999-2012). This sample of families living with children represents 85% of CESP expenditures. * Annual A-CESG thresholds are used, which are also CCTB thresholds. For years before the introduction of the A-CESG, CCTB thresholds are used.
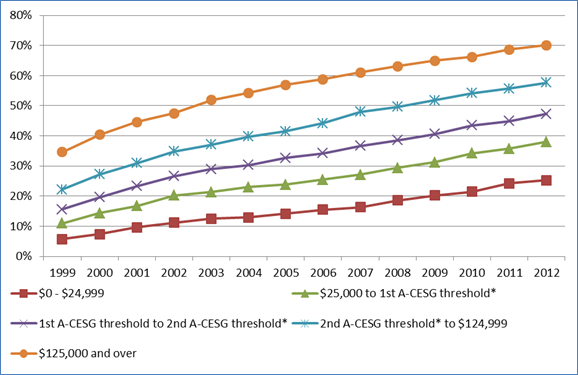
Text description of graph 3
Graph 3 shows RESP take-up rates (in %) by family income level for each year during the 1999 to 2012 period. Graph 3 is based on a 1% sample of families living with children (CRA T1 income tax data linked with CESP administrative data with 545,274 observations from 1999-2012).
Sources: 1% sample of families living with children (CRA T1 income tax data linked with CESP administrative data with 545,274 observations from 1999-2012). This sample of families living with children represents 85% of CESP expenditures. * Annual A-CESG thresholds are used, which are also CCTB thresholds. For years before the introduction of the A-CESG, CCTB thresholds are used. The $25,000 and $125,000 thresholds are adjusted for inflation each year (real $2012).
The growth in RESP take-up rates among low- and middle-income families has, not surprisingly, coincided with an increase in the number of A-CESG beneficiaries (from 120,000 in 2005 to 800,000 in 2012 as shown in Table 3). However, statistical analysis using the linked CRA-CESP data failed to attribute the growth in RESP take-up rates to the A CESG. RESP take-up rates among low- and middle-income families were already increasing prior to 2005 and did not accelerate after the introduction of the A-CESG. The analysis of the linked CRA-CESP data also failed to uncover a significant impact of the A-CESG on RESP contributions. Footnote 55
However, analysis using CESP administrative data showed beneficiaries eligible and registered for the A-CESG were more likely to receive contributions in their RESP (by over 10 percentage points) than all other RESP beneficiaries. The analysis also showed a $233 increase in annual contribution amounts for those eligible for the A-CESG who had an RESP before the measure was put in place and made the effort to return to their financial institution in 2005 or 2006 to do the paperwork required to register for the A-CESG. Footnote 56 As this small group is not representative of the eligible population, one cannot conclude that the A-CESG increased contribution amounts among the entire eligible population, even though contributions did increase significantly in the group examined.
Further, the CRA-CESP study found that the CLB increased the RESP take-up rate among low-income families. As only children born on or after January 1, 2004 are eligible for the CLB, the analysis compared low-income families with children born between July and December 2003 (i.e. not eligible for the CLB) to low-income families with children born between January and June 2004 (i.e. eligible for the CLB) to examine the effect of the CLB. Results showed that by 2012, RESP take-up rates were 8.3 percentage points higher among the latter group. However, the analysis failed to uncover a significant impact of the CLB on annual or cumulative RESP contributions. The CESP administrative data analysis also showed that the CLB decreased the age at which RESPs are opened by one year, on average.
4.3.2 Contributors to RESPs
Analyses using CESP administrative data indicate that the vast majority (80%) of RESP beneficiaries had only parent(s) as subscribers. This proportion was higher (90%) among those who received the A-CESG or CLB. Footnote 57 The CESP survey produced similar findings and noted that the most common contributors among relatives and/or friends were grandparents (70%), followed by a child’s other parent/guardian (10%), aunt or uncle (7%), and other relatives and friends (13%).
The fact that the proportion with only parent(s) as subscribers was higher among those with lower incomes might be partially explained by the correlation between incomes from different generations. Corak et al (2010) show that income from two different generations is correlated, meaning that those from low-income families were more likely to come from a low-income family background. Therefore, their parents (i.e. grand-parents of the RESP beneficiaries) are less likely to become RESP subscribers, as they are highly likely themselves to be a low-income family
4.3.3 Use of grants by temporarily low-income families
The CRA-CESP study demonstrated that in 2012 families permanently in low income Footnote 58 were more likely to make an RESP contribution (if they had an RESP) but made smaller contributions on average than families who were temporarily in low income. Correspondingly, they received a lower amount of the Basic CESG but received more grants overall, as they were more likely to be registered for the CLB and receive it than families who were temporarily in low income.
RESP take-up rates were 27.4% among families permanently in low income and 35.3% for families temporarily in low income in 2012, with both rates increasing every year since 1999. The difference between the two groups has remained quite steady throughout the years at about 10 percentage points. Results from the CESP survey confirmed that families temporarily in low income were more likely to have an RESP than those permanently in low income.5. PSE savings outside of RESPs
The use of RESPs to save for a child’s PSE has increased dramatically since the introduction of the CESP in 1998, but many families (with and without RESPs) continue to save for PSE outside of RESPs. This section examines the extent to which this is taking place and why.
5.1 Who saves outside of RESPs?
The 2013 CESP survey found that 25.1% of families with RESPs for their children under 18 years old saved for PSE using non-RESP means, while 38.6% of families with children under 18 years old without an RESP did so. Further analyses of the survey data showed that a greater proportion of families with incomes under $45,000 saved for PSE using non-RESP means than families with incomes of $45,000 or more. The analyses also indicated that saving outside of an RESP occurred more frequently among parents without university studies than among parents with some university studies.
The 2013 CESP survey also revealed that the most common methods of saving for PSE outside RESPs were the use of a dedicated savings account in the name of the child (approximately 35%), followed by the use of other types of accounts (close to 19%) and Tax-Free Savings Accounts (TFSA – 15%). Other savings methods included real estate investments and/or the rental income derived thereof, life insurance funds and/or policies, and RRSPs. The case studies produced similar findings.
5.2 Reasons for saving outside of an RESP
The most common reasons for saving outside of RESPs (among RESP subscribers) given in the CESP survey were ‘diversification’ (21%) and ‘easy access to funds’ (17%). Another 7% of families indicated that they had either maximized the annual CESG received (i.e. contributed $2,500 and received the maximum $500 in grants) or that they had contributed the lifetime RESP maximum of $50,000. Almost all surveyed families who provided these answers had an annual income of $90,000 or more. Additionally, some subscribers indicated that RESPs were not able to completely cover the increasingly high costs of university (and that additional non-RESP savings was needed). The case studies also identified flexibility (i.e. accessibility to funds, use of funds for any purpose, and allowing other people to contribute) as reasons for contributing to PSE savings via other means.
Reasons given by non-subscribers for using non-RESP methods to save for PSE included ‘having accessibility to funds’ (17%) and ‘not having gotten around to it [opening an RESP] yet’ (14%). Only 10.8% listed a lack of RESP awareness (and the associated benefits thereof) as the main reason for saving outside of an RESP. The frequency of this answer was even lower among parents with children under 18 years of age (only 5.9%). Thus, it appears as though awareness is not really an issue when it comes to explaining lack of RESP take-up among non-subscribers who are already saving for PSE. Among those not saving for PSE at all, 90% of those surveyed indicated being familiar with RESPs, but a significant portion were still unaware of the benefits of using an RESP, as over 40% said they would now be likely to save in an RESP after the benefits were explained to them.
6. CESP performance: Use of RESPs while in PSE
This section shifts the focus from saving for PSE to the use of RESP savings for PSE studies. The section provides evidence on the following evaluation questions:
- To what extent is the CESP improving the affordability of PSE?
- What impact do RESPs and the CESP have on student loan and grant amounts?
At the end of 2013, RESP beneficiaries who were 17 years old had accumulated an average of $12,906 in RESP contributions and $2,518 in CESG/A-CESG grants for a total of $15,424. Assuming a rate of return equal to inflation, total RESP savings would amount to an average of $17,053 for 17-year-old beneficiaries in 2013. Footnote 59 Close to 41% had less than $10,000 in RESP savings, a quarter had between $10,000 and $20,000, 23% had between $20,000 and $40,000, and 10% had over $40,000. Footnote 60
6.1 Use of RESP savings by PSE students
In 2013, total aggregate RESP withdrawals reached over $2.7 billion, up markedly compared to the $45 million withdrawn in 2000. Footnote 61 Similarly, the number of students withdrawing from RESPs has increased steadily since 1998, from less than 10,000 to 356,916 in 2013. In percentage terms, about 17% of PSE students made an RESP withdrawal in 2013, up from less than 0.3% in 1998. Footnote 62
Between 1998 and 2013, the average annual RESP withdrawal increased from $3,705 to $7,673 (among those with an RESP withdrawal of at least $1). Graph 4 shows that this increase is mainly due to the increase in contribution withdrawals during PSE, as EAPs (the withdrawal of accumulated investment earnings in the RESP and government grants) have remained relatively stable since 2007 (average Canadian undergraduate tuition fees are also shown as a point of reference).
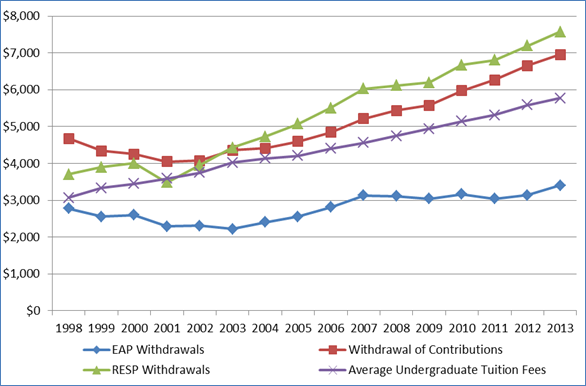
Text description of graph 4
Graph 4 shows average RESP withdrawals and average Canadian undergraduate tuition fees for each year during the 1998 to 2013 period. Graph 4 is based on a 10% random sample of CESP administrative data and Tuition and Living Accommodation Costs survey data from Statistics Canada.
| EAP Withdrawals | Withdrawal of Contributions | RESP Withdrawals | Average Undergraduate Tuition Fees | |
|---|---|---|---|---|
| 1998 | 2778 | 4673 | 3705 | 3064 |
| 1999 | 2559 | 4336 | 3896 | 3328 |
| 2000 | 2600 | 4256 | 4008 | 3447 |
| 2001 | 2292 | 4046 | 3479 | 3585 |
| 2002 | 2306 | 4077 | 3953 | 3749 |
| 2003 | 2216 | 4353 | 4427 | 4018 |
| 2004 | 2402 | 4411 | 4732 | 4140 |
| 2005 | 2550 | 4599 | 5073 | 4211 |
| 2006 | 2807 | 4841 | 5510 | 4400 |
| 2007 | 3132 | 5214 | 6026 | 4558 |
| 2008 | 3111 | 5432 | 6117 | 4747 |
| 2009 | 3044 | 5581 | 6197 | 4942 |
| 2010 | 3163 | 5977 | 6671 | 5146 |
| 2011 | 3038 | 6270 | 6803 | 5313 |
| 2012 | 3139 | 6653 | 7196 | 5586 |
| 2013 | 3404 | 6952 | 7572 | 5772 |
| Total | 2923 | 6019 | 5524 |
Source: 10% random sample of CESP administrative data and Tuition and Living Accommodation Costs survey data from Statistics Canada. Average withdrawals are calculated excluding zeroes.
In 2012, over 45% of students with RESP withdrawals were in their first year of a PSE program, 25% were students in their second year, 16% were students in their third year, and the remaining in further years. Administrative data analyses revealed that in 2013 the average withdrawal was highest if the student was in the first year of a PSE program and declined thereafter. Footnote 63 Further analyses indicated that approximately 70% of students with RESP withdrawals were in university, while 30% were in college or other studies. Not surprisingly, 2013 RESP withdrawals for those studying at university ($7,908) were greater than for those studying at a college or other PSE institution ($6,814).
The average cumulative amount of RESP withdrawals increased from $8,000 for the generation who reached 18 years old in 1998 to $15,500 for the generation who reached 18 years old in 2008. Footnote 64 Of beneficiaries who started withdrawing from an RESP before 2009, 28% made a withdrawal in only one year, 23% in two years, 41% in three or four years, and 7% made a withdrawal in five or more years. Footnote 65
6.2 Impact of RESPs on PSE funding
Those with RESP savings should be in a better financial position to afford their PSE studies than those without RESP savings, all else being equal. Analyses using the ASETS confirmed this, as did the CESP survey. The CESP survey showed that PSE students with an RESP withdrew an average of $6,830 from their RESP, accessed $9,525 in non-RESP funding (i.e. any other type of financial support – loans, grants, employment income, etc.), and had PSE-related costs averaging $14,094 in 2012. By comparison, students without an RESP accessed $8,958 in non-RESP funding and had PSE-related costs of $12,739 in 2012. Thus, on average, students without an RESP appeared to be short of funds to finance their PSE. Footnote 66
Based on the above figures, the percentage of PSE-related costs in 2012 that were covered by RESP withdrawals (i.e. ROCs and EAPs) equates to 48.5%, among those who made RESP withdrawals. Respondents provided a lower percentage (37%) when specifically asked “…what percentage of these [PSE-related] costs were covered by the RESP savings that were used.” A similar percentage (36%) was reported in the ASETS study by RESP users. Therefore, it appears that during the time period covered by these studies, RESP savings covered about 40% of PSE-related expenses, in years students had RESP withdrawals.
6.2.1 RESPs and student loans
Three evaluation studies using different Statistics Canada surveys – the Youth in Transition Survey (YITS), the National Graduates Survey (NGS), and ASETS – all found that students with RESP savings were less likely to have a student loan. Footnote 67 The NGS and ASETS studies also found that those that have RESP savings had lower amounts of student debt.
CESP survey results provide additional insight concerning RESPs and student loans – 24.9% of students with an RESP have had to access student loans while in PSE compared to 54.8% of students without an RESP. As well, students with an RESP accessed an average of $5,511 in student loans in 2012 while students without an RESP accessed an average of $6,613 – or 16.7% less. Footnote 68 This is partly explained by the fact that RESP withdrawals reduce student loan amounts. Note that because RESP beneficiaries are more likely to be from families with higher income levels, they are less likely to be eligible for student loans and, thus, have to rely on other sources of funds to finance their PSE, such as RESPs.
6.2.2 Impact of RESP withdrawals on federal and provincial/territorial loans and grants
RESP withdrawals may decrease eligibility for student loans and grants. For instance, EAPs (i.e. the CESG, A-CESG, and returns on contributions and the grants) are treated as in-study income and reduce loans dollar for dollar, above the $100 per week in-study exemption for EAPs and other sources of income. Footnote 69 Therefore, the reduction rate of EAPs is more likely to be close to 100% for students working while studying. As EAPs are also considered as taxable income, students must include them as part of their income when filing income taxes. This can have a direct impact on eligibility for Canada Student Grants for students from low- and middle-income families one year later, as eligibility is based on gross annual family income from the previous year. Footnote 70
Until the 2013-2014 academic year, RESP contribution withdrawals (ROCs) were also considered in the CSLP needs assessment calculation for determining loan and grant eligibility. ROCs were considered as targeted resources (assessed at 100%) for both independent and dependent students with a non-parent as the subscriber. Footnote 71 However, starting with the 2014-2015 academic year, ROCs were excluded from the CSLP needs assessment calculation. The decision to change the federal policy was motivated by the understanding that considering ROCs as a targeted resource in the CSLP needs assessment may disproportionally affect low-income students with RESPs compared to their higher-income counterparts.
To clarify the impact of RESP withdrawals (EAP and ROCs), the Student Financial Assistance Estimator on the CanLearn website was used and showed that EAP withdrawals may reduce (almost dollar-for-dollar) student financial aid, regardless of whether or not a student is dependent or independent. Footnote 72 However, this reduction only occurs for in-study income above the $100 weekly exemption for a typical study period of 34 weeks ($3,400).
It was also revealed that ROCs used to lead to a major reduction in student financial aid (by up to 93% of the value of the ROCs) for independent students until 2013-2014. Even though the new CSLP policy has excluded ROCs from the needs assessment process for the federal portion of a student loan since 2014-2015, in practice many provinces/territories have not updated their application forms Footnote 73 which could lead to uneven effects across jurisdictions. In cases where the new federal policy has not been implemented, counting ROCs as resources continues to lead to up to a near 100% reduction in student financial aid – implying that some students withdrawing RESP savings could end up with similar PSE funding levels as those without RESP savings, when taking into account student financial aid and RESP withdrawals (EAP and ROCs). The key difference, all other things being equal, is that students with RESP savings will have less student loan debt to repay once PSE studies are completed.
Although Quebec does not participate in the CSLP (having its own program), the province excludes all RESP withdrawals from student loans calculations. This significantly increases available student resources for those with an RESP and applying for financial assistance in Quebec compared to those with RESPs applying in the rest of Canada. Footnote 74
About 43% of surveyed families with PSE students were aware that RESPs can impact on student loan and grant calculations, but they were not necessarily aware to what extent. Currently, there is no precise information available to the public on the effect of RESP withdrawals (EAPs and contribution withdrawals) on student loan and grant calculations.
7. Efficiency and economy of resources to reach objectives
Effective April 1, 2009, the Treasury Board Secretariat Directive on the Evaluation Function requires that evaluations address ‘efficiency and economy’, which is comprised of an “assessment of resource utilization in relation to the production of outputs and progress toward expected outcomes”. Footnote 75
To assess the resource utilization of the CESP in achieving its objectives, Section 7.1 examines if the resources/inputs (i.e. grant and bond payments as described in the logic model in Appendix 3) are used efficiently and if there is any potential economy of resources/inputs that could be achieved without having a significant impact on outcomes (i.e. encouraging families to save for the PSE of their children). In addition, this section examines the extent to which CESP funding goes to people who would not otherwise have saved for PSE in an RESP and looks at what is happening with RESP contributions at the higher income levels. Section 7.2 examines the extent to which other inputs (e.g. operating budget) are used efficiently.
7.1 Efficiency & economy – Assessment of resource utilization
The objective of the CESG, which comprised 82.4% of all CESP payments in 2013, is to address the challenge of “encouraging families to save early for their children’s education.” A logical question to ask is if there is a need to encourage all families, specifically those with higher incomes, to save early for their children’s education via government grants. The reason to ask this question is because families with higher incomes:
- Have more financial resources at their disposal and are therefore able to save more money than lower- and middle-income families (as the SHS study demonstrated). Thus, their need for the incentives offered through the CESP is lower.
- In addition, they can better afford to pay a part of their children’s PSE costs during PSE studies using their income in those years.
- Have a higher degree of financial literacy than lower- and middle-income families and are therefore more aware of the costs associated with PSE and the importance of saving early for PSE. Footnote 76
- Were more likely to have already been saving for PSE before the CESP was introduced in 1998:
- Data from the 1999 SAEP showed that 62.6% of families with children less than 18 years of age and with a household income of $80,000 or more reported having saved for their child’s PSE compared to 18.7% for those with a household income of less than $30,000 (note that RESP take-up was 15% among all families in 1999). Footnote 77
- Given that the 1999 SAEP was completed shortly after the introduction of the CESP in 1998, it is reasonable to assume that for most of these children saving began prior to 1998. Hence, a majority of these families with a household income of $80,000 or more would not have required encouragement from the CESP to save for PSE. Instead, most of these families saving for PSE outside of an RESP likely changed the way they saved and used RESPs to take advantage of the grants being offered via the CESG.
- In-depth analysis of the 1999 SAEP confirmed these points by revealing that 60.0% of families with a household income of $80,000 or more and whose youngest child was 17 or 18 years of age had PSE savings in 1999, while this proportion was 58.2% for families with a similar income and with children aged between 0 and 4 years old. However, RESP participation was only 11.8% among the former group while it was 33.6% for the latter group. Due to program rules Footnote 78 , the bulk of children who were 17 or 18 years old in 1999 were never eligible for the CESG.
The above points indicate that families with higher incomes can save, are aware of the importance of saving, and already were saving for their children’s PSE before the CESP was implemented. In addition, as RESP take-up among families above the highest A-CESG income threshold increased to 63.8% in 2012, it appears that much of the increase in RESP take-up since 1999 is due to a change in the way they save for PSE.
Considering this, it may not be necessary to offer them financial incentives via the CESP as an impetus. The reason for this is that the inputs (i.e. grant funding in RESPs) will not really impact outputs (i.e. saving for the PSE of children) to the same extent as for those below the highest A-CESG income threshold, since PSE saving among families above the highest A-CESG income threshold was already taking place on a large scale prior to 1998. Moreover, the CESP survey indicated that in 2013 close to 75% of families with incomes of $90,000 or more indicated that they would still have saved for PSE using an RESP in the absence of the CESP.
That being said, there is likely still value in having the CESP, even for higher-income families, as some of them were likely induced to save more (and more regularly) for their children’s PSE. As well, there is little question that the existence of the CESP in combination with tax changes to improve the flexibility of the RESP (e.g. raising the RESP annual contribution limit per beneficiary from $1,500 in 1990 to $4,000 in 1997, and then removing the limit in 2007) have increased RESP take-up among families at all income levels, as the linked CRA-CESP data analysis demonstrated. However, as some studies have shown, a high percentage of savings generated from the introduction of a new savings incentive are often due to a substitution effect. Footnote 79
Given the evidence presented, a majority of families with higher incomes would be saving for their children’s PSE regardless of the existence of the CESP – it just so happens that now most of this saving takes place inside an RESP, due in part to the 20% grant on their RESP contributions. Thus, for these families there is little economy because the cost of resources used is much higher than is needed to achieve the expected outcome of saving for PSE.
Aside from efficiency and economy, there is also an issue of equity. The analysis of the merged CESP-CRA databases showed that those with $125,000 or more in family income (adjusted for inflation) received 31.9% of all CESP payments in 2012 even though they accounted for only 17.1% of all families with children less than 18 years of age (refer to Table 3). This amounted to at least $224 million in CESP payments in 2012. Even the introduction of the CLB and A-CESG did not change the proportion of CESP payments going to these families, as they received 31.8% and 32.9% of all CESP payments in 1999 and 2005, respectively. As the percentage of these families increased during this period, from 9.6% in 1999 to 17.1% in 2012, the discrepancy between the percentage of resources allocated to them and their share in the population has narrowed during this period. For families with less than $45,000 in family income, the discrepancy has narrowed as well during this period, as their share of CESP expenditures increased significantly.
| Family Income ($2012) | Distribution of all families with children under 18 (%) | Distribution of CESP payments ($ millions)* | Distribution of CESP payments (%)* | ||||||
|---|---|---|---|---|---|---|---|---|---|
| 1999 | 2005 | 2012 | 1999 | 2005 | 2012 | 1999 | 2005 | 2012 | |
| $0 - $24,999 | 23.2 | 23.6 | 21.8 | 14 | 32 | 82 | 5.8 | 8.3 | 11.7 |
| $25,000 - $44,999 | 17.6 | 16.3 | 15.1 | 23 | 40 | 89 | 9.6 | 10.4 | 12.6 |
| $45,000 - $89,999 | 35.3 | 32.7 | 29.8 | 78 | 110 | 184 | 31.9 | 29.0 | 26.1 |
| $90,000 - $124,999 | 14.4 | 15.1 | 16.3 | 51 | 74 | 124 | 20.9 | 19.3 | 17.7 |
| $125,000 + | 9.6 | 12.3 | 17.1 | 78 | 125 | 224 | 31.8 | 32.9 | 31.9 |
| Total | 100.0 | 100.0 | 100.0 | 244 | 381 | 703 | 100.0 | 100.0 | 100.0 |
Text description of table 3
Table 3 shows the percentage distribution of all families with children less than 18 years of age, the distribution of CESP payments made (in $millions), and the distribution of CESP payments made (in percentage terms) based on family income (in 2012 constant dollars) for the years 1999, 2005 and 2012. Table 3 is based on a 1% sample of families living with children (CRA-CESP linked data with 545,274 observations from 1999 to 2012).
Source: 1% sample of families living with children (CRA-CESP linked data with 545,274 observations from 1999-2012). This sample of families living with children represents 85% of CESP expenditures. * CESP-assisted grant payments and the percentage distribution is based on families where the parent(s) live with their children (roughly 85% of all CESP costs) – thus, 15% of all CESP-assisted grant payments are excluded from this table.
Moreover, out of CESP payments made in 2012, 49.6% went to families with a family income of $90,000 or more. Assuming this proportion for 2013, this represents well over $400 million in 2013 CESP payments that were disbursed to these families, of which $280 million were disbursed to families earning $125,000 or more.
Families in one of the two lowest income categories in Table 3 received 24.3% of CESP payments in 2012 while accounting for 36.9% of all families with children less than 18 years old. This amounted to at least $171 million in CESP payments in 2012, up substantially from $37 million in 1999 and $72 million in 2005, representing a 362.2% increase over the 1999 to 2012 period. By comparison, CESP payments increased by 187.2% over this same period for families with $125,000 or more in family income.
For lower-income families, it appears to be efficient to help them save for PSE, as not many were saving for PSE prior to 1998. The evaluation acknowledges that it is more difficult for most families with an annual income of under $90,000 to save for their children’s PSE. Nevertheless, as a high number of these families do save for PSE, it is essential to underline the contribution of the CESP. Furthermore, it should be noted that even low-income families without savings can open an RESP and receive the CLB.
Several lines of evidence highlight the contribution of the CESP in helping to finance PSE savings in RESPs among middle- and lower-income families:
- The CESP survey revealed that 67.6% of families with an annual income of less than $45,000 with an RESP for a child indicated that the CESP encouraged them to start saving earlier than they otherwise would have, while this proportion was 58% for families with an annual income of $45,000 to $89,999.
- The percentage of families with less than $30,000 in household income and with PSE savings increased from 19.5% in 1999 (SAEP) to 45.7% in 2008 (ASETS), and declined slightly to 44.2% in 2013 (SAEP). Footnote 80 Over the same period, the percentage of families with $30,000 to $49,999 in household income with PSE savings increased from 36.9% in 1999, to 56.5% in 2008, and fell to 53.4% in 2013. Footnote 81
- The number of middle- and low-income families with children receiving the CESG has increased significantly since 1998 (see Section and continues to increase.
- The introduction of the CLB has led to a significant increase in RESP take-up among the lowest income families (although there was no evidence to attribute the growth in RESP take-up rates to the A CESG, as RESP take-up rates among families with lower incomes were already increasing prior to 2005 (refer to Section 4.3.1)).
- Based on the SAEP/ASETS, the average RESP value (in constant dollars) for families having under $30,000 in household income increased from $3,812 in 1999 to $7,230 in 2012, while the average RESP value for families having $30,000 to $49,999 in household income increased from $3,800 in 1999 to $6,500 in 2012.
7.2 Efficiency of program delivery
This section examines the efficiency of the delivery model of the CESP. In terms of the delivery of the CESP (from an administrative standpoint), there appear to be some issues with the delivery of the A-CESG. The study using the merged CESP-CRA data indicated that 34% of A-CESG eligible families who made RESP contributions in 2012 did not receive the A-CESG in 2012 (likely either because their financial institution did not offer the A-CESG or because eligible families did not apply for the A-CESG). Similarly, about 23% of CLB-eligible families who had an RESP did not receive the CLB (for the same reasons as the A-CESG as outlined in Section 4.3). Although the government introduced a new form in 2013 that has addressed this issue for newly-opened RESP accounts, the problem still exists for many families who opened an RESP before 2013.
It is important to note that RESPs are not directly administered by the Government of Canada (aside from the CRA’s role in registering the plans). The CESP is delivered through an alternative service delivery arrangement with financial institutions, banks, mutual fund companies and scholarship foundations. The only CESP program delivery costs are salary and non-salary dollars pertaining to federal-level employees (other administrative costs such as IT, call centres, etc. are not included). The file review indicated that CESP operating costs rose from $3.7 million to $8.5 million from 1998 to 2013. Dividing the CESP operating budget by total CESP payments indicates that operating costs were 2.5% of total CESP payments in 1998 and 1.0% in 2013.
A comparison between CESP delivery efficiency and that of other ESDC strategic outcomes and programs was conducted in the file review. The results showed that CESP operating costs were comparable with programs falling under the Income Security strategic outcome (0.1%) and Social Development strategic outcome (2.1%) and with other programs such as Employment Insurance (9.7%) and the CSLP (3.1%). Footnote 82 However, using this approach to measure program delivery efficiency is complicated by the fact that the CESP delivery model achieves considerable savings with its alternative service delivery model where financial institutions and group providers play a significant role in program delivery without cost to the Government of Canada. Footnote 83
Therefore, although the CESP appears to be among the most efficiently delivered ESDC programs using this metric, it should be kept in mind that the CESP is delivered via a unique alternative service delivery model (some of whom charge fees to account holders to cover their delivery costs – which does not impact the Government of Canada’s program delivery efficiency) compared to programs delivered exclusively by ESDC. Footnote 84 This makes comparisons to other programs in which the Government of Canada plays a greater role in service delivery more difficult.
8. Conclusions, recommendations and future work
Overall, the increase in PSE costs justifies the need for the CESP. There has been no evidence of a priority shift by the government regarding the importance of learning, saving for PSE or the importance of RESPs and the CESP.
A significant increase in RESP participation and accumulated RESP savings has occurred at every income level. Participation has increased every year for all income groups – notably, RESP take-up among families with an income under the lowest A-CESG threshold increased four-fold since 1999 and reached 30% in 2012 (with the CLB found to have had a significant impact). For families with an income between the two A-CESG income thresholds, RESP take-up reached 47% in 2012. Nevertheless, RESP take-up rates among these families continue to remain much lower compared to that of families with an income above the highest A-CESG income threshold. Thus, the latter group receives a significant portion of all grant payments (and a larger share than their share of the overall population of families with children less than 18 years of age).
There are still some parents who decide to save for their children’s PSE outside of RESPs. However, it appears that the general awareness problem of the CESP that existed previously has mostly been resolved, but there continues to be a lack of understanding of CESP and RESP rules (and the benefits associated with RESPs).
As the program has developed, the number of PSE students using RESPs while studying continues to increase substantially, as do RESP withdrawals. The use and the impact of the CESP and RESPs on students may warrant consideration as the topic of a future evaluation.
8.1. Recommendations
- Explore ways for funds to more effectively reach families with the greatest need for assistance and encouragement to save for their children’s future post-secondary education.
- Complement outreach efforts on promoting awareness with promoting understanding of the CESP savings incentives in order to support increased participation among all Canadian families.
List of Abbreviations
- A-CESG: Additional Canada Education Savings Grant
- ASETS: Access to Education and Training Survey
- CESG: Canada Education Savings Grant
- CESP: Canada Education Savings Program
- CFCS: Canadian Financial Capability Survey
- CLB: Canada Learning Bond
- CRA: Canada Revenue Agency
- CSLP: Canada Student Loans Program
- CTF: Child Trust Fund
- EAP: Education Assistance Payment
- ESDC: Employment and Social Development Canada
- NGS: National Graduates Survey
- PSE: Post-Secondary Education
- RESP: Registered Education Savings Plan
- RRSP: Registered Retirement Savings Plan
- SHS: Survey of Household Spending
- YITS: Youth in Transition Survey
Appendix 1 – Evaluation questions
Relevance: Continued need for the program
1. Do PSE costs justify the need for the CESP?
Source Documents: Literature Review, SHS Study, CESP Survey
Section of this report or available in Technical Report (TR): 3.1
- What are the current debt levels for graduating students and what is its trend?
Source Documents: Literature Review, CESP Survey
Section of this report or available in Technical Report (TR): 3.1 - What are the tuition costs for different types of PSE and what is its trend?
Source Documents: Literature Review, CESP Survey
Section of this report or available in Technical Report (TR): 3.1 - What are the living costs for students and what is its trend?
Source Documents: Literature Review, SHS Study
Section of this report or available in Technical Report (TR): 3.1
2. Is there a need for society to save more for PSE?
Source Documents: Literature Review, SHS Study
Section of this report or available in Technical Report (TR): 3.0
- How do grants and bonds motivate people to save?
Source Documents: Literature Review
Section of this report or available in Technical Report (TR): 3.3 - Why are some families saving for PSE while others are not saving?
Source Documents: SHS Study, Case Studies, CESP Survey
Section of this report or available in Technical Report (TR): 4.0 - How do families prioritize their spending and saving?
Source Documents: SHS Study, Case Studies, CESP Survey
Section of this report or available in Technical Report (TR): 4.0, 4.2.4 - What are the characteristics of families who do save versus those who do not save?
Source Documents: SHS Study, Case Studies, CESP Survey
Section of this report or available in Technical Report (TR): 4.0
3. How do RESPs compare to PSE savings plans in other countries?
Source Documents: Literature Review
Section of this report or available in Technical Report (TR): 3.3
- Are there other countries with programs similar to the CESP and what are their features?
Source Documents: Literature Review
Section of this report or available in Technical Report (TR): 3.3
Relevance: Alignment with Government Priorities
4. Do the objectives of the CESP align with federal government priorities?
Source Documents: Literature Review
Section of this report or available in Technical Report (TR): 3.2
- Is there an apparent or explicit pattern within the Government of Canada of building savings programs?
Source Documents: Literature Review
Section of this report or available in Technical Report (TR): 3.2 - Have recent public statements by the Government of Canada added to or improved the CESP/RESPs or have they marginalized/reduced these programs?
Source Documents: Literature Review
Section of this report or available in Technical Report (TR): 3.2 - Is the CESP consistent with/contribute to the Government of Canada’s priority “to create the best-educated, most-skilled and most flexible workforce in the world”?
Source Documents: Literature Review
Section of this report or available in Technical Report (TR): 3.2
5. Do the objectives of the CESP align with ESDC strategic objectives?
Source Documents: Literature Review
Section of this report or available in Technical Report (TR): 3.2
Relevance: Alignment with Federal Roles and Responsibilities
6. What is the role and responsibility for the federal government in delivering the CESP?
Source Documents: Literature Review
Section of this report or available in Technical Report (TR): 3.2. 7.2
Performance: Achievement of Expected Outcomes
7. What are RESP, CLB and A-CESG take-up rates and what is the trend?
Source Documents: Administrative Data Analyses, ASETS Study, CFCS Study
Section of this report or available in Technical Report (TR): 4.1
- What is the socio-economic and financial literacy profile of RESP, CLB and A-CESG participants and what is the trend?
Source Documents: Administrative Data Analyses, ASETS Study, CFCS Study, Literature Review
Section of this report or available in Technical Report (TR): 4.1, 4.2, 4.3 - At what age of the beneficiary are RESP accounts opened and what is the trend?
Source Documents: Administrative Data Analyses
Section of this report or available in Technical Report (TR): 4.2
8. Is there evidence to suggest that savings patterns for PSE in RESPs have changed due to the introduction of the CESG in 1998?
Source Documents: Literature Review, Administrative Data Analyses, ASETS Study, CRA-CESP Study
Section of this report or available in Technical Report (TR): 4.1
- Are more people saving for PSE using RESPs since 1998?
Source Documents: Administrative Data Analyses, CRA-CESP Study
Section of this report or available in Technical Report (TR): 4.1 - What has been the incremental impact on savings for PSE in RESPs?
Source Documents: No evidence
Section of this report or available in Technical Report (TR): No evidence - Has there been a further change in savings patterns for PSE in RESPs since the A-CESG and CLB were implemented?
Source Documents: Administrative Data Analyses, CRA-CESP Study
Section of this report or available in Technical Report (TR): 4.1, 4.2, 4.3 - What is the average annual amount saved for PSE in RESPs?
Source Documents: Administrative Data Analyses, CRA-CESP Study, Literature Review, ASETS Study, CFCS Study
Section of this report or available in Technical Report (TR): 4.2 - What is the total amount of PSE savings in RESPs and what is its trend?
Source Documents: Administrative Data Analyses, Literature Review, ASETS Study
Section of this report or available in Technical Report (TR): 6.0, 6.1 - To what extent are RESP savings for PSE diverted from RRSPs or other savings vehicles?
Source Documents: CESP Survey, SHS Study, Case Studies, CRA-CESP Study
Section of this report or available in Technical Report (TR): 4.2.4 - To what extent are CLB recipients contributing their own resources to RESPs?
Source Documents: Administrative Data Analyses, Case Studies
Section of this report or available in Technical Report (TR): 4.3.2 - To what extent are families who are in debt putting money into RESPs?
Source Documents: Case Studies, CESP Survey, CFCS Study
Section of this report or available in Technical Report (TR): 4.2.4
9. To what extent are Canadians saving for PSE outside of an RESP?
Source Documents: CESP Survey, Case Studies, YITS Study, ASETS Study, CFCS Study
Section of this report or available in Technical Report (TR): 5.1
- What sources of savings are they using?
Source Documents: CESP Survey, Case Studies, YITS Study, ASETS Study, CFCS Study
Section of this report or available in Technical Report (TR): 5.1 - Why are they not using RESPs?
Source Documents: CESP Survey, Case Study
Section of this report or available in Technical Report (TR): 5.2
10. Are more low-income families saving for PSE in RESPs?
Source Documents: Administrative Data Analyses, ASETS, CRA-CESP Study
Section of this report or available in Technical Report (TR): 4.3.1
- To what extent are A-CESG and CLB payments going to individuals who are in temporarily low-income families versus those in permanently low-income families?
Source Documents: CESP Survey, CRA-CESP Study
Section of this report or available in Technical Report (TR): 4.3.3 - Why are there some fairly high contributions at the very low family income levels?
Source Documents: No evidence
Section of this report or available in Technical Report (TR): No evidence - To what extent are RESP contributions for beneficiaries in low income families coming from relatives and/or friends?
Source Documents: CESP Survey, Case Studies, Administrative Data Analyses
Section of this report or available in Technical Report (TR): 4.3.2
11. Does having savings for PSE affect parental aspirations for their children’s PSE participation?
Source Documents: Literature Review, CESP Survey, ASETS Study, CFCS Study
Section of this report or available in Technical Report (TR): 4.2.3
12. What share of PSE funding comes from RESPs?
Source Documents: ASETS Study, CESP survey
Section of this report or available in Technical Report (TR): 6.1, 6.2
- How many students are withdrawing from RESPS and what is the trend?
Source Documents: Literature Review, Administrative Data Analyses
Section of this report or available in Technical Report (TR): 6.1
13. To what extent is the CESP improving the affordability of PSE?
Source Documents: CESP Survey, ASETS Study
Section of this report or available in Technical Report (TR): 6.2
- To what extent are parents who contribute to an RESP better prepared to bear the financial burden of their children’s PSE?
Source Documents: ASETS Study
Section of this report or available in Technical Report (TR): 6.2 - How does the presence of funds in RESPs affect the demand for student loans?
Source Documents: Literature Review, YITS Study, NGS Study, CESP Survey, Note on Interaction, ASETS Study, CFCS Study
Section of this report or available in Technical Report (TR): 6.2 - What impact do RESPs and the CESP have on student loan and grant amounts?
Source Documents: Literature Review, YITS Study, CESP Survey, Note on Interaction, ASETS Study, CSGP Survey
Section of this report or available in Technical Report (TR): 6.2 - What is the impact of RESPs and the CESP on reducing student debt loads?
Source Documents: Literature Review, NGS Study, ASETS Study
Section of this report or available in Technical Report (TR): 6.2 - What portion of PSE costs are covered by RESP savings?
Source Documents: CESP Survey, ASETS Study
Section of this report or available in Technical Report (TR): 6.0, 6.1, 6.2 - What other PSE funding strategies do students use?
Source Documents: YITS Study, NGS Study, CESP Survey, ASETS Study, CFCS Study
Section of this report or available in Technical Report (TR): 6.2
Performance: Demonstration of Efficiency and Economy
14. To what extent does CESP funding go to people who would not otherwise have saved for PSE in an RESP?
Source Documents: CESP Survey, SHS Study, ASETS Study, Literature Review, CRA-CESP Study
Section of this report or available in Technical Report (TR): 7.1
- How much additional funds do the CESP incentives leverage?
Source Documents: Administrative Data Analyses
Section of this report or available in Technical Report (TR): 4.1, 7.1
15. How efficient is the CESP delivery model?
Source Documents: Literature Review, CRA-CESP Study
Section of this report or available in Technical Report (TR): 7.2
- What are the administrative costs of the CESP and what is their trend (per beneficiary, per dollar administered)?
Source Documents: Literature Review
Section of this report or available in Technical Report (TR): 7.2 - How do these costs compare to the costs of administering other similar programs (CPP, EI, etc.) that are solely government-delivered?
Source Documents: Literature Review
Section of this report or available in Technical Report (TR): 7.2
Appendix 2 – Summary of studies conducted in support of the summative evaluation
ESDC (2012D), “Literature/File Review for the Summative Evaluation of the Canada Education Savings Program (CESP)”
The purpose of the literature and file review was to provide an overview of the information already available in the public domain and internal ESDC documents, completed surveys and research papers, and then compile the information (from over 70 documents) in order to provide evidence for a series of evaluation questions. This review demonstrated that much information was already available in the literature.
ESDC (2012C), “Impacts and Effects of the CESP on Family Savings: A Study Using the Access and Support to Education and Training Survey (ASETS)”
This study attempted to provide evidence on the impacts and effects of the CESP on family savings by using the 2002 Survey of Approaches to Educational Planning (SAEP) and 2008 ASETS, both of which were administered by Statistics Canada. The analysis was restricted to families with children under 18 years of age. The analysis was provided for different levels of income in order to compare the impacts of the CESP across income groups. The report provided information on families who had PSE savings and those which did not have PSE savings. The results were based on a sample of 7,545 parents with children aged 0-17.
ESDC (2012G), “PSE Students and RESP Savings Use: A Study Using the ASETS”
This study focused on the impact of the CESP on the affordability of PSE studies. The report also used data from Statistics Canada’s ASETS in order to determine what share of PSE funding came from RESPs and to what extent the CESP is improving the affordability of PSE. The selected sample used in this study was made up of 6,327 youth aged 18 to 24 years old.
Gray & McDonald (2012), “An Evaluation of the RESP program based on the National Graduate Survey”, Prepared for ESDC
This report used the 2000 and 2005 NGS of Statistics Canada, which surveyed students from public PSE institutions (universities, colleges and trade schools) who have graduated or completed the requirements for degrees, diplomas or certificates. The survey was designed to determine, for instance, the extent to which graduates of PSE programs were successful in obtaining employment; the relationship between the graduates' programs of study and the employment subsequently obtained; the graduates' job and career satisfaction; and the rates of under-employment and unemployment. The report included both descriptive statistics and regression analyses. The first part of the report focused on the incidence of RESPs as a funding source for PSE, while subsequent parts examined the impact of RESP funding on student loans.
ESDC (2012A), “Saving for PSE: Findings from the Canadian Financial Capability Survey”
The CFCS is a survey that was conducted by Statistics Canada in 2009, with the objective of shedding light on Canadians’ knowledge, abilities and behaviour concerning financial decision-making (i.e. how Canadians understand their financial situation, the financial services available to them, and their plans for the future). The study derived from the survey (sample size of 4,637) examines savings for PSE (including RESP savings) by individuals who are financially responsible for children under the age of 18 years old. The main purpose of the report was to identify the characteristics of PSE savers and measure the RESP take-up rate by socio-demographic characteristics.
ESDC (2012B), “Impacts and Effects of the CESP on Family Savings: A Study Using the Survey of Household Spending (SHS)”
The Statistics Canada SHS was designed to collect annual information about expenditures for consumer goods and services, changes in assets, mortgages and other loans, annual income, as well as information about dwelling characteristics and household equipment. The SHS is conducted annually from January to March of each year. For this study, the Public-Use Micro Files (PUMFs) were used, spanning from 1997 to 2009. Each year of the SHS was compared to ensure continuity in the variables. The focus of this study was mainly on household savings in general. It first examined whether families (especially low-income families) had adequate financial resources to generate savings and how they prioritized their spending. Then, it attempted to understand the possible impacts of the A-CESG and CLB on the net savings amounts and rates of eligible families.
Finnie & Wismer (2012), “Assessing the Use of Registered Education Savings Plans (RESPs) using Youth in Transition Survey (YITS) & Post-Secondary Education Participation Survey (PEPS)”, Prepared for ESDC
In this report, both the YITS (cohort A) and the PEPS were used for the analyses. The YITS-A follows a representative sample of youths starting in 2000 who were born in 1984. For this report, Cycles 3 and 4 (2004 and 2006) were used, as it is in these cycles where respondents (aged 18 to 21) had their first PSE experiences. The PEPS was conducted in February and March 2002 on youths between 18 and 24 years of age to collect information on education programs, student loans, and other PSE-related information. Using these surveys, this paper sought to answer a number of questions regarding savings behaviour of parents and how these were related to access to PSE and how PSE students funded their participation.
ESDC (2013A), “Registered Education Saving Plans: Participants, Take-up and Trends”
This report also used the administrative databases to examine issues related to participation in the RESP program. Using a 10% random sample for the 1998 to 2011 period of 452,837 beneficiaries (and 288,461 subscribers), the study looked at the number of RESP participants, RESP take-up and trends from 1998 to 2011. It also examined the profile of RESP participants and looked at the age at which RESP accounts are opened.
ESDC (2013B), “Registered Education Savings Plans: Saving Habits”
This report used the administrative databases to examine issues related to saving habits of RESP users. A 10% random sample for the 1998 to 2011 period of RESP beneficiaries from the CESP administrative database was used (452,837 beneficiaries in the sample). The report mainly examined annual RESP contributions, lifetime savings and the effects of the A-CESG and CLB on saving.
ESDC (2013C), “Registered Education Savings Plans: Canada Learning Bond Recipients”
This paper examined the RESP saving behavior of low-income families that have received the CLB at least once. The paper used a 10% random sample of RESP beneficiaries from the CESP administrative database and examined the period between 2005 and 2011. Since the report focused on CLB recipients the sample was restricted to those recipients, which accounted for 41,963 observations. The report attempts to answer if CLB recipients were contributing their own resources to RESPs, and the extent to which families entered and exited low-income status.
ESDC (2013D), “Registered Education Saving Plan Withdrawals”
This report assessed the impacts and effects of the CESP on the savings of families. It attempts to answer how many students are withdrawing from RESPs and what is the trend and what portion of PSE costs are covered by RESP savings. The paper uses a 10% random sample of 483,334 RESP beneficiaries between 1998 and 2012, of which 113,226 have withdrawn from their RESP during their PSE studies.
R. A. Malatest & Associates (2013), “Case Studies with Low-Income Families”, Prepared for ESDC
The case studies involved conducting a total of 104 in-depth interviews with parents from low- and middle-income families. Low-income families were defined as families with a total annual household income of less than $40,000, while middle-income families were defined as families with a total annual household income of between $40,000 and $82,000. Footnote 85 These interviews were equally divided between subscribers (i.e. those who have opened an RESP), and non-subscribers (drawn via random-digit telephone dialing). The primary purpose of the case studies was to document and assess the reasons for which some low-income families choose to save for PSE while others choose not to. In addition, the case studies provided evidence on the extent to which outside family members, relatives or friends are contributing to the RESPs of low-income families.
ESDC (2014D), “CESP Survey: Technical Evaluation Report”
A survey was conducted by R.A. Malatest and Associates with 2,015 families with children less than 18 years of age and children 18 and older who were attending a PSE institution, with a mixture of families with and without RESPs. The purpose of the survey was to gather information on four main issues: (i) why some families save for PSE using RESPs while others do not; (ii) the characteristics of those who save using RESPs versus those who do not; (iii) the impact of parental aspirations on RESP savings and children’s PSE participation; and (iv) the impact of RESP savings on PSE costs and student loan use. The survey was mainly conducted by telephone (or through the Internet) and had an average duration of approximately 20 minutes.
ESDC (2014C), “Examples of the Impact of RESP Withdrawals on Student Loan and Grant Amounts”
This report provided an initial examination of the impact of RESP withdrawals on student loan and grant amounts by presenting hypothetical examples that students could be confronted with when making RESP withdrawals. To determine the possible impact of RESP withdrawals on student financial aid for these hypothetical examples, Evaluation used the “Student Financial Assistance Estimator”, an online tool that it is provided by the department to help students obtain an estimate of the student financial aid (student loans and grants) that they might receive. Footnote 86 Although these hypothetical examples do not measure the importance of the interaction in terms of dollar value, they clearly demonstrate the strong interaction between the CSLP and CESP.
ESDC (2015), “Analysis of the Canada Education Savings Program Participation and Expenditures for Different Income Groups”
The study examined how participation and program expenditures vary by income group, how the introduction of the A-CESG in 2005 affected the RESP participation of lower-income families, and examined if RESP contributions affect RRSP contributions. The analyses are based on a random sample of families living with children under 18. The sample was based on linked data from the CRA T1 and CCTB files, and CESP administrative data and used a 1% sample of families who are in the CCTB database between 1999 and 2012. These are families living with children under 18 and who are primarily responsible for these children and registered for the CCTB.
Appendix 3 – CESP Logic Model
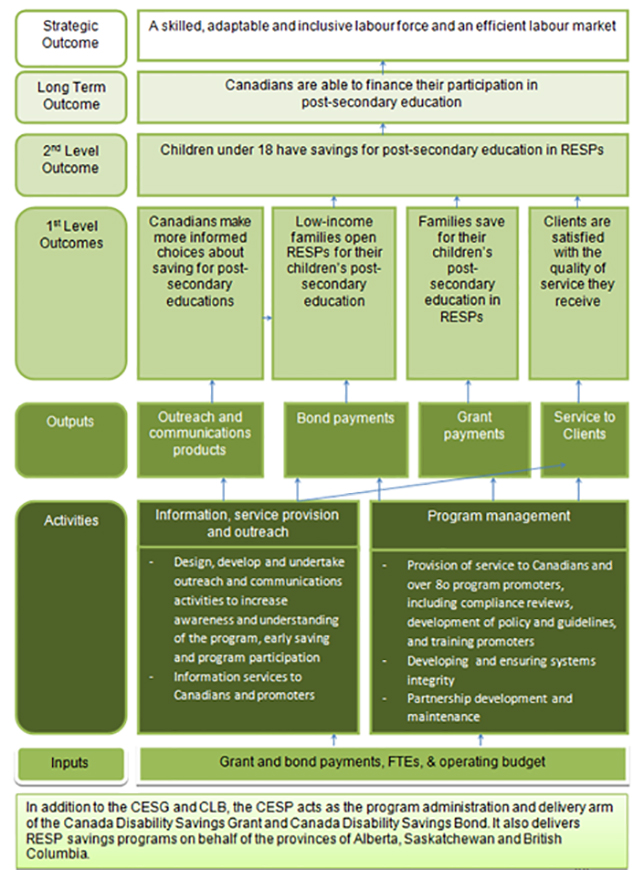
Text description of graph 5
Appendix 3 describes the Logic Model of the CESP, including the strategic outcome, long-term outcome, 2nd level outcome, 1st level outcomes, outputs, activities and inputs.
Strategic Outcome: A skilled, adaptable and inclusive labour force and an efficient labour market
Long Term Outcome: Canadians are able to finance their participation in post-secondary education
2nd Level Outcome: Children under 18 have savings for post-secondary education in RESPs
1st Level Outcomes:
- Canadians make more informed choices about saving for post-secondary education
- Low-income families open RESPs for their children’s post-secondary education
- Families save for their children’s post-secondary education in RESPs
- Clients are satisfied with the quality of service they receive
Outputs:
- Outreach and communications products
- Bond payments
- Grant payments
- Service to Clients
Activities:
- Information, service provision and outreach
- Design, develop and undertake outreach and communications activities to increase awareness and understanding of the program, early saving and program participation
- Information services to Canadians and promoters
- Program management
- Provision of service to Canadians and over 8o program promoters, including compliance reviews, development of policy and guidelines, and training promoters
- Developing and ensuring systems integrity
- Partnership development and maintenance
Inputs: Grant and bond payments, FTEs & operating budget
Appendix 4 – References
Internal studies
- ESDC (2011A), “Evaluability Assessment for the Summative Evaluation of the Canada Education Savings Program (CESP)”.
- ESDC (2012A), “Saving for PSE: Findings from the Canadian Financial Capability Survey”.
- ESDC (2012B), “Impacts and Effects of the CESP on Family Savings: A Study Using the Survey of Household Spending (SHS)”.
- ESDC (2012C), “Impacts and Effects of the CESP on Family Savings: A Study Using the Access and Support to Education and Training Survey (ASETS)”.
- ESDC (2012D), “Literature/File Review for the Summative Evaluation of the Canada Education Savings Program (CESP)”.
- ESDC (2012E), “Evaluation Framework for the Evaluation of the Canada Education Savings Program”.
- ESDC (2012F), “Evaluation Methodology for the Evaluation of the Canada Education Savings Program”.
- ESDC (2012G), “PSE Students and RESP Savings Use: A Study Using the ASETS”.
- ESDC (2013A), “Registered Education Saving Plans: Participants, Take-up and Trends”.
- ESDC (2013B), “Registered Education Savings Plans: Saving Habits”.
- ESDC (2013C), “Registered Education Savings Plans: Canada Learning Bond Recipients”.
- ESDC (2013D), “Registered Education Saving Plan Withdrawals”.
- ESDC (2013E), “RESP Contributions by Foreign-Born Parents: Using the Access and Support to Education and Training Survey (ASETS)”.
- ESDC (2014A), “Canada Education Savings Program (CESP) and Family Savings: Interim Evaluation Report”.
- ESDC (2014B), “Registered Education Saving Plan Contributions above the Maximum Grant Limit”.
- ESDC (2014C), “Examples of the Impact of RESP Withdrawals on Student Loan and Grant Amounts”.
- ESDC (2014D), “CESP Survey: Technical Evaluation Report”.
- ESDC (2015), “Analysis of the Canada Education Savings Program Participation and Expenditures for Different Income Groups”.
External studies contracted by ESDC
- Finnie and Wismer (2012), “Assessing the Use of Registered Education Savings Plans (RESPs) using Youth in Transition Survey (YITS) & Post-Secondary Education Participation Survey (PEPS)”, Prepared for ESDC.
- Gray and McDonald (2012), “An Evaluation of the RESP program based on the National Graduate Survey”, Prepared for ESDC.
- R. A. Malatest and Associates (2013), “Case Studies with Low-Income Families”, Prepared for ESDC.
Other studies
- Audet, Mathieu and Bele (2011), “Parental Savings for their Children’s Post-Secondary Education: Does Financial Literacy Matter?”, prepared for ESDC.
- Bank of Montreal (2013), “2013 Bank of Montreal Student Survey”, conducted by Pollara.
- Benjamin (2003), “Does 401(k) eligibility increase saving? Evidence from propensity score sub-classification”, Journal of Public Economics 87, pages 1259–1290.
- Benjamin and Smart (2011), “Do RESPs Increase Household Saving?”, Preliminary Draft.
- Benjamin and Smart (2012), “Savings Trends in Canada”, prepared for ESDC.
- Berger, Motte and Parkin (2009), “The Price of Knowledge 2009: Access and Student Finance in Canada”, 4th edition, Millennium Research Series, Canada Millennium Scholarship Foundation.
- Beshears et al. (2006), “The importance of default options for retirement savings outcomes: Evidence from the United States.” NBER, Working Paper #12009.
- Beverly, Clancy and Sherraden (2014), “Testing Universal College Savings Accounts at Birth: Early Research from SEED for Oklahoma Kids”, Centre for Social Development, Research Summary 14-08.
- Canadian University Survey Consortium (2012), “Survey of Graduating Undergraduate Students”, June 2012, Prepared by Prairie Research Associates.
- Choi, Laibson and Madrian (2004), “Plan Design and 401(k) Savings Outcomes”, Written for the National Tax Journal Forum on Pensions.
- Connolly and Kohler (2004), “The impact of superannuation on household saving”, Research Discussion Paper, Economic Research Department, Reserve Bank of Australia.
- Corak et al. (2010), “A Comparison of Upward and Downward Intergenerational Mobility in Canada, Sweden and the United States”, Paper Prepared for the 31st General Conference of The International Association for Research in Income and Wealth, St. Gallen, Switzerland, August 22-28, 2010.
- Dworak-Fisher (2008), “Encouraging Participation in 401(k) Plans: Reconsidering the Employer Match.” U.S. Bureau of Labor Statistics Working Paper 420.
- Dynarski (2004), “Who Benefits From the Education Savings Incentives? Income, Educational Expectations, and the Value of the 529 and Coverdell,” Harvard University, Kennedy School of Government & National Bureau of Economic Research.
- Engelhardt and Kumar (2007), “Employer Matching and 401(k) Saving: Evidence from the Health and Retirement Study.” Journal of Public Economics, 91(10): 1920-43.
- ESDC (2011B), “Summative Evaluation of the Canada Student Loans Program”.
- ESDC (2011C), “Final Report: Linking CSLP-CESP-LAD Data to Analyze Program Interactions”, prepared by CESP and CSLP Directorates.
- ESDC (2014E), “Canada Student Loans Program - Policy Manual”.
- Finance Canada (1998), “Building Canada for the 21st century: The Budget Plan 1998”.
- Finance Canada (1998), “Building Canada for the 21st century: The Canadian Opportunities Strategy”.
- Finance Canada (2004), “New Agenda for Achievement: The Budget Plan 2004”.
- Financial Services Authority of Great Britain (2005), “Measuring Financial Capability: An Exploratory Study”, University of Bristol, Personal Finance Research Centre.
- Gale, Iwry and Orszag (2005), “The Saver’s Credit: Expanding Retirement Savings for Middle- and Lower-Income Americans”, The Retirement Security Project, Number 2005-2.
- Human Resources and Skills Development Canada (2003), “Formative Evaluation of the Canada Education Savings Grant”.
- Human Resources and Skills Development Canada (2009), “Formative Evaluation of the Additional Canada Education Savings Grant and Canada Learning Bond”.
- Human Resources and Skills Development Canada (2014), “Canadian Education Savings Program Annual Statistical Review 2013”.
- Human Resources and Skills Development Canada (2014), News release, “Minister Bergen encourages families to apply for the Canada Learning Bond”, January 23, 2014.
- Informetrica (2008), “Review of Registered Education Savings Plan Industry Practices”.
- Kempson, Finney and Davies (2011), “The Child Trust Fund Findings from the Wave 2 Evaluation”, Personal Finance Research Centre, University of Bristol.
- Madrian and Shea (2001), “The Power of Suggestion: Inertia in 401(k) Participation and Savings Behavior”, Quarterly Journal of Economics, 2001, v116 (4, Nov), pages 1149-1187.
- Madrian (2012), “Matching Contributions and Savings Outcomes: A Behavioral Economics Perspective”, NBER Working Paper No. 18220.
- Mitchell, Utkus and Yang (2007), “Turning Workers into Savers? Incentives, Liquidity, and Choice in 401(k) Plan Design.” National Tax Journal, 60(3): 469-89.
- Office of the Superintendent of Financial Institutions Canada (2012), “Actuarial Report on the Canada Student Loans Program as at 31 July 2011”.
- Organization for Economic Cooperation and Development (2014), “Education at a Glance 2014: Organization for Economic Cooperation and Development Indicators”.
- Scotiabank Group (2014), “Canadian Parents Are Not Confident They Are Saving Enough for Their Children's Post-Secondary Education”, conducted by Nielsen from August 19 through August 27, 2014.
- Statistics Canada (1995-1999), “The Daily: University tuition fees”, Tuition and living accommodation costs at Canadian universities and colleges.
- Statistics Canada (2014), “Survey of Approaches to Educational Planning, 2013”, The Daily, October 29, 2014.
- Statistics Canada (2013), “Tuition and Living Accommodation Costs for Full-Time Students at Canadian Degree-Granting Institutions Survey”.
- TD Canada Trust Education and Finance (2011), “Parents struggle to save for kids’ post-secondary studies”.
- VanDerhei (2010), “The Impact of Automatic Enrollment in 401(k) Plans on Future Retirement Accumulations: A Simulation Study Based on Plan Design Modifications of Large Plan Sponsors”, EBRI Issue Brief, April 2010, No. 341.
- World Bank (2013), “Matching Contributions for Pensions: A Review of International Experience”.