
Evaluation of the Aboriginal Skills and Employment Training Strategy and the Skills and Partnership Fund
Official title: Evaluation of the Aboriginal Skills and Employment Training Strategy and the Skills and Partnership Fund
On this page
- List of tables
- List of figures
- Executive summary
- Introduction
- Program background
- Main finding #1
- Main finding #2
- Main finding #3
- Main finding #4
- Conclusion
- Recommendations
- Management response and action plan
- Annexes
- List of acronyms
Alternate formats

Evaluation of the Aboriginal Skills and Employment Training Strategy and the Skills and Partnership Fund
[PDF - 1.33 MB]
Large print, braille, MP3 (audio), e-text and DAISY formats are available on demand by ordering online or calling 1 800 O-Canada (1-800-622-6232). If you use a teletypewriter (TTY), call 1-800-926-9105.
List of tables
- Table 1: Strategy and fund objectives, delivery and activities
- Table 2: Strategy and fund participants by gender
- Table 2a: Strategy and fund participants by age
- Table 2b: Strategy and fund participants by education
- Table 3: Distribution of strategy and fund participants by EI claimant category
- Table 4: Distribution of strategy participants across Canada
- Table 4a: Distribution of strategy participants by urban-rural dimension
- Table 5: Distribution of fund participants across Canada
- Table 5a: Distribution of fund participants by urban-rural dimension
- Table 6: Strategy and fund - Type of intervention and number of participants
- Table 7: Strategy incremental impacts, 3 year post-participation period
- Table 8: Fund incremental impacts, 3 year post-participation period
- Table 9: Active EI claimants - Close-up on the strategy's incremental impacts, 3 year post-participation period
- Table 10: Former EI claimants - Close-up on the strategy's incremental impacts, 3 year post-participation period
- Table 11: Non EI claimants - Close-up on the strategy's incremental impacts, 3 year post-participation period
- Table 12: Skills development
- Table 13: Employment assistance services
- Table 14: Skills development essential skills
- Table 15: Student work experience
- Table 16: Job creation partnership
- Table 17: Targeted wage subsidies
List of figures
- Figure 1: Strategy and fund participants by Indigenous distinction group, 2011 to 2012
- Figure 2: Cumulative impact, active EI claimant
- Figure 3: Cumulative impact, former EI claimant
- Figure 4: Cumulative impact, non EI claimant
Executive summary
This report presents the findings and conclusions from the summative evaluation of the Aboriginal Skills and Employment Training Strategy (the strategy) and the Skills and Partnership Fund (the fund) programs funded by Employment and Social Development Canada (the department).
For the past 2 decades, the department has played an important role in the provision of labour market programming for Indigenous people.
- The strategy (April 2010 to March 2018) is a program designed to increase the participation and integration of Indigenous people with the Canadian labour force. The strategy provided annual funding to Indigenous service delivery organizations via contribution agreements for up to 5 years, to design and deliver skills development training and employment supports for Indigenous people.
- The fund (April 2010 to Present) is a demand-driven, project-based contribution program that supports partners’ specific employment goals by funding short-term projects (from 1 to 3 years) contributing to the skills development, job training, as well as employment supports for Indigenous People.
Overall, interventions provided under the strategy and the fund were found to improve participants’ labour market attachment. Results vary by type of interventions and participants’ characteristics. There were 4 main findings of the evaluation:
- skills development was the most effective intervention for improving participants’ labour market attachment, regardless of their Employment Insurance claimant status
- employment assistance services and targeted wage subsidies interventions also showed positive results, particularly for participants with relatively stronger labour market attachment
- sustainable partnerships were developed and fostered with Indigenous partners. Still, some Indigenous Agreement Holders reported concerns about the implications of administrative reporting on their relationship with the department
- the Aboriginal Human Resources and Development Agreements, predecessors of similar agreements under the strategy, yielded a positive social return on investment over a 12-year period (2 years in-program and 10 years post-participation) when taking into account costs and benefits for both governments and participants. In particular, from a societal perspective, interventions’ benefits outweigh their associated costs in less than 9 years, and in less than 5 years for participants with stronger attachment to the labour market
There is a high degree of similarity between the strategy and the fund in terms of the participants, organizations and the types of interventions provided. Given their respective policy intents, consideration could be given to conducting a review and analysis of the approach taken to better differentiate between the strategy and the fund and ensure value for money.
Based on these findings, the evaluation recommends the following:
- recommendation 1: It is recommended that the department better leverage data to collaborate with partners to improve the program
- recommendation 2: It is recommended that the department continue to seek improvements in the administration of agreements with participating Indigenous organizations
Introduction
This summative evaluation report presents the findings and conclusions regarding the Employment and Social Development Canada’s (the department) Indigenous labour market programs: The Aboriginal Skills and Employment Training Strategy (the strategy) and the Skills and Partnership Fund (the fund). It was completed in compliance with the Financial Administration Act and the Policy on Results.
To conduct the incremental impact analysis, the department relied on its Labour Market Data Platform using participants who initiated an intervention between January 2011 and December 2012. This period was selected to obtain the most recent results for the strategy and the fund. In particular, the selection of interventions initiated between January 2011 and December 2012 allows for assessing their impacts on labour attachment outcomes over a period of at least 3 years following their completion up to calendar year 2016 (most recent available information).
The cost-benefit analysis used a cohort of participants who completed their intervention between January 2003 and December 2005 in order to obtain a complete long-term 10-year view of the participants’ changes in employment earnings, incidence of employment and use of income supports.
The specific methodologies used to assess the programs performance are described in Annex C and in the technical report which is available upon request.
Incremental impacts for the strategy and the fund are presented by Employment Insurance claimant stream (active EI claimants, former EI claimants and non EI claimants). Only for the strategy were the selected number of participants sufficiently large to support more granular analyses at the intervention (with the exception of the Skills Development Apprenticeship and Self-employment interventions) and sub-group levels (for example men and women).
Program background
Introduced in 2010, the strategy and the fund share the same objective of increasing Indigenous participation in the Canadian labour market. The fund differs from the strategy in terms of its delivery model. The fund is a demand-driven project-based program geared towards emerging large-scale projects, such as (but not limited to) natural resource extraction projects that contribute to skills development and training of Indigenous people.
Table 1. Strategy and fund objectives, delivery and activities
For accessibility reasons, the information is presented in text format. Consult the PDF version for the table.
Aboriginal Skills and Employment Training Strategy Program
Objective:
Improving Indigenous peoples' participation in the Canadian workforce. Ensuring that First Nations, Inuit and Métis have the skills and training for sustainable, meaningful employment.
Delivery:
Ongoing basis through 85 Indigenous agreement holders with over 600 service points across Canada.
Funding (2011 to 2018):
$2.43 billion ($292 million annually to 2015 and 2016; $342 million annually to 2017 and 2018)
Funded activities:
Labour market programming that meets the specific needs of Indigenous individuals:
- essential skills development
- employment supports
- training-to-employment
Eligible recipients:
Indigenous organizations
Participants:
All Indigenous people across Canada
Skills and Partnership Fund
Objective:
Contributing to the skills development of Indigenous individuals and their transition from training towards long-term, meaningful, employment.
Delivery:
Any Indigenous organizations in Canada with a partnership with employers responding to calls for proposals.
Funding (2011 to 2018)
$325 million ($42 million annually to 2014 and 2015; $15 million for 2015 and 2016 and $50 million annually thereafter)
Funded activities:
Indigenous labour market activities focused on emerging or untapped economic development opportunities to meet the needs of high-demand sectors, as well as areas with skills shortages:
- training-to-employment
- skills development
- service improvement
Eligible recipients:
Indigenous organizations
Participants:
All Indigenous people across Canada
Chronology of recent indigenous labour market programming
For the past 2 decades, the department has funded Indigenous organizations to provide labour market programming to Indigenous people. The latest iteration, the Indigenous Skills and Employment Training Program, replaced the strategy as of 2019.
The strategy
Aboriginal Human Resources Development Strategy (April 1999 to March 2010)
This program was designed to help improve the employment opportunities of Indigenous peoples and enable them to fully participate in the Canadian economy. Financial assistance was provided to Indigenous organizations to support the costs of human resources development programs designed and delivered by those organizations to their Indigenous participants.
Aboriginal Skills and Employment Training Strategy (April 2010 to March 2018)
This program was designed to increase the number of Indigenous people employed and integrated into the Canadian labour force. This program emphasized the development of demand-driven skills, fostered partnerships with the private sector and other levels of government and accountability for improved results.
Indigenous Skills and Employment Training Program (April 2019 to Present)
The program aims to help reduce the skills and employment gaps between Indigenous and non-Indigenous people by providing Indigenous peoples with opportunities to develop and upgrade skills and attain employment.
The fund
Aboriginal Skills and Training Strategic Investment Fund (April 2009 to March 2011)
The program provided funding for short-term, focused initiatives designed to help Indigenous Canadians obtain specific training.
Aboriginal Skills and Employment Partnerships Fund (April 2003 to March 2010)
This program was a nationally managed, opportunity-driven (in other words, focused on identified job opportunities), targeted Indigenous skills development program designed to maximize employment for Indigenous people in major economic development projects.
Skills and Partnership Fund (April 2010 to present)
The fund is a demand-driven, project-based contribution program that supports government priorities and partnerships by funding short-term projects (in other words from 1 to 3 years) contributing to the skills development, training, as well as employment of Indigenous peoples.
Transitioning from the Aboriginal Skills and Employment Training Strategy to the Indigenous Skills and Employment Training Program
The 2018 federal budget announced the creation of the Indigenous Skills and Employment Training Program with an investment of $2 billion over 5 years and $408.2 million ongoing from 2019 to 2028 . It will replace the Aboriginal Skills and Employment Training Strategy, with the goal of helping reduce skills and employment gaps between Indigenous and non-Indigenous People in Canada. Through co-development with Indigenous organizations, a new distinctions-based approach will be introduced to better meet the needs of First Nations, Inuit, Métis, and Urban/Non-Affiliated Indigenous People.
Participants will have a seamless transition, as there is a high degree of similarity between the programs in terms of the participant population, delivering organizations and types of interventions provided. The distinctions-based approach, additional funding and enhanced administrative flexibilities, will enable First Nations, Inuit, Métis and Urban/Non-Affiliated Indigenous organizations to design and deliver labour market strategies that recognize and respond to their unique needs, as well as support strategic planning and priority setting.
Strategy and fund participants
Funding provided through the strategy and the fund supported over 80,000 participants between January 2011 and December 2012.
- Most individuals (75,625 or approximatively 94%) participated in interventions offered by Indigenous organizations through the strategy
- Approximately 6% of participants (or 4,487) were associated with interventions delivered under the fund
The distribution of participants by Indigenous Distinction (see Annex B for definitions) was roughly similar across the strategy and fund:
- First Nations with Indian Status made up 79% of Strategy participants and 82% of Fund participants, while First Nations without Indian Status represented 5% of strategy participants versus 8% of fund participants
- Métis represented 11% of participants in the strategy relative to 4% in the fund, the largest percentage point difference in terms of representation across programs
- Inuit made up 5% of Strategy participants compared with 8% of Fund participants
Why does the evaluation focus on the cohorts of participants from 2011 and 2012?
In order to properly evaluate the impact of the program on participants, it is necessary to have several years of labour market outcomes after participation to assess the effectiveness of an intervention.
By using these cohorts, the evaluation can leverage the most recent tax records available to conduct this analysis (up to 2016).
As such, the analysis can better reflect what happened following participation and carefully build a comparison group to control for any economic factors and cohort effects that might be unique to the reference period.
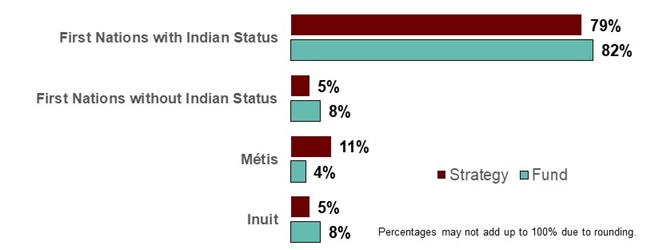
Figure 1 – Text version
| Indigenous distinction | Strategy | Fund |
|---|---|---|
| First Nations with Indian status | 79% | 82% |
| First Nations without Indian status | 5% | 8% |
| Métis | 11% | 4% |
| Inuit | 5% | 8% |
Strategy and fund participants: Gender, age and education
Among strategy and fund participants:
- under both programs, the majority of participants were men, representing 63% of participants under the fund and 54% under the strategy
- more than half of the participants were 30 years old or younger
- most participants had, at least, a secondary school diploma at the start of the intervention, but only a few had completed a post-secondary degree
- almost one-third (30% of Strategy participants and 32% of Fund participants) were supporting one or more dependents
For accessibility reasons, the information is presented in text format. Consult the PDF version for the figure.
| Gender | Strategy | Fund |
|---|---|---|
| Men | 54% | 63% |
| Women | 46% | 37% |
| Age | Strategy | Fund |
|---|---|---|
| 30 years of age or less | 56% | 55% |
| 31 to 54 years of age | 39% | 42% |
| Over 55 years of age | 5% | 3% |
| Education | Strategy | Fund |
|---|---|---|
| Post-secondary complete | 2% | 1% |
| Post-secondary incomplete | 23% | 27% |
| Industrial training | 10% | 13% |
| Secondary complete | 30% | 27% |
| Secondary incomplete | 31% | 30% |
| No education | 3% | 2% |
Strategy and fund participants: Employment insurance claimant status
Due to the eligibility criteria of EI, claimant status is a good indicator of the degree of labour market attachment for a participant at the start of an intervention. These claimant categories are also important for the strategy with respect to the source of funding for the program.
- Non-claimants made up the majority of participants in both the strategy (69%) and the fund (63%)
- Fund participants were slightly more likely (14%) to be active claimants than were Strategy participants (10%)
Definitions
Active EI claimants
Have an open EI benefit claim and are collecting benefits at the start of their intervention.
Former EI claimants
Have no open EI benefit claim and do not collect benefits at the start of their intervention, but have received some EI benefits within the 3-year period prior to starting the intervention.
Non EI claimants
Have no open EI benefit claim and do not collect benefits at the start of their intervention and have not received any EI benefits within the 3-year period prior to starting the intervention.
For accessibility reasons, the information is presented in text format. Consult the PDF version for the figure.
| Employment Insurance claimant category | Strategy | Fund |
|---|---|---|
| Active EI claimants | 10% | 14% |
| Former EI claimants | 21% | 22% |
| Non-claimants | 69% | 63% |
The Role of EI in the strategy and the fund
The Aboriginal Skills and Employment Strategy had 2 sources of funds: The Consolidated Revenue Fund and the EI Operating Account which funds EI benefits provided under Part I and Part II of the Employment Insurance Act.
Support for the strategy was part of the EI Program’s Pan-Canadian activities, in which the federal government plays a primary role in responding to challenges that extend beyond local and regional labour markets. In fiscal year 2017 to 2018, the EI Operating Account contributed $100.9 million to fund the employment benefits and support measures delivered to Indigenous active and former EI claimants through the strategy.
The Skills and Partnership Fund is funded from the Consolidated Revenue Fund.
Strategy and fund participants: Distribution by location
Geographically, in line with their delivery model, the distribution of participants by province and territory under the strategy and the fund differs significantly. The strategy participants are located across Canada whereas the fund participants are located where partners’ projects were located from January 2011 to December 2012.
- Along an urban-rural dimension, based on postal codes (see Annex B), participants were almost equally divided with Fund participants somewhat more likely to be in rural communities than Strategy participants.
For accessibility reasons, the information is presented in text format. Consult the PDF version for the figure.
| Distribution by province and territory | Distribution (percentage) |
|---|---|
| Yukon | 1.7 |
| Northwest Territories | 3.5 |
| Nunavut | 1.0 |
| British Columbia | 22.5 |
| Alberta | 16.7 |
| Saskatchewan | 9.2 |
| Manitoba | 16.5 |
| Ontario | 15.2 |
| Quebec | 9.0 |
| Nova Scotia | 1.1 |
| Prince Edward Island | 0.6 |
| New Brunswick | 2.0 |
| Newfoundland and Labrador | 1.0 |
| Urban-rural distinction | Distribution (percentage) |
|---|---|
| Rural | 48 |
| Urban | 52 |
For accessibility reasons, the information has been simplified. Consult the PDF version for the figure.
| Distribution by province and territory | Distribution (percentage) |
|---|---|
| Yukon | 0.1 |
| Northwest Territories | 5.9 |
| Nunavut | 3.0 |
| British Columbia | 26.3 |
| Alberta | 0.9 |
| Saskatchewan | 21.6 |
| Manitoba | 3.2 |
| Ontario | 6.9 |
| Quebec | 18.3 |
| Nova Scotia | 2.6 |
| Prince Edward Island | 1.7 |
| New Brunswick | 8.5 |
| Newfoundland and Labrador | 0.4 |
| Urban-rural distinction | Distribution (percentage) |
|---|---|
| Rural | 48 |
| Urban | 52 |
Types of interventions delivered under the strategy and the fund
Approximately 72% of all Strategy and 80% of all fund participants participated in the Skills Development and employment assistance services interventions, over the reference period (January 1, 2011 to December 31, 2012).
| Intervention type | Strategy (number of participants | Strategy (percentage of total participants)* | Fund (number of participants) | Fund (percentage of total participants)* |
|---|---|---|---|---|
Skills development Provides funding to enable participants to access training. |
31,125 | 41% | 1,623 | 36% |
Employment assistance services Provides funding to organizations who provide employment assistance such as, counselling, attend workshops, use of computers. |
23,733 | 31% | 1,991 | 44% |
Skills development - Essential skills Provides funding to enable participants to access essential skills training. |
6,080 | 8% | 516 | 11% |
Student work experience Provides employment opportunities to students to gain experience to enhance their employability and occupational skills. |
5,799 | 8% | 14 | 0.3% |
Job creation partnership Provides participants with opportunities to gain work experience that will lead to ongoing employment. |
3,284 | 4% | 11 | 0.2% |
Targeted wage subsidies Provides employers with financial assistance for the participants’ wages to gain on-the-job experience. |
2,926 | 4% | 211 | 5% |
Skills development - Apprenticeship Provides funding in support of in classroom training participation. |
2,229 | 3% | 121 | 3% |
Self-employment Provides individuals with financial assistance to help them start their own businesses. |
449 | 1% | n/a | n/a |
| Total | 75,625 | 100% | 4,487 | 100% |
Source: Administrative data technical report.
* Percentages may not add to 100% due to rounding.
Main finding #1
Overall, the strategy had a positive impact on participants’ labour market attachment.
Following an intervention, strategy participants had increases in employment earnings, incidence of employment and decreases in reliance on Social Assistance compared to non-participants after controlling for other factors.
During the 3-year period following an intervention:
- active EI claimants experienced the largest gains in earnings (+$10,920 over 3 years) and incidence of employment (+3.9 percentage points per year)
- former EI claimants experienced the largest decrease in Social Assistance used (-$830 over 3 years)
- non EI claimants, experienced more modest improvements in labour market attachments
Comparison groups
Incremental impacts compare participant results to the results of a comparison group to learn about what would have happened in the absence of the program.
Please note that estimates for former EI claimants and non EI claimants are likely underestimates as the population pool used to construct the comparison groups consists of individuals who received low intensity support measures in the form of employment assistance services (only).
See Annex C for more details on the comparison groups.
| Category | Employment earnings (cumulative) in Canadian dollars | Incidence of employment (annual average) in percentage points (pp) | Social assistance (cumulative) in Canadian dollars* |
|---|---|---|---|
| Active | $10,920 | +3.9 pp | -$180 |
| Former | $4,000 | +2.7 pp | -$830 |
| Non claimant | $2,400 | +2.1 pp | -$390 |
Source: Administrative data technical report.
* Results are statistically not significant, still they are valid in terms of informing the direction of the impact (negative or positive)
Taken as a whole, interventions provided under the fund were found to improve participants’ labour market attachments.
- Overall, former EI claimants experienced relatively larger improvements compared to those found for active EI and non-EI claimants. During the 3-year period following their participation, these interventions led to:
- a cumulative increase of $6,010 in earnings
- an average annual increase of 5.3 percentage points in their annual incidence of employment, and
- a cumulative decrease of $480 in post-participation receipt of social assistance benefits
- Active EI claimants experienced similar improvements in post-participation earnings as those found by former EI claimants, but impact on the incidence of employment was very small
- Non EI claimants, experienced more modest improvements in their labour market attachments
Similarity between the fund and the strategy
There is a high degree of similarity between the strategy and the fund in terms of the participants, organizations and the types of interventions provided.
| Category | Employment earnings (cumulative) in Canadian dollars | Incidence of employment (annual average) in percentage points (pp) | Social assistance (cumulative) in Canadian dollars* |
|---|---|---|---|
| Active | $5,000 | +0.3 pp * | -$220 |
| Former | $6,010 | +5.3 pp | -$480 |
| Non claimant | $1,240 | +1.1 pp * | -$210 |
Source: Administrative data technical report.
* Results are statistically not significant, still they are valid in terms of informing the direction of the impact (negative or positive)
Main finding #2
The strategy’s skills development intervention was the most effective at improving participants’ labour market attachment.
In addition, Employment Assistance Services and targeted wage subsidies interventions showed positive results particularly for participants with relatively stronger labour market attachment.
This section presents the incremental impacts on labour market attachments by EI claimant status. This is done with a view to inform which interventions are more conducive to improve labour market attachment and for whom.
- As mentioned earlier, EI claimant status is a good indicator of the degree of labour market attachment for a participant at the start of an intervention
In terms of interventions, all Strategy interventions have been compiled into 8 types of interventions available to participants:
- Skills Development
- Employment assistance services
- Skills Development Essential Skills
- Student Work Experience
- Job creation partnership
- Targeted wage subsidies
- Skills Development Apprenticeship
- Self-Employment
Since the number of selected participants was not sufficiently large to allow for this type of analysis to be conducted for the fund participants, the incremental impact analysis is limited to interventions provided to the strategy’s participants.
- In addition, no impact analysis was conducted for the Self-Employment and Skills Development Apprenticeship interventions since no comparison group could be built
The impact analysis focuses on the initial years following an intervention, up to calendar year 2016 (most recent available information).
Determining a participant’s intervention type
A number of different types of employment benefits and support measures, or interventions, are available to participants in the strategy. In fact, a participant may undertake multiple types of interventions as part of their engagement with the strategy. Depending on the participants’ needs and the steps identified to foster their labour market attachment, the combination of interventions and their sequencing may differ across individualized action plans (for example the acquisition of essential skills taking place prior to the acquisition of more specific skills development intervention).
The unit of analysis used for the assessment of incremental impacts is the Action Plan Equivalent (APE), which is a group of interventions an individual participated in within 6 months of each other (in other words, a gap of 6 months or less between the end of one intervention and the beginning of the next). The principal intervention is the longest one within an APE.
In particular, the average number of APEs taken by a participant was 1.17 during the reference period. In order to classify cases where there were multiple intervention types, the incremental impact analysis combined all interventions that a participant received within 6 months (183 days) and assigned a participant to the longest intervention received. For those participants who received more than one intervention, incremental impacts will reflect the interactions between these interventions.
Main takeaways
Across all claimant categories:
- the Skills Development intervention reached about 41% of the strategy’s participants and were the most effective at improving participants’ labour market attachment, regardless of their EI claimant status
- the targeted wage subsidies intervention reached a smaller share of the strategy’s participants (3.9%) but led to positive results on earnings, incidence of employment and reliance on Social Assistance, particularly for those with relatively stronger labour market attachment (in other words, active EI and former EI claimants)
- Employment Assistance Services served just over 31% of all clients. Though results were only available for active EI claimants, who typically have stronger labour market attachment, results were positive across all indicators
Active EI claimants category
An active EI Claimant is an Individual who has an open EI benefit claim and is collecting benefits at the start of his/her intervention.
Among participants in the strategy, active EI claimants had relatively stronger attachment to the labour market compared to other participants and represented about 10% of participants.
- For active EI claimants, the incremental impacts were measured relative to a comparison group of Indigenous active claimants who were eligible to, but did not, participate in programs and services provided under the strategy or the fund
For this group of participants, results indicate that the following interventions are conducive to improvements in the participant’s labour market attachment:
- Skills Development
- Employment Assistance Services
- Targeted wage subsidies
On average, active claimants who took part in these 3 types of interventions improved their labour market attachment through increase in earnings, incidence of employment and decrease in their use of social assistance benefits relative to their counterparts among non-participants.
On the other hand, positive labour market impacts were small for active EI claimants who took part in the Skills Development - Essential Skills, suggesting that this type of intervention, while necessary, may not have been sufficient to foster stronger attachment to the labour market.
For active claimants, improvements in labour market attachment were similar across gender and urban/rural settings (see table 9 for more detailed results).
Due to the small number of EI claimants participating in the Job creation partnership and Student Work Experience no net-impact analysis could be conducted for these interventions
| Category | Employment earnings (cumulative) in Canadian dollars | Incidence of employment (annual average) in percentage points (pp) | Social assistance (cumulative) in Canadian dollars |
|---|---|---|---|
| Overall | $10,920 | +3.9 pp | -$180 |
| By intervention | |||
| Skills development | $14,930 | +4.9 pp | -$360 |
| Employment assistance services | $7,340 | +3.8 pp | -$240 * |
| Skills development essential skills | $750 * | +0.9 pp * | $530 * |
| Targeted wage subsidies | $6,560 | +6.4 pp | -$1,180 |
| By sub-group | |||
| Men | $12,600 | +2.9 pp | -$90 * |
| Women | $10,060 | +5.9 pp | -$460 |
| Urban | $10,940 | +4.1 pp | -$160 * |
| Rural | $11,240 | +3.0 pp | -$200 |
Source: Administrative data technical report.
* Results are statistically not significant, still they are valid in terms of informing the direction of the impact (negative or positive)
For example, as shown in table 9, in the 3-year period following the receipt of Targeted wage subsidies by participants, the intervention led to:
- a cumulative increase of $6,560 in employment earnings
- an average annual increase of 6.4 percentage points in the incidence of employment
- a cumulative decrease of $1,180 in receipt of social assistance benefits
Former EI claimants category
A Former EI Claimant is an individual who has no open EI benefit claim and do not collect benefits at the start of his/her intervention, but has received some EI benefits within the 3-year period prior to starting the intervention
Among participants in the strategy, former EI claimants typically had weaker labour market attachments (relative to active EI claimants) and represented about 21% of participants. In particular, they are more likely to be underemployed, or out of the labour force for various reasons or on Social Assistance.
- For former EI claimants, the incremental impacts were measured relative to a comparison group of Indigenous former claimants who received low intensity employment services interventions (in other words, Employment Assistance Services only), but did not participate in the strategy or the fund.
For this group of participants, results indicate that the following interventions are conducive to improvements in the participant’s labour market attachment:
- Skills development
- Skills development - Essential skills
- Targeted wage subsidies
On average, former EI claimants who took part in one of these 3 types of interventions improved their labour market outcomes through increases in earnings, incidence of employment and decrease in their use of social assistance benefits.
On the other hand, labour market impacts were mixed for those who took part in job creation partnership. The mix of positive and negative results reflect, in part, the short-term nature of these interventions and that this intervention generally targets individuals with multiple barriers and weak labour market attachments.
Among former EI claimants positive incremental impacts for women and urban participants were generally larger relative to those found for men and rural participants, respectively (see table 10 for more detailed results).
Due to the selection for the control group, no net-impact analysis could be conducted for Employment Assistance Services.
The same applies to Student Work Experience due to the small number of former EI claimants using this intervention.
| Category | Employment earnings (cumulative) in Canadian dollars | Incidence of employment (annual average) in percentage points (pp) | Social assistance (cumulative) in Canadian dollars |
|---|---|---|---|
| Overall | $4,000 | +2.7 pp | -$830 |
| By intervention | |||
| Skills development | $5,470 | +3.0 pp | -$800 * |
| Skills development essential skills | $5,330 | +1.6 pp * | -$500 |
| Job creation partnership | -$2,010 * | +2.1 pp * | -$500 * |
| Targeted wage subsidies | $4,400 | +5.7 pp | -$1,300 |
| By sub-group | |||
| Men | $2,180 * | +1.4 pp * | -$670 |
| Women | $6,840 | +3.1 pp | -$1,100 |
| Urban | $6,210 | +1.9 pp | -$1,010 |
| Rural | -$350 * | +1.6 pp * | -$450 |
Source: Administrative data technical report.
* Results are statistically not significant, still they are valid in terms of informing the direction of the impact (negative or positive)
For example, as shown in table 10, in the 3-year period following the receipt of targeted wage subsidies by participants, the intervention led to:
- a cumulative increase of $4,400 in post-participation earnings
- an average annual increase of 5.7 percentage points in the incidence of employment
- a cumulative decrease of $1,300 in post-participation receipt of social assistance benefits
Non EI claimants category
A Non EI Claimant is an individual who does not have an open EI benefit claim and do not collect benefits at the start of his/her intervention and also did not receive any EI benefits within the 3-year period prior to starting the intervention.
Among participants in the strategy, non EI claimants typically had the weakest labour market attachments (relative to active and former EI claimants) and represented about 69% of participants.
- For non EI claimants, the incremental impacts were measured relative to a comparison group of Indigenous individuals who were neither active nor former claimants at the start of their intervention, and who received only low intensity employment services interventions during the same period (in other words, Employment Assistance Services only).
For this group of participants, results indicate that the following intervention is conducive to improvements in the participant’s labour market attachment:
- Skills development
For participants in Skills Development - Essential Skills and targeted wage subsidies interventions, small improvements in their labour market attachment were also found. Still, for targeted wage subsidies, positive impacts found during the in-program period tended to weaken in the years that followed.
On the other hand, labour market impacts were mixed for non-EI claimants who took part in job creation partnership and the Student Work Experience interventions.
- For job creation partnership, the mix of positive and negative impacts reflects, in part, the short-term nature of these interventions and that those generally target individuals with multiple barriers and weak labour market attachments.
- For Student Work Experience, the mix of positive and negative impacts results were expected since students participate in the intervention during their school breaks and return to school once the intervention is completed.
Among non EI claimants positive incremental impacts were slightly larger for women relative to men and for urban participants relative to rural participants, respectively (see table 11 for more detailed results).
Due to the selection for the control group, no net-impact analysis could be conducted for Employment Assistance Services.
| Category | Employment earnings (cumulative) in Canadian dollars | Incidence of employment (annual average) in percentage points (pp) | Social assistance (cumulative) in Canadian dollars |
|---|---|---|---|
| Overall | $2,400 | +2.1 pp | -$390 |
| By intervention | |||
| Skills development | $5,580 | +1.8 pp | -$350 |
| Skills development - Essential skills | $460 * | -0.1 pp * | -$40 * |
| Student work experience | -$2,170 * | +11.7 pp | -$680 * |
| Job creation partnership | -$3,930 * | +4.2 pp * | -$380 * |
| Targeted wage subsidies | $1,210 * | +3.3 pp | -$800 |
| By sub-group | |||
| Men | $1,610 | +1.4 pp | -$370 |
| Women | $3,700 | +2.5 pp | -$640 |
| Urban | $5,550 | +2.7 pp | -$410 |
| Rural | $3,020 | +3.2 pp | -$470 |
Source: Administrative data technical report.
* Results are statistically not significant, still they are valid in terms of informing the direction of the impact (negative or positive)
For example, as shown in table 11, in the 3-year period following the receipt of targeted wage subsidies by participants, the intervention led to:
- a cumulative increase of $1,210 in post-participation earnings
- an average annual increase of 3.3 percentage points in the incidence of employment
- a cumulative decrease of $800 in post-participation receipt of social assistance benefits
Main finding #3
The strategy and the fund developed and fostered sustainable relationships with Indigenous Agreement Holders.
Still, some Indigenous Agreement Holders reported concerns about the implications of administrative reporting on their relationship with the department.
This finding was developed using 2 complementary lines of evidence: key informant interviews and a document reviewFootnote 1. The interviews were conducted in May 2019 with 15 department officials, 5 representatives from other federal government departments providing funding to Indigenous communities and 25 Agreement Holders comprising of 10 with the strategy, 6 with the fund and 9 with both programs. In addition, more than 2,000 program documents were reviewed for a better understanding of the strategy and the fund. This evidence provided in-depth information regarding relationships between the federal government and the Agreement Holders, and the associated administrative and data management system processes.
Strategy and Fund Indigenous Agreement Holders developed and maintained sustainable partnerships; however, some challenges remain regarding the partnerships between the Agreement Holders and the community organizations.
As required by the fund, Agreement Holders had to maintain partnerships with a range of organizations that contributed in various ways to the success of the program. Many Indigenous Agreement Holders also have both formal and informal partnerships for the strategy interventions.
Agreement Holder partnerships were established mainly with training and educational institutions, employers and industries. In addition to providing learning and employment experience, partners share costs, and provide resources and services to support the Agreement Holders in program delivery.
Interviewees reported that potential barriers that hinder creating and maintaining partnerships within their communities include the remote location of their communities, administrative delays, discrimination and missing or outdated labour market information. For instance, Agreement Holders from remote communities have greater difficulties finding and maintaining stable partnerships because of the limited number of organizations and the high cost of providing services in these areas.
- Although mentioned by a few respondents, discrimination is seen as a barrier to partnerships due to potential partners perceived as not being interested in working with Indigenous participants.
Administrative burden and strained relationships with program officials remain despite previous efforts to make improvements.
The 2015 Strategy evaluation report identified the technical nature of data requirements, staff turnover and Departmental reporting requirements as challenges for the Agreement Holders. As a result, the Evaluation Directorate recommended the streamlining of data collection processes, including the adoption of consistent and common data reporting requirements, and the avoidance of reporting overlap and duplication where feasible. Still, keeping in mind inherent trade-offs between ensuring good governance (for example accountability) and providing greater flexibility at the agreement holders’ level, the administrative reporting procedures continue to be viewed as hindering the Agreement Holders’ ability to meet their obligations.
The department’s staff turnover is a factor contributing to Agreement Holders’ administrative burden. For example, some interviewees noted challenges related to knowledge transfer from former to new program officials, which results in departmental staff being unfamiliar with Agreement Holders’ programming. In some instances, the interviewees reported that they spent a fair amount of their time briefing their program official about their specific situation and past activities. This creates additional work for Agreement Holders, hampering them from delivering services to their participants.
Some interviewees also expressed concern over the level of scrutiny they faced from program officials regarding financial reporting. Interviewees indicated that they are at times required to provide considerable details for reporting purposes and justifications concerning their expenses. Staff turnover is, in part, inadvertently exacerbating this issue. For instance, respondents mentioned that they are less likely to be scrutinized when the program officials are more experienced and have knowledge of the programming. As a result, this affects Agreement Holders’ relationship with program officials.
In regards to reporting requirements, lack of clear guidelines as well as strict and tight reporting deadlines affected the Agreement Holders’ capacity to achieve their intended outcomes. A few interviewees note that the information required for reporting purposes is significant and results in organizations dedicating considerable time and resources to reporting.
To mitigate this issue and improve relationships, interviewees did acknowledge that progress has been made to alleviate the administrative burden and improve relationships, for example by:
- improved transition planning to ensure new officers are well-informed and familiar with Agreement Holders’ activities
- timely response to requests and providing accurate information
- consistent communication from program staff with Agreement Holders along with regular meetings and site visits
- decreased reporting requirements to allow more focus on program delivery
Indigenous Agreement Holders and program officials face challenges with the client data management system.
Data management is based on the exchange of individual level data between the Agreement Holder and the department. Client case management is conducted at the Agreement Holder level which consists of the creation of clients' files that are uploaded on a quarterly basis through the Data Gateway. The department validates the data and returns the files to the Agreement Holders if there are errors.
Most interviewees perceived that discrepancies existed between the data inputted by Indigenous Agreement Holders and what is received by the department. This led to the assumption that data were being lost during the transfer from the Agreement Holders to the department in the data management system.
In addition, staff turnover also exacerbated challenges related to the data management system. Interviewees noted that the department may not be familiar with the case management systems being used by the Agreement Holders to collect data. As well, few interviewees explained that some of the reporting challenges may be attributable to data entry issues on their end, potentially speaking to insufficient capacity and training.
Promising practices to mitigate these challenges include:
- developing their own data management system, as was done by a few Agreement Holders, to better fulfill their own data needs as well as reporting requirements as set out under their agreement, and also to keep a track record in instances of data discrepancies. However, considering financial and capacity limitations, it is recognized that this may not be possible for all Agreement Holders
- increasing training opportunities (in the form of webinars or seminars) for Agreement Holders and Department staff, especially at the onset of their projects, to increase awareness of the tools being used to report data
- creating tools to help Indigenous organizations to enter data, as was done by some of the program officials. This not only supports Indigenous Agreement Holders, but also helps avoid data entry errors
Main finding #4
The Aboriginal Human Resources and Development Agreements, predecessors of similar agreements under the strategy, yielded a positive return on investment over the 10-year post-program period for individuals and society as a whole.
The incremental impact analysis, presented earlier, assesses the effectiveness of interventions focusing on the first 3 years following an intervention (up to 2016). As a result, this type of analysis does not inform the longer-term impacts on participants that such interventions may have.
Taking advantage of the fact that there is a high degree of similarity between existing and predecessor programs in terms of the target population, the delivering organizations and the types of interventions provided (see Annex E); a longer-term cost-benefit analysis was conducted. To conduct the cost-benefit analysis, the department relied on its Labour Market Data Platform using participants who completed their intervention between January 2003 and December 2005. As per the incremental impacts presented under finding #2, a cost-benefit analysis is presented by EI claimant status.
This analysis examined labour market outcomes 3 years prior to participation in the intervention and for 2 years during participation. The analysis then continued to observe the labour market attachment for 10 years after the participants had completed their intervention relative to that which was observed for a comparison group. The cost-benefit analysis reports on the net present value and the cost-benefit ratio from the perspectives of the individual, the government and the society.
- From the government’s perspective, costs are incurred up-front and consist of program costs. On the other hand, benefits accrue over time in the form of increased taxed revenues and decreased outlays from support programs (for example social assistance)
- From the individual’s perspective, benefits accrue over time and take the form of higher earnings and improved social outcomes
- From a society’s perspective, the total net benefits of both the government’s and the individual’s perspectives are taken into account (government + individual)
On this basis, the number of years necessary for the accrued benefits to equal the up-front costs, as well as the rate of return, (hereafter referred to as ‘break-even’) can be estimated.
Lastly, the cost-benefit analysis reflects the tax treatment of employment income earned by a Status Indian on reserve. This translates into subsequent lower benefits to the government and higher benefits to individuals.
Cost-benefit analysis: Other intangible benefits
- The cost-benefit analysis is based on main quantifiable costs and benefits. Therefore, it does not include intangible benefits such as higher well-being for individuals associated with better health outcomes and reduced criminality. For instance, in addition to producing improvements in labour market indicators, it is likely that active labour market programming such as the strategy have positive influences on additional social outcomes such as health and crime. According to research-based evidence, labour market participation and higher income is associated with better health outcomes (see Canadian Institute for Health Information, 2015; Saunders and al., 2017) and lower risk of criminal activity (see Nilsson & Agell, 2003; Machin and Meghir, 2000)
- Therefore, expanding the cost-benefit framework to include potential savings resulting from improved health outcomes (in other words, reduced health system expenditures) and decreases in criminal justice system contact (in other words, reductions in the costs of policing, courts, and correctional services) could yield additional positive impacts for both individuals and the government beyond what is directly measured
Interpreting results from the cost-benefit analysis presented by EI claimant category
Caution should be exercised in comparing cost-benefit analysis results across different EI claimant categories. In particular, for each EI claimant category, a unique comparison group was built to reflect the set of observable characteristics of their respective participants at the time. In addition, results reflect the mix of interventions received and examined under each EI claimant category. More detailed information on the methodology used to conduct the cost-benefit analysis can be found in the Methodology Technical Report, which is available upon request.
Active EI claimant category
The total social benefit (governments + individual) is $3,519, yielding a social return on investment of 45% over 12 years (2 years in-program and 10 years post-participation).
- For individual participants, the total net benefit is $10,425
- On the other hand, the total net cost for governments is $6,906
Overall, from a societal perspective, the interventions “break even” in 4.5 years after participation.
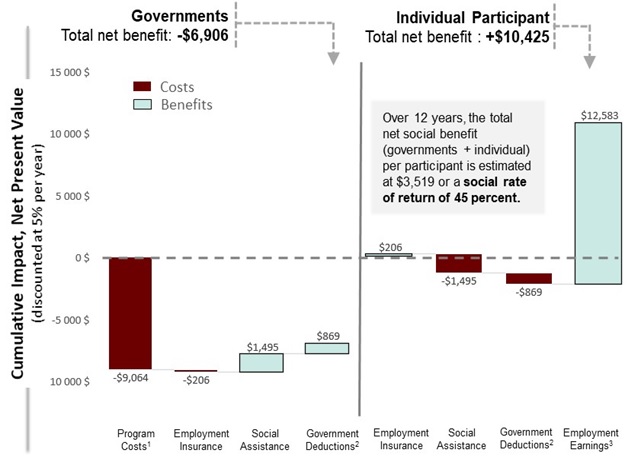
Figure 2 – Text version
| Cumulative impact, Net present value | Governments | Individual participant |
|---|---|---|
| Program costs1 | -$9,064 | n/a |
| Employment Insurance | -$206 | $206 |
| Social assistance | $1,495 | -$1,495 |
| Government deductions2 | $869 | -$869 |
| Employment earnings3 | n/a | $12,583 |
| Total net benefit | -$6,906 | $10,425 |
- Source: Administrative Data Technical Report - Labour Market Data Platform cohort of Aboriginal Human Resources Development Agreements participants from January 1, 2003 to December 31, 2005.
- 1Program costs include the program expenditure and the loss incurred by society when raising additional revenues, such as taxes to fund government spending.
- 2Government Deductions include EI premium, CPP/QPP contributions and income tax, which reflects current exemptions that only apply to status Indians.
- 3Employment Earnings include fringe benefits (for example, employer paid health insurance, pension contributions) and earnings lost during time spent in the program.
Former EI claimant category
The total social benefit (governments + individual) is $9,513, yielding a social return on investment of 119% over 12 years (2 years in-program and 10 years post-participation).
- For individual participants, the total net benefit is $16,159
- On the other hand, the total net cost for governments is $6,646
Overall, from a societal perspective, the interventions “break even” in 4.8 years after participation.
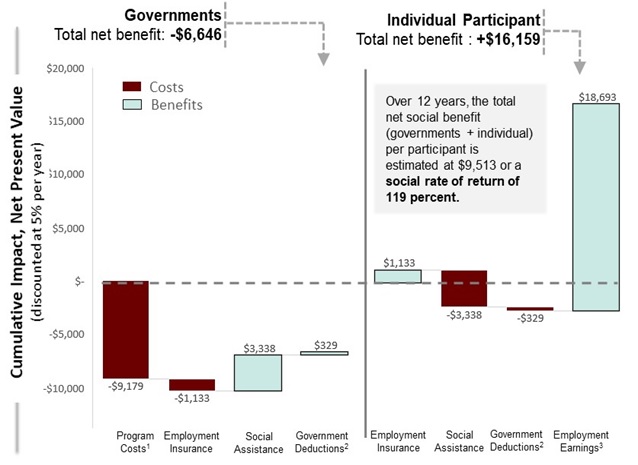
Figure 3 – Text version
| Cumulative impact, Net present value | Government | Individual participant |
|---|---|---|
| Program costs1 | -$9,179 | n/a |
| Employment Insurance | -$1,133 | $1,133 |
| Social assistance | $3,338 | -$3,338 |
| Government deductions2 | $329 | -$329 |
| Employment earnings3 | n/a | $18,693 |
| Total net benefit | -$6,646 | $16,159 |
- Source: Administrative Data Technical Report - Labour Market Data Platform cohort of Aboriginal Human Resources Development Agreements participants from January 1, 2003 to December 31, 2005.
- 1Program costs include the program expenditure and the loss incurred by society when raising additional revenues, such as taxes to fund government spending.
- 2Government Deductions include EI premium, CPP/QPP contributions and income tax, which reflects current exemptions that only apply to status Indians.
- 3Employment Earnings include fringe benefits (for example, employer paid health insurance, pension contributions) and earnings lost during time spent in the program.
Non EI claimant category
The total social benefit (governments + individual) is $1,631, yielding a social return on investment of 20% over 12 years (2 years in-program and 10 years post-participation).
- For individual participants, the total net benefit is $6,734
- On the other hand, the total net cost for governments is $5,103
Overall, from a societal perspective, the interventions “break even” in 8.8 years after participation.
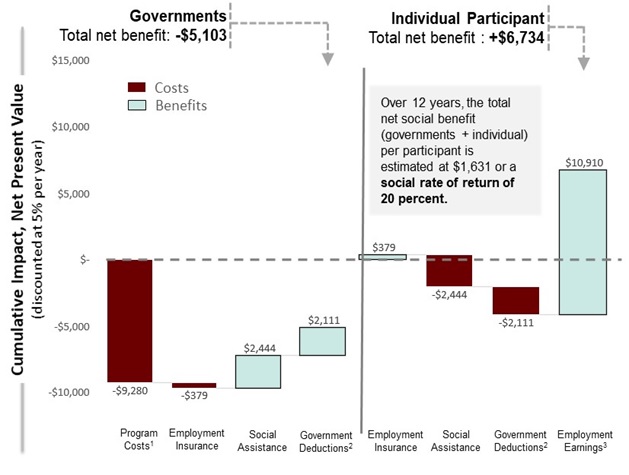
Figure 4 – Text version
| Cumulative impact, Net present value | Government | Individual participant |
|---|---|---|
| Program costs1 | -$9,280 | n/a |
| Employment Insurance | -$379 | $379 |
| Social assistance | $2,444 | -$2,444 |
| Government deductions2 | $2,111 | -$2,111 |
| Employment earnings3 | n/a | $10,910 |
| Total net benefit | -$5,103 | $6,734 |
- Source: Administrative Data Technical Report - Labour Market Data Platform cohort of Aboriginal Human Resources Development Agreements participants from January 1, 2003 to December 31, 2005.
- 1Program costs include the program expenditure and the loss incurred by society when raising additional revenues, such as taxes to fund government spending.
- 2Government Deductions include EI premium, CPP/QPP contributions and income tax, which reflects current exemptions that only apply to status Indians.
- 3Employment Earnings include fringe benefits (for example, employer paid health insurance, pension contributions) and earnings lost during time spent in the program.
Conclusions
Overall, the analysis determined that improving labour market attachment of participating Indigenous peoples is attributable to both the strategy and the fund.
- Skills development was the most effective intervention for improving participants’ labour market attachment, regardless of their EI claimant status
- Employment Assistance Services and targeted wage subsidy interventions also showed positive results particularly for participants with relatively stronger labour market attachment
- Sustainable partnerships were developed and fostered with Indigenous partners. Still, some Indigenous Agreement Holders reported concerns about the implications of administrative reporting on their relationship with the department
- The Aboriginal Human Resources and Development Agreements, predecessors of similar agreements under the strategy, yielded a positive social return on investment over the 10-year post-program period when taking into account costs and benefits for both the government and participants
Findings of this evaluation are consistent with those of labour market programing, evaluated in 2009 and again in 2015. Specifically, the 2015 evaluation showed positive short-term trends in the labour market outcomes of program participants. Also, it confirmed that program data can effectively support the estimation of incremental impacts (using comparison groups).
Moreover, the previous evaluations found a sustained increase in employment incidence and annual employment earnings as well as a decrease in dependence on EI benefits or Social Assistance.
The key 2009 evaluation results are described in detail in Annex E.
Recommendations
Based on the impacts discussed within this evaluation, the strategy and the fund interventions are generally helping participants to improve their labour market attachment after participation. Moreover, the social benefits of participating in the interventions exceed the cost of investment for all EI claimant categories (active participants, former and non-claimants) over time. Key informant interviews and the document review also provided insight into the relationship between the department and the Indigenous Agreement Holders.
However, information available on the fund’s participants was not sufficient to support an in-depth analysis either at the intervention or socio-demographic level. There is a high degree of similarity between the strategy and the fund in terms of the participants, organizations and the types of interventions provided. Given their respective policy intents, consideration could be given to conduct a review and analysis of the approach taken to better differentiate between the strategy and the fund and ensure value for money.
Recommendation #1: It is recommended that the department better leverage data to collaborate with partners to improve the program.
Recommendation #2: It is recommended that the department continue to seek improvements in the administration of agreements with participating Indigenous organizations.
Management response and Action plan
Recommendation #1
It is recommended that the department better leverage data to collaborate with partners to improve the program.
Management response
Management agrees with the recommendation.
In April 2019, ESDC formally launched the Indigenous Skills and Employment Training (ISET) program to replace the strategy. The design of the new program has been informed by engagement with Indigenous partners to ensure it responds to the unique needs, circumstances and aspirations of Indigenous communities across Canada. Key components of the new program include enhanced training and resources to strengthen program delivery and data quality and collection; co-development of performance frameworks; longer term and more flexible funding arrangements; and provision of analysis of program data and labour market information to support Indigenous organizations.
As part of implementation of the new program, the department is working closely with Indigenous contribution recipients to co-develop performance indicators for the ISET program that maximize the use of program data and enhance analysis and linkages to other data sources to demonstrate outcomes.
The department is also working with Indigenous partners to improve and share analysis of program data to better respond to distinctions-based priorities of recipients and inform program delivery.
The department will review and refine data collection for the Skills and Partnership Fund to support future analysis and improve management of the program.
Actions planned and anticipated completion date
1.1 Implement enhanced training on ISET program data collection and data quality (anticipated completion date: March 2019)
1.2 Commence collection of ISET program data (anticipated completion date: June 2019)
1.3 Review process and elements for Skills and Partnership Fund data collection (anticipated completion date: Fall 2020)
1.4 Provide analysis of ISET program data to aid in program delivery by distinction (anticipated completion date: Fall 2020)
1.5 Provide recommendations for ISET program performance indicators using program data and other sources (anticipated completion date: Spring 2021)
Recommendation #2
It is recommended that the department continue to seek improvements in the administration of agreements with participating Indigenous organizations.
Management response
Management agrees with the recommendation.
In April 2019, ESDC formally launched the Indigenous Skills and Employment Training (ISET) program to replace the strategy. The design of the new program has been informed by engagement with Indigenous partners to ensure it responds to the unique needs, circumstances and aspirations of Indigenous communities across Canada. Notably, ESDC has adopted a results-based approach to agreement management, shifting the focus from direct oversight of expenditures to an emphasis on outcomes achieved for beneficiaries. ESDC is continuing to actively co-develop the implementation of the ISET program with Indigenous partners.
As a result, the ISET program contains a number of measures that were co-developed to improve the administration and implementation of agreements. For instance, the revised program terms and conditions provide greater flexibility to align eligible expenditures with necessary client support, targeted interventions and training needed for overall success of the program. Also, the ISET agreements incorporated greater flexibilities and reduced administrative burden for recipients including flat rates for reimbursement of administrative expenditures.
The introduction of the capacity assessment model to assess, manage and mitigate risks associated with the implementation of ISET agreements is another measure that improves the overall program responsiveness. An organizational capacity assessment is a joint process that aims to understand an organization’s ability to deliver services and determine the level of support it requires to achieve program results. Under this approach, monitoring frequency and reporting requirements are adjusted based on the results of the capacity assessment allowing ESDC to shift the focus to improving Indigenous organizations’ capacity rather than direct administrative oversight.
As a means to continuously improve the administration of the program, ESDC has launched an ISET Program Implementation Working Group for each distinction. Specifically, these Indigenous co-led groups are tasked with reviewing ISET implementation elements to identify areas for improvement. The ongoing dialogue and collaborative approach also facilitate the implementation of future measures identified by the Working Groups.
The new measures implemented under the ISET program, and future ones that might arise from the ISET Program Implementation Working Groups, foster continuous improvements in the effectiveness and success of agreements. This co-development approach embedded in the ISET program will improve ESDC’s relationship with Indigenous organizations.
Improvements resulting from this new approach will be applied to the Skills and Partnerships Fund as appropriate.
Actions planned and anticipated completion date
2.1 In collaboration with Indigenous partners, develop new financial and administrative reporting requirements for inclusion in new ISET agreements (anticipated completion date: January 2019)
2.2 Ensure program implementation is co-developed through direct engagement with Indigenous partners (anticipated completion date: April 2019)
2.3 Adopt a results-based approach for agreement management and expand allowable expenditures to enable Indigenous organizations to more effectively shape interventions to meet client needs (anticipated completion date: April 2019)
2.4 Introduce a new risk assessment model and streamlined reporting requirements based on the organizational capacity of Agreement Holders (anticipated completion date: April 2019)
2.5 Put in place distinction-based Program Implementation Working Groups (anticipated completion date: June 2019)
Annexes
Annex A: Bibliography
Aboriginal Labour Force Alliance (2016). Looking into the Future of Indigenous Labour Market Programming. Position paper.
Assembly of First Nation (2016). First Nation Labour Market Forum.
Canadian Institute for Health Information (2015). Trends in Income-Related Health Inequalities in Canada. Technical Report.
Cariboo Chilcotin Aboriginal Training Employment Centre Society (2016). Engagement on the Future of Indigenous Labour Market Programming. Paper position.
City of Edmonton (2016). Engagement on the Future of Indigenous Labour Market Programming. Position paper.
Congress of Aboriginal Peoples (2016). Engagement on the Future of Indigenous Labour Market Programming. Position paper.
Employment and Social Development Canada (2014). Aboriginal Skills and Employment Training Strategy Regional Engagement Thematic Report.
Employment and Social Development Canada (2014b). Engagement on the Future of Indigenous Labour Market Programming. Ministerial Roundtables with Industry Stakeholders.
Employment and Social Development Canada (2014c). Summary of Meetings. Aboriginal Skills and Employment Training Strategy Regional Engagement.
Employment and Social Development Canada (2015). ASETS and SPF Short Evaluation Report.
Employment and Social Development Canada (2016). Engagement on the Future of Indigenous Labour Market Programming. Thematic summary report.
Employment and Social Development Canada (2016b). National ASETS Meeting. Roll-up of Submissions.
Employment and Social Development Canada (2016c). Engagement on the Future of Indigenous Labour Market Programming. Ministerial Roundtables with Colleges and Institutes.
Employment and Social Development Canada (2016d). Inuit Engagement Session: The Future of Indigenous Labour Market Programs. Summary.
Employment and Social Development Canada (2016e). Discussion with SDOs on Indigenous Labour Market Programming. Meeting summary.
Employment and Social Development Canada (2016f). Key Highlights from the Meetings on Indigenous Labour Market Programming.
Employment and Social Development Canada (2016g). Looking into the Future of Indigenous Market Programming: What We Heard. Report on Meetings.
Employment and Social Development Canada (2016h). Métis ASETS Forum. Summary.
Employment and Social Development Canada (2016i). Looking into the Future of Indigenous Market Programming: What We Heard. Roll-up of submissions.
Employment and Social Development Canada (2016j). Inuit Forum. Day 3. Summary.
Employment and Social Development Canada (2017). Building Aboriginal Support for West Coast Energy Project Initiative – Skills and Partnership Fund Evaluation. Technical report.
Employment and Social Development Canada (2017b). Engagement on the Future of Indigenous Market Programming. Post-secondary Education.
Employment and Social Development Canada (2018). Annual ASETS and SPF Programs Results Report 2017 and 2018.
First Nation in Alberta (Treaty 6, 7 and 8) (2017). Aboriginal Skills and Employment Training Strategy (ASETS). Position paper.
Inuit Tapiriit Kanatami (2015). Inuit ASET Agreement holder’s Recommendations for Post 2015.
Inuit Tapiriit Kanatami and Human Resources Development Technical Committee (2016). Engagement on the Future of Indigenous Labour Market Programming. Position paper.
Inuit Tapiriit Kanatami (2017). Inuit Perspective Regarding Indigenous Labour Market Programming.
Machin S. and C. Meghir (2000). Crime and Economic Incentives. The Institute for Fiscal Studies. Working Paper 00/17.
Nilsson A. and J. Agell (2003). Crime, unemployment and labor market programs in turbulent times. Institute for Labour Market Policy Evaluation (IFAU). Working Paper 2003:14.
Qualicum First Nation (2016). National ASETS Meeting. Position paper.
Saunders, M; Barr, B; McHale, P; Hamelmann, C. (2017). Key policies for addressing the social determinants of health and health inequities. Health Evidence Network Synthesis Report 52. Regional Office for Europe. World Health Organization.
Tlicho Government Training and Staff Development Community Services Behchoko (2016). Looking into the Future of Indigenous Labour Market Programming: National ASETS Agreement Holder Event Submission.
Tsawwassen First Nation (2016). Labour Market Funding for Tsawwassen First Nation.
Wannel T. and Sh. Currie (2016). Determinants of participation in Indigenous Labour Market Programs. Final report. Prepared for ESDC.
Annex B: Definitions
Indigenous distinction
Indigenous identity refers to whether the person identified with the Indigenous peoples of Canada. This includes those who are First Nations (North American Indian), Métis or Inuk (Inuit) and/or those who are Registered or Treaty Indians (that is, registered under the Indian Act of Canada), and/or those who have membership in a First Nation or Indian band. Indigenous peoples of Canada are defined in the Constitution Act, 1982, Section 35 (2) as including the Indian, Inuit and Métis peoples of Canada.
Source: Definition of Aboriginal identity of person on Statistics Canada website
For the purpose of this evaluation, First Nations peoples have been divided into status and non-status groups to provide results from both groups separately.
Employment Insurance claimant status
Active EI claimants
Individuals who have an open EI benefit claim and are collecting benefits at the start of their intervention.
Former EI claimants
Individuals who have no open EI benefit claim and do not collect benefits at the start of their intervention, but have received some EI benefits within the 3 year period prior to starting the intervention.
Non EI claimants
Individuals who have no open EI benefit claim and do not collect benefits at the start of their intervention and have not received any EI benefits within the 3-year period prior to starting the intervention.
Action plan equivalent
The unit of analysis used for the assessment of incremental impacts was the Action Plan Equivalent (APE), which is a group of interventions an individual participated in within of 6 months of each other (in other words, gap of 6 months or less between the end of one intervention and the beginning of the next). The principal intervention is the longest one within an APE.
Annex C: Evaluation approach
Lines of evidence and Methodology
Administrative data and Incremental impact methodology
To assess incremental impact, the outcomes of Indigenous participants (treatment group) who participated in an intervention during the reference period of January 2011 and December 2012 are compared to Indigenous individuals who were eligible but did not participate or received a limited support measure (comparison group).
Performance was measured using 7 outcome indicators:
- probability of employment
- aggregate employment earnings
- weeks in receipt of employment insurance benefits
- amount of employment insurance benefits received
- amount of Social Assistance benefits received
- incidence of Social Assistance use
- reliance on income support
The administrative data used to measure the effect of the program for participants on key outcomes consisted of linking together the 3 following data sources (with personal identifiers removed to protect privacy and confidentiality):
- the client administrative data, consisting of socio-demographic and labour market intervention type and duration related variables
- Employment Insurance Part 1 and Part 2 data, and
- Canada Revenue Agency T1 and T4 data
The comparison group for active EI claimants consisted of non-participants who had an open EI claim. As for former and non EI claimants, it consisted of individuals under the Labour Market Development Agreement who received a limited support measure in the form of Employment Assistance Services.
Limitations and constraints:
- the incremental impacts of the former and non EI claimant participants should be considered as being underestimated. The incremental impact analysis approach used is based on the difference between participating in the strategy and the fund compared to participating in low intensity services (Employment Assistance Services) rather than being compared to those not receiving any services
- the findings can only be reported on a calendar year basis mainly due to the structure of the Canada Revenue Agency T1 and T4 data. In addition, it is not possible to identify whether the participant has full-time or part-time employment
- the definition of the pre- and post-participation period varies depending on the intervention and its duration. Participants may begin a labour market intervention in one calendar year and complete it in the next. The post-participation period, therefore, begins in the first full calendar year following the year the intervention was completed. This allows for 3 years of post-program observations
Cost-benefit analysis
The reference period for the cost-benefit analysis consists of participants who completed their intervention between January 2003 and December 2005. This analysis examined labour market outcomes 3 years prior to participation in the intervention and for 2 years during participation. The analysis then continued to observe the labour market outcomes for 10 years after the participants had completed their intervention.
The cost-benefit analysis reports on the net present value and the cost-benefit ratio from the individual, the government and the society perspectives (individual + government).
An accounting framework determined who bore a particular cost or benefit. All benefits were discounted (by a rate of 5%) after the participation start year.
Limitations: The cost-benefit analysis is based on major quantifiable costs and benefits available in the administrative database and EI Monitoring and Assessment Report. It does not include intangible benefits such as higher well-being for individuals related to better health outcomes and reduced criminality.
In addition to producing improvements in labour market indicators, it is likely that active labour market programming such as the strategy also has positive influences on additional social outcomes such as health and crime. According to research evidence, labour market participation and higher income is associated with better health outcomes (for example Canadian Institute for Health Information, 2015; Saunders & al. 2017) and lower risk of criminal activity (for example Nilsson & Agell, 2003; Machin & Meghir, 2000). Therefore, expanding the cost-benefit framework to include potential savings resulting from improved health outcomes (reduced health system expenditures) and decreases in criminal justice system contact (reductions in the costs of policing, courts and correctional services) could yield additional positive impacts for both individuals and the government beyond what is directly measured.
Document review
Over 2,000 documents, including program documents from the Office of the Auditor General audit and from the 2014 and 2017 engagement discussions provided context for the delivery of the strategy and the fund.
Key informant interviews n=45
Key informant interviews were conducted in-house (n=20) with:
- ESDC and Service Canada officials (n=15) from national headquarters (n=4) and the regions (n=11)
- other departments officials (n=5)
As well, an external consultant conducted interviews with Indigenous Agreement Holders (n=25). There were 3 types of Agreement Holders: those that held either a Fund agreement (n=6), a Strategy agreement (n=10) or both a Strategy and a Fund agreement (n=9).
Limitations: The responses from interviewees represent their own perspectives and may not be representative of all stakeholders.
Technical studies
Further information is available on request in the Technical Studies.
The following detailed technical studies were produced for planning and reporting purposes in support of this evaluation:
- Methodology technical report
- Administrative data technical report
- Key informant interviews with Indigenous Agreement Holders technical report
- Key informant interviews with Program officials technical report
- Document review technical report
Annex D: Strategy's incremental impact results, 3-year post-participation by intervention, EI claimant type and sub-group
| Category | Employment earnings (cumulative) in Canadian dollars | Incidence of employment (annual average) in percentage points (pp) | Social assistance (cumulative) in Canadian dollars |
|---|---|---|---|
| Active (overall) | $14,930 | +4.9 pp | -$360 |
| Female | $11,630 | +7.3 pp | -$710 |
| Male | $17,520 | +3.6 pp | -$360 |
| Rural | -$15,370 | +2.7 pp | -$260 |
| Urban | -$15,230 | +6.3 pp | -$390 |
| Former (overall) | $5,470 | +3.0 pp | -$800 * |
| Female | $8,040 | +3.4 pp | -$1,000 |
| Male | $3,220 | +2.3 pp | -$650 |
| Rural | $2,320 | +2.3 pp * | -$570 |
| Urban | $7,140 | +2.8 pp | -$860 |
| Non-EI (overall) | $6,270 | +1.8 pp | -$350 * |
| Female | $5,550 | +1.8 pp * | -$350 * |
| Male | $5,630 | +1.9 pp | -$650 * |
| Rural | $6,010 | +2.0 pp | -$760 |
| Urban | $5,170 | +1.4 pp * | -$290 * |
Source: Administrative data technical report.
* Results are statistically not significant, still they are valid in terms of informing the direction of the impact (negative or positive)
| Category | Employment earnings (cumulative) in Canadian dollars | Incidence of employment (annual average) in percentage points (pp) | Social assistance (cumulative) in Canadian dollars |
|---|---|---|---|
| Active (overall) | $7,340 | +3.8 pp | -$240 * |
| Female | $8,890 | +6.4 pp | -$510 * |
| Male | $7,890 | +2.8 pp | -$210 * |
| Rural | $8,130 | +3.0 pp | -$350 |
| Urban | $6,050 | +3.4 pp | -$70 * |
Source: Administrative data technical report.
* Results are statistically not significant, still they are valid in terms of informing the direction of the impact (negative or positive)
| Category | Employment earnings (cumulative) in Canadian dollars | Incidence of employment (annual average) in percentage points (pp) | Social assistance (cumulative) in Canadian dollars |
|---|---|---|---|
| Former (overall) | $5,330 | +1.6 pp * | -$500 |
| Female | $6,680 | +3.2 pp * | -$600 * |
| Male | $1,050 * | +0.4 pp * | -$630 * |
| Rural | -$630 * | -1.1 pp * | $10 * |
| Urban | $8,770 | +1.3 pp * | -$420 |
| Non-EI (overall) | $460 * | -0.1 pp * | -$40 * |
| Female | -$4,960 | +2.7 pp * | $140 * |
| Male | $720 * | -1.6 pp * | -$210 * |
| Rural | $4,720 * | +0.7 pp * | -$40 * |
| Urban | -$760 * | -0.5 pp * | -$110 * |
Source: Administrative data technical report.
* Results are statistically not significant, still they are valid in terms of informing the direction of the impact (negative or positive)
| Category | Employment earnings (cumulative) in Canadian dollars | Incidence of employment (annual average) in percentage points (pp) | Social assistance (cumulative) in Canadian dollars |
|---|---|---|---|
| Non-EI (overall) | -$2,170 * | +11.7 pp | -$680 * |
| Female | $2,480 * | +15.4 pp | -$1,010 |
| Male | -$3,660 * | +9.3 pp | -$390 * |
| Rural | -$4,010 * | +5.3 pp | $20 * |
| Urban | $890 * | +13.3 pp | -$1,220 |
Source: Administrative data technical report.
* Results are statistically not significant, still they are valid in terms of informing the direction of the impact (negative or positive)
| Category | Employment earnings (cumulative) in Canadian dollars | Incidence of employment (annual average) in percentage point | Social assistance (cumulative) in Canadian dollars |
|---|---|---|---|
| Former (overall) | -$2,010 * | +2.1 pp * | -$500 * |
| Female | -$730 * | +7.4 pp | -$1,340 * |
| Male | -$770 | -1.7 pp | -$320 |
| Rural | -$3,410 | +0.7 pp * | -$390 |
| Urban | $1,000 | +3.9 pp * | -$920 |
| Non-EI (overall) | -$3,930 * | +4.2 pp * | -$380 * |
| Female | -$8,870 | +4.9 pp * | -$1,090 |
| Male | -$7,450 * | +0.8 pp * | $290 * |
| Rural | -$5,680 * | +0.8 pp * | $420 |
| Urban | -$10 * | -3.6 pp * | -$1,170 * |
Source: Administrative data technical report.
* Results are statistically not significant, still they are valid in terms of informing the direction of the impact (negative or positive)
| Category | Employment earnings (cumulative) in Canadian dollars | Incidence of employment (annual average) in percentage points (pp) | Social assistance (cumulative) in Canadian dollars |
|---|---|---|---|
| Former (overall) | $4,400 | +5.7 pp | -$1,300 |
| Female | $3,820 * | +7.0 pp | -$1,630 |
| Male | -$7,160 * | +4.0 pp * | -$910 * |
| Rural | $1,270 * | +4.9 pp * | -$1,490 |
| Urban | $7,620 | +3.7 pp * | -$1,210 |
| Non-EI (overall) | $1,210 * | +3.3 pp | -$800 |
| Female | $10 * | +4.2 pp * | -$860 * |
| Male | $1,550 * | +1.7 pp * | -$750 |
| Rural | -$1,560 * | +1.2 pp * | -$210 * |
| Urban | $2,290 * | +2.0 pp * | -$1,170 |
Source: Administrative data technical report.
* Results are statistically not significant, still they are valid in terms of informing the direction of the impact (negative or positive)
Annex E: Key incremental impact results from previous indigenous labour market programming evaluations
The Aboriginal Human Resources Development Strategy 2009 evaluation
The Aboriginal Human Resources Development Strategy was designed to help improve the employment opportunities of Indigenous people (First Nations, Inuit, and Métis as well as status and non-status Indigenous people living off-reserve), and to enable them to participate fully in the Canadian economy.
The following describes the results achieved by clients who received at least one intervention between April 1999 and December 2004.
Active EI claimants experienced an increase in employment earnings (relative to the comparison group) and in the incidence of employment, and declines in EI and social assistance benefits received and in reliance on government income support. Impacts on employment earnings and the incidence of employment were positive for all programs and services with the exception of the self-employment program.
For former EI claimants, participation led to a higher incidence of employment, but lower earnings. Lower amounts of EI benefits immediately after participation were offset by higher amounts received in year 3. There was a reduction in social assistance benefits in year 2 and an increase in reliance on government income support in year 3. The targeted wage subsidies program exhibited the only positive impact on employment earnings.
Non EI claimants experienced an increase in employment earnings and in the incidence of employment. Participants increased their use of EI in the 3 years post-program and decreased their use of social assistance and an overall decrease in their reliance on government income support. The increase in EI use in the post-program period reflects an increase in EI eligibility based on post-program employment activities. Skills development, targeted wage subsidies and Employment Assistance Services had positive impacts on employment earnings and on the incidence of employment.
Skills development increased the incidence of employment and earnings for Active EI clients and non EI eligible clients and reduced their use of Social Assistance and dependence on government income support. Non EI eligible clients increased their EI use in the full post-program period, reflecting an increased EI eligibility based on post-program employment activities. Former EI claimants experienced an increased incidence of employment but lower earnings and mixed results for EI benefits and dependence on income support.
Targeted wage subsidies increased the incidence of employment and earnings for all participants. Former EI clients and non EI eligible clients increased their EI use through insurable earnings and reduced the use of Social Assistance.
Self-employment participation resulted in a decline in the incidence of employment and earnings for Active and Former EI clients.
Participation in job creation partnerships increased the employment earnings for Active EI claimants only. There was also an increase in the incidence of employment for all client groups. Former EI clients and non EI eligible clients increased their EI use and reduced the use of social assistance.
Employment Assistance Services increased the incidence of employment in the short term and employment earnings for Active EI clients and non EI eligible clients.
The Aboriginal Skills and Employment Partnership (ASEP) 2013 evaluation
The Aboriginal Skills and Employment Partnership program was a nationally managed, opportunity-driven (in other words, focused on identified job opportunities), targeted Indigenous skills development program. It was designed to maximize employment for Indigenous people in major economic development projects in industries such as mining, construction, fisheries, tourism, oil and gas, forestry, hydro and public infrastructure projects across Canada through a collaborative partnership approach.
The following describes the results achieved by clients served under 9 ASEP projects funded in 2003 and who ended their participation by December 31, 2007.
Results from the incremental impact analysis show that ASEP was effective at increasing the employment earnings of participants over the 4-year period following the start of their participation. The cumulative incremental gains in employment earnings were in the $3,600 to $5,200 range. These incremental earning gains were higher for participants in projects with a site/industrial project focus (for example ASEP projects focusing on a specific industrial development such as a mine) than for participants in projects with a broader industry focus (for example ASEP projects focusing on an industry such as construction or forestry). The cumulative incremental gain for ASEP projects with strong focus on a specific industrial development project was $8,500 compared to a statistically non-significant cumulative net gain of $700 for projects with a focus on a broader industry.
ASEP also had positive impacts on the incidence of employment of participants. Annual increases of 4.0, 3.0, and 2.5 percentage points were respectively found in the 3 years following the participation start year.
ASEP participants increased their use of EI benefits by $650 in the third year following the participation start year. Estimates for all other years were statistically non-significant. Similarly, none of the impacts on use of social assistance were statistically significant.
List of acronyms
- APE:
- Action Plan Equivalent
- ASEP:
- Aboriginal Skills and Employment Partnership
- EI:
- Employment-Insurance