
Apprenticeship Grants: Evaluation Report
From: Employment and Social Development Canada
On this page
- List of figures
- List of tables
- List of abbreviations and terms
- Introduction
- Executive summary
- Program background
- Component 1: Impact evaluation of the AG Program
- Component 2: Formative evaluation of the AIG-W
- Component 3: Impact of the COVID-19 pandemic
- Conclusion
- References
- Appendices
- Appendix A: Previous evaluation key findings
- Appendix B: Evaluation questions
- Appendix C: Eligible Red Seal trades (26 March 2024)
- Appendix D: Logic models
- Appendix E: Methodology – Literature review and key informant interviews
- Appendix F: Methodology – Focus groups
- Appendix G: Methodology – Analysis of linked administrative data
- Appendix H: Methodology – AG Program's data
- Appendix I: Methodology – Survey
- Appendix J: Probit regressions for pooled cohorts
- Appendix K: Average treatment effects for treated (ATT): detailed results (propensity score kernel matching) – Outcomes variables: Progression and certification (cohorts 2008 to 2014)
- Appendix L: Additional findings on women's employment income and choice of trade
- Appendix M: Additional findings on impact of pandemic on employment outcomes
Alternate formats

Apprenticeship grants evaluation report [PDF - 1.3 MB]
Large print, braille, MP3 (audio), e-text and DAISY formats are available on demand by ordering online or calling 1 800 O-Canada (1-800-622-6232). If you use a teletypewriter (TTY), call 1-800-926-9105.
List of figures
- Figure 1: AG issued
- Figure 2: AG (AIG, ACG, AIG-W) take-up rates, 2007 to 2008 until 2022 to 2023
- Figure 3: Barriers to progress in apprenticeship among AIG recipients
- Figure 4: Progression rate of AG recipients and non-recipients (cohorts from 2008 to 2014 and combined cohorts)
- Figure 5: Progression rate of apprentices in Red Seal trades by gender (cohorts from 2008 to 2014 and combined cohorts)
- Figure 6: Differences in probability of progression of AG recipients and non-recipients (cohorts from 2008 to 2014 and combined cohorts)
- Figure 7: Differences in probability of certification between AG recipients and non-recipients, within 1.5 times the apprenticeship program duration (cohorts from 2008 to 2014 and combined cohorts)
- Figure 8: Certification within 1.5 times the apprenticeship program duration for AG recipients and non-recipients (cohorts from 2008 to 2014 and combined cohorts)
- Figure 9: Certification rate within 1.5 times the apprenticeship program duration by employment income at registration year, 2008 to 2014
- Figure 10: Certification rate of AG recipients and non-recipients who have received credit or not (cohorts from 2008 to 2014 and combined cohorts)
- Figure 11: Average employment income in the certification year and 3 years after certification, by recipient status (cohorts from 2008 to 2011)
- Figure 12: Median employment income in the certification year and 3 years after certification, by recipient status (cohorts from 2008 to 2011)
- Figure 13: Employment income gap between recipients and non-recipients 1 year after the apprenticeship program duration, 2008 to 2011
- Figure 14: Employment income gap between recipients and non-recipients 3 years after the apprenticeship program duration (cohorts 2008 to 2011)
- Figure 15: Average and median employment income of male and female AG recipients at their certification year, post-apprenticeship (cohorts from 2008 to 2011)
- Figure 16: Average and median employment income of males and females 3 years after certification, post-apprenticeship (cohorts from 2008 to 2011)
- Figure 17: AG recipients' employment income in the top 10 Red Seal trades 3 years after certification (cohorts from 2008 to 2011)
- Figure 18: Proportion of male and female AG recipients in the top 10 Red Seal trades (cohorts from 2008 to 2011)
- Figure 19: Employment situations for women, by receipt of the AIG-W
- Figure 20: Number and proportion of women's new registrations in trades in which they are under-represented
- Figure 21: Total AG take-up rate for women, 2012 to 2013 until 2022 to 2023
- Figure 22: When AIG-W applicants first heard about the grant
- Figure 23: How AIG-W applicants first heard about the grant
- Figure 24: Barriers to starting their apprenticeship, among AIG-W recipients
- Figure 25: Proportion of AIG-W recipients experiencing various financial challenges
- Figure 26: Barriers to progress in their apprenticeship, among AIG-W recipients
- Figure 27: Barriers to completing an apprenticeship and writing the Red Seal exam, among AIG-W recipients
- Figure 28: The different uses of the grant by AIG-W recipients
- Figure 29: Factors that helped AIG-W recipients continue progressing in male-dominated Red Seal trades
- Figure 30: Perception of the AIG-W among non-eligible apprentices
- Figure 31: Perception of the AIG-W among non-eligible women
- Figure 32: Average and median employment income of AG recipients who certified within 1.5 times the program duration in the top 10 Red Seal trades, 2016 to 2020
- Figure 33: Percent change in average and median employment income of certified AG recipients during the COVID-19 pandemic (2020) compared to the pre-pandemic period (2019)
- Figure 34: AG Program, June 2019 version
- Figure 35: Canadian Apprenticeship Strategy
- Figure 36: Database linkage process
- Figure 37: Proportion of certified apprentices who received the CERB, by trade and sex
- Figure 38: Proportion of certified apprentices who received the CERB at least once, by sex
List of tables
- Table 1: Employment situations by types of grants received
- Table 2: Predicted probability for progressing, obtaining a certificate and discontinuing in a Red Seal trade (cohorts 2008 to 2014)
- Table 2.a.: Predicted probability for progressing, obtaining a certificate and discontinuing in a Red Seal trade (cohorts 2008 to 2014): Receipt of AG
- Table 2.b.: Predicted probability for progressing, obtaining a certificate and discontinuing in a Red Seal trade (cohorts 2008 to 2014): Age at registration
- Table 2.c.: Predicted probability for progressing, obtaining a certificate and discontinuing in a Red Seal trade (cohorts 2008 to 2014): Sex
- Table 2.d.: Predicted probability for progressing, obtaining a certificate and discontinuing in a Red Seal trade (cohorts 2008 to 2014): Employment income in registration year
- Table 2.e.: Predicted probability for progressing, obtaining a certificate and discontinuing in a Red Seal trade (cohorts 2008 to 2014): Marital status in registration year
- Table 2.f.: Predicted probability for progressing, obtaining a certificate and discontinuing in a Red Seal trade (cohorts 2008 to 2014): Low-income status in registration year
- Table 2.g.: Predicted probability for progressing, obtaining a certificate and discontinuing in a Red Seal trade (cohorts 2008 to 2014): Program duration
- Table 2.h.: Predicted probability for progressing, obtaining a certificate and discontinuing in a Red Seal trade (cohorts 2008 to 2014): Receipt of initial credits at registration
- Table 2.i.: Predicted probability for progressing, obtaining a certificate and discontinuing in a Red Seal trade (cohorts 2008 to 2014): Type of certification
- Table 2j: Predicted probability for progressing, obtaining a certificate and discontinuing in a Red Seal trade (cohorts 2008 to 2014): Receipt of EI benefits in registration year
- Table 2.k.: Predicted probability for progressing, obtaining a certificate and discontinuing in a Red Seal trade (cohorts 2008 to 2014): Union membership in registration year
- Table 3: Results of average treatment effect for treated (ATT) estimation using propensity score kernel matching - Outcomes variable: Progression (cohorts 2008 to 2014)
- Table 4: Results of average treatment effect for treated (ATT) estimation using propensity score kernel matching - Outcomes variable: Certification within 1.5 times the program duration (cohorts 2008 to 2014)
- Table 5: Employment income gaps: Results of average treatment effect for treated (ATT) estimation using propensity score kernel matching - Outcomes variable: Employment income at certification year and 3 years after certification (cohorts 2008 to 2014)
- Table 6: Employment income gaps: Results of average treatment effect for treated (ATT) estimation using propensity score kernel matching - Outcomes variable: Employment income 1 year and 3 years after the program duration regardless of certification (cohorts 2008 to 2014)
List of abbreviations and terms
- ACG
- Apprenticeship Completion Grant
- AG
- Apprenticeship Grants
- AIG
- Apprenticeship Incentive Grant
- AIG-W
- Apprenticeship Incentive Grant for Women
- ATT
- Average Treatment effect for Treated
- CAL
- Canada Apprentice Loan
- CAF
- Canadian Apprenticeship Forum
- CAS
- Canadian Apprenticeship Strategy
- CCDA
- Canadian Council of Directors of Apprenticeship
- CERB
- Canada Emergency Response Benefit
- CFP
- Call for proposals
- EI
- Employment Insurance
- ESDC
- Employment and Social Development Canada
- KI
- Key informant(s)
- KII
- Key informant interviews
- NN
- Nearest neighbor
- PLAR
- Prior Learning Assessment Recognition
- PMEC
- Performance Measurement and Evaluation Committee
- POB
- Program Operations Branch
- PSIS
- Postsecondary Student Information System
- PT
- Provinces and territories
- RAIS
- Registered Apprenticeship Information System
- SME
- Small and medium-sized employers
- SRDC
- Social Research and Demonstration Corporation
- T1FF
- T1 Family File (Income Data for Tax Filers)
Introduction
The AG Program provides grants to apprentices and is part of a broader suite of supports under the Canadian Apprenticeship Strategy (CAS). The CAS has 4 key policy objectives:
- promote the skilled trades as a good career option
- help Canadians — especially from equity-deserving groups — to explore, prepare for, and successfully participate in apprenticeship
- facilitate the participation of employers and unions in apprenticeship
- encourage the development of innovative tools and approaches to better prepare pre-apprentices, apprentices and journeypersons for the jobs of tomorrow
Evaluation of the Apprenticeship Grants program
This evaluation of the AG Program includes 3 parts:
- Component 1 is a summative evaluation of the impacts of all AG on recipients' progression, certification, and post-program employment outcomes. It uses newly available data sets and covers the period from 2007 to 2020
- Component 2 provides a formative evaluation of the AIG-W pilot project, covering the period from 2018 to 2023
- Component 3 assesses the impact of the COVID-19 pandemic on the AG and AG participants. It also presents the experiences of apprentices
This evaluation does not assess the effectiveness of the full complement of supports for apprentices.
The evaluation was conducted in compliance with requirements of the Financial Administration Act and the Policy on Results. It further explores areas which had been identified in the previous evaluation. Consult the evaluation questions and key findings from the 2019 evaluation in Appendix B.
Executive summary
Key findings
Influence of the grants on progression and certification
Apprentices in interviews and focus groups stated that the AG Program's influence upon apprenticeship entry or continuation is limited. While AG recipients had higher progression and certification rates than similar non-recipients, various factors may contribute to these higher rates. These include the AG Program, program eligibility requirements, factors other than AG such as changing motivation, securing another job, and the range of other financial supports available to apprentices. Due to methodological limitations, this evaluation was not able to assess attribution or causality between grant receipt and apprenticeship progression and certification.
Apprenticeship certification and employment outcomes
Apprenticeship completion and certification leads to higher employment and earnings. AG recipients therefore have higher post-apprenticeship incomes than similar non-recipients because they have higher certification rates due to various factors. Men have higher post-apprenticeship income than women. This is partly due to the fact that women are concentrated in lower-paying trades.
Formative evaluation of the Apprenticeship Incentive Grant for Women (AIG-W)
The proportion of women choosing male-dominated Red Seal trades has increased at a higher rate since the AIG-W was introduced in 2018. There are most likely multiple causes for this increase, including the AIG-W pilot project. While the AIG-W provided some incentive to persist in apprenticeship, its influence upon choice of trade was likely limited.
The AIG-W helped women overcome financial barriers (for example, paying for tools and living expenses), though some financial and non-financial barriers remain. Women confront certain barriers more often than men (in both male-dominated trades and other careers), such as unwelcoming workplaces and difficulty securing childcare during hours that align with their work schedules. This is especially the case in construction trades.
Some non-eligible apprentices believed that the AIG-W was unfair or discriminatory because it gave an unfair advantage to some women. A few key informants interviewed (7 out of 38) stated that some male apprentices applied as women and received the AIG-W, giving some women an unfavorable impression of the grant.
Impact of the COVID-19 Pandemic
The pandemic delayed apprenticeship progression and certification. It prompted reductions in employment, income, new apprentice registrations, grant eligibility, and grant applications. Pandemic restrictions imposed delays in technical training and certain trades were not amenable to online training, such as hairstylists. Lastly, some trade workers experienced greater impacts than others, such as women, entry-level apprentices, and those in the service trades.
Observations
The evaluation makes the following observations:
- A large proportion of apprentices only discovered the AG after starting their apprenticeship. Greater awareness of available supports to apprentices could help Canadians consider a career in the trades
- The AG Program helps apprentices mitigate the financial costs of apprenticeship. In addition to the range of financial supports available to apprentices, exploring measures to reduce non-financial barriers would improve apprentice progression and certification
- Unwelcoming workplace cultures are reported as a major barrier for women working in male-dominated trades. Measures toward gender diversity and inclusion across industries or occupations should also consider workplace cultures
- Apprentices continue to face financial challenges after receiving the Apprenticeship Incentive Grant (AIG) and the AIG-W. Better coordination between AG and other ESDC programs to which apprentices are entitled would allow for more comprehensive financial support. For example, awareness activities could promote the AG, Canada Apprentice Loan, and Employment Insurance (EI) in an integrated manner
Program background
The AG Program aims to increase access to careers in the skilled trades by reducing financial barriers faced by apprentices, thereby encouraging progression and certification in a designated Red Seal trade.Footnote 1
The grants also seek to promote interprovincial mobility by increasing the number of apprentices who become certified and obtain the Red Seal, a national standard of excellence.
The program allows eligible apprentices to receive up to $4,000 in combined grants during their lifetime. Female apprentices in Red Seal trades where women are under-represented could receive up to $8,000 before April 2023.Footnote 2 These amounts have remained unchanged since program inception.
The program targets registered apprentices in eligible Red Seal trades who are Canadian citizens, permanent residents, or protected persons.
The program is comprised of various grants:
- the AIG was implemented in 2007 and will end on March 31, 2025. It is a taxable cash grant of $1,000 per year or level for registered apprentices (up to a maximum of $2,000) who have completed the technical and on-the-job training requirements for the first or second level of their program. Effective January 1, 2021, apprentices have one year from the date they completed the level to apply for the grant
- the Apprenticeship Completion Grant (ACG) was implemented in 2009 and will end on March 31, 2025. It provides an additional $2,000 taxable cash grant to registered apprentices upon completion of training and receipt of a journeyperson certification. Since January 1, 2021 apprentices have 1 year from the date they obtain their certification to apply for the grant
- the AIG-W was implemented in December 2018 as a 5-year pilot project which ended on March 31, 2023.Footnote 3 The grant sought to improve economic opportunities for women by encouraging them to enter Red Seal trades with low female representation. It was a taxable cash grant of $3,000 per year or level (up to a maximum of $6,000) for women who have successfully completed the first or second level of their apprenticeship program in Red Seal trades where they are under-represented. The last date to apply was 31 March 2023. The AIG-W is no longer in effect as of April 2023
AG issued
Since the introduction of the AG Program in 2007, apprentices have received over 1,096,000 grants totalling $1.451 billion.
As of January 2024, ESDC has issued (see Figure 1):
- over 752,500 AIG ($752.5 million)
- over 330,300 ACG ($660.6 million)
- 13,200 AIG-W ($38.6 million)
The number of grants issued (AIG, ACG and AIG-W) decreased significantly during the pandemic, particularly during the 2020 to 2021 financial year.

Text version - Figure 1
| Fiscal year | Number of AIG issued | Number of ACG issued | Number of AIG-W issued |
|---|---|---|---|
| 2007-08 | 31441 | n/a | n/a |
| 2008-09 | 53212 | n/a | n/a |
| 2009-10 | 58912 | 18863 | n/a |
| 2010-11 | 51485 | 25678 | n/a |
| 2011-12 | 49487 | 25484 | n/a |
| 2012-13 | 50360 | 25667 | n/a |
| 2013-14 | 52376 | 22256 | n/a |
| 2014-15 | 52166 | 24043 | n/a |
| 2015-16 | 52415 | 24210 | n/a |
| 2016-17 | 50367 | 24523 | n/a |
| 2017-18 | 43088 | 22916 | n/a |
| 2018-19 | 41719 | 23801 | 1141 |
| 2019-20 | 40040 | 22299 | 3035 |
| 2020-21 | 25977 | 13577 | 2318 |
| 2021-22 | 34068 | 21868 | 2923 |
| 2022-23 | 31524 | 19336 | 3204 |
| 2023-24 | 33912 | 15799 | 579 |
- Source: graph prepared by the AG Program using AG administrative data.
- Note: 2007 to 2008 AIG data includes the last quarter of 2006 to 2007. ACG data is retroactive to 1 April 2009. AIG-W data is retroactive to 1 April 2018.
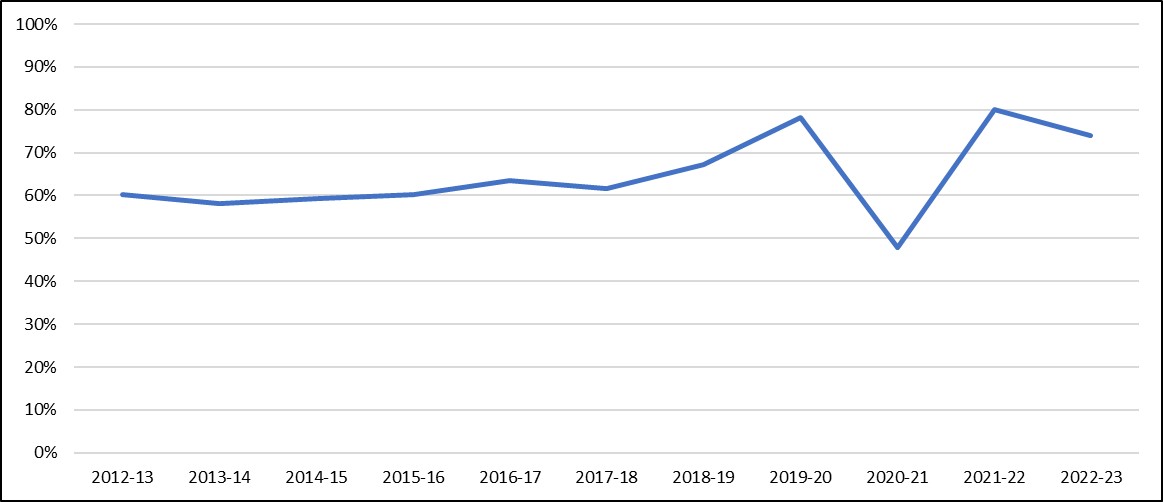
AG take-up rates
The AIG initially had a low take-up rate (41.7% in 2007, the year of its inception). The rate subsequently improved. Consult Figure 2. Take-up increased to reach its maximum in 2010 to 2011 (75.5%). It then began a gradual downward trend until 2015 to 2016.
The ACG take-up rate is closely aligned with take-up of the AIG.
The AIG-W take-up rate reached its maximum in 2019 to 2020 (96.3%), 1 year after its introduction in 2018. This period coincides with an increase in the ACG take up rate.
The take-up rates for all 3 incentives were marked by a significant drop in 2020 to 2021 during the pandemic. The take-up rates started to increase again after the pandemic (2021 to 2022). However, the year 2022 to 2023 demonstrated a new downward trend.
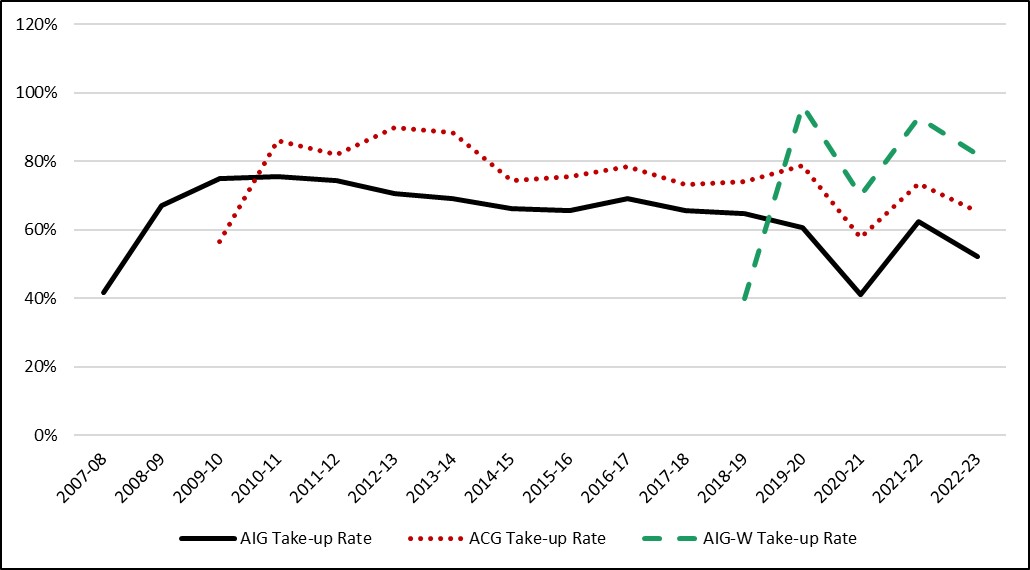
Text version - Figure 2
| Fiscal year | AIG Take-up Rate | ACG Take-up Rate | AIG-W Take-up Rate |
|---|---|---|---|
| 2007-08 | 41.7% | n/a | n/a |
| 2008-09 | 67.0% | n/a | n/a |
| 2009-10 | 74.8% | 56.5% | n/a |
| 2010-11 | 75.5% | 85.9% | n/a |
| 2011-12 | 74.3% | 81.9% | n/a |
| 2012-13 | 70.5% | 89.7% | n/a |
| 2013-14 | 69.1% | 88.4% | n/a |
| 2014-15 | 66.1% | 74.2% | n/a |
| 2015-16 | 65.7% | 75.5% | n/a |
| 2016-17 | 69.1% | 78.4% | n/a |
| 2017-18 | 65.7% | 73.3% | n/a |
| 2018-19 | 64.8% | 73.9% | 39.8% |
| 2019-20 | 60.5% | 78.6% | 96.3% |
| 2020-21 | 41.2% | 57.8% | 70.0% |
| 2021-22 | 62.4% | 73.4% | 92.7% |
| 2022-23 | 52.1% | 65.2% | 82.0% |
Source: take-up rates calculated by the AG Program using the AG administrative database and Registered Apprenticeship Information System (RAIS) data collected by Statistics Canada. Graph prepared by the AG Program.
Component 1: Impact evaluation of the AG Program
Impact of the AG Program on progression and certification
Apprentices face a variety of barriers to program completion. AG recipients have higher certification rates than non-recipients.
A large proportion of apprentices do not complete their programs due to receiving a job, job instability, financial constraints, or personal or family reasons
According to a literature review conducted by the Evaluation Directorate:
- Jin et al. (2020) found that although the number of new apprentice registrations per year in Red Seal and other trades has more than doubled since 1991, "the number of certificates granted has increased by only 47% during the same period"Footnote 4
- Jin et al. also found higher completion rates among apprentices in compulsory trades in both Red Seal and non-Red Seal programs.Footnote 5 People working in compulsory trades must be registered apprentices or certified journeypersons
- about 4 out of every 10 apprentices discontinue their programsFootnote 6
According to the 2015 National Apprenticeship Survey, the main reasons apprentices discontinue their programs are:
- job instability
- they receive a better job offer
- financial constraints
- personal or family issuesFootnote 7
Additional findings related to discontinuation are presented later in the report.
Apprentices face financial barriers, but available supports help to overcome them
Financial barriers to apprenticeship, which are greatest during the first 2 years, include:
- the costs of tools and technical training
- partial loss of income during technical training
- low pay for apprentices, at about 60% of a journeyperson's wage
In a recent Canadian Apprenticeship Forum (CAF) survey, 29% of respondents indicated that they could not afford to leave work for technical training and 25% considered this the greatest barrier to progression.Footnote 8
Not all apprentices use and some cannot benefit from EI coverage during technical training. Fewer than 60% of apprentices (and fewer than half of AG recipients) collect EI.Footnote 9 Those who complete technical training before on-the-job training (for example, the majority of hairstylists and most apprentices in Quebec) are not eligible. This pattern of training puts many women at a disadvantage since a large proportion of female apprentices are concentrated in hairdressing. For example, in 2016:
- 9% of continuing apprentices were women
- 39% of continuing female apprentices were hairstylists
- 89% of continuing hairstylists were womenFootnote 10
In 2015 only about 10% of hairstylists used EI compared to 65% of carpenters and construction electricians.Footnote 11
CAF survey respondents indicated that other financial supports helped them overcome barriers to apprenticeship completion either "to some extent" (44%) or "to a great extent" (27%). The 2015 National Apprentice Survey showed even larger proportions of apprentices in agreement.Footnote 12
A 2011 survey of program applicants showed that:
- 70% of respondents used the grants to cover training costs such as tools and equipment
- 32% also used their grants for general living expenses
- 21% paid off debtFootnote 13
The impact of the grants may be small, but apprentices do use them to defray the costs of their programs.Footnote 14
There are also non-financial barriers to apprenticeship
Difficulty finding an employer:
- most apprenticeship training is done by small- and medium-sized companies
- only 19% of skilled trades employers train apprenticesFootnote 15
- regulatory requirements such as mandated journeyperson ratios constrain the ability of smaller employers to hire apprenticesFootnote 16
Distance from technical training institutions:
- problems of access to urban technical training institutions for apprentices living in remote areas
- remote learning was widely used during the pandemic, but was not effective for all apprentices
Unwelcoming workplaces:
- evidence from a number of sources suggests that inappropriate behaviours, sexism, and harassment are common in the trades
- CAF surveys (in 2019 and 2020) found that significant proportions of the apprentice population — over 40% of women and about a quarter of men — experienced or witnessed discrimination, harassment, and bullying during work or technical trainingFootnote 17
- women report inappropriate behaviours from male colleagues, their immediate supervisors, and from clientsFootnote 18
- female apprentices may experience more stress because they feel like outsiders
- Indigenous apprentices also reported bullying and harassment on the job
- only 58% of apprentices with disabilities felt that they fit in at their workplaceFootnote 19
Non-financial barriers to apprenticeship
AIG recipients reported barriers related to unwelcoming workplaces in an SRDC survey conducted for this evaluation (Figure 3), including:
- feeling like they were being ‘pigeon-holed' into simple tasks (24%)
- unsupportive supervisors (22%) or lacking role models and mentors (19%)
- unsupportive co-workers (16%) or not knowing who to talk to when they experience issues at work (16%)
- bullying and harassment at work (12%), lacking networking opportunities (11%), and facing recruitment and hiring biases (9%)
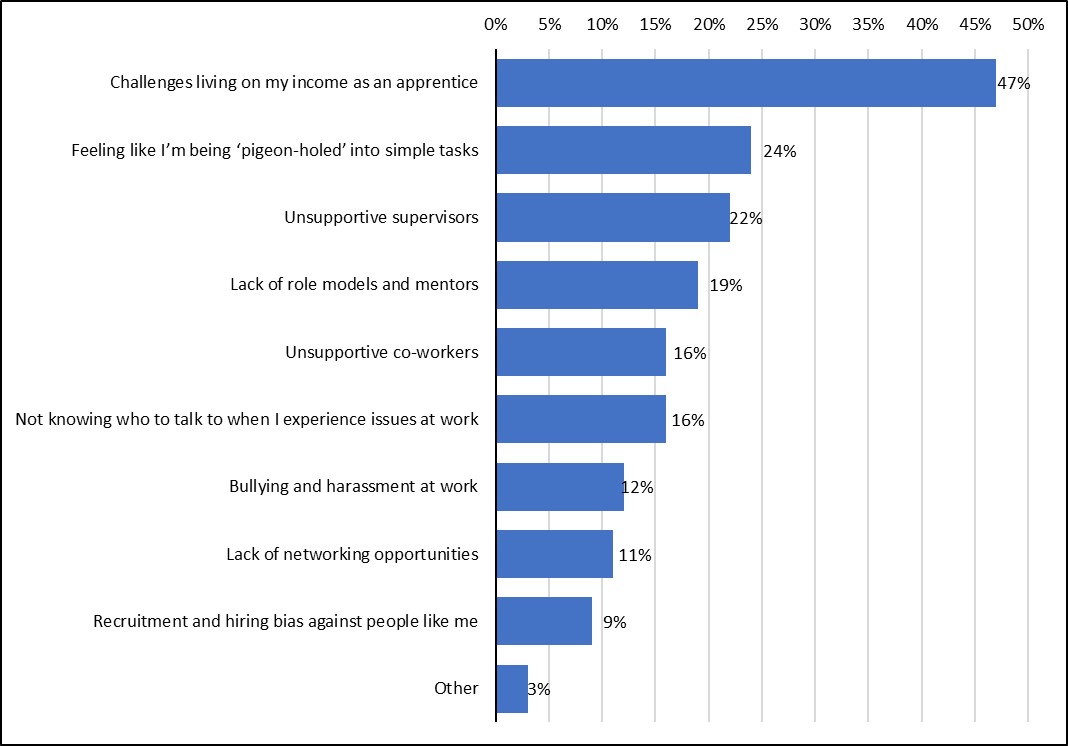
Text version - Figure 3
| Types of barriers | proportion |
|---|---|
| Challenges living on my income as an apprentice | 47% |
| Feeling like I'm being ‘pigeon-holed' into simple tasks | 24% |
| Unsupportive supervisors | 22% |
| Lack of role models and mentors | 19% |
| Unsupportive co-workers | 16% |
| Not knowing who to talk to when I experience issues at work | 16% |
| Bullying and harassment at work | 12% |
| Lack of networking opportunities | 11% |
| Recruitment and hiring bias against people like me | 9% |
| Other | 3% |
Source: SRDC (2024), National survey of AG recipients, conducted for ESDC’s Evaluation Directorate. Unpublished technical report.
There is a lack of awareness of both apprenticeship and available financial supports
According to a literature review conducted by the Evaluation Directorate:
- there is a lack of awareness of both apprenticeship as a career option and of the grants as a funding source
- most sources agree that secondary students in Canada are not sufficiently introduced to the idea of apprenticeship as a career optionFootnote 20
- the 2015 National Apprenticeship Survey found that "about 60% of apprentices were aware" of the Apprenticeship Grants. Most learn about the program only after beginning their apprenticeship, usually during technical training or through other tradespeopleFootnote 21
- a CAF survey in 2018 found that only 15% of respondents were aware of all the financial supports available.Footnote 22 In addition:
- 64% were aware of the AIG
- 62% were aware of the ACG
- 43% were aware of the Canada Apprentice Loan (CAL)
- nearly half of all AG recipients were not using other financial supports in 2016, often because they were unaware of what was availableFootnote 23
According to focus groups conducted by the Evaluation Directorate, apprentices learned about the AG through various means, including:
- technical training institutions or courses (24 of 47, or 51% of participants).
- word of mouth (10 participants from various groups)
- various provincial or territorial sources, such as attestation letters or apprenticeship program personnel (5 AIG-W recipients)
- unions (5 of 55, or 9% of participants)
- employers (4 AIG recipients)
- pre-apprenticeship programs, trades sampler courses, and programs supporting women (2 AIG-W recipients)
- websites or social media (1 AIG-W recipient)
Evaluation approach related to progression and certification
There are no specific variables to assess progression in the Registered Apprenticeship Information System (RAIS). The RAIS is administered and updated annually by Statistics Canada. It gathers information on individuals who receive training and those who obtain certification within a trade where apprenticeship training is being offered.
In the administrative data analysis conducted for this evaluation, progression is proxied by examining the proportion of apprentices who receive their certification by the time elapsed since registration relative to the program duration.
The analysis considers 3 scenarios under which a certificate is obtained:
- within program duration
- within 1.5 times the program duration (for example, a 4-year program completed within 6 years)
- within twice the program duration (for example, a 4-year program completed within 8 years)
Most apprentices take longer (by 1.5 times) to complete their programs than the official prescribed duration. Duration of apprenticeship programs varies by trade.
For the purposes of the administrative data analysis, the "progression rate" refers to the proportion of recipients and non-recipients who obtained a trade certificate within program duration. The "completion rate" refers to the proportion of recipients and non-recipients who obtained a trade certificate within 1.5 times the program duration. Rates were estimated for the 2008 to the 2014 cohorts. A cohort is defined as a group of apprentices who registered in an apprenticeship program during a specific calendar year.
Evaluation approach related to progression and certification - Key considerations and limitations
The evaluation examines the differences in progression, certification and employment outcomes of apprentices who received a grant and those who did not. This type of method is consistent with the approach used in a recent study by Statistics Canada. However, observed differences between grant recipients and non-recipients are correlational in nature and should be interpreted carefully. It is not possible to establish causational links between grant receipt and apprenticeship progression, certification, and employment outcomes for the following 3 reasons.
AG Eligibility Requirements
One challenge with comparing AG recipients and non-recipients is that to be eligible for any grants, apprentices must prove that they have successfully completed their initial levels or blocks in a designated Red Seal trade. This means that grant recipients may have more experience in their program than non-recipients, potentially leading to more successful outcomes.
According to the literature review conducted by the Evaluation Directorate, about 4 of every 10 apprentices discontinue their programs within the first 2 years, though some will later continue and some may even complete. Some AG non-recipients, who discontinue early in their program, are not eligible to apply for the grant. This suggests that even before receiving a grant, there may be differences in individuals' capacities or changes in career choices which make the recipient and non-recipient groups dissimilar in some key respects.
Other factors affecting progression and certification
The evaluation could not examine certain other factors related to progression and certification. Variables such as individual motivation or capacity, ability to undertake an apprenticeship program, lack of awareness of the AG Program, other job offers, or the apprentice's relationship with their employer could be factors that contribute to progression and certification. Such variables were not available to include in the statistical models.
Other supports available to apprentices
Aside from AG, apprentices can receive other financial assistance when completing their programs (such as EI during technical training, CAL, available provincial and territorial supports, as well as targeted tax measures). For example, in 2014 to 2015, apprentices who claimed EI Regular Benefits while attending full-time technical training received an average weekly benefit of $470 over a period of about 8 weeks.Footnote 24 CAL dispersed an average of $3,990 in loans to recipients (loans dispersed from January 1, 2015 to July 31, 2015).Footnote 25 Statistical methods carried out for the purposes of this evaluation control for various observable factors in the year of registration, including the receipt of EI benefits and CAL. Over the years following their registration, the use of these complementary supports may differ between AG recipients and non-recipients.
Progression rates of AG recipients are higher than that of non-recipients. The AG Program, program eligibility requirements, other factors such as motivation, and other supports available to apprentices may contribute to this difference
Among apprentices who registered in Red Seal trades from 2008 to 2014, the progression rate of AG recipients was on average 33% compared to nearly 8% for non-recipients (Figure 4). As mentioned previously, observed differences between grant recipients and non-recipients are correlational in nature and should be interpreted carefully.
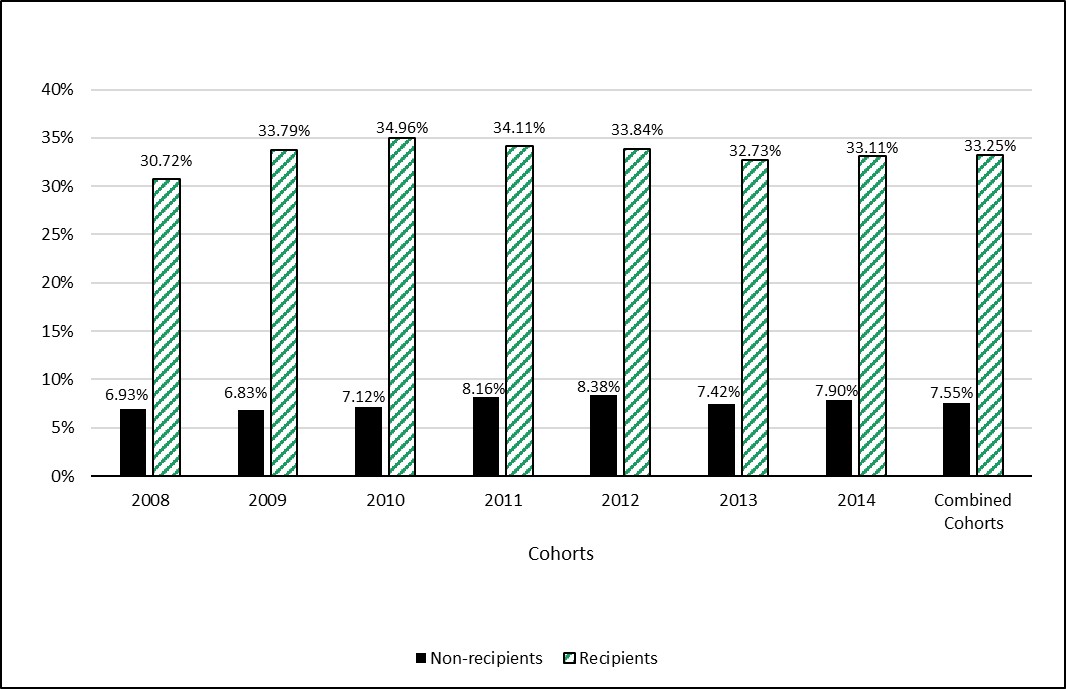
Text version - Figure 4
| Cohorts | 2008 | 2009 | 2010 | 2011 | 2012 | 2013 | 2014 | Combined Cohorts |
|---|---|---|---|---|---|---|---|---|
| Non-recipients | 6.93% | 6.83% | 7.12% | 8.16% | 8.38% | 7.42% | 7.90% | 7.55% |
| Recipients | 30.72% | 33.79% | 34.96% | 34.11% | 33.84% | 32.73% | 33.11% | 33.25% |
- Source: Analyses conducted by the Evaluation Directorate, ESDC (2024). AG administrative data linked to the RAIS, CAL and T1FF data.
- Notes
- Progression, for the purpose of this analysis, is measured using a proxy (certification within the planned duration of the apprenticeship program). Progression refers to a situation where the period of time between an apprentice's registration date and certification date is equal to or less than the expected duration of their program. In other words, an apprentice who completes their training within the program duration is considered to have progressed normally during their training.
- In this evaluation, a cohort is defined as a group of apprentices who registered in an apprenticeship program during a specific calendar year.
Among AG recipients, the progression rate of females is slightly higher than that of males
The progression rate of female apprentices (21.83%) between 2008 and 2014 is slightly higher than that of male apprentices (18.60%) (Figure 5). No further analysis was conducted as part of this evaluation to explain this difference.
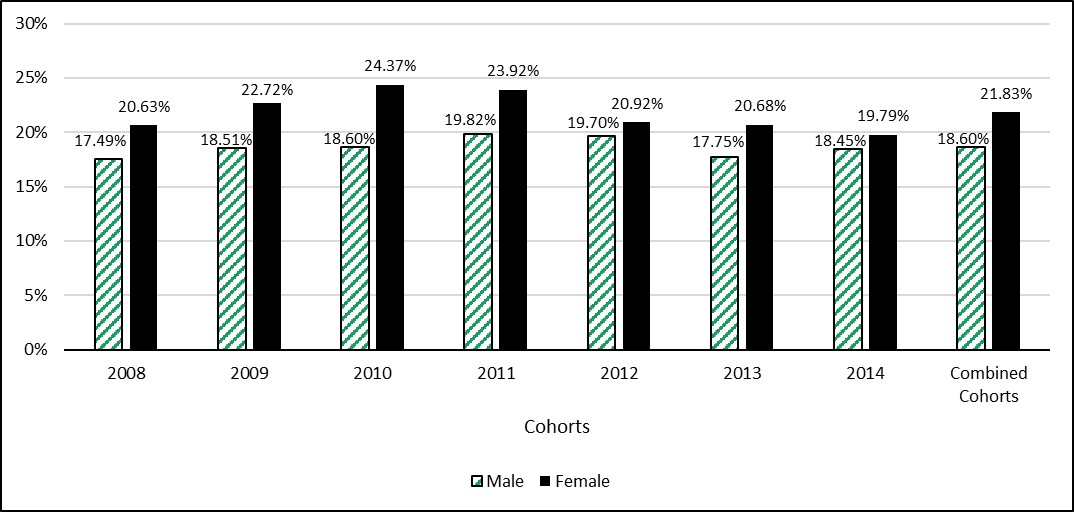
Text version - Figure 5
| Cohorts | 2008 | 2009 | 2010 | 2011 | 2012 | 2013 | 2014 | Combined Cohorts |
|---|---|---|---|---|---|---|---|---|
| Male | 17.49% | 18.51% | 18.60% | 19.82% | 19.70% | 17.75% | 18.45% | 18.60% |
| Female | 20.63% | 22.72% | 24.37% | 23.92% | 20.92% | 20.68% | 19.79% | 21.83% |
Source: Analyses conducted by the Evaluation Directorate, ESDC (2024). AG administrative data linked to the RAIS, CAL and T1FF data.
According to a probit regression including all cohorts, the probability of progression is about 2 percentage points higher for female apprentices than for men. Consult Appendix J.
Differences in the progression and certification rates between AG recipients and similar non-recipients may be influenced by the AG program, program eligibility requirements, unobservable factors such as motivation, and other supports available to apprentices
The progression and certification outcomes of AG recipients and non-recipients were further examined using regression and matching models. Consult Appendix L for additional information on the model and matching methods.
The intent of the administrative data analysis was to examine whether the differences in progression and certification rates between AG recipients and non-recipients relates to differences in observable characteristics between the 2 groups in their registration year.
Overall, the probability of progression of apprentices for whom a grant was issued was, on average, 23.97 percentage points higher, compared to a comparable group of non-AG recipients. Consult Figure 6 and Appendix J for results by cohort and combined cohorts.
Overall, the probability of certification of apprentices for whom a grant was issued was, on average, 46.45 percentage points higher, compared to a comparable group of non-AG recipients. Consult Figure 7 and Appendix J for results by cohort and combined cohorts.
Due to methodological limitations, this evaluation was not able to assess attribution or causality. It aimed to determine the extent to which differences between the progression and certification rates of AG recipients and non-recipients relate to differences in observable characteristics in the year of registration between the 2 groups. As mentioned earlier, other factors may also contribute to remaining differences in the progression and certification rates of AG recipients and similar non-recipients. These include AG eligibility requirements, unobservable factors such as motivation, as well as the availability of other financial assistance to apprentices when completing their programs.
Future policy analysis, research, or evaluation activities could build on and complement this approach by exploring potential alternative methods. The collection of additional data on other factors related to progression and certification that were not observable in this evaluation should also be examined. Additional information on limitations associated with regression and matching models can be found in Appendix G.
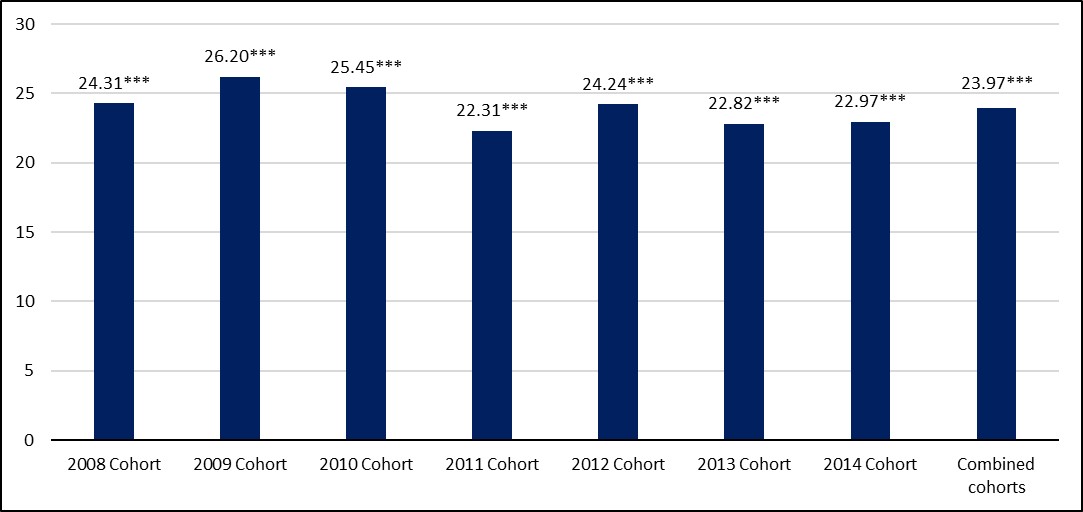
Text version - Figure 6
| Cohorts | 2008 | 2009 | 2010 | 2011 | 2012 | 2013 | 2014 | Combined cohorts |
|---|---|---|---|---|---|---|---|---|
| Differences in probability | 24.31 | 26.20 | 25.45 | 22.31 | 24.24 | 22.82 | 22.97 | 23.97 |
- ***Significant at the 1% confidence level. **Significant at the 5% confidence level. *Significant at the 10% confidence level.
- Source: Analyses conducted by the Evaluation Directorate, ESDC (2024). AG administrative data linked to the RAIS, CAL and T1FF data.
- Notes
- The impact analysis was not conducted separately for AIG-W. This grant was introduced in 2018, which means there would be only 1 cohort available to assess its impact.
- Variables included in the model were as follows: Age at registration, Gender, Employment income at registration, Marital status at registration, Low-income status, Program duration, Union membership at registration, Receipt of EI benefits at registration year, being in Compulsory or Voluntary trade, Receipt of initial credits at registration, Receipt of CAL (for the 2014 cohort).
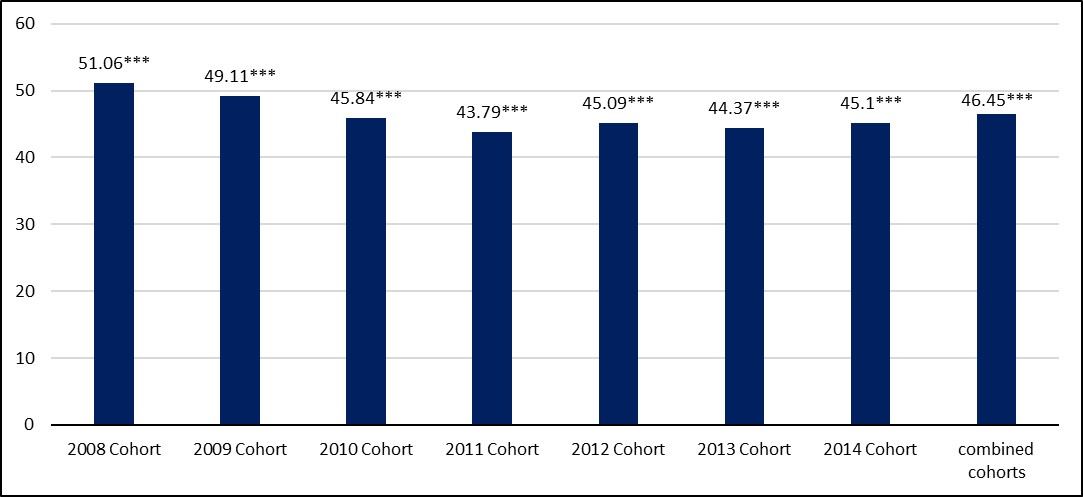
Text version - Figure 7
| Cohorts | 2008 | 2009 | 2010 | 2011 | 2012 | 2013 | 2014 | Combined cohorts |
|---|---|---|---|---|---|---|---|---|
| Differences in probability | 51.06 | 49.11 | 45.84 | 43.79 | 45.09 | 44.37 | 45.1 | 46.45 |
- ***Significant at the 1% confidence level. **Significant at the 5% confidence level. *Significant at the 10% confidence level.
- Source: Analyses conducted by the Evaluation Directorate, ESDC (2024). AG administrative data linked to the RAIS, CAL and T1FF data.
- Notes
- The impact analysis was not conducted separately for AIG-W. This grant was introduced in 2018, which means there would be only one cohort available to assess its impact.
- Variables included in the model were as follows: Age at registration, Gender, Employment income at registration, Marital status at registration, Low-income status, Program duration, Union membership at registration, Receipt of EI benefits at registration year, being in Compulsory or Voluntary trade, Receipt of initial credits at registration, Receipt of CAL (for the 2014 cohort).
Sources disagree about the influence of the grants on apprenticeship progression, participation in post-secondary education, and apprenticeship entry
According to a literature review conducted by the Evaluation Directorate, some sources demonstrate that grants foster apprenticeship progression and continuation:
- 35% of CAF survey respondents indicated that government programs helped them progress. Of those respondents, 77% mentioned the AIG, 73% the ACG, 54% the CAL, and 30% mentioned provincial or territorial financial supportsFootnote 26
- a study by Statistics Canada in 2021 compared grant recipients and non-recipients in the 2008 to 2013 cohorts.Footnote 27 Consistent with results presented as part of this evaluation and subject to the same limitations regarding their careful interpretation, it found that a higher proportion of apprentices receiving grants certified and a lower proportion discontinued:
- for grant recipients, 59.2% certified, 20.6% continued, and 20.2% discontinued
- for non-recipients in the same cohorts, 15.9% certified, 21.4% continued, and 62.7% discontinued
- American research shows that grants may help increase participation in post-secondary education, generally. This research shows that grants may be especially helpful for the less affluentFootnote 28
Other sources indicate, however, that the grants are too small to have much impact on decisions about entry into apprenticeship or program continuation. Apprentices themselves indicate that the influence of the AG on their decisions to enter or continue a program is limited.Footnote 29 Furthermore, a 2019 CAF survey reported that 55% of respondents said "financial incentives influenced their decision to pursue an apprenticeship ‘little to no extent.'"Footnote 30
Focus groups conducted by the Evaluation Directorate found that a few (4) focus group participants, all in non-male-dominated trades, indicated that the regular AIG can motivate some workers to undertake apprenticeship and certify, especially in voluntary trades. One stated that the grants played a big role in his decision to continue and were "probably the only reason [why] I stuck with the Red Seal program and the apprenticeship program."
Certification rates of AG recipients are higher than those of non-recipients. The AG Program, program eligibility requirements, other factors such as motivation, and other supports available to apprentices may contribute to these higher rates
Nearly 63% of apprentices who were AG recipients obtained their certificate compared to only about 12% of apprentices who were non-recipients (after 1.5 times the program duration). Consult Figure 8. Between the 2008 and 2014 cohorts, the gap remained the same. As mentioned previously, observed differences between grant recipients and non-recipients are correlational in nature and should be interpreted carefully.
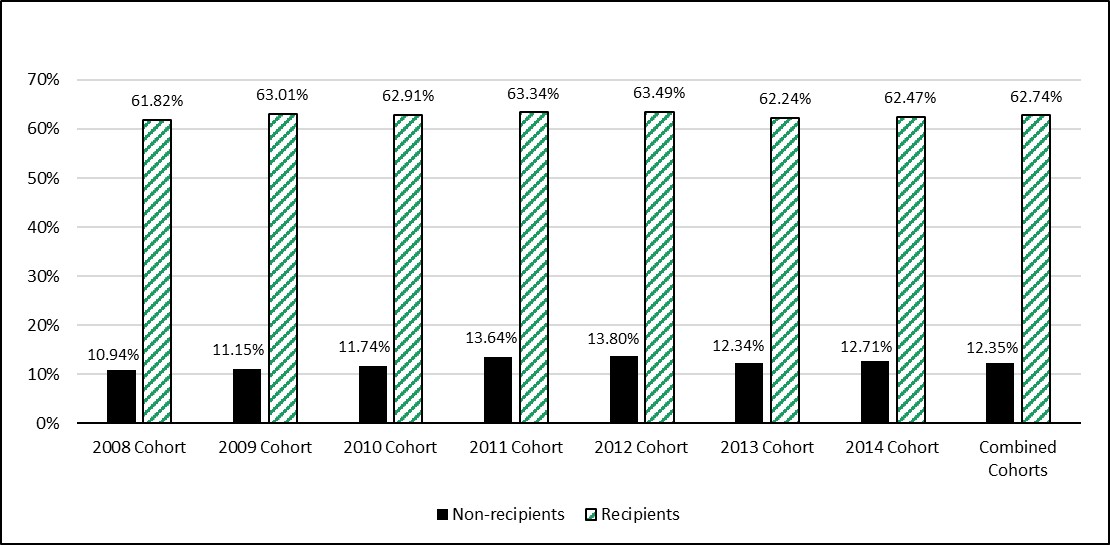
Text version - Figure 8
| Cohorts | 2008 | 2009 | 2010 | 2011 | 2012 | 2013 | 2014 | Combined Cohorts |
|---|---|---|---|---|---|---|---|---|
| Non-recipients | 10.94% | 11.15% | 11.74% | 13.64% | 13.80% | 12.34% | 12.71% | 12.35% |
| Recipients | 61.82% | 63.01% | 62.91% | 63.34% | 63.49% | 62.24% | 62.47% | 62.74% |
Source: Analyses conducted by the Evaluation Directorate, ESDC (2024). AG administrative data linked to the RAIS, CAL and T1FF data.
The gap in certification between recipients and non-recipients widens when analyzing certification within 2 times the program duration. This may be partly due to a lower probability for recipients to discontinue their program. According to a probit regression pooling all cohorts, the probability of discontinuing their program 6 years after registration was lower (by 52 percentage points) for AG recipients compared to non-recipients. Consult Appendix J.
The certification rate of apprentices, recipients or non-recipients, varies according to employment income in their registration year
The certification rate varies according to apprentices' (both recipients and non-recipients) employment income in their registration year (Figure 9):
- 71% of recipients certified compared to 15% of non-recipients, among those with income of $75,000 or more
- between 66% and 72% of recipients certified compared to 16% to 17% of non-recipients, among those with employment income between $30,000 and $74,999
- between 51% and 59% of recipients certified compared to 7% to 12% of non-recipients, among those with employment income up to $29,999
As mentioned previously, observed differences between grant recipients and non-recipients are correlational in nature and should be interpreted carefully.
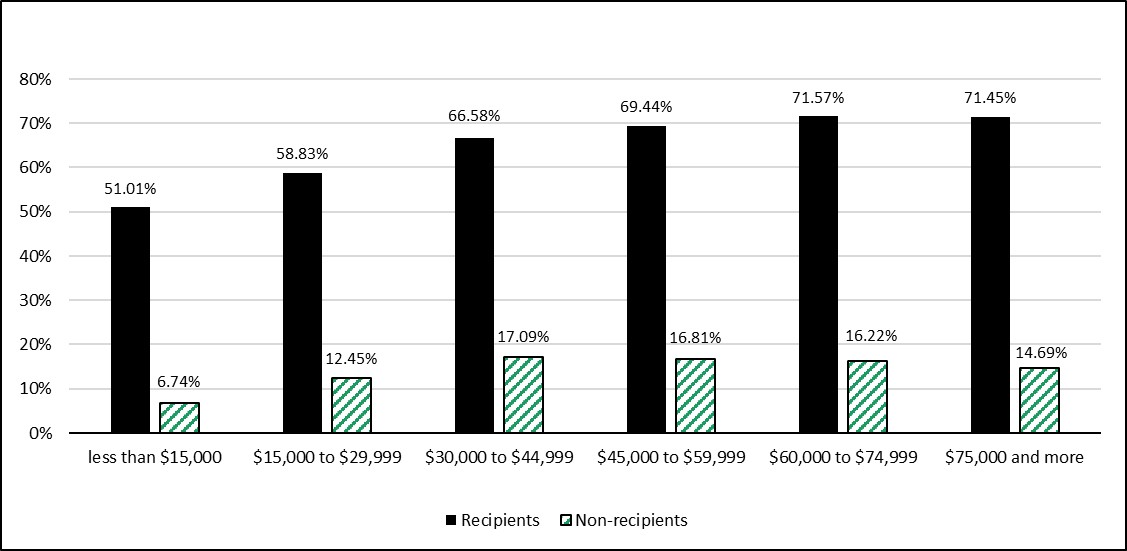
Text version - Figure 9
| Employment income categories | Less than $15,000 | $15,000 to $29,999 | $30,000 to $44,999 | $45,000 to $59,999 | $60,000 to $74,999 | $75,000 and more |
|---|---|---|---|---|---|---|
| Recipients | 51.01% | 58.83% | 66.58% | 69.44% | 71.57% | 71.45% |
| Non-recipients | 6.74% | 12.45% | 17.09% | 16.81% | 16.22% | 14.69% |
Source: Analyses conducted by the Evaluation Directorate, ESDC (2024). AG administrative data linked to the RAIS, CAL and T1FF data.
A probit regression reveals that apprentices with higher employment income during their registration year have a greater probability of obtaining their certificate. Consult Appendix J. Among apprentices registered from 2008 to 2014, those with employment income between $60,000 and $74,999 had a probability of obtaining their certificate 13 percentage points higher than those with employment income between $15,000 and $29,999. This gap reached 14 percentage points for apprentices with employment income of $75,000 or more.
Female apprentices are less likely than men to certify in male-dominated trades
In male-dominated trades, women are more likely than men to discontinue their apprenticeship and less likely to certify.Footnote 32 Similarly, men training in female-dominated trades were less likely to certify and more likely to discontinue than their female counterparts.
When apprentices in all trades are considered, women are more likely than men to certify.
Based on data from the Education and Labour Market Longitudinal Platform from 2008 to 2016, and considering apprentices in both Red Seal and non-Red Seal trades, Jin et al. (2020)Footnote 33 found that:
- on average, more male apprentices (about 37%) than female apprentices (32%) obtained a certificate (within 1.5 times their program duration)
- female apprentices "were more concentrated in non-Red Seal trades, for which the overall certification rate (28%) is lower compared with Red Seal trades (40%)"
- when controlling for differences in registration between Red Seal and non-Red Seal trades as well as other individual characteristics, "women were four percentage points more likely than men with the same characteristics to obtain a certificate (40% vs. 36%)…. However, the gender gap varied across programs"
Recognition of professional experience or previous training improves the certification rate
Recognition of professional experience or previous training, through the receipt of credits, improves the certification rate, especially among AG non-recipients.
Among non-recipients, those who received credit had a higher certification rate (15.64%) than those who did not (11.03%). Consult Figure 10
The certification rate is approximately the same (64%) for AG recipients who received credit as for those who did not.
As mentioned previously, observed differences between grant recipients and non-recipients are correlational in nature and should be interpreted carefully.
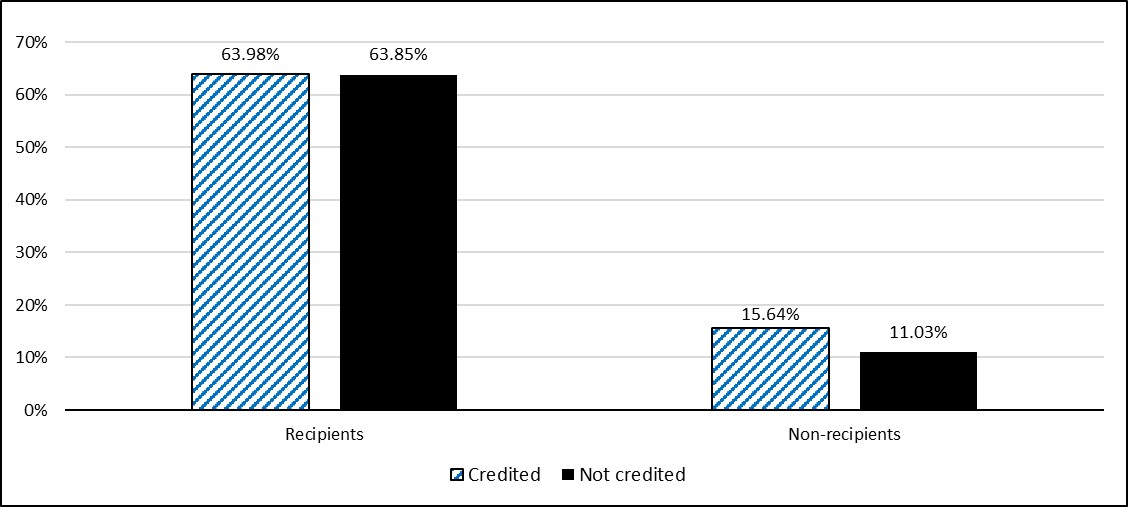
Text version - Figure 10
| Status | Credited | Not credited |
|---|---|---|
| Recipients | 63.98% | 63.85% |
| Non-recipients | 15.64% | 11.03% |
Source: Analyses conducted by the Evaluation Directorate, ESDC (2024). AG administrative data linked to the RAIS, CAL and T1FF data.
A probit regression demonstrated a higher probability of certification among apprentices (both AG recipients and non-recipients) who obtained credit for prior training at registration. The probability was higher by 2.4 percentage points. The result applies to certification within 1.5 times the program duration. Consult Appendix J.
Certain sociodemographic characteristics and inclusion in certain subgroups influence progression and certificationFootnote 34
Low-income status, age, and marital status may influence the probabilities of progressing and certifying.
Low-income status
A probit regression showed that apprentices with low-income status in their registration year have a lower probability of progressing and certifying.Footnote 35 Probability of progression was 3 percentage points lower among apprentices with low-income status. Probability of certification (within 1.5 times the program duration) was 5 percentage points lower.
Age
According to a probit regression, younger apprentices have a greater probability of progressing and obtaining their certificate.
Probability of progression was 5 percentage points higher among apprentices aged 18 to 25 compared to apprentices aged 46 or over.
Probability of obtaining certification (within 1.5 times the program duration) was 16 percentage points higher for apprentices aged 18 to 20. Probability was 12 points higher for those aged 21 to 25.
Marital status
According to a probit regression, apprentices who are married or in common-law relationships have a higher probability of progressing. The probability is 2 percentage points higher compared to apprentices who are single. The probability is almost 5 points higher compared to divorced, separated, or widowed apprentices.
Apprentices who are married or in common-law relationships also have a higher probability of obtaining certification. The probability of certifying is 2 percentage points higher compared to those who are single. The probability is 6 percentage points higher compared to those who are divorced, separated, or widowed.
Other factors or supports that could aid progression
Focus group participants suggested other means of aiding progression for all apprentices:
- information for employers:
- increasing employers' awareness of the grants so that they can encourage more apprentices to apply for them
- providing information on financial incentives available employers to support apprentices' progression until certification
- changes to the training:
- increasing the number of courses available online or in hybrid mode
- improving the structure and consistency of on-the-job training
- changes to the tax system:
- more generous tax credits for tools (basic amount claim, for example)
- removing taxes on tools bought for work
- making the grants non-taxable or deducting taxes directly from grant payments
- additional financial support:
- creating a new grant for employers so they can pay apprentices during training blocks
- increasing the grant amount (to keep pace with inflation)
- providing more financial support (to keep pace with inflation)
- networking:
- providing more opportunities to connect online with other apprentices from across Canada to share knowledge, experiences, and advice
- EI:
- accelerating EI claim processing
Impact of the AG Program on employment outcomes
AG recipients have higher post-apprenticeship employment income than non-recipients.
Apprenticeship completion and certification leads to higher employment and earnings
According to recent studies on outcomes from apprenticeship included in the literature review conducted by the Evaluation Directorate:
- about 3 of 4 apprentices who completed their programs got a Red Seal certification. Compared to discontinuers, more completers were employed, more had permanent jobs, and more had benefitsFootnote 36
- completers had higher average annual earnings. A higher proportion of completers (53.2%) than discontinuers (25.4%) worked for the same employer they had during their apprenticeship programsFootnote 37
- Red Seal certified journeypersons earned about 3% more per year than non-Red Seal journeypersonsFootnote 38
- apprenticeship completers earned 9% to 10% more than trade qualifiers (journeypersons who passed the certification exam without completing an apprenticeship)Footnote 39
- the median income of completers "was approximately $20,000 higher than that of discontinuers or long-term continuers" between 2008 and 2016. Long-term continuers are those still registered beyond 1.5 times expected program durationFootnote 40
- those who certified were "more likely than discontinuers to be working in a unionized workplace." They were also more likely to be covered by a pension planFootnote 41
Apprentices who received AIG were significantly more likely to work full-time in their trades than those who did not
Most SRDC survey respondents currently worked full time, defined as working 30 hours or more per week. Consult Table 1.Footnote 42
A higher proportion of AIG-W (90%) recipients worked in their trade compared to those whose applications were rejected at least once (85%).
A higher proportion of AIG (97%) recipients worked full time compared to those whose applications were rejected at least once (89%).
As mentioned previously, observed differences between grant recipients and non-recipients are correlational in nature and should be interpreted carefully.
| Employment status | Total | AIG | AIG-W | ACG | Rejection |
|---|---|---|---|---|---|
| Currently working in the trades | 93% | 94%*** | 90% *** | 94% | 85% *** |
| Working full time (30 hours or more per week) | 96% | 97%*** | 96% | 96% | 89% *** |
| Ever unemployed within the last 12 months | 21% | 20% | 27% | 19% | 25% |
- ***Significant at the 1% confidence level. **Significant at the 5% confidence level. *Significant at the 10% confidence level.
- Source: SRDC (2024), National survey of AG recipients, conducted for ESDC’s Evaluation Directorate. Unpublished technical report.
Differences in post-apprenticeship employment income between AG recipients and similar non-recipients indicate that certification is the most important factor for employment income
Following certification, the employment incomes of AG recipients increased more quickly than incomes of non-recipients (Figure 11 and Figure 12):
- the average and median employment incomes of AG recipients were at least $2,000 higher than non-recipients during the year of certification
- 3 years later, the difference reached $5,800
AG recipients' employment incomes were also compared with non-AG recipients with similar characteristics in the year of registration using matching methods.
When limiting the comparison to apprentices who obtained their certification (after 1.5 times their planned program duration), no significant differences were found between the post-apprenticeship employment incomes of AG recipients and non-recipients.
When examining all apprentices (those who certified or still continued their training after 1.5 times their planned program duration), AG recipients had higher post-apprenticeship employment incomes than non-recipients (Figure 13 and Figure 14).
This means that it is certification which is the key contributing factor for differences in employment income.
Consult Appendix G for information on variables and matching methods and Appendix K for results.

Text version - Figure 11
| Reference period | At certification year | 3 years after certification |
|---|---|---|
| Recipients | $65,100 | $75,100 |
| Non-recipients | $63,050 | $69,300 |
- Source: Analyses conducted by the Evaluation Directorate, ESDC (2024). AG administrative data linked to the RAIS, CAL and T1FF data.
- Note: All values are expressed in 2020 constant dollars.
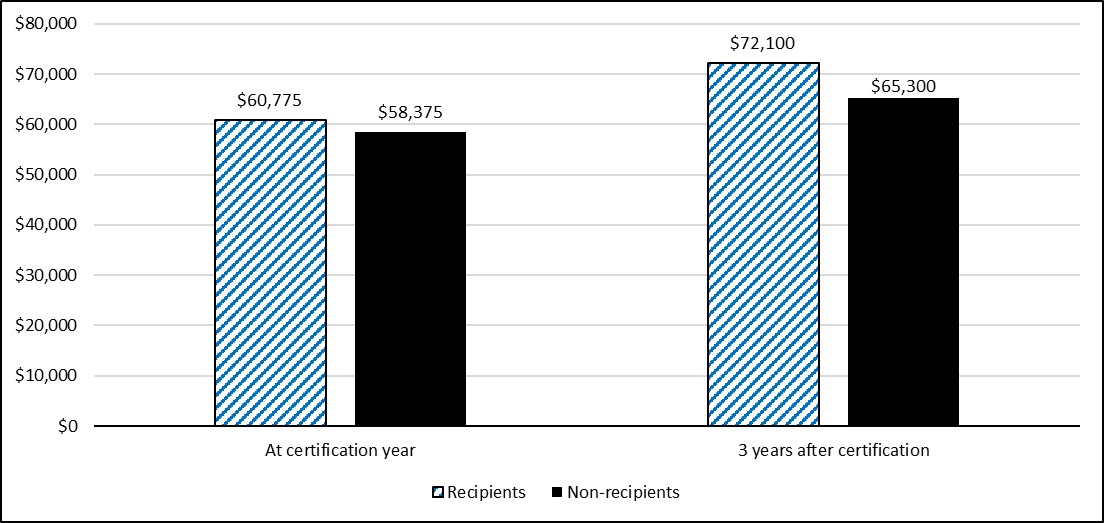
Text version - Figure 12
| Reference period | At certification year | 3 years after certification |
|---|---|---|
| Recipients | $60,775 | $72,100 |
| Non-recipients | $58,375 | $65,300 |
- Source: Analyses conducted by the Evaluation Directorate, ESDC (2024). AG administrative data linked to the RAIS, CAL and T1FF data.
- Note: All values are expressed in 2020 constant dollars.
AG recipients have higher employment incomes than non-recipients 1 year and 3 years after the expected program duration, regardless of certification. Consult Figure 13 and Figure 14.
Employment incomes of apprentices who benefited from AG at least once during their training (treated group) were compared with non-recipients who shared similar observable characteristics (comparison group), if certification is not considered.Footnote 43
The average difference in employment income (when combining the 2008 to 2011 cohorts), 1 year after expected program duration, is $9,745. The difference increases to $9,903 after 3 years.
As mentioned previously, observed differences between grant recipients and non-recipients are correlational in nature and should be interpreted carefully.

Text version - Figure 13
| Cohorts | 2008 | 2009 | 2010 | 2011 | Combined cohorts |
|---|---|---|---|---|---|
| Predicted employment income gap | $13,190 | $9,354 | $8,930 | $6,372 | $9,745 |
- ***Significant at the 1% confidence level. **Significant at the 5% confidence level. *Significant at the 10% confidence level.
- Source: Analyses conducted by the Evaluation Directorate, ESDC (2024). AG administrative data linked to the RAIS, CAL and T1FF data.
- Note: All values are expressed in 2020 constant dollars.
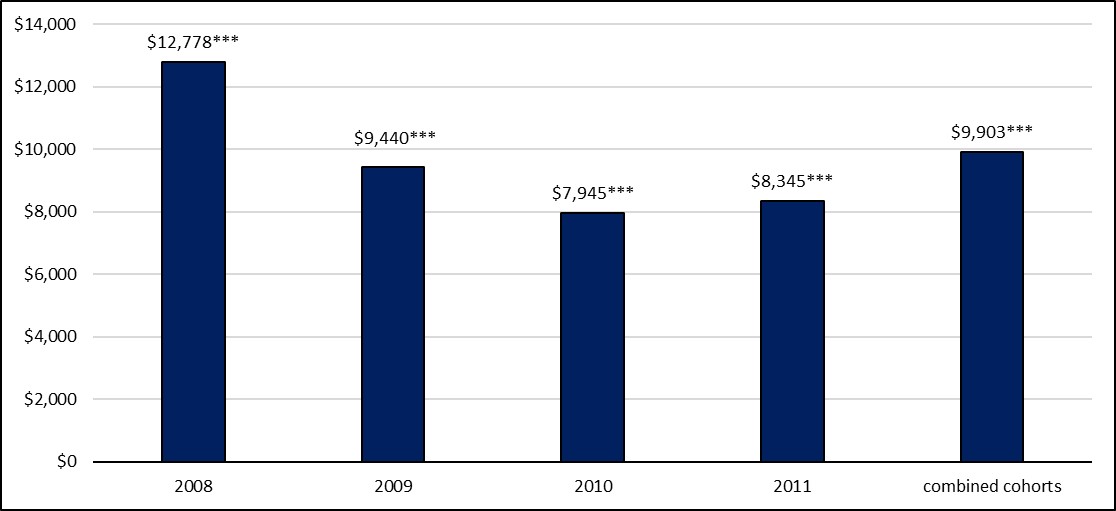
Text version - Figure 14
| Cohorts | 2008 | 2009 | 2010 | 2011 | Combined cohorts |
|---|---|---|---|---|---|
| Predicted employment income gap | $12,778 | $9,440 | $7,945 | $8,345 | $9,903 |
- ***Significant at the 1% confidence level. **Significant at the 5% confidence level. *Significant at the 10% confidence level.
- Source: Analyses conducted by the Evaluation Directorate, ESDC (2024). AG administrative data linked to the RAIS, CAL and T1FF data.
- Note: All values are expressed in 2020 constant dollars.
Post-apprenticeship employment income of male AG recipients is much higher than that of females
A Statistics Canada study in 2019 found that women with apprenticeship certification earned less than their male counterparts. They also earned less than any other women except for those who failed to complete high school.Footnote 44
In their certification year, male AG recipients' average and median employment incomes are significantly higher than those of females. Consult Figure 15.
The average employment income of women in all trades is just 46% of males' income. Figures 17 and 18 show that much of this discrepancy is due to women's overrepresentation in lower paid trades.
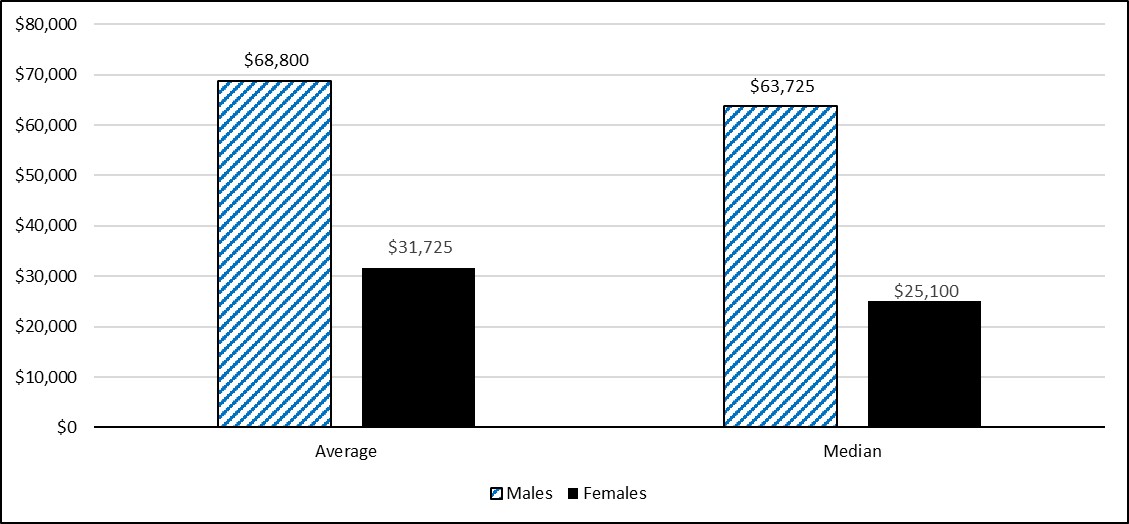
Text version - Figure 15
| Gender | Males | Females |
|---|---|---|
| Average employment income | $68,800 | $31,725 |
| Median employment income | $63,725 | $25,100 |
- Source: Analyses conducted by the Evaluation Directorate, ESDC (2024). AG administrative data linked to the RAIS, CAL and T1FF data.
- Note: All values are expressed in 2020 constant dollars.
Three years after their certification, men's average employment income increased by 8.25%, from $68,800 to $74,475. However, women's average employment income decreased slightly.
The median employment income grew more quickly among men, at 10.25% compared to just under 4% among women. Consult Figure 16.

Text version - Figure 16
| Gender | Males | Females |
|---|---|---|
| Average employment income | $74,375 | $31,600 |
| Median employment income | $70,575 | $26,025 |
- Source: Analyses conducted by the Evaluation Directorate, ESDC (2024). AG administrative data linked to the RAIS, CAL and T1FF data.
- Note: All values are expressed in 2020 constant dollars.
Finnie, Dubois, and Miyairi (2021) report that even in higher-paying trades, women still earned less than men. In architectural and construction trades, they earned 78% of what men did; in electrical trades, 85%; in Mechanical trades, 89%. These disparities may result from differences in hours worked, perhaps due to childcare responsibilities which women more often assume.
The Red Seal trades with the highest proportions of women have the lowest employment incomes 3 years after certification.Footnote 45 Consult Figures 17 and 18.
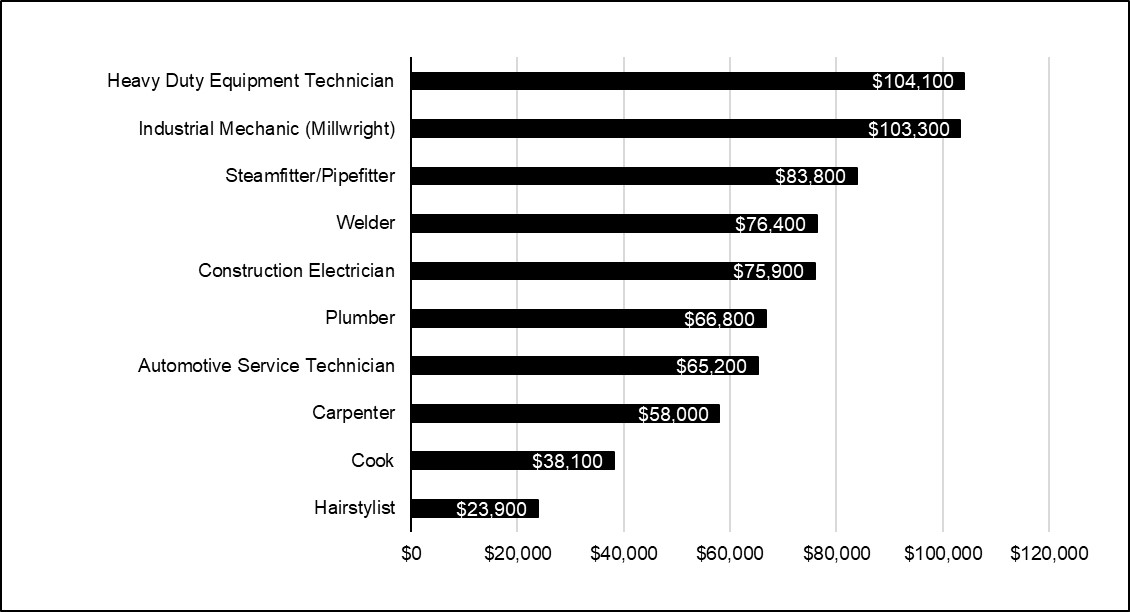
Text version - Figure 17
| Trades | Average employment income |
|---|---|
| Hairstylist | $23,900 |
| Cook | $38,100 |
| Carpenter | $58,000 |
| Automotive Service Technician | $65,200 |
| Plumber | $66,800 |
| Construction Electrician | $75,900 |
| Welder | $76,400 |
| Steamfitter/Pipefitter | $83,800 |
| Industrial Mechanic (Millwright) | $103,300 |
| Heavy Duty Equipment Technician | $104,100 |
- Source: Analyses conducted by the Evaluation Directorate, ESDC (2024). AG administrative data linked to the RAIS, CAL and T1FF data.
- Note: All values are expressed in 2020 constant dollars.
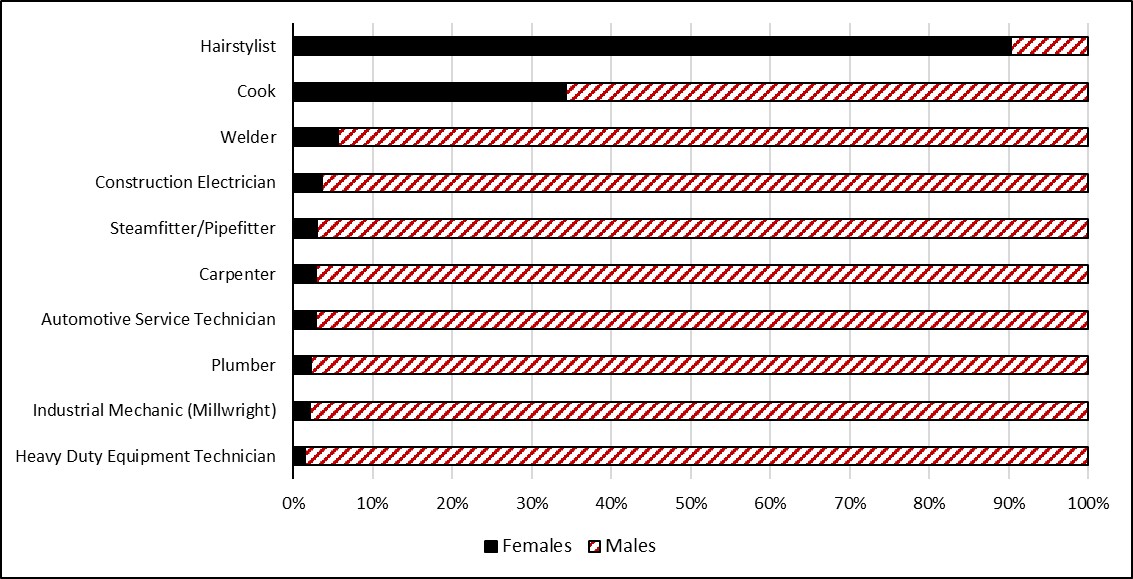
Text version - Figure 18
| Trades | Females | Males |
|---|---|---|
| Heavy Duty Equipment Technician | 2% | 98% |
| Industrial Mechanic (Millwright) | 2% | 98% |
| Plumber | 2% | 98% |
| Automotive Service Technician | 3% | 97% |
| Carpenter | 3% | 97% |
| Steamfitter/Pipefitter | 3% | 97% |
| Construction Electrician | 4% | 96% |
| Welder | 6% | 94% |
| Cook | 34% | 66% |
| Hairstylist | 90% | 10% |
- Source: Analyses conducted by the Evaluation Directorate, ESDC (2024). AG administrative data linked to the RAIS, CAL and T1FF data.
- Note: All values are expressed in 2020 constant dollars.
Women who received the AIG-W are more likely to work full time than those who did not
Among SRDC survey respondents, a higher proportion of AIG-W recipients (96%) worked full time than women who did not receive the AIG-W (83%). Consult Figure 19.
The number of working hours in male-dominated trades is higher than in female-dominated trades, for both men and women.Footnote 46
The results in Figure 19 are based on bivariate analysis using Independent Sample t-test.
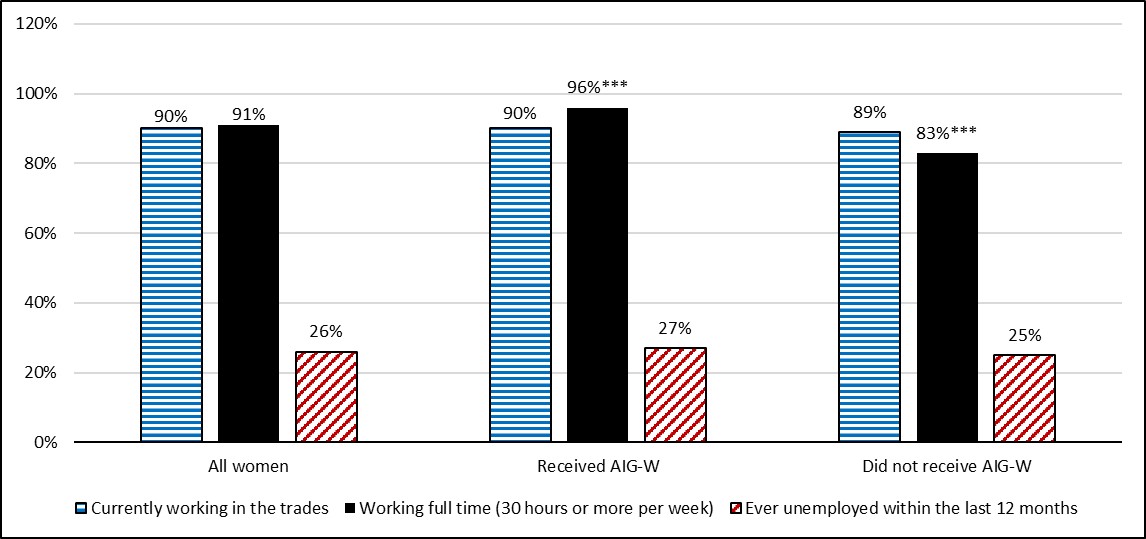
Text version - Figure 19
| Employment situation | All women | Received AIG-W | Did not receive AIG-W |
|---|---|---|---|
| Currently working in the trades | 90% | 90% | 89% |
| Working full time (30 hours or more per week) | 91% | 96% | 83% |
| Ever unemployed within the last 12 months | 26% | 27% | 25% |
- ***Significant at the 1% confidence level. **Significant at the 5% confidence level. *Significant at the 10% confidence level.
- Source: SRDC (2024) National survey of AG recipients, conducted for ESDC’s Evaluation Directorate. Unpublished technical report.
People with certain identity factors experience careers in the skilled trades differently
Visible minorities, Black Canadians, Indigenous peoples, and people with disabilities have various experiences with apprenticeship.
Visible minorities
Visible minorities, according to the 2016 census, made up:
- 22% of the Canadian population
- 22% of the labour force
- 8.2% of apprentices
Visible minorities have received 7.3% of the AG awarded since inception, though that number rose to 10.8% in 2020 to 2021.Footnote 47
Black Canadians
A 2021 ESDC study found that Black Canadians participate in skilled trades and apprenticeship about as much as other Canadians. Those who are immigrants "are twice as likely to hold an apprenticeship or trades certificate" as non-immigrant Black Canadians.Footnote 48
Black Canadians earn less, on average, than tradespeople from the general population in all but 5 occupational groups.Footnote 49
- Nearly a quarter of all Black Canadian trades workers are in the lower-paying Cook tradeFootnote 50
- Lower incomes can result from Black tradespeople working fewer hours on average. Such discrepancies may also result from "systemic forms of inequality, such as being denied overtime and opportunities for advancement"Footnote 51
Indigenous peoples
In 2016, Indigenous peoples accounted for:
- 5% of the total Canadian population
- 4% of the labour force
- 6% of apprenticesFootnote 52
Indigenous people have received 4% of the AG awarded since program inception.Footnote 53
The "percentage of Aboriginal men [aged 25 to 64] with an apprenticeship in the trades grew from 6.8% to 9.6%" between 2006 and 2016.Footnote 54
Interest in trades careers among Indigenous youth appears to be relatively strong. According to a 2018 Canadian survey on Youth Attitudes Toward the Trades, 12% of Indigenous students planned to pursue trades careers, compared to 7% of non-Indigenous students.Footnote 55
People with disabilities
People with disabilities are less likely to undertake apprenticeship.
Of apprentices responding to Statistics Canada's 2015 National Apprentice Survey, 8% reported a disability.
A higher percentage of apprentices who discontinued had a disability (4%) at the start of their programs and still had a disability at the time of the survey, compared to completers with a disability (2%).Footnote 56
People with disabilities were the least likely to say that the grants help to cover the costs associated with their apprenticeship.Footnote 57
Apprentices with disabilities have received 0.9% of the AG issued.Footnote 58
Component 2: Formative evaluation of the AIG-W
Influence of the AIG-W on women's apprenticeship
More women are now choosing male-dominated Red Seal trades. There are likely multiple causes for the increase.
Women's new registrations in male-dominated trades and AG take-up both increased after introduction of the AIG-W
The AIG-W's introduction in 2018 appears to have accelerated an increase in the number and proportion of women registering in male-dominated Red Seal trades observed since 2010. Consult Figure 20.Footnote 59
A considerable drop in new registrations in 2020 most likely relates to the pandemic. Despite this decline, the proportion of new registrations has remained on the rise since the introduction of the AIG-W.
Qualitative sources (literature review, KII, and focus groups) indicate, however, that the AIG-W had little influence on women's career choices. These sources suggest that most apprentices learned about the grant after having chosen their trade.
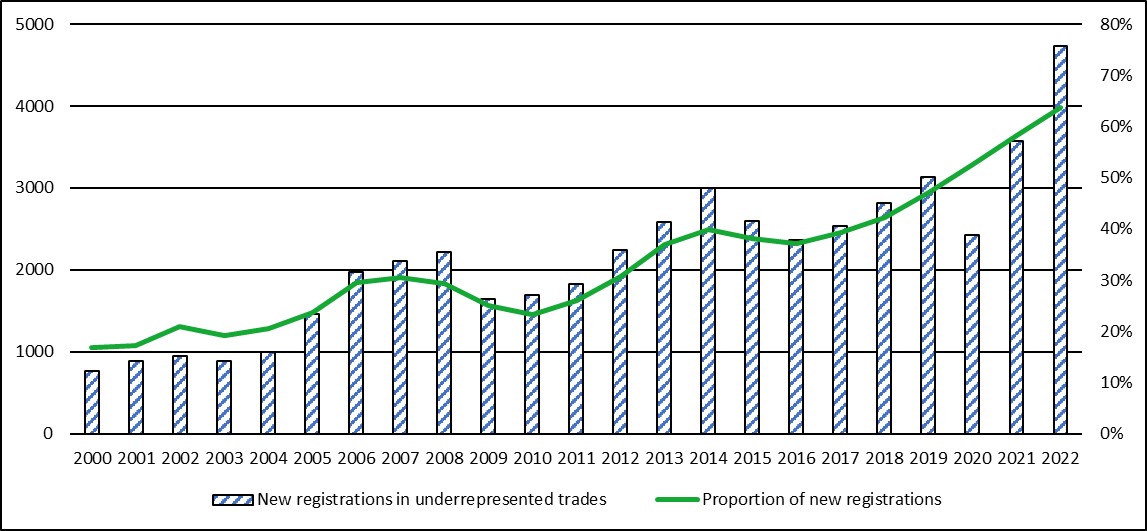
Text version - Figure 20
| Year | New registrations in under-represented trades | Proportion of new registrations |
|---|---|---|
| 2000 | 770 | 16.87% |
| 2001 | 885 | 17.27% |
| 2002 | 950 | 20.90% |
| 2003 | 890 | 19.22% |
| 2004 | 995 | 20.49% |
| 2005 | 1465 | 23.65% |
| 2006 | 1970 | 29.56% |
| 2007 | 2105 | 30.57% |
| 2008 | 2217 | 29.29% |
| 2009 | 1644 | 25.13% |
| 2010 | 1689 | 23.27% |
| 2011 | 1824 | 25.93% |
| 2012 | 2247 | 30.70% |
| 2013 | 2586 | 37.00% |
| 2014 | 3003 | 39.93% |
| 2015 | 2592 | 38.06% |
| 2016 | 2364 | 37.22% |
| 2017 | 2538 | 39.26% |
| 2018 | 2811 | 42.13% |
| 2019 | 3132 | 47.18% |
| 2020 | 2421 | 52.54% |
| 2021 | 3570 | 58.22% |
| 2022 | 4734 | 63.65% |
Source: graph prepared by the Evaluation Directorate using AG Program files and RAIS data collected by Statistics Canada.
AG take-up among women had been relatively stable since the 2012 to 2013 fiscal year.
After the AIG-W was introduced in 2018, the proportion of women in male-dominated trades accelerated.
After the pandemic, participation rates began to grow again, reaching pre-pandemic levels before following a slight downward trend.
The introduction of the AIG-W may have contributed to the increase in women's participation in the AG Program.
Text version - Figure 21
| Fiscal year | AG take-up rate |
|---|---|
| 2012 to 2013 | 60.2% |
| 2013 to 2014 | 58.2% |
| 2014 to 2015 | 59.4% |
| 2015 to 2016 | 60.3% |
| 2016 to 2017 | 63.6% |
| 2017 to 2018 | 61.5% |
| 2018 to 2019 | 67.2% |
| 2019 to 2020 | 78.3% |
| 2020 to 2021 | 47.8% |
| 2021 to 2022 | 80.2% |
| 2022 to 2023 | 74.0% |
Source: graph prepared by the Evaluation Directorate using AG Program files and RAIS data collected by Statistics Canada.
Apprentices typically learned about the AIG-W after choosing to enter apprenticeship in a specific trade
The SRDC survey conducted for this evaluation showed that most AIG-W applicants first heard about the grant after registering as an apprentice (Figure 22):
- about 41% heard about it after starting Level 1, and another 19% after finishing Level 1
- only 21% first heard about it when registering
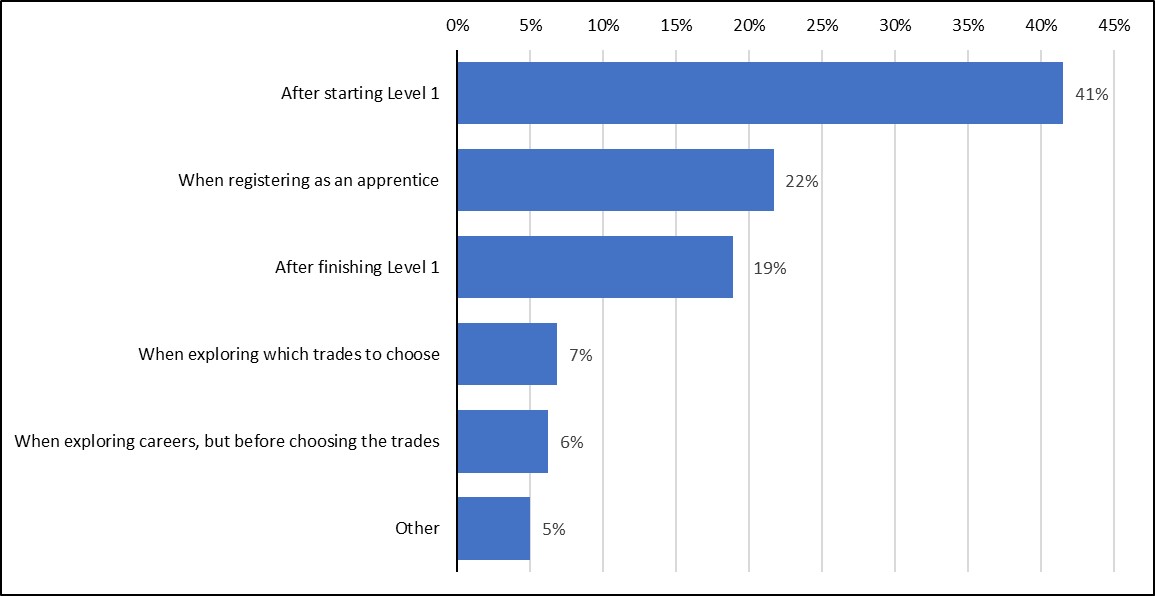
Text version - Figure 22
| When AIG-W applicants first heard about the grant | Proportion |
|---|---|
| After starting Level 1 | 41% |
| When registering as an apprentice | 22% |
| After finishing Level 1 | 19% |
| When exploring which trades to choose | 7% |
| When exploring careers, but before choosing the trades | 6% |
| Other | 5% |
Source: SRDC (2024), National survey of AG recipients, conducted for ESDC’s Evaluation Directorate. Unpublished technical report.
A majority of KII indicated that apprentices were generally aware of the AIG-W (26 of 36, or 72%). Informants often indicated that apprentices typically learned about the AIG-W after choosing to enter the skilled trades, either:
- when they were first employed or when they first registered as an apprentice (11 of 40 interviews, or 28%)Footnote 60
- during or at the start of their technical training (9 interviews, or 23%)
- before starting apprenticeship (9 interviews, or 23%). Four of these interviews indicated that apprentices learned about the grant either in pre-apprenticeship programs or when connecting with an organization supporting women apprentices
- after completing a level of technical training (7 interviews, or 18%)
By comparison, most focus group participants (36 of 45, or 80%) first learned about the AG after starting their apprenticeship, either:
- when attending trade school (21 of 45, or 47%)
- when they were hired as apprentices or during on-the-job training (15 of 45, or 33%)
A few learned about the AG before starting their apprenticeship but after having decided on a career in their specific trades (9 of 45, or 20%).
Women apprentices learned about the AIG-W through a variety of means
KII participants indicated that apprentices learned about the grant through a variety of means (Figure 23). Most often mentioned were:
- technical training institutions or courses, noted in 17 of 41 interviews (41%)
- provincial or territorial sources (15 interviews, or 37%), including attestation letters, government websites, and apprenticeship authorities
- mentorship groups and organizations supporting women apprentices (11 interviews, or 27%)
- websites or social media (11 interviews, or 27%)
- unions (5 interviews, or 12%)
- word of mouth (5 interviews, or 12%)
- pre-apprenticeship programs, trades sampler courses, and programs supporting women (3 interviews, or 7%)
- federal government advertising (2 interviews, or 5%)
- newsletters, email or text messaging to members of unions or organizations supporting women (2 interviews, or 5%)
- secondary school guidance counsellors (2 interviews, or 5%)
SRDC survey respondents who received the AIG-W also reported various means by which they heard about the grant (Figure 23):
- more than half (56%) learned about the AIG-W from their college or training institution
- about 1 in 4 (24%) heard about it from a co-worker
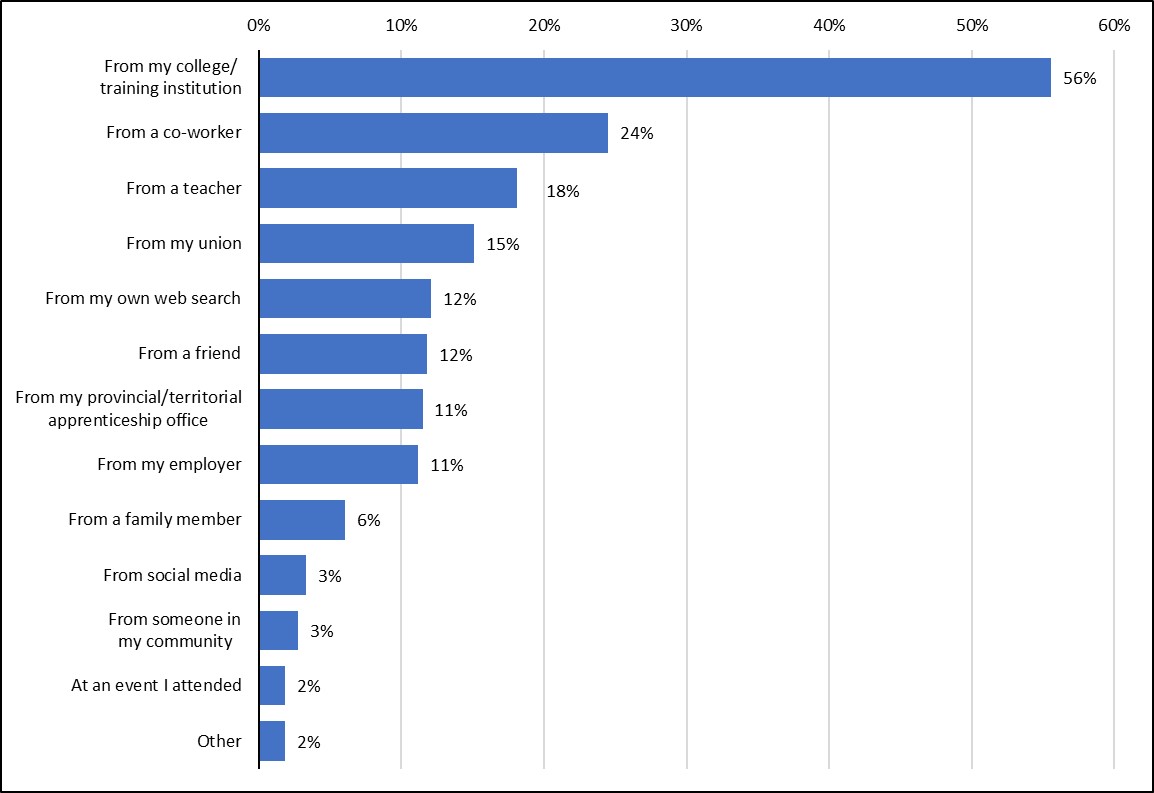
Text version - Figure 23
| How AIG-W applicants first heard about the grant | Proportion |
|---|---|
| From my college/training institution | 56% |
| From a co-worker | 24% |
| From a teacher | 18% |
| From my union | 15% |
| From my own web search | 12% |
| From a friend | 12% |
| From my provincial/territorial apprenticeship office | 11% |
| From my employer | 11% |
| From a family member | 6% |
| From social media | 3% |
| From someone in my community | 3% |
| At an event I attended | 2% |
| Other | 2% |
Source: SRDC (2024), National survey of AG recipients, conducted for ESDC’s Evaluation Directorate. Unpublished technical report.
Some groups of women may have been less likely to know about the AIG-W
KII and focus group participants suggested that some groups of women were less likely to be aware of the AIG-W:
- women who were not associated with an organization supporting women apprentices, or those who lacked mentorship or supportive employers, instructors, and colleagues would have been less likely to be informed about the AIG-W (3 of 39 interviews, or 8%)
- apprentices who were not associated with unions or colleges (4 interviews, or 10%, and 5 focus group participants)
- those who were no longer in the school system and did not use employment services or related online resources such as Job Bank (8 focus group participants)
- immigrants, newcomers, refugees, or temporary work permit holders (3 interviews, or 8%, and 4 focus group participants)
- racialized women or women of colour (3 interviews, or 8%). One key informant (KI) specified Indigenous women
- women living in rural or remote communities (2 interviews, or 5%, and 1 focus group participant)
- some women in Quebec trades that do not complete all technical training at the start of the apprenticeship (1 interview, or 3%, and 4 focus group participants)
Three interviews (all from the same group) suggested that there were no groups less likely to be aware. One KI explained that the province notified everyone who was eligible.
Some KII and focus group participants had mixed views about awareness of the AG
Three of the 5 female KII participants who received the AIG-W agreed that awareness of the grant was low among their peers:
- 1 stated that the grant was not discussed during technical training because "it only applies to 1 person" in the class
- another said that "all women in male-dominated fields" were less likely to be aware of the program: "I don't know how you make people aware when ... it's such a minority group.... The word of mouth doesn't get you very far when there's no one else to talk to"
- a fourth KI stated that she did not know enough other women in the trades to be able to answer the question
One KII participant disagreed with this consensus. She was told about the AIG-W during technical training, and "all of my classmates, male and female, we all knew about the grant." She was surprised by her few classmates who were unaware, since "you'd have to be not paying attention when people are speaking about essentially free money."
AIG-W recipients who took part in focus groups also provided mixed responses:
- 1 said that when she first heard about the grants in trade school, her male classmates were also aware of it
- another noted that grants were not really discussed at her workplace and were not well-known among male or female apprentices. She first learned about the AIG-W through a Facebook group for women in construction
The AIG-W may have influenced women to persist with, rather than to enter, apprenticeship
Various sources in the literature suggest that the grants have little influence over decisions about participation in apprenticeship.
Many KII participants said that the AIG-W did not influence women to start an apprenticeship in a male-dominated trade (15 of 39 interviews, or 38%). A number of informants clearly stated this belief:
- "I don't think it influenced them at all ... [they] certainly are not going to ... make a career decision over a few thousand dollars"
- "not at all ... because you're giving an incentive grant to somebody who's already made the decision to go"
- "the money's not enough to change behaviour"
All 5 women apprentices who participated in KII agreed that the AIG-W had no influence on their decision to apprentice in a male-dominated trade. Three of them said that they had already begun their apprenticeship before they learned of the grant.
Similarly, none of the 55 focus group participants (all grant recipients) mentioned that the AG influenced their decision to undertake an apprenticeship.
A few (5) focus group participants (AIG-W recipients) indicated that the AIG-W encouraged some who were already considering a career in a male-dominated trade to start their apprenticeship, because:
- they knew the grant money would help compensate for lost income during technical training
- the grant signaled that women were "wanted" in the trade
One explained that "I wanted to apprentice regardless, but it definitely helped because I have a young daughter and financially, it was going to be very difficult for me."
Only 2 KII participants (5%; both in the group representing employers) believed that the grant did in fact influence women's decisions to undertake and continue apprenticeships in male-dominated trades. The women they believed to be influenced were those facing financial hardships, especially single mothers.
Six interviews (15%) indicated that the grant had some influence on women's decisions to apprentice in eligible trades. According to these informants, apprentices knew that it could:
- compensate for their time off work in technical training
- defray work-related expenses
- be used to pay off loans
One informant suggested that it might help steer women into an eligible trade rather than a non-eligible one.
Other factors influenced women to enter apprenticeship in a male-dominated trade
When we asked if other factors influenced women's decisions to apprentice in male-dominated trades, more than half of KII participants (17 of 32 interviews, or 53%) discussed material considerations, including:
- attractive pay and benefits or stable income (15 interviews, or 47%)
- ample job opportunities or job security (14 interviews, or 44%)
- good working conditions (5 interviews, or 14%)
Key informants also mentioned these influences:
- family or friends (8 of 32 interviews, or 25%)
- intrinsic interest in the chosen trade or enjoyment of "hands-on" work (6 interviews, or 19%)
- role models and mentors (5 interviews, or 14%)
- financial incentives such as grants or band funding (4 interviews, or 13%)
- trades exploration programs (4 interviews, or 13%). When we asked specifically about financial supports or programs that may have influenced women apprentices, many more mentioned these programs (16 of 38 interviews, or 42%)
- the more attractive cost-benefit relationship of an apprenticeship compared to a university program (3 of 32 interviews, or 9%)
- a desire to break gender norms (2 interviews, or 6%)
- equality of pay in unionized shops (2 interviews, or 6%)
- organizations supporting women in trades (2 interviews, or 6%)
Most AIG-W recipients who participated in focus groups (27 of 30) elaborated on the influences upon their decision to apprentice in a male-dominated trade.Footnote 61 They mentioned:
- an interest in the nature of the trade or preferring manual work (21)
- material benefits such as good pay and steady employment (8)
Important influences on women's decisions to enter apprenticeship, noted in the literature, include:
- early education about traditionally male-dominated trades
- female role models
- family and friends
For girls, parental influence regarding careers in the trades is often negative. According to a 2018 survey of Canadian students:
- 40% of girls reported that their parents do not want them to pursue trades careers, as opposed to 34% of boys
- only 13% of girls reported being encouraged by their parents to pursue a career in the trades compared to 31% of boys
- only 12% of girls (and 29% of boys) were willing to consider a trades career
- only 2% of girls (and 14% of boys) were planning to pursue a trades careerFootnote 62
Most AIG-W recipients participating in focus groups (27 of 30) discussed factors influencing their decision to enter apprenticeship in a male-dominated trade. Most (23) chose their trade later in life, after exploring post-secondary education or other careers, because of factors like:
- job loss, spousal separation, or work-related injury
- a desire for better working conditions, more job stability, hands-on work, or a change of environment
These 23 AIG-W recipients discovered trade opportunities through various means such as:
- random career exploration
- online research
- unexpected job opportunities (for example, temporary jobs turning into a career)
- networking or word of mouth
A few (4) chose their trade during or shortly after high school. They were influenced by their own interests or aptitudes. All 4 were supported by programs that facilitated trades exploration.
AIG-W's contribution to progression
Women confront certain financial and non-financial barriers to apprenticeship more than men. The AIG-W helped women overcome some of the financial barriers.
Survey respondents identified a variety of barriers to starting an apprenticeship for female apprentices
SRDC survey respondents indicated a variety of barriers to apprenticeship that women face (Figure 24).
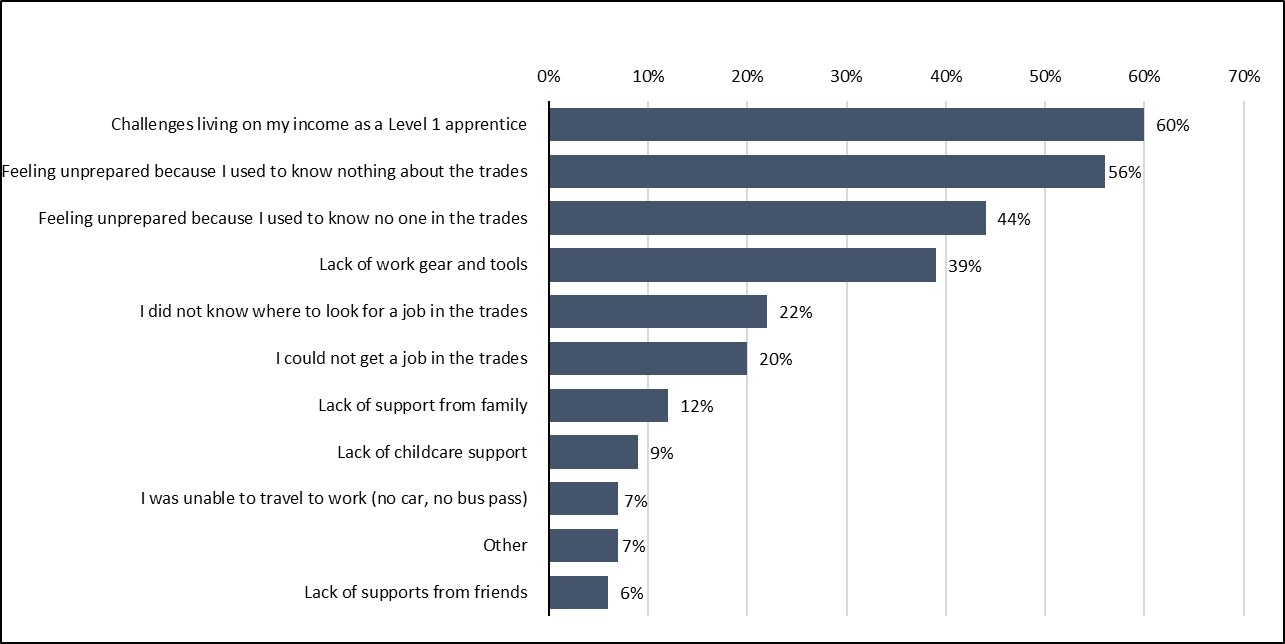
Text version - Figure 24
| Types of barriers | Proportion |
|---|---|
| Challenges living on my income as a Level 1 apprentice | 60% |
| Feeling unprepared because I used to know nothing about the trades | 56% |
| Feeling unprepared because I used to know no one in the trades | 44% |
| Lack of work gear and tools | 39% |
| I did not know where to look for a job in the trades | 22% |
| I could not get a job in the trades | 20% |
| Lack of support from family | 12% |
| Lack of childcare support | 9% |
| I was unable to travel to work (no car, no bus pass) | 7% |
| Other | 7% |
| Lack of support from friends | 6% |
Source: SRDC (2024), National survey of AG recipients, conducted for ESDC’s Evaluation Directorate. Unpublished technical report.
As shown in Figure 24, a majority (60%) of AIG-W recipients cited challenges living on their income as Level 1 apprentices. AIG-W recipients also faced other financial challenges (Figure 25):
- 46% continued to find it either "very much" or "completely" challenging to pay for living expenses while in block training
- 38% found it either "very much" or "completely" challenging to live on their income as an apprentice
- a lower proportion (24%) found it either "very much" or "completely" challenging to pay for their apprenticeship in general
Text version - Figure 25
| Challenge | Not at all | Slightly | Somewhat | Very much | Completely |
|---|---|---|---|---|---|
| To live on my income as an apprentice | 7% | 25% | 29% | 24% | 14% |
| To pay for living expenses while in block training | 6% | 16% | 31% | 28% | 18% |
| To pay for my apprenticeship in general | 22% | 28% | 27% | 15% | 9% |
Source: SRDC (2024), National survey of AG recipients, conducted for ESDC’s Evaluation Directorate. Unpublished technical report.
Female apprentices confront a variety of barriers to progression
SRDC survey respondents (all AIG-W recipients) identified a variety of barriers to progression that female apprentices face (Figure 26):
- challenges living on their income as an apprentice (44%)
- feeling like they were being "pigeon-holed" into simple tasks on the job (33%)
- recruitment and hiring bias against people like them (30%)
- lack of role models and mentors (27%)
- not knowing who to talk to when they experience issues at work (27%)
- unsupportive supervisors (26%)
- bullying and harassment at work (26 per cent)
Text version - Figure 26
| Barriers to progress in their apprenticeship | Proportion |
|---|---|
| Challenges living on my income as an apprentice | 44% |
| Feeling like I'm being ‘pigeon-holed' into simple tasks | 33% |
| Recruitment and hiring bias against people like me | 30% |
| Lack of role models and mentors | 27% |
| Not knowing who to talk to when I experience issues at work | 27% |
| Unsupportive supervisors | 26% |
| Bullying and harassment at work | 26% |
| Unsupportive co-workers | 21% |
| Lack of networking opportunities | 13% |
| Other | 3% |
Source: SRDC (2024), National survey of AG recipients, conducted for ESDC’s Evaluation Directorate. Unpublished technical report.
Unwelcoming workplaces are a major barrier to progression for female apprentices
KII participants identified barriers to progression that AIG-W recipients continued to face, and reasons why women leave the skilled trades.
A very large majority of interviews (34 of 40, or 85%) cited unwelcoming or hostile workplaces as a major barrier. Informants explained that these work environments are characterized by:
- bullying
- discrimination
- misogyny
- sexual harassment
- hazing of new workers
- social exclusion (which leaves women feeling isolated)
Women also encountered journeypersons who were unsupportive or unwilling to train them.
One informant illustrated the discouragement she received from her employer and colleagues, such as being told that she should just quit: "a lot of the shops, when women come in, they just don't make it. Like … they want to see them fail…. They won't train them properly. They won't give them the time of day."
Women reported problems standing up to harassment on the job. One informant explained that "if, for instance, you take a guy to HR, you will be known as the girl who took someone to HR and caused an issue, and you're expected to turn around and have these men train you.… Once you have that reputation, no man's [going to want to] work with you. They're going to be afraid of being taken to HR [for] saying something out of turn as well. So you label yourself and you paint yourself into a box."
According to 2 informants, financial incentives do not compensate for these problems with workplace culture.
In a 2018 conference, female apprentices and trades workers identified "stereotypes and unwelcoming workplaces" as "the biggest barriers women experience" in pursuing careers in the trades.Footnote 63 They advocated a zero-tolerance response to bad behaviours like bullying and sexual harassment, the latter being a key reason why women leave jobs in the trades.Footnote 64
Close to half of the AIG-W recipients who took part in focus groups (14 of 30) reported facing negative attitudes towards women in male-dominated trades. For example:
- having their skills questioned (6)
- lack of respect from male peers (1). "In body shops, men don't respect you, so it's kind of just hard to earn [their] respect. It takes a while. Sometimes it doesn't happen at all."
- inappropriate or offensive comments (mentioned by 4 AIG-W recipients)
- sexual harassment at work (1)
Female apprentices face other barriers to progression
Other barriers that KII and focus group participants discussed:
- family responsibilities related to childcare or family planning. KII and focus group participants emphasized that irregular hours in construction make it difficult to secure childcare. Over half of KII (22 interviews, or 55%) plus 10 focus group participants (8 AIG-W recipients, and 2 female regular AIG recipients) discussed this issue
- over half of KII participants indicated that the absence of accommodation for childcare responsibilities is a barrier to progression or causes women to discontinue apprenticeship (22 of 40 interviews, or 55%)
- 1 focus group participant explained that her employer allows her to start working later so she can take her children to daycare in the morning. She stated that few employers are willing to adjust schedules. She also mentioned that such accommodations can create tensions with co-workers
- difficulty finding employers who are willing to hire women, finding steady work, or finding a journeyperson to train them. Fifteen interviews, or 38%, plus 2 focus group participants (both AIG-W recipients) mentioned this problem
- problems with the quality of instruction and mentorship on the job given to female apprentices (11 interviews, or 28%). Six focus group participants also mentioned not being trained in the full range of skills needed to progress. All were AIG-W recipients
- lack of appropriate facilities like bathrooms for women (11 interviews, or 28%)
- difficulty finding personal protective equipment or tools in correct sizes (6 interviews, or 15%)
- financial issues such as low pay, loss of wages during training, or cost of necessary equipment (6 interviews, or 15%).Footnote 65 One of these KIs explained that EI was not sufficient, especially for women who earn the family's sole income and "cannot afford the reduced salary during their training"
- lack of opportunity for advancement or being passed over for promotion in favour of male colleagues (4 interviews, or 10%)
- difficulty obtaining time off to complete a training block. Two AIG-W recipients and 1 female regular AIG recipient mentioned this problem in focus groups
Female apprentices face various barriers to completing the Red Seal exam
AIG-W recipients who responded to the SRDC survey cited various challenges to completing the Red Seal exam (consult Figure 27). These included:
- test anxiety (71%)
- a lack of study materials like practice exams or quizzes (47%)
- not knowing how to prepare for the exam (44%)
- lack of time to study (32%)
- fees to write the Red Seal exam (28%)
Text version - Figure 27
| Barriers to completing an apprenticeship and writing the Red Seal exam | Proportion |
|---|---|
| Feeling anxious about exams / I don't like exams in general | 71% |
| Lack of study materials, practice exams, quizzes, etc. | 47% |
| Not knowing how to prepare for the exam | 44% |
| Lack of time to study | 32% |
| Lack of access to a tutor who can help me study | 28% |
| Fees to write the Red Seal exam | 28% |
| Lack of connections to others who are preparing for the exam like me | 18% |
| Other | 9% |
Source: SRDC (2024), National survey of AG recipients, conducted for ESDC’s Evaluation Directorate. Unpublished technical report.
The AIG-W helped women apprentices to progress in various ways
AIG-W recipients indicated, in the SRDC survey, various ways in which the grant encouraged them to continue progressing. Consult Figure 28. The grant helped them pay for:
- tools and work gear (60%)
- living expenses, such as groceries or hydro bills (57%)
- transportation, such as gas or a bus pass (52%)
More than a third said that the AIG-W provided psychological reassurance and validation in addition to concrete financial support:
- 36% said receiving the grant made them feel more confident that they could afford their apprenticeship
- 34% said it made them feel proud of their career decisions
Text version - Figure 28
| Different uses of the grant | Proportion |
|---|---|
| Helped pay for tools and work gear | 60% |
| Helped pay for other living expenses (groceries, hydro bills) | 57% |
| Helped pay for transportation (gas, bus pass) | 52% |
| Helped pay for my accommodations (rent) | 38% |
| Made me more confident that I can afford this apprenticeship | 36% |
| Made me feel proud of my career decision | 34% |
| Helped pay for books and other study materials | 28% |
| Added to my income while I attended technical training | 27% |
| Helped pay for apprenticeship registration fees | 23% |
| Helped pay for tuition fees for block training | 23% |
| Helped pay for other apprenticeship fees (administration fees, assessment fees) | 16% |
| Helped pay for childcare | 7% |
Source: SRDC (2024), National survey of AG recipients, conducted for ESDC’s Evaluation Directorate. Unpublished technical report.
KII participants observed that the AIG-W helped reduce financial barriers (8 of 39 interviews, or 21%). Another said that the grant was not large enough to influence her decision to pursue apprenticeship but it did help fill the gap in income left by EI.
In response to a separate question, informants in 40 interviews, as well as 38 focus group participants, reported that women used the grant for:
- routine living expenses like rent, groceries, gas, or bills (50% of KII and 47% of focus group participants)
- avoiding or paying off debt, including student loans (15% of KII and 8% of focus group participants)
- childcare (13% of KII and 3% of focus group participants)
- one KII participant observed that the grant permitted apprentices to manage unexpected expenses like car repairs, important for those on the low end of the pay scale
- essential tools or equipment (33% of KII and 58% of focus group participants). All 5 KII participants in the women apprentices group said that the grant helped them pay for tools or work equipment
- tuition (18% of KII and 18% of focus group participants)
- work-related travel (3% of KII and 11% of focus group participants)
- compensation for lost wages during technical training (15% of KII participants)
- personal expenses such as entertainment (13% of focus group participants)
Five (of 39) interviews stated that the grant motivated women to persist in their apprenticeship, particularly during technical training or the early stages of apprenticeship when wages are typically lower. One indicated that some women would have quit without the grant.
This notion was confirmed by another informant who explained that the grant had provided crucial financial support when she was at the lowest end of the pay scale as a new apprentice. As she stated, "I probably would have given up on the trade altogether if it hadn't been for the grant." The grant "might not seem like a lot of money in the grand scheme of life, but the money really kept me alive…. [I]t was … essential."
A few informants asserted that the grant did not have a large impact (3 of 40 interviews, or 8%).
Other factors helped AIG-W recipients continue progressing
The SRDC survey showed that mentorship and a support network of family and friends are key factors that help women in male-dominated Red Seal trades continue progressing (Figure 29):
- 41% noted that they were mentored by a co-worker or supervisor at work
- 41% indicated receiving supports from their family and friends to continue their apprenticeship
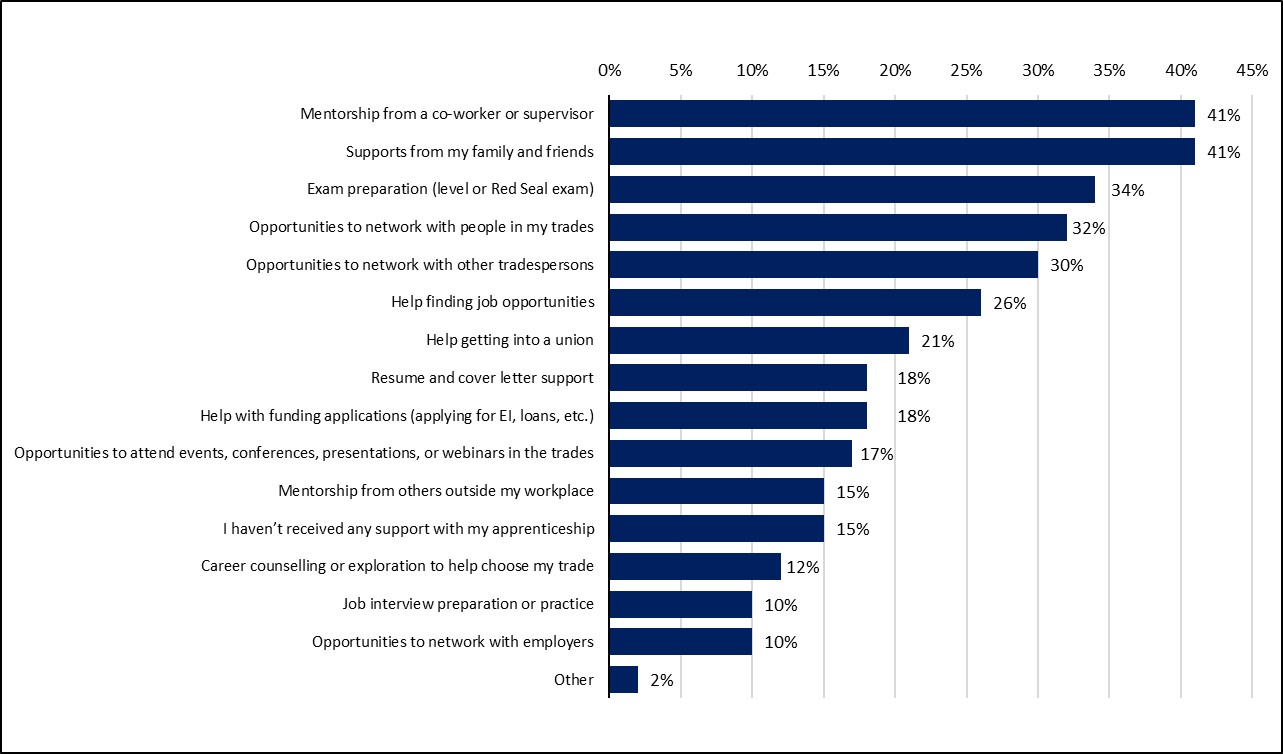
Text version - Figure 29
| Factors that helped AIG-W recipients continue progressing in male-dominated Red Seal trades | Proportion |
|---|---|
| Mentorship from a co-worker or supervisor | 41% |
| Support from my family and friends | 41% |
| Exam preparation (level or Red Seal exam) | 34% |
| Opportunities to network with people in my trades | 32% |
| Opportunities to network with other tradespersons | 30% |
| Help finding job opportunities | 26% |
| Help getting into a union | 21% |
| Resume and cover letter support | 18% |
| Help with funding applications (applying for EI, loans, etc.) | 18% |
| Opportunities to attend events, conferences, presentations, or webinars in the trades | 17% |
| Mentorship from others outside my workplace | 15% |
| I haven't received any support with my apprenticeship | 15% |
| Career counselling or exploration to help choose my trade | 12% |
| Job interview preparation or practice | 10% |
| Opportunities to network with employers | 10% |
| Other | 2% |
Source: SRDC (2024), National survey of AG recipients, conducted for ESDC’s Evaluation Directorate. Unpublished technical report.
Other factors or supports that could aid women's progression
Focus group participants (23 — both men and women) discussed other income sources they used during their apprenticeship.
More than half (14 of 23) mentioned that receiving EI benefits during training blocks helped them minimize debt or make ends meet.
A few (4) used government loans, but none mentioned using or knowing about the Canada Apprentice Loan.
Other funding sources mentioned include:
- the tax credit for tools purchases
- other government programs (for example, provincial allowances covering some training-related expenses)
- employer-provided financial support
- bank loans or credit cards
KII participants discussed various other factors and supports that could aid women's progression. They mentioned:
- mentorship, including on-the-job teaching and peer support from other tradeswomen (14 of 40 interviews, or 35%)
- programs and policies to make the workplace more welcoming by eliminating bullying, harassment, and discrimination (10 of 40 interviews, or 25%)
- financial supports to cover the pay gap during training, or to meet expenses like childcare, transportation, tools, and tuition (10 interviews, or 25%)
- non-governmental organizations that support women apprentices (10 interviews, or 25%)
- more support for childcare (9 interviews, or 23%)
Focus group participants mentioned some of the same supports:
- mentorship (6 participants from various groups)
- creating programs and policies to make the workplace more welcoming (5 AIG recipients)
- more support for childcare (3 AIG-W recipients and 1 female regular AIG recipient)
Perceptions of the AIG-W
Apprentices held different perceptions of the AIG-W.
Some male apprentices thought the AIG-W was unfair
The AIG-W was intended to encourage female apprentices to work in male-dominated trades.
A majority of KII participants reported unfavourable perceptions of the AIG-W (23 of 38 interviews, or 61%).
Nearly half (17 of 38, or 45%) mentioned men's complaints about the grant being unfair or discriminatory. Notably, in the group of women apprentices interviewed, all 5 reported that men complained about the grant.
Applications were approved based solely on the apprentice self-identifying as "female" on the application form. A few KII participants (7 of 38, or 18%) noted that some male apprentices applied as women and received the grant.Footnote 66
The AG Program recognizes that these types of sensitive questions associated with supporting equity-deserving groups are not limited to the AIG-W.
AIG-W recipients (16 women) who participated in the focus groups discussed perceptions of the grant. Most reported negative comments, reactions, or envy from male peers who thought it was unfair (13 of 16). A few (3) reported that attempts to explain the grant's purpose to male peers had little influence on their attitudes.
Two participants noted that negative perceptions of the AIG-W are amplified in Quebec. They stated that provincial measures benefiting female apprentices already created jealousy among tradesmen.
A few AIG-W recipients were upset that some male apprentices were able to receive the grant. All 3 participants believe, nonetheless, that the AIG-W should be reinstated.
Some non-eligible apprentices (men and women) thought the AIG-W was unfair
The SRDC survey asked a series of questions to gauge how non-eligible apprentices perceived the AIG-W (consult Figure 30). Male apprentices and female apprentices in non-male-dominated Red Seal trades were not eligible for the grant. Among non-eligible apprentices who responded to the survey:
- only a minority agreed (22%) or strongly agreed (17%) that the AIG-W is fair
- over half agreed (34%) or strongly agreed (19%) that the AIG-W can help diversify the trades workforce
- a majority either agreed or strongly agreed that the AIG-W is helpful for women in some trades (64%) or for women in all trades (60%)
Text version - Figure 30
| Questions | Strongly disagree | Disagree | Neutral | Agree | Strongly agree |
|---|---|---|---|---|---|
| The AIG-W is fair | 24% | 18% | 20% | 22% | 17% |
| The AIG-W is helpful for women in some trades | 9% | 5% | 21% | 39% | 25% |
| The AIG-W is helpful for women in all trades | 11% | 7% | 22% | 36% | 24% |
| The AIG-W is helpful for everyone in the trades | 24% | 20% | 23% | 18% | 14% |
| The AIG-W can help to diversify the trades workforce | 14% | 10% | 22% | 34% | 19% |
Source: SRDC (2024), National survey of AG recipients, conducted for ESDC’s Evaluation Directorate. Unpublished technical report.
Some non-eligible female apprentices also thought the AIG-W was unfair
Key informant interviews indicated that some non-eligible women, such as hairstylists, wondered why they were excluded or felt that their exclusion was unfair (5 of 38 interviews, or 13%). Some women felt that being excluded "devalued their jobs." Some 3rd and 4th year female apprentices in eligible trades felt that the AIG-W was not fair because it only applied to the first 2 years, and they did not receive it.
Similar feedback was obtained from a few female AIG recipients who took part in focus groups. One expressed frustration about being excluded from the AIG-W because:
- women in excluded trades also have financial struggles
- being excluded devalued their trades
- her trade (parts technician) is "mostly male-dominated," she is the only woman doing this job in her company, and it is "very rare" to find other women doing the same job
Two cooks noted that, while their trade was not considered male-dominated under the AIG-W, there are still power imbalances that leave women at a disadvantage.
The SRDC survey also captured perceptions of the AIG-W from non-eligible women (Figure 31):
- when responses are combined, 17% disagree or strongly disagree that the AIG-W is fair
- 18% are neutral
Text version - Figure 31
| Questions | Strongly disagree | Disagree | Neutral | Agree | Strongly agree |
|---|---|---|---|---|---|
| The AIG-W is fair | 9% | 8% | 18% | 27% | 38% |
| The AIG-W is helpful for women in some trades | 4% | 3% | 14% | 36% | 44% |
| The AIG-W is helpful for women in all trades | 21% | 13% | 14% | 19% | 33% |
| The AIG-W is helpful for everyone in the trades | 13% | 18% | 26% | 21% | 21% |
| The AIG-W can help to diversify the trades workforce | 7% | 5% | 17% | 32% | 40% |
Source: SRDC (2024), National survey of AG recipients, conducted for ESDC’s Evaluation Directorate. Unpublished technical report.
Some non-eligible apprentices (men and women) had positive views of the AIG-W
A few (3) AIG-W recipients in focus groups noted that some men understood the grant's rationale and even supported the higher grant amount for women.
Two female focus group participants who obtained only the regular AIG viewed the AIG-W positively. One said that she is glad other women received it and that the AIG-W should have been renewed. The other mentioned that the AIG-W could encourage recipients to persevere despite the challenges they faced as women in male-dominated trades.
All 10 male focus group participants held positive views about the AIG-W and the presence of women in trades:
- 2 men in non-male-dominated trades strongly supported the AIG-W, with one suggesting its expansion to include gender-diverse individuals
- 1 man in a male-dominated trade said that it was "fantastic" that the grant encouraged women to join the trades
A few KII participants indicated that non-eligible female apprentices had few complaints (4 of 38 interviews, or 11%).
Component 3: Impact of the COVID-19 pandemic
COVID-19 effects on the AG Program, apprentice progression, and employment
The COVID-19 pandemic negatively impacted employment and apprenticeship, but some trades were affected more seriously than others.
The pandemic negatively impacted employment and apprenticeship
There was a 30% drop in employment in Red Seal trades in the spring of 2020 due to COVID-19.Footnote 67
In nearly half of interviews (20 of 41, or 49%), KII participants commented on various ways that the pandemic interfered with the availability of work.
The pandemic caused:
- concerns about health and safety in workplaces, which kept workers at home
- port closures, which affected supply chains
- shortages of materials
- restrictions on access to equipment
Resulting in:
- delays in business operations
- shutdowns, work slowdowns, layoffs
Focus group participants (8 of 31, or 26%) similarly noted a reduction in working hours.
A few KII participants stated that the closure of job sites delayed apprentices in fulfilling their program requirements (8 of 41 interviews, or 20%).
Employment in Red Seal trades rebounded and surpassed pre-pandemic levels by December 2020.Footnote 68 General Canadian employment, by comparison, only recovered to pre-pandemic levels in September 2021, though in March 2022 the unemployment rate fell to a record low of 5.3%.Footnote 69
The pandemic's impact on trades workers varied
As Statistics Canada observed in a 2021 report, the impact of COVID restrictions on apprentices and journeypersons varied. Apprentices working in essential service sectors such as energy, utilities, and construction-related trades were less likely to have employment interrupted or their certification delayed because of pandemic-induced closures. Those in non-essential service industries were most likely to depend on the Canada Emergency Response Benefit (CERB). For example, "over 70% of journeypersons in some sectors, such as hairstylists and early childhood educators, received the CERB in 2020."Footnote 70
Almost one third of interviews explicitly recognized that the pandemic's impact on apprenticeship varied according to trade (13 of 41, or 32%). A few stated that service trades were more affected and saw a large decrease in employment (7 interviews, or 17%). Others stated that apprentices in construction trades were the least affected because they were deemed essential workers (5 interviews, or 12%).
A few informants reported that apprentices were more affected than journeypersons (3 of 41, or 7%). Two informants noted that first- and second-year apprentices were laid off more often than more advanced apprentices.
Of 17 focus group participants who discussed changes following the lifting of pandemic-related restrictions, 3 (18%) noted a decrease in demand for workers in the service industry or trades that are not male-dominated, such as hairstylists or cooks.
Application and eligibility issues
According to Statistics Canada, new apprenticeship registrations and certifications both declined in 2019 compared to 2018, continuing a trend dating back to 2014.Footnote 71
During the pandemic, new apprenticeship registrations dropped by 28.5% in 2020, compared to 2019. Certifications were down by 32.7%.Footnote 72
A significant drop in the number of AG applications coincided with the pandemic. The program was receiving over 61,000 AIG applications annually over the previous 3 fiscal years before the number dropped to under 44,000 in 2020 to 2021.
In the 2-year period from fiscal year 2019 to 2020 until 2020 to 2021:
- AIG-W applications dropped from 4,932 to 3,811
- ACG applications dropped from 28,556 to 19,274
- taken together, the total number of grant applications dropped by 29.9%Footnote 73
- the number of AG issued also declined by 36%Footnote 74
Before the pandemic, over half of all CAF survey respondents (52%) said they "experienced challenges when applying." Problems included difficulty completing paperwork or finding answers to their questions.Footnote 75
The introduction of the document upload utility to the online application process in November 2020 produced an initial increase in duplicate submissions because some apprentices could not confirm receipt of their applications. This prompted a brief increase in rejection rates.Footnote 76
A majority of KII participants agreed that the pandemic caused, or probably caused, AG intake to decline (22 of 34 interviews, or 65%). They indicated that apprentice eligibility dropped, and offered a few explanations:
- apprentices were unable to complete required technical training due to school closures, class and exam cancellations, or inability to succeed with online instruction (14 interviews, or 41%)
- apprentices were unable to work required hours of on-the-job training due to layoffs or workplace closures (7 interviews, or 21%)
- apprentices were not willing to take online instruction, leading them to delay training (3 interviews, or 9%)
- fewer apprentices registered (3 interviews)
- delays in receiving attestation letters from provincial authorities beyond apprentices' eligibility period (2 interviews, or 6%)Footnote 77
The COVID-19 pandemic contributed to lowering employment incomes of AG recipientsFootnote 78
The average and median employment income of recipients declined in 2020 due to the pandemic (Figure 32).
Average employment income decreased from $73,500 in 2019 to $69,170 in 2020. Similarly, median employment income decreased from $72,120 in 2019 to $67,570 in 2020.
Text version - Figure 32
| Years | Average employment income | Median employment income |
|---|---|---|
| 2016 | $ 69,610 | $ 67,770 |
| 2017 | $ 71,920 | $ 70,020 |
| 2018 | $ 72,640 | $ 71,240 |
| 2019 | $ 73,500 | $ 72,120 |
| 2020 | $ 69,170 | $ 67,570 |
- Source: Analyses conducted by the Evaluation Directorate, ESDC (2024). AG administrative data linked to the RAIS, CAL and T1FF data.
- Note: All values are expressed in 2020 constant dollars.
The effect of the COVID-19 pandemic on recipients' employment income in 2020 varied across the top 10 Red Seal trades
The percentage change in employment income attributable to COVID-19 in 2020 compared to 2019 (pre-pandemic period) varied by trade. Consult Figure 33.
The greatest drop in employment income was recorded in the hairstylist trade. Average and median employment income decreased by 16.42% and 29.28%, respectively, compared to 2019.
On the other hand, the Industrial Mechanic (Millwright) trade was the least affected, with a drop in average and median employment income of 2.27% and 1.58%, respectively.
Trades not deemed essential services, and which were closed in 2020, experienced a greater drop in employment income.
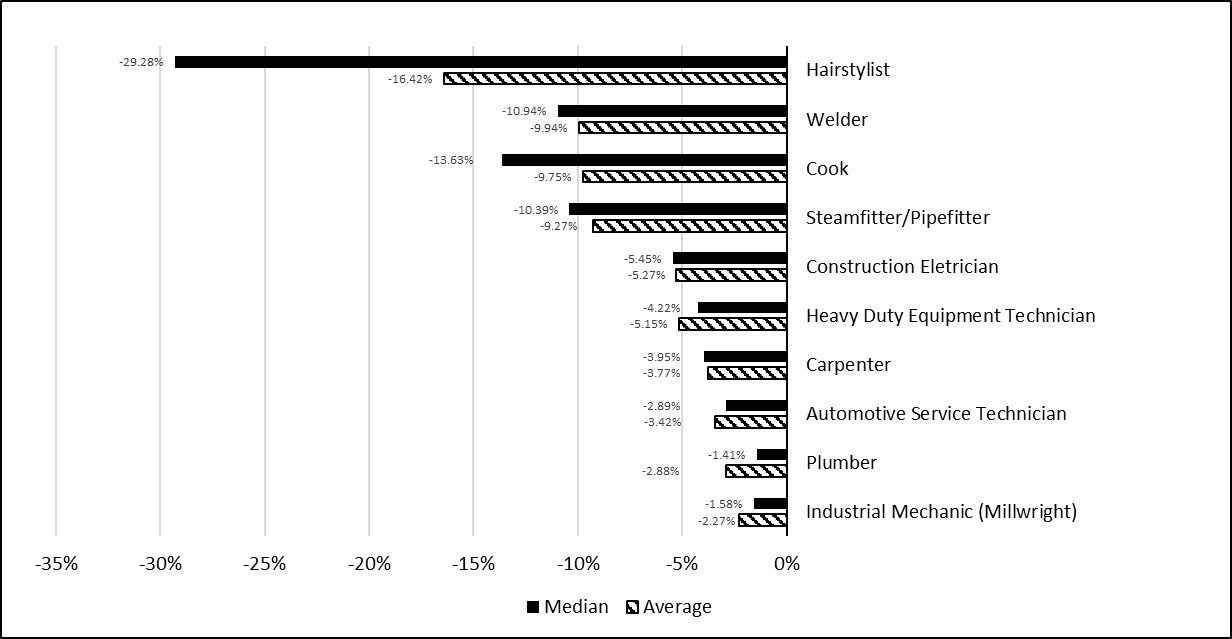
Text version - Figure 33
| Trades | Average percent change | Median percent change |
|---|---|---|
| Industrial Mechanic (Millwright) | -2.27% | -1.58% |
| Plumber | -2.88% | -1.41% |
| Automotive Service Technician | -3.42% | -2.89% |
| Carpenter | -3.77% | -3.95% |
| Heavy Duty Equipment Technician | -5.15% | -4.22% |
| Construction Eelectrician | -5.27% | -5.45% |
| Steamfitter/Pipefitter | -9.27% | -10.39% |
| Cook | -9.75% | -13.63% |
| Welder | -9.94% | -10.94% |
| Hairstylist | -16.42% | -29.28% |
- Source: Analyses conducted by the Evaluation Directorate, ESDC (2024). AG administrative data linked to the RAIS, CAL and T1FF data.
- Note: All values are expressed in 2020 constant dollars.
The pandemic impacted apprentices' training and progression
A majority of KII participants (26 of 40 interviews, or 65%) stated that training was hindered or delayed, both on-the-job and in-class, by:
- closure of technical training institutions and workplaces
- social distancing restrictions and vaccination policies which reduced class sizes
- reduced opportunities to write level exams
- inability to work the hours required to advance
Two informants reported that many apprentices dropped out of their programs or changed careers due to lack of work, interruptions in training, safety concerns, or their focus on family responsibilities.
Some noted that technical training shifted to remote instruction (15 of 40 interviews, or 38%). Remote learning brought both difficulties and benefits, for example:
- online courses enabled some apprentices to continue their programs with minimal delay
- reduced expenses for transportation, parking, and meals
- enough apprentices liked the remote option that technical training institutions have continued to offer it
- online instruction did not work well for content requiring hands-on practical training, or for apprentices without computers
- some apprentices disliked online instruction enough to skip their technical training until they could return in person
The 31 focus group participants who discussed impacts of the pandemic mentioned:
- a decline in the quality of technical training (n=9) due to introduction of remote instruction, lack of hands-on learning, and compression of course content
- reduction in working hours delayed progression (n=8)
- delays in technical training due to COVID outbreaks, intermittent school closures, or program postponement (n=7)
- reduced school attendance due to the imposition of vaccine mandates (n=1)
- missing the application deadline due to administrative issues such as delays in receipt of attestation letters (n=1)
Of 17 who discussed changes following the lifting of pandemic-related restrictions, a few reported lesser quality of technical training (n=3) related to:
- higher class sizes
- need to change schools
- inferior knowledge when starting on-the-job training
The pandemic impacted some groups of apprentices differently than others
KII participants observed some differences in the ways that the pandemic affected specific groups of apprentices. They mentioned that:
- apprentices in the service industry like hairstylists and cooks faced greater disruptions than those in essential services (5 of 33 interviews, or 15%). Many of the most-affected apprentices were women
- apprentices at the entry (first and second) levels were more vulnerable to layoffs. Those at the low end of the pay scale had a harder time coping with increased cost of living (5 interviews, or 15%)
- single parents and families with young children were greatly affected by school and daycare interruptions (5 interviews, or 15%)
According to Statistics Canada, "women were more likely than men to become unemployed during the pandemic because of the large employment losses in service industries, where women account for the majority of the workforce."Footnote 80
Apprentices in trades most affected by the pandemic more often relied on the CERB. In addition, more than half (56%) of certified females received the CERB, compared to just over a third (36%) of males.Footnote 81 Consult Appendix N for more details.
It would therefore be expected that "the declines in new registrations and certifications among women [apprentices] were proportionately larger than those among men." New female registrations decreased by 3,447 (-32.9%) and certifications dropped by 2,460 (-38.5%) in 2020.Footnote 82
New registrations among men, by comparison, declined by 18,672 (-27.8%). Certifications among men dropped by 14,649 (-31.9%).
The pandemic had positive impacts for some apprentices
According to some focus group participants (12 of 43), the pandemic did not have any significant impact on their progression or employment situation.
Positive impacts of the pandemic were reported by 12 of 31 focus group participants, including:
- smaller class sizes, which allowed more interaction with instructors (n=3)Footnote 83
- exemption from provincial exams (n=3)
- stronger interest in their trade or motivation to embark on an apprenticeship (n=3)
- hybrid schooling, which offered greater access to online materials (n=2)
- higher demand for workers in essential services, such as construction (n=2)
Focus group participants (17 of 55) discussed changes following the lifting of pandemic-related restrictions, including:
- greater demand for labour, including apprentices (n=7)
- lifting of safety measures in the workplace (n= 4), for example allowing more people to work in person or without wearing masks
- improved technical training (n=2) due to resumption of in-class instruction or option for remote instruction
Conclusion
Apprentices in interviews and focus groups stated that the AG Program’s influence upon apprenticeship entry or continuation is limited. While AG recipients had higher progression and certification rates than similar non-recipients, various factors may contribute to these higher rates. These include the AG Program, program eligibility requirements, factors other than AG such as changing motivation, securing another job, and the range of other financial supports available to apprentices. Due to methodological limitations, this evaluation was not able to assess attribution or causality between grant receipt and apprenticeship progression and certification.
Apprenticeship completion and certification leads to higher employment and earnings. AG recipients therefore have higher post-apprenticeship incomes than similar non-recipients because they have higher certification rates due to various factors. Men have higher post-apprenticeship income than women. This is partly due to the fact that women are concentrated in lower-paying trades.
The proportion of women choosing male-dominated Red Seal trades has increased at a higher rate since the AIG-W was introduced in 2018. There are most likely multiple causes for this increase, including the AIG-W pilot project. While the AIG-W provided some incentive to persist in apprenticeship, its influence upon choice of trade was likely limited.
The AIG-W helped women overcome financial barriers (for example, paying for tools and living expenses), though some financial and non-financial barriers remain. Women confront certain barriers more often than men (in both male-dominated trades and other careers), such as unwelcoming workplaces and difficulty securing childcare during hours that align with their work schedules. This is especially the case in construction trades.
Some non-eligible apprentices believed that the AIG-W was unfair or discriminatory because it gave an unfair advantage to some women. A few key informants interviewed (7 out of 38) stated that some male apprentices applied as women and received the AIG-W, giving some women an unfavorable impression of the grant.
The pandemic delayed apprenticeship progression and certification. It prompted reductions in employment, income, new apprentice registrations, grant eligibility, and grant applications. Pandemic restrictions imposed delays in technical training and certain trades were not amenable to online training, such as hairstylists. Lastly, some trades workers experienced greater impacts than others, such as women, entry-level apprentices, and those in the service trades.
References
Unpublished government documents
- Deussing, Marie-Anne. (N.d.). ESDC, Labour Market and Skills Research Division, Economic Policy Directorate. "Attitudes and perceptions of Canadian youth towards careers in the trades: Improving over time?"
- Employment and Social Development Canada (ESDC). Apprenticeship & Sectoral Initiatives Directorate. (2020). "Indigenous People in Skilled Trades."
- ___. Labour Market Information Directorate. Policy Research Analysis and Geomatics Division. (2021). "Research Note: Black Canadians in the Skilled Trades."
- ___. Strategic and Service Policy Branch (SSPB). (N.d.a). "Labour Market backgrounder: Indigenous Peoples."
- ___. SSPB. (N.d.b). "Labour Market backgrounder: Visible Minorities."
- ___. SSPB. Economic Policy and SEB. Labour Market Information. (N.d.). "Canada's Labour Market Recovery, February 2020 to September 2021."
- ___. SSPB. Evaluation Directorate. (2014). Summative Evaluation of the Apprenticeship Grants Program - Phase 1.
- ___. SSPB. Evaluation Directorate. (2017). Document Review for the Evaluation of the Apprenticeship Grants (AG) Program.
- ___. SSPB. Evaluation Directorate. (2018). Evidence from the 2015 National Apprenticeship Survey.
- ___. SSPB. Evaluation Directorate. (2019a). The Patterns of Use of Employment Insurance and Canada Apprentice Loan among Apprenticeship Grants Recipients: Evidence from the Linked Apprenticeship Grant, Canada Apprentice Loan and Employment Insurance Administrative Databases.
- ___. SSPB. Evaluation Directorate. (2020). Literature Review on the Impact of Student Financial Aid on Access to Post-Secondary Education and Persistence.
- ___. SSPB. Evaluation Directorate. (2022). Apprenticeship Grants Evaluability Assessment.
- ___. SSPB. Evaluation Directorate. (2023). Apprenticeship Grants literature and program document review.
- ___. SSPB. Evaluation Directorate. (2024a). Apprenticeship Grants, Key Informant Interviews technical report.
- ___. SSPB. Evaluation Directorate. (2024b). Apprenticeship Grants, Focus Groups technical report.
- ___. SSPB. Evaluation Directorate. (2024c). Apprenticeship Grants, Administrative data analysis technical report.
- Malatest, R.A. & Associates. (2014). Phase 2 Evaluation Report: Summative Evaluation of the Apprenticeship Grants.
- Phoenix Strategic Perspectives Inc. (2011). Survey of Applicants to the Apprenticeship Incentive Grant (AIG) and Apprenticeship Completion Grant (ACG) Programs.
- Seguin, Anouk. (2021). "Comparison of certification, continuation, and discontinuation rates among registered apprentices who received loans or grants." Statistics Canada, Canadian Centre for Education Statistics. PowerPoint deck.
- SRDC. (2024). National Survey of Apprenticeship Grant Recipients. AG evaluation technical report.
Canadian Apprenticeship Forum reports (published)
- Canadian Apprenticeship Forum (CAF). (2004). Accessing and Completing Apprenticeship Training in Canada: Perceptions of Barriers.
- ___. (2018a). Making Apprenticeship a National Skills Priority.
- ___. (2018b). Quality of Workplace Training: Apprentice Perspectives. Apprentices in Canada ePanel Research Report.
- ___. (2019a). Apprentices in Canada ePanel: Research Report - Financial Incentives Survey 2019.
- ___. (2019b). Communication and Inclusion in the Skilled Trades: Apprentice Perspectives. Apprentices in Canada ePanel Research Report.
- ___. (2019c). Promoting Careers in the Skilled Trades to Indigenous Youth in Canada.
- ___. (2020a). Apprentice Demand in Red Seal Trades: A 2020 National Labour Market Information Report.
- ___. (2020b). Apprentice Well-Being: An Apprentices in Canada ePanel Report.
- ___. (2020c). Apprenticeship Completion Rates. Apprenticeship Snapshot 3.
- ___. (2020d). Apprenticeship Registration Trends. Apprenticeship Snapshot 2.
- ___. (2020e). Career Entry and Program Progression: An Apprentices in Canada ePanel Report.
- ___. (2020f). Evaluating Success in Pre-apprenticeship in Canada: Consultation Summary Report.
- ___. (2020g). National Strategy for Supporting Women in the Trades.
- ___. (2020h). The Future Demand for Apprentices. Apprenticeship Snapshot 1.
- ___. (2020i). The Impact of COVID-19 on Apprentices in Canada. Apprentices in Canada ePanel.
- ___. (2021a). Apprentice Demand in Red Seal Trades: A 2021 National Labour Market Information Report.
- ___. (2021b). Immigrant Parent Perceptions of Careers in the Skilled Trades, Final Report.
- ___. (N.d.). Results Report 2020.
Other published works
- Automotive Industries Association of Canada. (2016). Advancing Women in Automotive Knowledge Exchange: Needs Assessment Report.
- Cai, Jinghong. (2018). A New Look at Apprenticeship: Linking School to 21st Century Skills. National School Boards Association, Center for Public Education.
- Caliendo, M., & S. Kopeinig. (2008). Some Practical Guidance for the Implementation of Propensity Score Matching. Journal of Economic Surveys 22:1, 31-72.
- Canada. House of Commons. (2018). Experiential Learning and Pathways to Employment for Canadian Youth. Report of the Standing Committee on Human Resources, Skills and Social Development and the Status of Persons with Disabilities.
- Commission de la construction du Québec (CCQ). (2018). Bilan annuel 2018 du Programme d'accès à l'égalité des femmes dans l'industrie de la construction 2015-2024. Available in French only. Retrieved from: https://www.ccq.org/-/media/Project/Ccq/Ccq-Website/PDF/DossierFemmes/Bilan_PAEF_2018.pdf?la=fr-CA&rev=689919c1efb841b995b48355927e8277&hash=2CB13796EE245F33D48330864AC341DB
- ___. Programme d'accès à l'égalité des femmes dans l'industrie de la construction. Bilan des mesures 1997-2012. (2012). Available in French only. Retrieved from: https://www.ccq.org/-/media/Project/Ccq/Ccq-Website/PDF/Recherche/DossiersSpeciaux/BilanFemmes1997_2012.pdf?la=fr-CA&rev=d6d50aafa2864859952854fcb0c6871b
- D'Agostino, R. B. (1998). Propensity score methods for bias reduction in the comparison of a treatment to a non-randomized control group. Statistics in Medicine 17:19, 2265-2281.
- Dehejia, R.H. & S. Wahba. (2002). Propensity Score Matching Methods for Non-experimental Causal Studies. Review of Economics and Statistics 84:1, 151-161.
- ESDC. SSPB. Evaluation Directorate. (2019a). Evaluation of the Apprenticeship Grants. Retrieved from Evaluation of the Apprenticeship Grants - Canada.ca.
- Finnie, Ross, Michael Dubois, & Masashi Miyairi. (2021). How much do they make? New evidence on the early career earnings of trade certificate holders. Education Policy Research Initiative and Labour Market Information Council.
- Frank, Kristyn, and Emily Jovic. (2017). National Apprenticeship Survey: Canada Overview Report, 2015. Statistics Canada.
- Frank, Kristyn and Marc Frenette. (2019). How Do Women in Male-dominated Apprenticeships Fare in the Labour Market? Statistics Canada.
- Gunderson, Morley & Harry Krashinsky. (2016). Apprenticeship in Canada: An Increasingly Viable Pathway? Challenge 59:5, 405-421.
- Hall, P., J. Racine, & Q. Li. (2004). Cross-Validation and the Estimation of Conditional Probability Densities. Journal of the American Statistical Association 99, 1015-1026.
- Heckman, J. J., H. Ichimura, & P. Todd. (1997). Matching as an Econometric Evaluation Estimator: Evidence from Evaluating a Job Training Program. Review of Economic Studies 64, 605-654.
- Jin, Hyeongsuk et al. (2020). Factors associated with the completion of apprenticeship training in Canada. Insights on Canadian Society. Statistics Canada. Accessed at https://www150.statcan.gc.ca/n1/en/pub/75-006-x/2020001/article/00008-eng.pdf?st=55nk1aYT.
- Lehmann, Wolfgang, Alison Taylor, and Zane Hamm. (2015). ‘Go West Young Man!' Youth Apprenticeship and Opportunity Structures in Two Canadian Provinces. Journal of Education & Work 28:1, 44-65.
- Levasseur, Karine and Stephanie Paterson. (2016). Jack (and Jill?) of all Trades - A Canadian Case Study of Equity in Apprenticeship Supports. Social Policy & Administration 50:5, 520-539.
- Malobicky, John Joseph. (2018). A Program Evaluation Study for a Precision Manufacturing Apprenticeship Embedded in a Traditional High School Curriculum. Ed.D., University of Pittsburgh.
- Nicol, Janet. (2019). Time to Trade in Sexism for Fairness on the Job. Herizons 33:2, 6-7.
- Rosenbaum, P.R. & D.B. Rubin. (1983). The Central Role of the Propensity Score in Observational Studies for Causal Effects. Biometrika, 70:1, 41-55.
- Rubin, D. B. (1974). Estimating Causal Effects to Treatments in Randomised and Nonrandomised Studies. Journal of Educational Psychology 66, 688-701.
- Statistics Canada. Labour force characteristics by province, monthly, seasonally adjusted. Table 14-10-0287-03. Accessed 12 April 2022 at https://www150.statcan.gc.ca/t1/tbl1/en/tv.action?pid=1410028703.
- ___. Table 37-10-0123-01. Demographic Characteristics of Apprentices, Canada. https://www150.statcan.gc.ca/t1/tbl1/en/tv.action?pid=3710012301.
- ___. Registered apprenticeship training programs, 2020. The Daily, 6 December 2021, https://www150.statcan.gc.ca/n1/daily-quotidien/211206/dq211206c-eng.htm.
- ___. COVID-19 in Canada: A One-year Update on Social and Economic Impacts. March 2021. Accessed at https://www150.statcan.gc.ca/n1/pub/11-631-x/11-631-x2021001-eng.htm?utm_source=email&utm_medium=0262&utm_campaign=statcan-covid19-20210311#fn.
- ___. Apprenticeship in Canada, 2019. Accessed 15 Nov. 2021 at https://www150.statcan.gc.ca/n1/pub/11-627-m/11-627-m2020083-eng.htm.
- ___. (2017). Education in Canada: Key Results from the 2016 Census. Statistics Canada.
- Su, S., & Jin, H. (2021). Impact of the COVID-19 pandemic on the skilled trades: Canada Emergency Response Benefit. https://www150.statcan.gc.ca/n1/en/pub/81-595-m/81-595-m2022001-eng.pdf?st=xIAaS4GF
- Taylor, Alison, Wolfgang Lehmann, and Milosh Raykov. (2015). ‘Should I Stay Or should I Go?' Exploring High School Apprentices' Pathways. Journal of Education & Work 28:6, 652-676.
Appendices
Appendix A: Previous evaluation key findingsFootnote 84
The main findings of the 2019 AG evaluation were as follows:
- the AG contribute to the decision to continue in, and ultimately complete, an apprenticeship training. However, the grant's incentive is perceived to be limited, as a majority of key informants and a vast majority of focus group participants view the AG as a "bonus" and not as an incentive
- financial burdens continue to be an issue for apprentices, especially for some under-represented groups, such as women and the Indigenous population
- apprentices face significant non-financial barriers such as job instability, lack of access to apprenticeship training, unsupportive employers and a stigma regarding women entering the trades as a career choice
- AG recipients also received support from EI and the CAL in various degrees
- usage of the AG, the CAL, and EI varies by gender and region. For instance, women are more likely to receive support only from the AG
- EI is perceived by key informants to be a significant support, especially for apprentices
- awareness of both the AG and ACG varies across gender and trade groups. Awareness of the grants is lower for women and in some trades, such as hairstylists and cooks where women are over-represented
- take-up for the AIG has decreased from 74.8% to 65.7% between 2010 and 2018 while take-up for the ACG has decreased from 85.9% to 73.3% between 2011 and 2018
- many factors contributed to challenges regarding the take-up rates. Grant recipients learned about the grants once they entered their apprenticeship program rather than prior to the application period as intended
- most of the eligible recipients who did not apply for both grants mentioned they believed they were not eligible. Some recipients spoke about the application process being confusing and having too many steps
- the majority of key informant interviews indicated that the AG do not help under-represented groups enter apprenticeship training
Appendix B: Evaluation questionsFootnote 85
Component 1: Formative evaluation of the AIG-W pilot project
- How has the introduction of the AIG-W influenced women's participation in male-dominated Red Seal trades?Footnote 86
- How and when did AIG-W applicants initially became aware of the program?
- Are specific groups of AIG-W eligible women less likely to be aware of the grant, and why?
- To what extent did their awareness of the program (and of the other financial supports available) influence their decision to undertake an apprenticeship in a male-dominated Red Seal trade, and why?
- To what extent does the AIG-W contribute to encourage women in male-dominated Red Seal trades to continue progressing in their training, once enrolled, and why?
- What proportion of all female apprentices registered in eligible Red Seal trades have applied for and obtained the grant?
- What do AIG-W recipients use the grant money for?
- Do AIG-W recipients continue to face financial or non-financial barriers to apprenticeship progression and certification?
- What other factors or types of supports could further help these women continue progressing in male-dominated Red Seal trades?
- How is the AIG-W perceived by eligible versus non-eligible apprentices (for example, male apprentices and female apprentices in non-male-dominated Red Seal trades)?
Component 2: Evaluation of the net impacts of the AG Program on progression, certification, and post-program employment outcomes
- Do grant recipients progress through each level, including certification, at a higher rate than do apprentices not eligible for the grants (for example, apprentices in non-Red Seal trades), or eligible non-recipients?
- What are the employment outcomes of apprentices who have received the grants, compared to those who have not?
- Do these outcomes vary based on the type of grants received (AIG and/or ACG), participation in other programs such as the CAL, Red Seal certification, gender and/or other identity factors?
COVID specific question (covered by both components)
- How has the COVID-19 pandemic affected program intake and delivery, the progression of grant recipients, as well as their employment situation?Footnote 87
Appendix C: Eligible Red Seal trades (26 March 2024)Footnote 88
There are 54 Red Seal trades eligible for AG financial support:
- Agricultural Equipment Technician
- Appliance Service Technician
- Auto Body and Collision Technician
- Automotive Refinishing Technician
- Automotive Service Technician
- Baker
- Boilermaker
- Bricklayer
- Cabinetmaker
- Carpenter
- Concrete Finisher
- Construction Craft Worker
- Construction Electrician
- Cook
- Drywall Finisher and Plasterer
- Floorcovering Installer
- Gasfitter - Class A
- Gasfitter - Class B
- Glazier
- Hairstylist
- Heavy Duty Equipment Technician
- Heavy Equipment Operator (Dozer)
- Heavy Equipment Operator (Excavator)
- Heavy Equipment Operator (Tractor-Loader-Backhoe)
- Industrial Electrician
- Industrial Mechanic (Millwright)
- Instrumentation and Control Technician
- Insulator (Heat and Frost)
- Ironworker (Generalist)
- Ironworker (Reinforcing)
- Ironworker (Structural/Ornamental)
- Landscape Horticulturist
- Lather (Interior Systems Mechanic)
- Machinist
- Metal Fabricator (Fitter)
- Mobile Crane Operator
- Motorcycle Technician
- Oil Heat System Technician
- Painter and Decorator
- Parts Technician
- Plumber
- Powerline Technician
- Recreation Vehicle Service Technician
- Refrigeration and Air Conditioning Mechanic
- Roofer
- Sheet Metal Worker
- Sprinkler Fitter
- Steamfitter/Pipefitter
- Tilesetter
- Tool and Die Maker
- Tower Crane Operator
- Transport Trailer Technician
- Truck and Transport Mechanic
- Welder
Appendix D: Logic models

Text version - Figure 34
Strategic outcome
Helping Canadians access post-secondary education, obtain the skills and training needed to participate in a changing labour market and provide supports to those who are temporarily unemployed
5.0 Ultimate outcome
5.1 Apprentices obtain employment in Red Seal trades
Line of Accountability
4.0 Intermediate outcome
4.1 Increased progression through each level, including certification
3.0 Immediate outcomes
3.1 Enhance awareness of the grants
3.2 Increase financial resources to support participation in apprenticeship programs
2.0 Outputs
2.1 Promote the grants through communication products and activities
2.1 Processing applications and payments to recipients
1.0 Activities
1.1 Promoting awareness of the grants
1.2 Delivering the grants
Source: ESDC, SSPB, Evaluation Directorate (2022). Apprenticeship Grants Evaluability Assessment (approved by PMEC in May 2022)
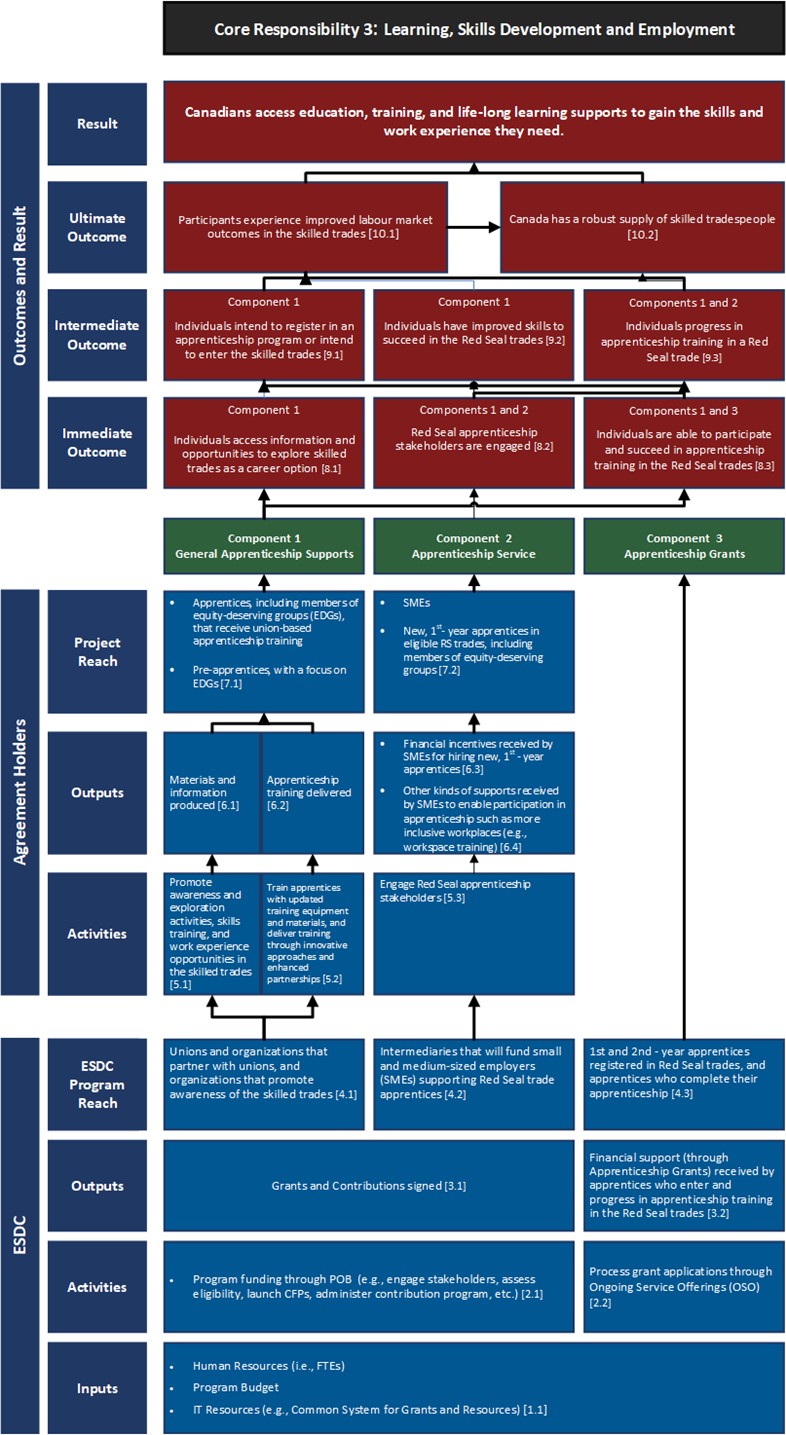
Text version - Figure 35
Core Responsibility 3: Learning, Skills Development and Employment
Outcomes and Result
Result
Canadians access education, training, and life-long learning supports to gain the skills and work experience they need.
Ultimate Outcome
Participants experience improved labour market outcomes in the skilled trades [10.1]
Canada has a robust supply of skilled tradespeople [10.2]
Intermediate Outcome
Component 1
- Individuals intend to register in an apprenticeship program or intend to enter the skilled trades [9.1]
- Individuals have improved skills to succeed in the Red Seal trades [9.2]
Components 1 and 2
- Individuals progress in apprenticeship training in a Red Seal trade [9.3]
Immediate Outcome
Component 1
- Individuals access information and opportunities to explore skilled trades as a career option [8.1]
Components 1 and 2
- Red Seal apprenticeship stakeholders are engaged [8.2]
Components 1 and 3
- Individuals are able to participate and succeed in apprenticeship training in the Red Seal trades [8.3]
Agreement Holders
Project Reach
Component 1, General Apprenticeship Supports
- Apprentices, including members of equity-deserving groups (EDGs), that receive union-based apprenticeship training
- Pre-apprentices, with a focus on EDGs [7.1]
Component 2, Apprenticeship Service
- SMEs
- New, 1st-year apprentices in eligible RS trades, including members of equity-deserving groups [7.2]
Outputs
Component 1, General Apprenticeship Supports
- Materials and information produced [6.1]
- Apprenticeship training delivered [6.2]
Component 2, Apprenticeship Service
- Financial incentives received by SMEs for hiring new, 1st-year apprentices [6.3]
- Other kinds of supports received by SMEs to enable participation in apprenticeship such as more inclusive workplaces (for example, workspace training) [6.4]
Activities
Component 1, General Apprenticeship Supports
- Promote awareness and exploration activities, skills training, and work experience opportunities in the skilled trades [5.1]
- Train apprentices with updated training equipment and materials, and deliver training through innovative approaches and enhanced partnerships [5.2]
Component 2, Apprenticeship Service
- Engage Red Seal apprenticeship stakeholders [5.3]
ESDC
ESDC Program Reach
Component 1, General Apprenticeship Supports
- Unions and organizations that partner with unions, and organizations that promote awareness of the skilled trades [4.1]
Component 2, Apprenticeship Service
- Intermediaries that will fund small and medium-sized employers (SMEs) supporting Red Seal trade apprentices [4.2]
Component 3, Apprenticeship Grants
- 1st- and 2nd-year apprentices registered in Red Seal trades, and apprentices who complete their apprenticeship [4.3]
Outputs
Component 1, General Apprenticeship Supports; Component 2 Apprenticeship Service
- Grants and Contributions signed [3.1]
Component 3, Apprenticeship Grants
- Financial support (through Apprenticeship Grants) received by apprentices who enter and progress in apprenticeship training in the Red Seal trades [3.2]
Activities
Component 1, General Apprenticeship Supports; Component 2 Apprenticeship Service
Program funding throughout POB (such as engage stakeholders, assess eligibility, launch CFPs, administer contribution program, etc.) [2.1]
Component 3, Apprenticeship Grants
Process grant applications through Ongoing Service Offerings (OSO) [2.2]
Inputs
Component 1, General Apprenticeship Supports; Component 2 Apprenticeship Service; Component 3, Apprenticeship Grants
- Human Resources (FTEs)
- Program budget
- IT resources (such as Common System for Grants and Resources) [1.1]
Source: ESDC, SSPB, Evaluation Directorate (2022). Apprenticeship Grants Evaluability Assessment (approved by PMEC in May 2022)
Appendix E: Methodology — Literature review and key informant interviews
Completed by the Evaluation Directorate
Literature review
- Comprehensive literature and document review covering 2015 to 2022 and including 102 sources drawn from academic journals, grey literature, and government documents
- Ebsco database keyword searches for "apprenticeship" and "Canada," plus a later search for "apprenticeship evaluation research," produced a list of about 75 academic sources in English
- Searches also considered themes specifically related to the evaluation questions (for example, awareness, gender, financial supports)
- International studies were included if they addressed themes closely related to the current evaluation
- A selection of unpublished government and program documents was subsequently added as part of the document review
Key challenges and limitations
The recent scholarly literature concerning apprenticeship in Canada is thin. The review therefore leans heavily in places on surveys of apprentices which sometimes offer ambiguous or even contradictory results.
Key informant interviews (completed by the Evaluation Directorate)
There were 41 KIIs conducted with a total of 44 informants between 15 May and 29 September 2023 (3 interviews included 2 participants each). Of these, 36 interviews were in English and 5 were in French; 24 informants were female and 20 were male. A key strength was the number of interviews and the variety of perspectives from the 6 groups. The collective depth and scope of the KIs' expertise were also strengths.
Six groups of informants identified in collaboration with evaluation Working Group members:
- departmental representatives (n= 8)
- provincial and territorial partners (n= 13, in 10 interviews)
- training provider representatives (n= 5)
- apprentices who self-identify as women (n=5)
- organizations supporting women apprentices (n=8)
- employers' representatives (n= 5)
Key challenges and limitations
Efforts were made to ensure a sufficient degree of geographical distribution for each of the 6 KI groups. However, there were no informants from the territories.
It proved difficult to recruit francophone participants.
It was also difficult to recruit female apprentices because of delays in generating sampling lists from administrative data. The perspectives of the women apprentices group, therefore, are less thoroughly represented than would be optimal.
The interview questions were broad enough to apply to a group of informants but not all questions were relevant for each KI, depending on their individual experience. Therefore, slightly different questions were asked of some groups, or of individuals within groups, and some questions did not generate many responses. Trying to generalize from a variety of responses concerning a particular issue was challenging when informants were not all asked the same questions. It was also challenging to make comparisons across groups.
Appendix F: Methodology - Focus groups
Completed by the Evaluation Directorate
Of 12,807 AG recipients in the program's administrative database, 2,248 (17.6%) were invited to participate in a focus group. From that group, 55 volunteered (for a participation rate of 2.4%). Nine focus groups were conducted with 55 apprentices between 2 November and 7 December 2023. Seven groups were held in English and 2 in French. Participants included 45 women and 10 men.
Main criteria used for focus group composition:
- including apprentices from various trades and levels
- over-sampling from under-represented groups (Indigenous peoples, persons with disabilities, and racialized groups), as their participation rates are generally lower
- balancing representation from various regions and both official languages, and prioritizing areas with larger populations
- favouring women who got the grants over women who did not (to answer evaluation questions)
- including male participants for comparison purposes
- regrouping participants by time zone due to logistical considerations
Geographical distribution (n= 55):
- Québec: 16 (29.1%)
- Prairies: 13 (23.6%)
- Ontario: 10 (18.2%)
- British Columbia: 9 (16.4%)
- Atlantic: 6 (10.9%)
- Other: 1 (1.8%)
Categories of participants:
- apprentices who self-identify as women and received the AIG-W (n=28)
- apprentices who self-identify as women who only received the regular AIG (n=8)
- apprentices who self-identify as women and have obtained their certification and the ACG (n=9, including 2 AIG-W recipients, and 7 regular AIG recipients)
- male apprentices in Red Seal trades that are not considered male-dominated (n=7)
- male apprentices in male-dominated Red Seal trades (n=3)
- cancelled: apprentices who self-identify as women and have not obtained their certification and the ACG
Key challenges and limitations
Efforts were made to ensure balanced regional representation. However, only 3 participants attended each of the 2 focus groups conducted in the Pacific time zone, compared with 5 to 7 in the other 7 focus groups.
Purposive sampling was used to diversify the profile of invited participants as much as possible. Limited responses from some categories meant that the composition of focus groups did not necessarily represent all segments of the population of program participants.
It was difficult to recruit apprentices who self-identified as women and had not obtained their certification and the ACG (dropped out or discontinued the training). This focus group, therefore, was cancelled. Triangulation of focus group findings with KII findings compensated for this gap.
Since the program administrative database was not up to date, some focus groups had mixed categories of participants rather than homogeneous groups. Moderators had to adapt discussion topics in such cases.
Appendix G: Methodology - Analysis of linked administrative data
Carried out by the Evaluation Directorate
Administrative databases
- RAIS: 2008 to 2020
- AG data: 2008 to 2020
- CAL data: 2015 to 2020
- EI Status Vector: 2008 to 2020
- T1FF - Income Data for Tax Filers and their Families: 2008 to 2020
Cleaning up databases
- AG recipient records are in both AG administrative data and the RAIS database while those of non-recipients are exclusively in RAIS
- Trade qualifiers were removed from the RAIS database. In fact, the trade qualifiers have never registered in an apprenticeship; therefore, they are not eligible for the grants
- Only apprentices registered in a Red Seal trade were kept in RAIS
- Once trade qualifiers and apprentices in a non-Red Seal trade were removed from the sample, real duplicates were checked and removed
Database linkage
- After removing trade qualifiers and apprentices in non-Red Seal trades, apprentices in RAIS who were not matched with an individual in the AG administrative data are in the control group
- Linkages are based on one unique identifier (Register_group_ID) which is available in all databases being used
- The AG administrative database was linked to the RAIS database
- The linked AG-RAIS was reshaped in wide to have only one observation by apprentice in each cohort
- The linked AG-RAIS dataset was linked with the EI dataset for all cohorts
- The linked AG-RAIS-EI dataset was linked to the CAL dataset only for the 2014 cohort since CAL had been introduced in 2015
Control and treatment groups
- Treatment group: apprentices registered in Red Seal trades between 2008 and 2014 who received AIG or AIG-W at least once during their training
- Control group: apprentices registered in Red Seal trades between 2008 and 2014 who received neither AIG nor AIG-W during their training. The control group both includes apprentices who were eligible and did not benefit from the program, and those whose applications were rejected for several reasons
Cohorts and reference period
- Cohort: a group of newly registered apprentices in an apprenticeship program during a calendar year. The analyses are related to cohorts from 2008 to 2014
- Reference period: 2008 to 2014 cohorts followed until 2020
- AG Program was introduced in 2007 (first cohort for the analysis is 2008) and will end in March 2025
- Apprenticeship program duration is from 1 to 5 years
- Since the evaluation will estimate AG impacts over 1.5 times the duration of the apprenticeship program, 2014 is the last cohort
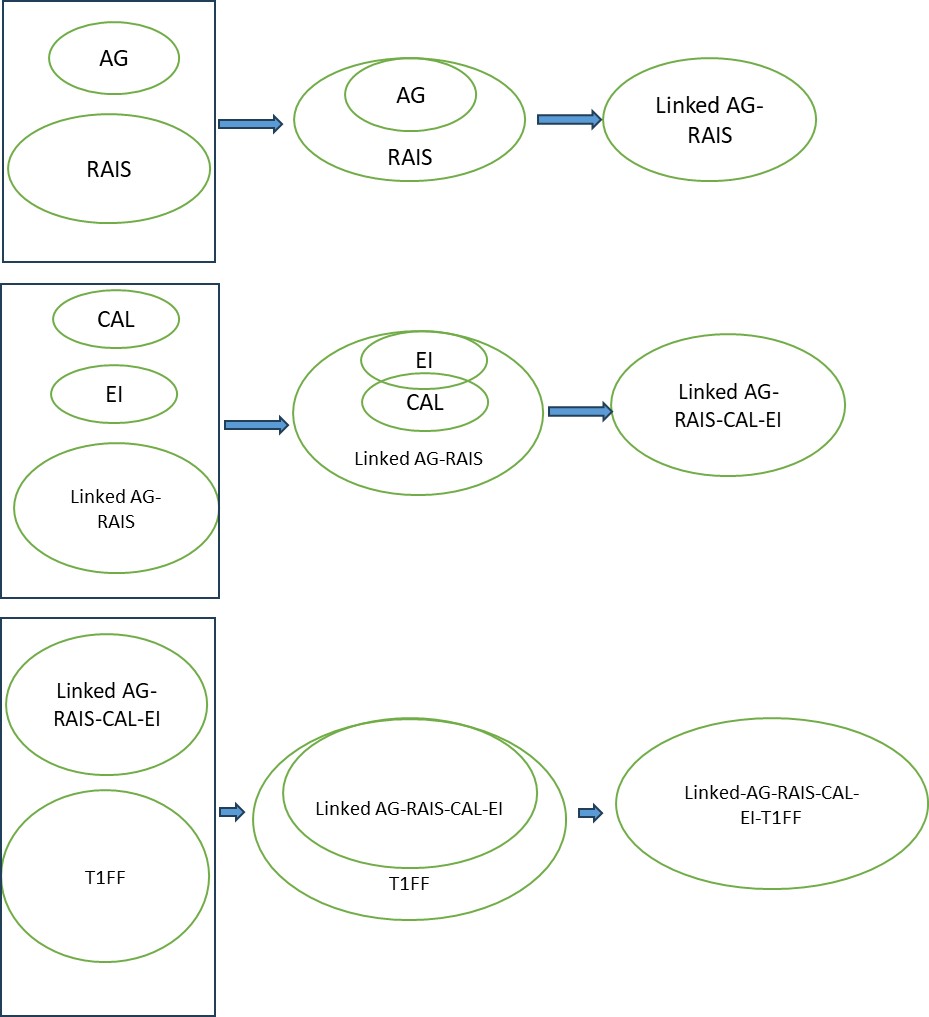
Text version - Figure 36
Linked AG and RAIS (Linked AG-RAIS)
Linked AG-RAIS to CAL and EI (Linked AG-RAIS-CAL-EI)
Linked AG-RAIS-CAL-EI to T1FF (Linked AG-RAIS-CAL-EI-T1FF)
Data analysis method 1: propensity score kernel matching
The analysis of linked administrative data was done through 2 methods: propensity score kernel matching and probit regression.
Rationale for using propensity score matching method:
The intent of the propensity score matching analyses was to examine the differences in probability of progression and certification between AG recipients and non-recipients. The analyses are exclusively based on observational data. Although it is possible to randomly select subjects, it is impossible to carry out a random allocation of treatment. Yet random selection of subjects and random allocation of treatment are necessary to report causal inference. In the absence of randomization, inferences about the causal effect of treatment cannot be made. Indeed, it is not possible to determine whether the difference in results between the apprentices who benefited from the AG Program (treated) and those who did not (untreated) is due to the treatment or to differences between the subjects on other characteristics. People with certain characteristics may be more likely to receive treatment than others. The matching ensures that any differences between the treatment and the control groups are not a result of differences on the matching variables. Thus, as mentioned by D'Agostino (1998) and others, matching reduces the biases linked to the non-random nature of treatment allocation by assigning a propensity score to each person. By using "the probability that a subject would have been treated (that is, the propensity score) to adjust our estimate of the treatment effect, we can create a ‘quasi-randomized' experiment. That is, if we find two subjects, one in the treated group and one in the control, with the same propensity score, then we could imagine that these two subjects were ‘randomly' assigned to each group in the sense of being equally likely to be treated or control."
Description of the method
The first step in using a matching approach is to measure the propensity scores of both AG recipients and non-recipients. The propensity score is defined as the probability of treatment assignment or the choice to participate in the AG Program conditional on observed baseline covariates. Thus, the measurement of the propensity score is based on characteristics deemed relevant to the decision to apply for a grant. The propensity scores are measured with a propensity score model, a logit regression of the probability of receiving AG. Once the propensity score is measured for everyone, it is necessary to find for each apprentice from the treatment group an "equivalent" among the comparison group using the "kernel matching" algorithm. In this method, every recipient is matched with the weighted average of the non-recipients. Thus, kernel matching reweights each of the control group members when they are compared with a new recipient based on propensity score differentials. The weights are inversely proportional to the distance between the treated and control group's propensity scores.
Outcomes of interest
Progression: a proxy is used to measure progression, that is, the ability to complete a Red Seal trade within the program duration. The binary variable takes into consideration the time elapsed between the registration and the certification. It takes the value 1 when the program is completed within the planned duration of the program and the value 0 otherwise.
Certification: is a binary variable which takes the value 1 if the apprentice completed the program within 1.5 times the program duration and 0 if the time elapsed between registration and certification is greater than 1.5 times the program duration.
Labour market outcomes (employment income): employment income is a continuous variable including:
- wages and salaries
- commissions from employment
- training allowances
- tips and gratuities
- self-employment income (net income from business, profession, farming, fishing and commissions)
- Indian employment income exempt under the Indian Act
Because of self-employment income, this variable can take negative values. Negative income would indicate that expenses exceeded gross income. Analyses are conducted 1.5 and 3 years after the program duration.
Covariates
- age at registration (RAIS)
- gender (RAIS)
- employment income at registration (T1FF)
- marital status at registration (T1FF)
- low-income status (T1FF)
- program duration (RAIS)
- union membership at registration (T1FF)
- receipt of EI benefits at registration year (T1FF)
- being in Compulsory or Voluntary trade (RAIS)
- receipt of initial credits at registration (RAIS)
- receipt of CAL (CAL)
Balance testing
The success of the propensity score matching method is highly dependent on the quality of the matching. Thus, matching approaches based on propensity scores are justified if reweighting of the control group results in a balance with recipients in terms of those critical characteristics that influence selection into the program. The present evaluation used the standardized differences method, developed by Rosenbaum and Rubin (1983) to test the balance between treatment and control groups. The evaluation also used graphical visualization methods to determine whether propensity score matching had achieved a good overlap between treated and controlled groups, meaning the propensity score distribution is similar between the treatment and comparison groups.
Robustness
Other matching algorithms such as the nearest neighbor (NN(1), NN(2), NN(3)),Footnote 90 and matching based on Mahalanobis distance metric (teffect nnmatch stata command) were used to measure results sensitivity towards the matching method. Since the results were insensitive to the matching method, the propensity score kernel matching method proved to be robust.
Data analysis method 2: probit regression
The objective of probit regression is to consider factors associated with progression, certification, or dropout. This model was not chosen to investigate a causal relationship between receiving the AG and progression or certification, due to several potential limitations such as selection bias. Indeed, the treatment allocation is not random. Participation in the AG Program is subject to certain conditions which means the treatment cannot be assigned randomly. The analyses were first conducted separately by cohort (2008 to 2014). After, cohort data was pooled by controlling for year effects (year of registration).
Dependent variables
Progression: a proxy was used to measure progression, that is the ability to complete a Red Seal trade within the apprenticeship program duration. The binary variable takes into consideration the time elapsed between registration and certification. It takes the value 1 when the program is completed within the planned duration of the program and the value 0 otherwise.
Certification within 1.5 times the program duration: this binary variable takes the value 1 (Yes) if the apprentice completed their program within 1.5 times the program duration, and 0 (No) if the time elapsed between registration and certification is greater than 1.5 times the program duration.
Discontinuation 6 years after being registered in a Red Seal trade: binary variable whose value is 1 (Yes) if the apprentice left the program without having obtained certification 6 years after registration and the value 0 (No) if the apprentice is still in the apprenticeship program.
Independent variables
- receipt of AG
- age at registration (RAIS)
- gender (RAIS)
- employment income at registration (T1FF)
- marital status at registration (T1FF)
- low-income status (T1FF)
- program duration (RAIS)
- union membership at registration (T1FF)
- receipt of EI benefits at registration year (T1FF)
- being in Compulsory or Voluntary trade (RAIS)
- receipt of initial credits at registration (RAIS)
- receipt of CAL (CAL - 2014 cohort)
- province (T1FF)
- registration year (time effect variable in pooled analysis)
Key challenges and limitations
The kernel matching and probit regression were subject to several challenges and limitations.
Missing variables
Certain factors affecting participation in the AG Program could not be observed and informed, such as:
- motivation or ability to undertake an apprenticeship program
- lack of awareness of the AG Program
- other job offers
- relationship with the employer
- apprentices' own interest
Treatment configuration
To benefit from the AIG, the apprentice must prove completion of either the first year (level) or second year (level) or equivalent in a designated Red Seal trade. In other words, the grant is only awarded after demonstrating progress in training. Given the eligibility criteria for the grant, it is difficult to assess the impact of the AG on progression. More clearly, the outcome is observed before the treatment while the causality relationship would look at the impact of the treatment on the outcome. This explains the choice made for the proxy (certification during the duration of the program), but it should be noted that this proxy itself cannot fully capture progression in its true definition. The other main challenge with this approach is that some apprentices may receive other types of support during their apprenticeship program, making it difficult to solely attribute differences in outcomes to receipt of the grants. Examples of other supports include:
- EI during the training session
- potential provincial or territorial supports
- tax measures
Challenges with building a valid control group
Apprentices whose applications were rejected and who did not submit a new application for the same reference year would have constituted a more relevant control group. However, there are too few of them to constitute a usable control group for statistical analysis. They were therefore included in the control group with those apprentices who had not applied to the AG.
It is important to remember that non-beneficiaries are exclusively in RAIS. However, there is no variable in RAIS to consider the progression of apprentices. If the progression of non-recipients could be tracked, non-recipients who progress similarly to recipients but did not apply for the grant could have constituted a better control group.
Additionally, some apprentices in the control group used in the evaluation may not benefit from AG simply because they are not progressing. Given this situation, this category of non-recipients does not present similar characteristics to recipients in terms of participation in the AG. However, several other reasons could explain the fact that apprentices who are eligible do not apply. For example, some people think that the amount of the grants is not enough to invest the time to gather the documents required to apply. Others are just not aware of the grants otherwise they would have applied. In addition, because the grants are taxable there are some applicants who think that it is not worth the cost.
Limitations related to the propensity score matching method
Propensity score matching relies largely on the conditional independence assumption, meaning that there are no unobserved variables that affect both program participation and program outcomes. In other words, the treatment assignment and the outcome are conditionally independent given the vector of selection covariates. However, this assumption is often difficult to verify and may not be valid in some cases. It is true that propensity score matching has the advantage of reducing all factors that influence the decision to participate to a single vector of observable covariates. However, it is important to emphasize that an unobservable factor such as motivation could be a potential source of selection bias. In the case of a correctly conducted random assignment, it would be more judicious to ensure that treated and untreated are similar on observable and unobservable characteristics. This is not the case for propensity score matching, which only takes into account selection on observables.
Appendix H: Methodology — AG Program's data
This section is based on input provided by the AG Program.
Number of AG issued and take-up rates
The methodology to calculate drop-out rates is based on 2014 research published by the Canadian Council of Directors of Apprenticeship (CCDA).
AIG (level 1)
- Number of new registrations in Red Seal trade apprenticeships as established by RAIS for a specific calendar year
- Minus the estimated number of first year drop-outs established through recent research by the CCDA (2014) on Apprenticeship Completion, Certification, and Outcomes which recognizes that it takes on average 18 months for an apprentice to complete the requirements for the first year of their apprenticeship program
- Minus the estimated number of first year advanced standing established by Statistics Canada
- Equals the applicants pool for the AIG level 1 for the next calendar year
AIG (level 2)
- Number of new registrations in Red Seal trade apprenticeships as established by RAIS for a specific calendar year
- Minus the estimated number of first year and second year drop-outs established through recent research by the CCDA (2014) on Apprenticeship Completion, Certification, and Outcomes which recognizes that it takes on average 18 months for an apprentice to complete the requirements for the first year of their apprenticeship program and 36 months for an apprentice to complete the requirements for the second year of their apprenticeship program
- Minus the estimated number of advanced standing in their first and second year apprenticeship established by Statistics Canada
- Plus the estimated number of advanced standing for the first BUT NOT for the second year established by Statistics Canada
- Equals the applicants pool for the AIG level 2, 2 years later
Results for AIG1 and AIG2 are added (for matching calendar years) and converted from calendar year into fiscal year to have the final AIG applicants pool number.
ACG
- Number of completions in Red Seal trade apprenticeships as established by RAIS for a specific calendar year
- Conversion from the calendar year number to a fiscal year number provides the ACG applicants pool number
Key challenges and limitations
It is possible that some jurisdictions report differently the actual number of new apprentice registrations and the number of people who drop out in the first and second year.
Provinces and territories (PTs) calculate advanced standing for completion of pre-employment college programs differently.
PTs calculate advanced standing for completion of pre-employment college programs differently. Prior Learning Assessment (PLAR) is provided for a complete year of apprenticeship in some jurisdictions, enabling apprentices to start at an advanced year. In others, PLAR is granted for technical training only.
Appendix I: Methodology - Survey
Completed by the Social Research Demonstration Corporation (SRDC) for ESDC'S Evaluation Directorate.
Sampling
Two-stage stratified random sampling to ensure adequate sample sizes to conduct the analysis on the following 5 target groups:
- Group 1: female apprentices who have received both the AIG-W and the ACG
- Group 2: female apprentices who have received the AIG-W but have not yet applied for or received the ACG
- Group 3: apprentices who have received both the regular AIG and the ACG
- Group 4: apprentices who have received the regular AIG but have not yet applied for or received the ACG
- Group 5: apprentices (AIG-W, AIG, ACG) who had at least one grant application turned down (unsuccessful applicants)
Within each of the 5 target groups, a second-stage stratification was applied to ensure adequate representation of apprentices traditionally under-represented in the Red Seal trades workforce, such as:
- Red Seal apprentices identified as women
- Indigenous
- people living with disabilities
- people belonging to a visible minority group (racialized persons in Canada)
The evaluation over-sampled the key sub-populations to ensure sufficient sample sizes for subsequent sub-group analyses, for example, women.
Pilot survey
The evaluation validated the survey instrument through a series of telephone interviews (20 participants) administered to a random selection of program participants. The results of the interviews were used solely to improve the survey instrument before the launch of the national survey.
Survey (national level)
In total, 43,216 grant recipients were invited to participate in the national survey. By 27 March 2024—the survey's closing date—2,437 respondents completed the survey.
Data cleaning and preparation
The raw survey data was checked for accuracy and completeness. This involved checking for missing values, inconsistencies, and outliers.
Data Analysis
The evaluation used descriptive statistics to summarize all quantitative survey variables. These included measures of central tendency (mean, median) and dispersion (standard deviation, range) for continuous variables such as age and hourly wages. For categorical variables, which made up the majority of the survey questions, the evaluation calculated frequencies and percentages to describe the distribution of responses. In addition, the evaluation performed bivariate analysis using independent samples t-tests to compare the means of 2 independent groups to determine whether there is statistical evidence that the associated population means are significantly different. As the survey is based on a random sample of a population, the objective of the test is to check whether the differences in means for each subgroup are also valid at the population level of each subgroup. To complement the quantitative analysis, open-ended survey comments were examined thematically. This involved an iterative process of reading and coding the responses to identify recurring concepts and ideas.
Key challenges and limitations
The SRDC survey was subject to several challenges and limitations.
Absence of longitudinal information
The survey was a one-point-in-time snapshot of respondents' experiences with the AG Program, and with their apprenticeship and employment in the trades in general. The survey did not make it possible to collect cross-sectional information. It was not possible to follow the respondents over a long period of time to better understand changes and progress on apprenticeship completion and employment.
Causality
The analysis identified correlations between the types of grants received and reported apprenticeship and employment outcomes. While these correlational relationships provided useful insights, it was not possible to establish causation or definitively say that improvements to apprenticeship progression, completion, and subsequent labour market outcomes can be solely attributed to the receipt of AG.
Absence of control group
The analysis focused on the individuals who had had some interactions with the AG Program, having applied for any of the grants and either received the grants or had their applications rejected. The sampling frame did not include apprentices who had not interacted with the program at all, such as those who did not apply, or did not hear about the program in the first place. In other words, the survey analysis did not include a robust comparison group who may have been going through the apprenticeship pathway without the AG Program. We therefore could not compare their outcomes with the outcomes of AG applicants to inform the impacts of the AG Program above and beyond other apprenticeship supports.
Appendix J: Probit regressions for pooled cohorts
Table 2: Predicted probability for progressing, obtaining a certificate and discontinuing in a Red Seal trade (cohorts 2008 to 2014)
- Source: Analyses conducted by the Evaluation Directorate, ESDC (2024).
- Note: the year of registration was controlled for in the regressions, to control for observable differences at registration across cohorts.
| Variables | Progression | Certification within 1.5 times the program duration | Discontinuation 6 years after registration |
|---|---|---|---|
| No (reference) | 0.0903 | 0.15914 | 0.7217 |
| Yes | 0.3364*** | 0.6364*** | 0.2064*** |
***significant at the 1% level, p<0.01
| Variables | Progression | Certification within 1.5 times the program duration | Discontinuation 6 years after registration |
|---|---|---|---|
| 18 to 20 years | 0.2337*** | 0.4716*** | 0.393*** |
| 21 to 25 years | 0.2345*** | 0.4310*** | 0.4334*** |
| 26 to 35 years | 0.2144*** | 0.3926*** | 0.4694*** |
| 36 to 45 years | 0.2012*** | 0.3583*** | 0.4950*** |
| 46 years or older (reference) | 0.1808 | 0.3149 | 0.5195 |
***significant at the 1% level, p<0.01
| Variables | Progression | Certification within 1.5 times the program duration | Discontinuation 6 years after registration |
|---|---|---|---|
| Male (reference) | 0.2216 | 0.4179 | 0.443 |
| Female | 0.2435*** | 0.4179*** | 0.4612*** |
***significant at the 1% level, p<0.01
| Variables | Progression | Certification within 1.5 times the program duration | Discontinuation 6 years after registration |
|---|---|---|---|
| Less than $15,000 | 0.1210*** | 0.2885*** | 0.5210*** |
| $15,000 to $29999 (reference) | 0.1648 | 0.3577 | 0.4847 |
| $30000 to 44,999 | 0.2243*** | 0.4362*** | 0.4374*** |
| $45,000 to $59,999 | 0.2665*** | 0.4635** | 0.4128*** |
| $60,000 to $74,999 | 0.303*** | 0.4879*** | 0.4029*** |
| $75,000 and more | 0.3336*** | 0.498*** | 0.4003*** |
- ***significant at the 1% level, p<0.01
- **significant at the 5% level, p<0.05
| Variables | Progression | Certification within 1.5 times the program duration | Discontinuation 6 years after registration |
|---|---|---|---|
| Single | 0.2192*** | 0.4143*** | 0.4456*** |
| Married or common-law (reference) | 0.2372 | 0.4319 | 0.4395 |
| Divorced, separated or widowed | 0.1915*** | 0.3736*** | 0.4780*** |
***significant at the 1% level, p<0.01
| Variables | Progression | Certification within 1.5 times the program duration | Discontinuation 6 years after registration |
|---|---|---|---|
| Low income(reference) | 0.2250 | 0.4208 | 0.4422 |
| Not low income | 0.1935*** | 0.3720*** | 0.4823 |
***significant at the 1% level, p<0.01
| Variables | Progression | Certification within 1.5 times the program duration | Discontinuation 6 years after registration |
|---|---|---|---|
| 1 (reference) | 0.2879 | 0.4276 | 0.3639 |
| 2 | 0.3548*** | 0.5221*** | 0.3083*** |
| 3 | 0.1872*** | 0.3637*** | 0.4518** |
| 4 | 0.2274*** | 0.4337*** | 0.4573*** |
| 5 | 0.2562*** | 0.4928*** | 0.4386*** |
- ***significant at the 1% level, p<0.01
- **significant at the 5% level, p<0.05
| Variables | Progression | Certification within 1.5 times the program duration | Discontinuation 6 years after registration |
|---|---|---|---|
| No (reference) | 0.204 | 0.4007 | 0.4489 |
| Yes | 0.2302*** | 0.4245*** | 0.4433*** |
***significant at the 1% level, p<0.01
| Variables | Progression | Certification within 1.5 times the program duration | Discontinuation 6 years after registration |
|---|---|---|---|
| Compulsory (reference) | 0.2077 | 0.4218 | 0.4332 |
| Voluntary | 0.2490*** | 0.4109*** | 0.4666*** |
***significant at the 1% level, p<0.01
| Variables | Progression | Certification within 1.5 times the program duration | Discontinuation 6 years after registration |
|---|---|---|---|
| No (reference) | 0.2162 | 0.4158 | 0.4457 |
| Yes | 0.2397*** | 0.4225*** | 0.4430*** |
***significant at the 1% level, p<0.01
| Variables | Progression | Certification within 1.5 times the program duration | Discontinuation 6 years after registration |
|---|---|---|---|
| No (reference) | 0.2275 | 0.4146 | 0.4521 |
| Yes | 0.2169*** | 0.4226*** | 0.4344*** |
***significant at the 1% level, p<0.01
Appendix K: Average treatment effects for treated (ATT): detailed results (propensity score kernel matching) — Outcomes variables: Progression and certification (cohorts 2008 to 2014)
| Cohorts | ATT | Standard error |
|---|---|---|
| 2008 | 0.2431*** | 0.0054 |
| 2009 | 0.2620*** | 0.0061 |
| 2010 | 0.2545*** | 0.0058 |
| 2011 | 0.2231*** | 0.0056 |
| 2012 | 0.2424*** | 0.0052 |
| 2013 | 0.2282*** | 0.0047 |
| 2014 | 0.2297*** | 0.0055 |
| Combined cohorts | 0.2397*** | 0.0020 |
- ***significant at the 1% level, p<0.01
- Source: Analyses conducted by the Evaluation Directorate, ESDC (2024).
- Note: variables which were included in the model were as follows:
- age at registration
- gender
- employment income at registration
- marital status at registration
- low-income status
- program duration
- union membership at registration
- receipt of EI benefits at registration year
- being in Compulsory or Voluntary trade
- receipt of initial credits at registration
| Cohorts | ATT | Standard error |
|---|---|---|
| 2008 | 0.5106*** | 0.0054 |
| 2009 | 0.4911*** | 0.0073 |
| 2010 | 0.4584*** | 0.0069 |
| 2011 | 0.4379*** | 0.0064 |
| 2012 | 0.4509*** | 0.0057 |
| 2013 | 0.4437*** | 0.0055 |
| 2014 | 0.4510*** | 0.0063 |
| Combined cohorts | 0.4645*** | 0.0042 |
- ***significant at the 1% level, p<0.01
- Source: Analyses conducted by the Evaluation Directorate, ESDC (2024).
- Note: variables which were included in the model were as follows:
- age at registration
- gender
- employment income at registration
- marital status at registration
- low-income status
- program duration
- union membership at registration
- receipt of EI benefits at registration year
- being in Compulsory or Voluntary trade
- receipt of initial credits at registration
| Cohorts | ATT: At certification year (income gap) | T-stat | ATT: 3 years after certification (income gap) | T-stat |
|---|---|---|---|---|
| 2008 | $180 | 0.14 | $267 | 0.15 |
| 2009 | $1,515 | 1.26 | -$192 | -0.1 |
| 2010 | $37 | 0,03 | -$715 | -0.49 |
| 2011 | -$1,055 | -0.98 | -$1,208 | -1.01 |
| Combined cohorts | $484 | 0.78 | $14 | 0.02 |
- Source: Analyses conducted by the Evaluation Directorate, ESDC (2024).
- Note: variables which were included in the model were as follows:
- age at registration
- gender
- employment income at registration
- marital status at registration
- low-income status
- program duration
- union membership at registration
- receipt of EI benefits at registration year
- being in Compulsory or Voluntary trade
- receipt of initial credits at registration
| Cohorts | ATT: 1 year after program duration regardless of certification (income gap) | ATT: 3 years after program duration regardless of certification (income gap) |
|---|---|---|
| 2008 | $13,190*** | $12,778*** |
| 2009 | $9,354*** | $9,440*** |
| 2010 | $8,930*** | $7,945*** |
| 2011 | $6,372*** | $8,345*** |
| Combined cohorts | $9,745*** | $9,903*** |
- ***significant at the 1% level, p<0.01
- Source: Analyses conducted by the Evaluation Directorate, ESDC (2024).
- Note: variables which were included in the model were as follows:
- age at registration
- gender
- employment income at registration
- marital status at registration
- low-income status
- program duration
- union membership at registration
- receipt of EI benefits at registration year
- being in Compulsory or Voluntary trade
- receipt of initial credits at registration
Appendix L: Additional findings on women's employment income and choice of trade
Men's post-apprenticeship employment income is much higher than women's
A Statistics Canada study in 2019 found that women with apprenticeship certification earned less than their male counterparts.Footnote 91 They also earned less than any other women except for those who failed to complete high school. Women who apprenticed made 12% less than those with only high school education unless they chose a male-dominated trade. In that case they made 27% more than women with high school only.
Women who chose male-dominated trades received lower median hourly wages than men. They were less likely to be employed in their trades and were less likely to receive most job-related benefits.
In 2019, women accounted for 9% of Red Seal apprentices. About half were in the low-paying hairstylist, cook, and baker trades.Footnote 92 Women's entry into male-dominated Red Seal trades was only 5% of the total. Their completion rate only accounts for about 3% of the total.Footnote 93 Women's concentration in the lower paying trades therefore contributes to wage disparity compared to male trades workers.
Across all Red Seal trades, women earned on average 47% of what men earned in the first year after certification. Average earnings dropped to 46% after 8 years.Footnote 94
Finnie, Dubois, and Miyairi (2021) report that even in higher-paying trades, women still earned less than men. In architectural and construction trades, they earned 78% of what men did; in electrical trades, 85%; in mechanical trades, 89%.Footnote 95 The authors suggest that the remaining gap may be partly explained by differences in hours or weeks worked. The differences may be due to childcare and family responsibilities which are met disproportionately by women.
Women's new registrations in male-dominated trades and AG take-up both increased after introduction of the AIG-W
From 2008 to 2016, only 38% of female apprentices registered in Red Seal trades. Women were more concentrated in non-Red Seal trades.Footnote 96
According to RAIS, the gap between the proportion of women registering in trades eligible for the AIG-W and the proportion registering in non-eligible trades has decreased since the AIG-W was introduced in 2018. Consult Figure 20. For example, 60.7% of new female registrations in 2017 were in non-eligible trades. The proportion decreased to:
- 57.8% in 2018
- 47.5% in 2020
- 36.3% in 2022Footnote 97
Similarly, the total number and proportion of all female apprentices registered in AIG-W-eligible trades has increased since 2018. It should, however, be noted that this proportion had already started increasing progressively before the introduction of the AIG-W. For example, it was:
- 28.2% in 2011
- 35.3% in 2014
- 41.6% in 2017Footnote 98
The proportion further increased to:
- 52.5% in 2020
- 63.7% in 2022
In a 2016 Canadian study, Karine Levasseur and Stephanie Paterson argue that "the gendered structure of the labour market is preserved and reproduced," with all its inherent disadvantages for women, by apprenticeship programs that encourage women to enter male-dominated trades without addressing underlying systemic inequalities.Footnote 99
Appendix M: Additional findings on impact of pandemic on employment outcomes
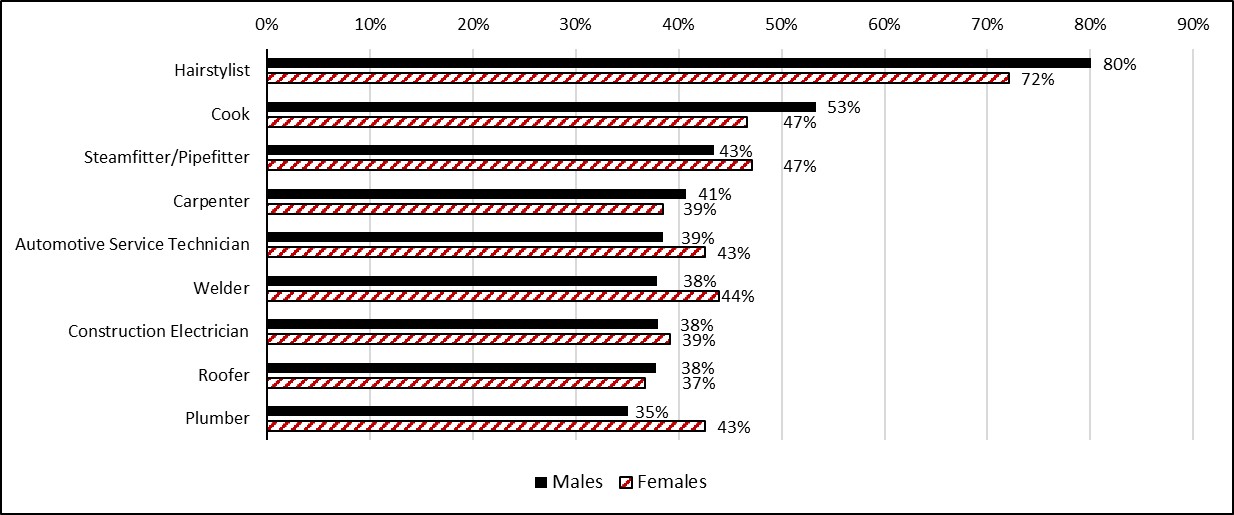
Text version - Figure 37
| Trades | Males | Females |
|---|---|---|
| Hairstylist | 80.10% | 72.10% |
| Cook | 53.30% | 46.60% |
| Steamfitter/Pipefitter | 43.40% | 47.10% |
| Carpenter | 40.70% | 38.50% |
| Automotive Service Technician | 38.50% | 42.60% |
| Welder | 37.90% | 43.90% |
| Construction Electrician | 38.00% | 39.20% |
| Roofer | 37.80% | 36.70% |
| Plumber | 35.10% | 42.60% |
Source: RAIS, 2008 to 2019; and CERB administrative file.
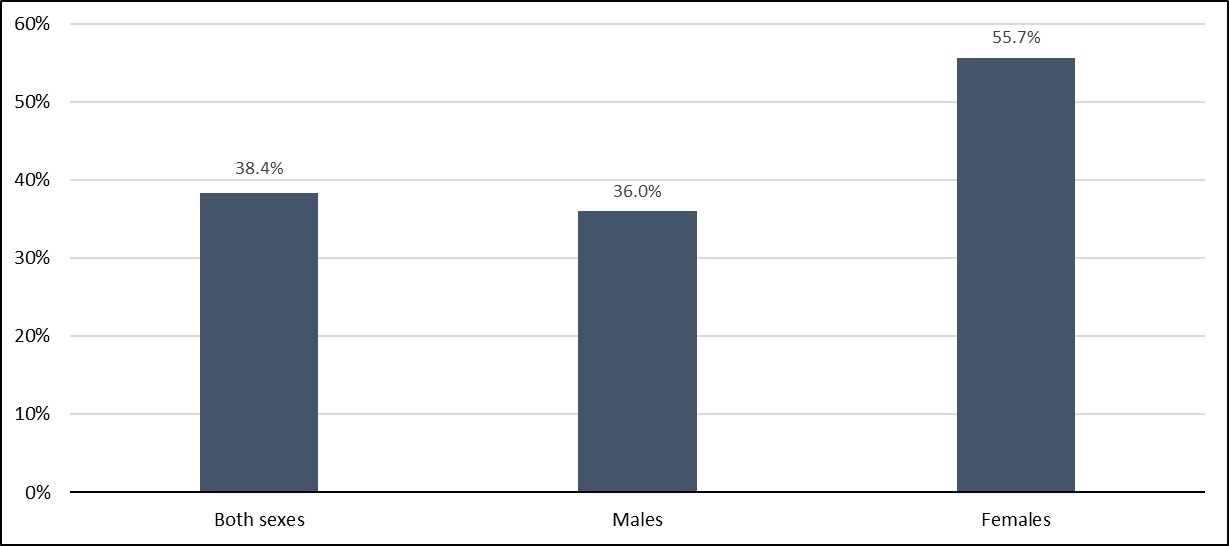
Text version - Figure 38
| Sex | Proportion |
|---|---|
| Both sexes | 38.40% |
| Males | 36.00% |
| Females | 55.70% |
Source: RAIS, 2008 to 2019; and CERB administrative file.