
Evaluation of the Canada Disability Savings Program, 2025
On this page
- List of abbreviations
- List of figures
- List of tables
- Introduction
- Executive summary
- Management response and action plan
- Program background and description
- 1. Outreach and awareness
- 2. Barriers and facilitators to opening and maintaining an RDSP
- 3. The role of the CDSG and the CDSB in motivating savings
- 4. Early impacts of the RDSP on quality of life or well-being
- Conclusion
- Recommendation and observation
- Appendices
Alternate formats

Evaluation of the Canada Disability Savings Program [PDF - 2 631 KB]
Large print, braille, MP3 (audio), e-text and DAISY formats are available on demand by ordering online or calling 1 800 O-Canada (1-800-622-6232). If you use a teletypewriter (TTY), call 1-800-926-9105.
List of abbreviations
- AHA
- Assistance Holdback Amount
- CBO
- Community-based organization
- CDSP
- Canada Disability Savings Program
- CDSG
- Canada Disability Savings Grant
- CDSB
- Canada Disability Savings Bond
- CRA
- Canada Revenue Agency
- CSD
- Canadian Survey on Disability
- DAC
- Disability Advisory Committee
- DAP
- Disability Assistance Payments
- DTC
- Disability Tax Credit
- ESDC
- Employment and Social Development Canada
- LDAP
- Lifetime Disability Assistance Payments
- MCA
- Multiple Correspondence Analysis
- PMEC
- Performance Measurement and Evaluation Committee
- PRA
- Prairie Research Associates
- SDSP
- Specified Disability Savings Plan
- SSPD
- Special Services to Persons with Disabilities
- RDSP
- Registered Disability Savings Plan
- RRSP
- Registered Retirement Savings Plan
- T1FF
- T1 Family File
List of figures
- Figure 1: First hearing about RDSPs
- Figure 2: RDSP take-up rate among eligible DTC holders under 50, by income level (%), 2010 to 2021
- Figure 3: Ease of setting up an RDSP for the first time
- Figure 4: Proportion of RDSPs in which private contributions have been made, 2010 to 2021
- Figure 5: Average contribution amounts by income level, 2010 to 2021
- Figure 6: Proportion of DTC-approved individuals aged between 0 and 49 years old from low-income families, who received either bonds only, grants only or both
- Figure 7: Proportion of DTC- approved individuals aged between 0 and 49 years old from modest-income families, who received either bonds only, grants only or both, 2010 to 2021
- Figure 8: Benefits from an RDSP
- Figure 9: Canada Disability Savings Program logic model
- Figure 10: Family income levels
- Figure 11: Proportion of RDSP beneficiaries (RDSP take-up rate) among low and modest income DTC-approved individuals and proportion of DTC-approved individuals without RDSP, by provinces and territories (%), 2021
- Figure 12: RDSP take-up rate among eligible DTC holders, by marital status (%), 2010 to 2021
- Figure 13: RDSP take-up among eligible DTC holders, by age group (%), 2010 to 2021
- Figure 14: RDSP take-up rate among eligible DTC holders, by gender (%), 2010 to 2021
- Figure 15: RDSP take-up rate among eligible DTC holders, by urban and rural areas (%), 2010 to 2021
- Figure 16: Proportion of RDSP beneficiaries who withdraw money from their account, average for 2012 to 2021 (%)
- Figure 17: Regression discontinuity analysis for low and modest income, 2020
- Figure 18: Regression discontinuity analysis for high income, 2020
List of tables
- Table 1: Management action plan
- Table 2: Distinct count of RDSP beneficiaries, as of December 31, 2023
- Table 3: CDSP financial summary (from inception to December 31, 2023)
- Table 4: CESP annual grant
- Table 5: CESP annual bond
- Table 6: CDSP annual grant
- Table 7: CDSP annual bond
- Table 8: RDSP take-up rate (2014 to 2021)
- Table 9: Examples of barriers
- Table 10: Difficulties getting approval for DTC
- Table 11: Reasons for contributing to other savings
- Table 12: Other savings plans or accounts
- Table 13: CDSP income levels and corresponding CDSG and CDSB, 2023
- Table 14: Income threshold definitions
- Table 15: Income thresholds used to determine eligibility
- Table 16: Actual spending (2017 to 2018, 2023 to 2024)
- Table 17: RDD estimation of the impact of being eligible for bonds, Low and Modest income in 2020
- Table 18: RDD estimation of the impact of being eligible for grants for high income in 2020
Introduction
The Canada Disability Savings Program (CDSP) was introduced in 2008 to encourage long-term savings into Registered Disability Savings Plans (RDSP).
The Program uses two main savings incentives to support these objectives:
- the Canada Disability Savings Grant (CDSG): an incentive paid by the Government of Canada into a RDSP based on private contributions made
- the Canada Disability Savings Bond (CDSB): an incentive for low- and modest-income individuals, paid into their RDSPs without any required contribution
This evaluation examines the effectiveness of the Program using data from 2017 to 2021, by assessing the progress made towards the achievement of the following two key outcomes:
- increased awareness among program beneficiaries, their family members, and their caregivers of the benefits of contributing to RDSPs
- increased long-term savings of beneficiaries in RDSPs
The evaluation has 5 main questions to evaluate the Program's contribution towards these outcomes:
- How have communication and outreach strategies of ESDC and other partners helped in raising awareness among persons with disabilities, their families and others (friends, former colleagues, organizations, etc.) concerning accessing the RDSP (the CDSG and/or CDSB)?
- What are the efforts made by ESDC to engage with key program stakeholders as well as provincial/territorial counterparts, with regards to the promotion of the program?
- What are the barriers or facilitators for those persons with disabilities who have been approved for the DTC and those who may provide them with support to open and maintain an RDSP?
- To what extent do the CDSG and CDSB motivate eligible beneficiaries or plan holders to save money into a RDSP?
- What are the early impacts of the program on the quality of life or well-being of program beneficiaries and/or plan holders?
Executive summary
Key findings
Improvements in communication and outreach
- ESDC collaborated with partners to improve awareness of the Registered Disability Savings Plan (RDSP) among persons with disabilities
- Mass mail-outs from CRA / ESDC were effective in encouraging beneficiaries and plan holders to open an RDSP. Community-based Organizations (CBOs) also played an important role in encouraging applications and supporting individuals to apply for and open an RDSP
- Two key areas for improvement were the need for more one-on-one support for prospective plan holders to apply for and open an RDSP, and the need to improve the targeting of outreach efforts to different situations
Ongoing barriers to opening an RDSP
- Finding knowledgeable financial institutions that offer the RDSP remains a challenge, which in some cases delays account opening. However, the process is becoming easier than in previous years
- The complexity of the application process and the effort required were common barriers for potential beneficiaries and/or plan holders
Motivating savings
- The CDSP grants and bonds motivate saving for the future
- The extent to which plan holders choose to save outside an RDSP is unclear. For those who did, it was often due to a perception that other plans were better suited to the realities of persons with disabilities
Challenges related to rules and restrictions of the RDSP
- Plan holders, beneficiaries, and other stakeholders felt that certain aspects of the RDSP were not well adapted to the specific needs and circumstances of persons with disabilities
- Key challenges were related to penalties for early withdrawals, and certain age limits associated with the eligibility for the grants and bonds
Contributing to confidence in future financial security
- The CDSP has the potential to improve the quality of life and/or well-being of beneficiaries and/or plan holders in the future, though there may be limitations in certain contexts
- The program helps improve the confidence of plan holders and beneficiaries in meeting future financial needs
- Only a small proportion of beneficiaries have withdrawn funds to date, but a significant number of those who did faced penalties for early withdrawal. The need to withdraw funds was often related to day-to-day and health/disability-related expenses
Recommendation and observation
Recommendation 1: It is recommended that the Program continue to work with, and support partners and stakeholders, particularly community-based organizations, to improve their capacity to promote the RDSP and the grant and bond, broaden outreach and communication efforts, and provide more one-on-one support as required by certain individuals to open and maintain an RDSP.
Observation 1: In light of the interdependency between the Canada Disability Savings Program (CDSP) and the Registered Disability Savings Plan (RDSP) and their respective policy objectives, the Program could work with partners to continue to explore ways to better respond to the unique needs of persons with disabilities. Focus could be placed on identifying barriers some individuals may face in opening an RDSP or realizing the full potential of the CDSP and RDSP for long-term saving.
Management response and action plan
Overall management response
The Canada Disability Savings Program (CDSP) was introduced in 2008 to encourage Canadians with severe and prolonged disabilities and their families to save for the future. The program has two main incentives to encourage savings into Registered Disability Savings Plans (RDSP): the Canada Disability Savings Grant (grant) and the Canada Disability Savings Bond (bond).
The program complements other government measures that help support financial security for people with disabilities. As the bond is available to low-and modest-income beneficiaries without requiring any contribution to the RDSP, it reflects the Government of Canada's broader commitment to poverty reduction.
Program administration and delivery are a shared responsibility among Employment and Social Development Canada (ESDC or the Department), the Canada Revenue Agency (CRA), the Department of Finance Canada, and participating financial institutions (issuers). ESDC's key responsibilities include program policy, interpretation of the Canada Disability Savings Act and Regulations, reporting on program performance, issuing statements of entitlement for grants, public outreach, and the service delivery. The Department of Finance is responsible for the savings vehicle, including the requirements for opening an RDSP and withdrawing from it.
The Department acknowledges that the responsibilities and the rules around RDSPs, the grant, and the bond are complex. The Department agrees with the recommendation and remains dedicated to promoting awareness and improving understanding of the program among the disability community. The Department also takes note of the observation and will continue to look at ways to better respond to the unique needs of persons with disabilities, while being mindful that changes to Plan requirements are the prerogative of the Department of Finance.
Recommendation
It is recommended that the Program continue to work with and support partners and stakeholders, particularly community-based organizations, to improve their capacity to promote the RDSP and the grant and bond, broaden outreach and communication efforts, and provide more one-on-one support as required by certain individuals to open and maintain an RDSP.
Management response
The Department agrees with the recommendation and recognizes the critical role that community-based organizations play in reaching persons with disabilities and helping them access the RDSP, the grant, and the bond.
The Department recognizes the importance of broadening outreach and communication efforts. The Department also acknowledges that beneficiaries have different levels of awareness and has been taking steps to ensure effective and clear communication for clients. The Department continues to collaborate with partners with the specific goal of increasing program awareness. As of December 31, 2023, there were more than 282,000 active RDSPs.
Since the last evaluation reference period ended, the Department and partner organizations undertook the following actions to promote and increase access to the program:
- in 2022, web pages for the RDSP, the grant, and the bond were redesigned to improve accessibility, clarity, and user experience, resulting in increased web traffic. Further improvements were introduced through updates to the grant and bond application forms and policy changes permitting alternative consent methods, such as electronic or recorded consent, making the application process more accessible
- in 2023, the CRA launched a fully digital Disability Tax Credit (DTC) application process, making it faster and easier for persons with disabilities and medical practitioners to complete the DTC application form
- in 2024, ESDC's Social Development Partnerships Program - Disability component (SDPP-D) started funding not-for-profit community-based organizations to help address long-standing barriers related to awareness and take-up of benefits among persons with disabilities, including but not limited to the DTC, opening an RDSP, and many provincial and territorial disability benefits. Funded organizations may provide accessible, individualized disability benefits navigation support on a one-on-one basis
- in 2024, in response to stakeholder feedback, the CDSP team developed a new plain-language infographic, outlining the steps to open an RDSP. This bilingual, accessible resource has been published online, shared via email, and distributed at events
These novel undertakings build on the continuous efforts made by the Department and its partners to actively raise program awareness. This includes CDSP's active promotion and engagement through conferences, outreach events, and webinars targeted at disability communities, both in-person and virtually. Between January and December 2024, the team delivered 76 webinars, an increase from 70 in 2023, often in collaboration with the CRA or community-based organizations. These sessions provided information on the DTC, RDSP, grant, and bond, along with practical guidance on how to open a plan and its related benefits. Additionally, to further encourage participation, CDSP has continued to issue direct mail-outs to DTC-approved individuals who have not opened an RDSP. Since 2021, over 2 million promotional letters have been issued.
Management action plan
The Department remains committed to strengthening partnerships and maximizing the program's impact within its budgetary limits. In response to the recommendation, the Department will continue working with partners to raise awareness of the RDSP, the grant, and the bond among eligible Canadians and their families.
| Element | Management action plan | Estimated completion date |
|---|---|---|
| 1.1 | Strengthen partnerships with community-based organizations to review options for improving program engagement | March 31, 2026 |
| 1.2 | Review existing communications products and work with stakeholders to improve these products and provide simpler and clearer information on RDSP, grants and bonds | March 31, 2026 |
| 1.3 | Work with ESDC's Public Affairs and Stakeholder Relations Branch (PASRB) and partners such as the Canada Revenue Agency and Service Canada to improve outreach and communication strategy | December 31, 2026 |
| 1.4 | Leverage Canada Disability Benefit (CDB) promotional efforts to increase RDSP, grant and bond awareness | December 31, 2026 |
Program background and description
In 2006, an Expert Panel appointed by the Government of Canada explored approaches to assist parents (and others) to save for the long-term financial security of persons living with disabilities. In Budget 2007, based on recommendations proposed by the Panel, the Government announced the tax-deferred Registered Disability Savings Plan (RDSP). The RDSP became available to Canadians in December 2008. It was introduced to help persons with disabilities improve their long-term financial security by providing a tool to encourage individuals and their families to save for the future.
The Canada Disability Savings Program is jointly managed by Employment and Social Development Canada and the Canada Revenue Agency, which is also responsible for administering the Disability Tax Credit. The legislative authority for the Canada Disability Savings Grant and Canada Disability Savings Bond is the Canada Disability Savings Act and the Canada Disability Savings Regulations, for which Employment and Social Development Canada is responsible. Plans are governed by the Income Tax Act, for which the Department of Finance has responsibility.
The CDSP is comprised of two federal savings incentives that the Government transfers into an active RDSP on an annual basis, including:
- the Canada Disability Savings Grant (CDSG) - an incentive paid by the Government of Canada into a RDSP if the required contributions are made
- the Canada Disability Savings Bond (CDSB) - an incentive paid to low- and modest-income individuals without any required contribution
The CDSG amount is determined based on the value of the personal contributions and varies based on the beneficiary's adjusted net family income. The contribution matching rate is higher for low and modest-income families. In addition, eligible low- and modest-income families can obtain the CDSB without having to make personal RDSP contributions.
The Government CDSG and CDSB are available to eligible beneficiaries up to December 31st of the year that they turn 49. Withdrawals must commence by December 31 of the year the beneficiary turns 60. At any age, withdrawals can be made without repayment obligation if more than 10 years have elapsed since the last grants and bonds were paid into the plan.
Eligibility
To be eligible for the RDSP, an application for the Disability Tax Credit (DTC) must have been submitted to the Canada Revenue Agency for the intended beneficiary and they must have been deemed eligible for the credit by the agencyFootnote 1. To be eligible for the DTC, individuals must have an impairment in physical or mental functions that is severe and prolonged, resulting in a marked restrictionFootnote 2.
The DTC is a non-refundable tax credit that can be claimed by eligible individuals to reduce taxes owing, in recognition of their non-itemizable disability-related costs.
The RDSP is not the only program whose eligibility is tied to the DTC. Other programs include the Child Disability Benefit and the Canada Workers Benefit Disability Supplement as well as the newly introduced Canada Disability Benefit.
Assistance Holdback Amount
The total grant and bond that has been deposited into an RDSP within the previous 10 years is referred to as the Assistance Holdback Amount (AHA)Footnote 3.
Regular withdrawals from the plan must begin by December 31 in the year the beneficiary turns 60. A beneficiary may withdraw money from the account prior to age 60, subject to the terms and conditions of a particular RDSP. However, they may need to repay some, or all, of the Canada Disability Savings Grant (CDSG) and Canada Disability Savings Bond (CDSB) when making a withdrawal. To discourage early withdrawals, withdrawals before the age of 60 are subject to repayment of some or all grant and bond that has been deposited into the RDSP within the previous 10 yearsFootnote 4.
The RDSP is a long-term savings plan. As such, the CDSG and CDSB are intended to encourage long-term savings and must generally remain in an RDSP for at least 10 years. When money is withdrawn, generally all or part of the Assistance Holdback Amount (i.e., grants and bonds that have been in the RDSP for fewer than 10 years) must be repaid to the Government. However, through the Specified Disability Savings Plan, beneficiaries with a shortened life expectancy (i.e., of five years or less) can withdraw up to $10,000 per year in taxable savings without any requirement to repay grant and bond amounts, subject to certain conditions.
Key actions since the 2019 evaluation
Since the last evaluation report of the CDSP in 2019, the Government took action to increase access to the CDSP and RDSP, and provide better support to persons with disabilities, including the following:
- 2019: The requirement to close an RDSP and repay grants and bonds when a beneficiary no longer qualifies for the Disability Tax Credit is eliminated
- 2021: Eligibility criteria for the Disability Tax Credit are revised to better recognize mental functions necessary for everyday life, and time spent on life-sustaining therapy. Amendments are also made to deem individuals with Type 1 Diabetes as meeting the updated criteria
- 2023: To improve access to RDSPs and ensure family members can replace each other as plan holder when one of them dies, Budget 2023 expanded the definition of a qualifying family member to include siblings of the RDSP beneficiary and provided an extension of the measure until the end of 2026
- 2023: The Canada Disability Benefit Act receives Royal Assent. Under the Act, a new Canada Disability Benefit will be provided annually by the federal government to support low-income, working-age Canadians, who are eligible for the DTC
- 2023: The Canada Revenue Agency launches a fully digital application process, making it faster and easier than ever for persons with disabilities and their medical practitioners to complete the Disability Tax Credit application form
- 2025: The Canada Disability Benefit Regulations came into force in May. It is expected that payments will begin in July 2025, providing up to $2,400 annually
Cumulative number of RDSP beneficiaries
Between the introduction of the RDSP in 2008 and December 2023, 303,389 RDSPs have been opened by persons with disabilities or their families/caretakers.
| Description | Persons |
|---|---|
| Cumulative number of RDSP beneficiariesFootnote 5 | 303,389 |
| Number of beneficiaries with an active RDSPFootnote 6 | 282,210 |
- Source: Employment and Social Development Canada (ESDC, 2025), Canada Disability Savings Program: 2023 Annual Report
By the end of 2023, a total of about $4.48B CDSG payments and a total of about $1.86B CDSB payments were made into these plans. During the same period, personal contributions made amounted to approximately $2.93B.
| Description | Amounts (billions $) |
|---|---|
| Cumulative contributions | 2.93 |
| Cumulative CDSGFootnote 7 | 4.48 |
| Cumulative CDSBFootnote 7 | 1.86 |
- Source: Employment and Social Development Canada (ESDC, 2025), Canada Disability Savings Program: 2023 Annual Report
Comparing the CDSP with the CESP
The CDSP provides higher annual maximum amounts and cumulative ceilings for bonds and grants than similar savings programs. However, obtaining the maximum $90,000 in grants and bonds available from the RDSP requires meeting various eligibility requirements. Some beneficiaries may not meet the thresholds to obtain the maximum or partial bond, or the most advantageous matching rates. Some beneficiaries and their families may not be able to make sufficient personal contributions to receive the full grant amount.
| Adjusted family net income for 2024Footnote 8 | Basic CESG on the first $2,500 of annual RESP contribution | Additional amount of the CESG on the first $500 or less of annual RESP contribution | Maximum yearly CESG depending on income and contributions | Lifetime maximum CESG (basic and additional combined) | Lifetime limit contribution | Annual limit of CESG (basic and additional combined) |
|---|---|---|---|---|---|---|
| Less than $55,867 | 20% = $500 | 20% = $100 | $600 | $7,200 | $50,000 | $600 or $1,100 with carry forward |
| Between $55,867 and $111,733 | 20% = $500 | 10% = $50 | $550 | $7,200 | $50,000 | $550 or $ 1,050 with carry forward |
| More than $111,733 | 20% = $500 | Beneficiary is not eligible | $500 | $7,200 | $50,000 | $500 or $1,000 with carry forward |
| Adjusted family net income for 2024 | Less than $55,867 | Between $55,867 and $111,733 | More than $111,733 |
|---|---|---|---|
| No contribution required | $500 first year, plus $100 for each year of eligibility | Not eligible | Not eligible |
| Lifetime maximum of Canada Learning Bond | $2,000 | Not eligible | Not eligible |
| Adjusted family net income for 2024 | $111,733 or less | More than $111,733 |
|---|---|---|
| Grant depending on income and contributions | $111,733 or less | More than $111,733 |
| Maximum yearly CDSG depending on income and contributionsFootnote 9 | First $500 is matched at 300% = $1,500 Next $1,000 is matched at 200% = $2,000 |
First $1,000 is matched at 100% = $1,000 |
| Lifetime maximum of CDSG | $3,500 | $1,000 |
| Lifetime limit of contribution | $70,000 | $70,000 |
| Adjusted family net income for 2024 | $36,502 or less | Between $36,502 and $55, 867 |
|---|---|---|
| No contribution requiredFootnote 10 | $1,000 | Less than $1,000 |
| Lifetime maximum | $20,000 | $20,000 |
1.Outreach and awareness
1.1 ESDC worked with partners to improve awareness of the RDSP
Since the previous evaluation in 2019, a broader and more diverse approach to engaging with potential beneficiaries has been a focus of the Program.
ESDC worked with partners to enhance communication and outreach strategies in efforts to improve awareness of the RDSP among persons with disabilities and their families/caregivers. Key examples of these efforts included:
- the implementation of easier-to-read materials
- mass mail outs
- improvements to website information accessibility
- webinars, training for issuers
- increased partnerships with non-governmental organizations
The promotional efforts most frequently identified by key informants includeFootnote 11:
- Communication from the Government of Canada, such as:
- the ESDC/CRA mailouts (22/37)
- joint ESDC/CRA presentations or webinars for community-based organizations (CBOs) (11/37)
- the Government of Canada website (14/37)
- Communication from community-based organizations, such as:
- general advertising or awareness building (10/37)
- one-on-one support to potential beneficiaries (7/37)
- workshops and information sessions (7/37)
- the provision of information (responsive) (6/37)
- Communication from financial institutions, such as:
- bank web pages (9/37)
- a centralized call line (8/37)
- paper educational materials, and the provision of information through unrelated interactions such as meetings with bank staff (4/37)
- Communication from provinces and territories, such as:
- participation in action groups or committees (6/37)
- grants to community-based organizations (5/37)
- web pages (3/37)
- financial incentives (2/37)
The survey results show that RDSP holders first learned about the Plan through both formal and informal channels.
The most frequently identified channels of information were the following:
- CRA and other federal departments (22%)
- organizations serving persons with disabilities (17%)
- friends and family members (17%)
RDSP holders learn about the program from a variety of stakeholders including the government, community-based organizations, banks or financial institutions, independent financial advisors, medical professionals, accountants or provincial governments.
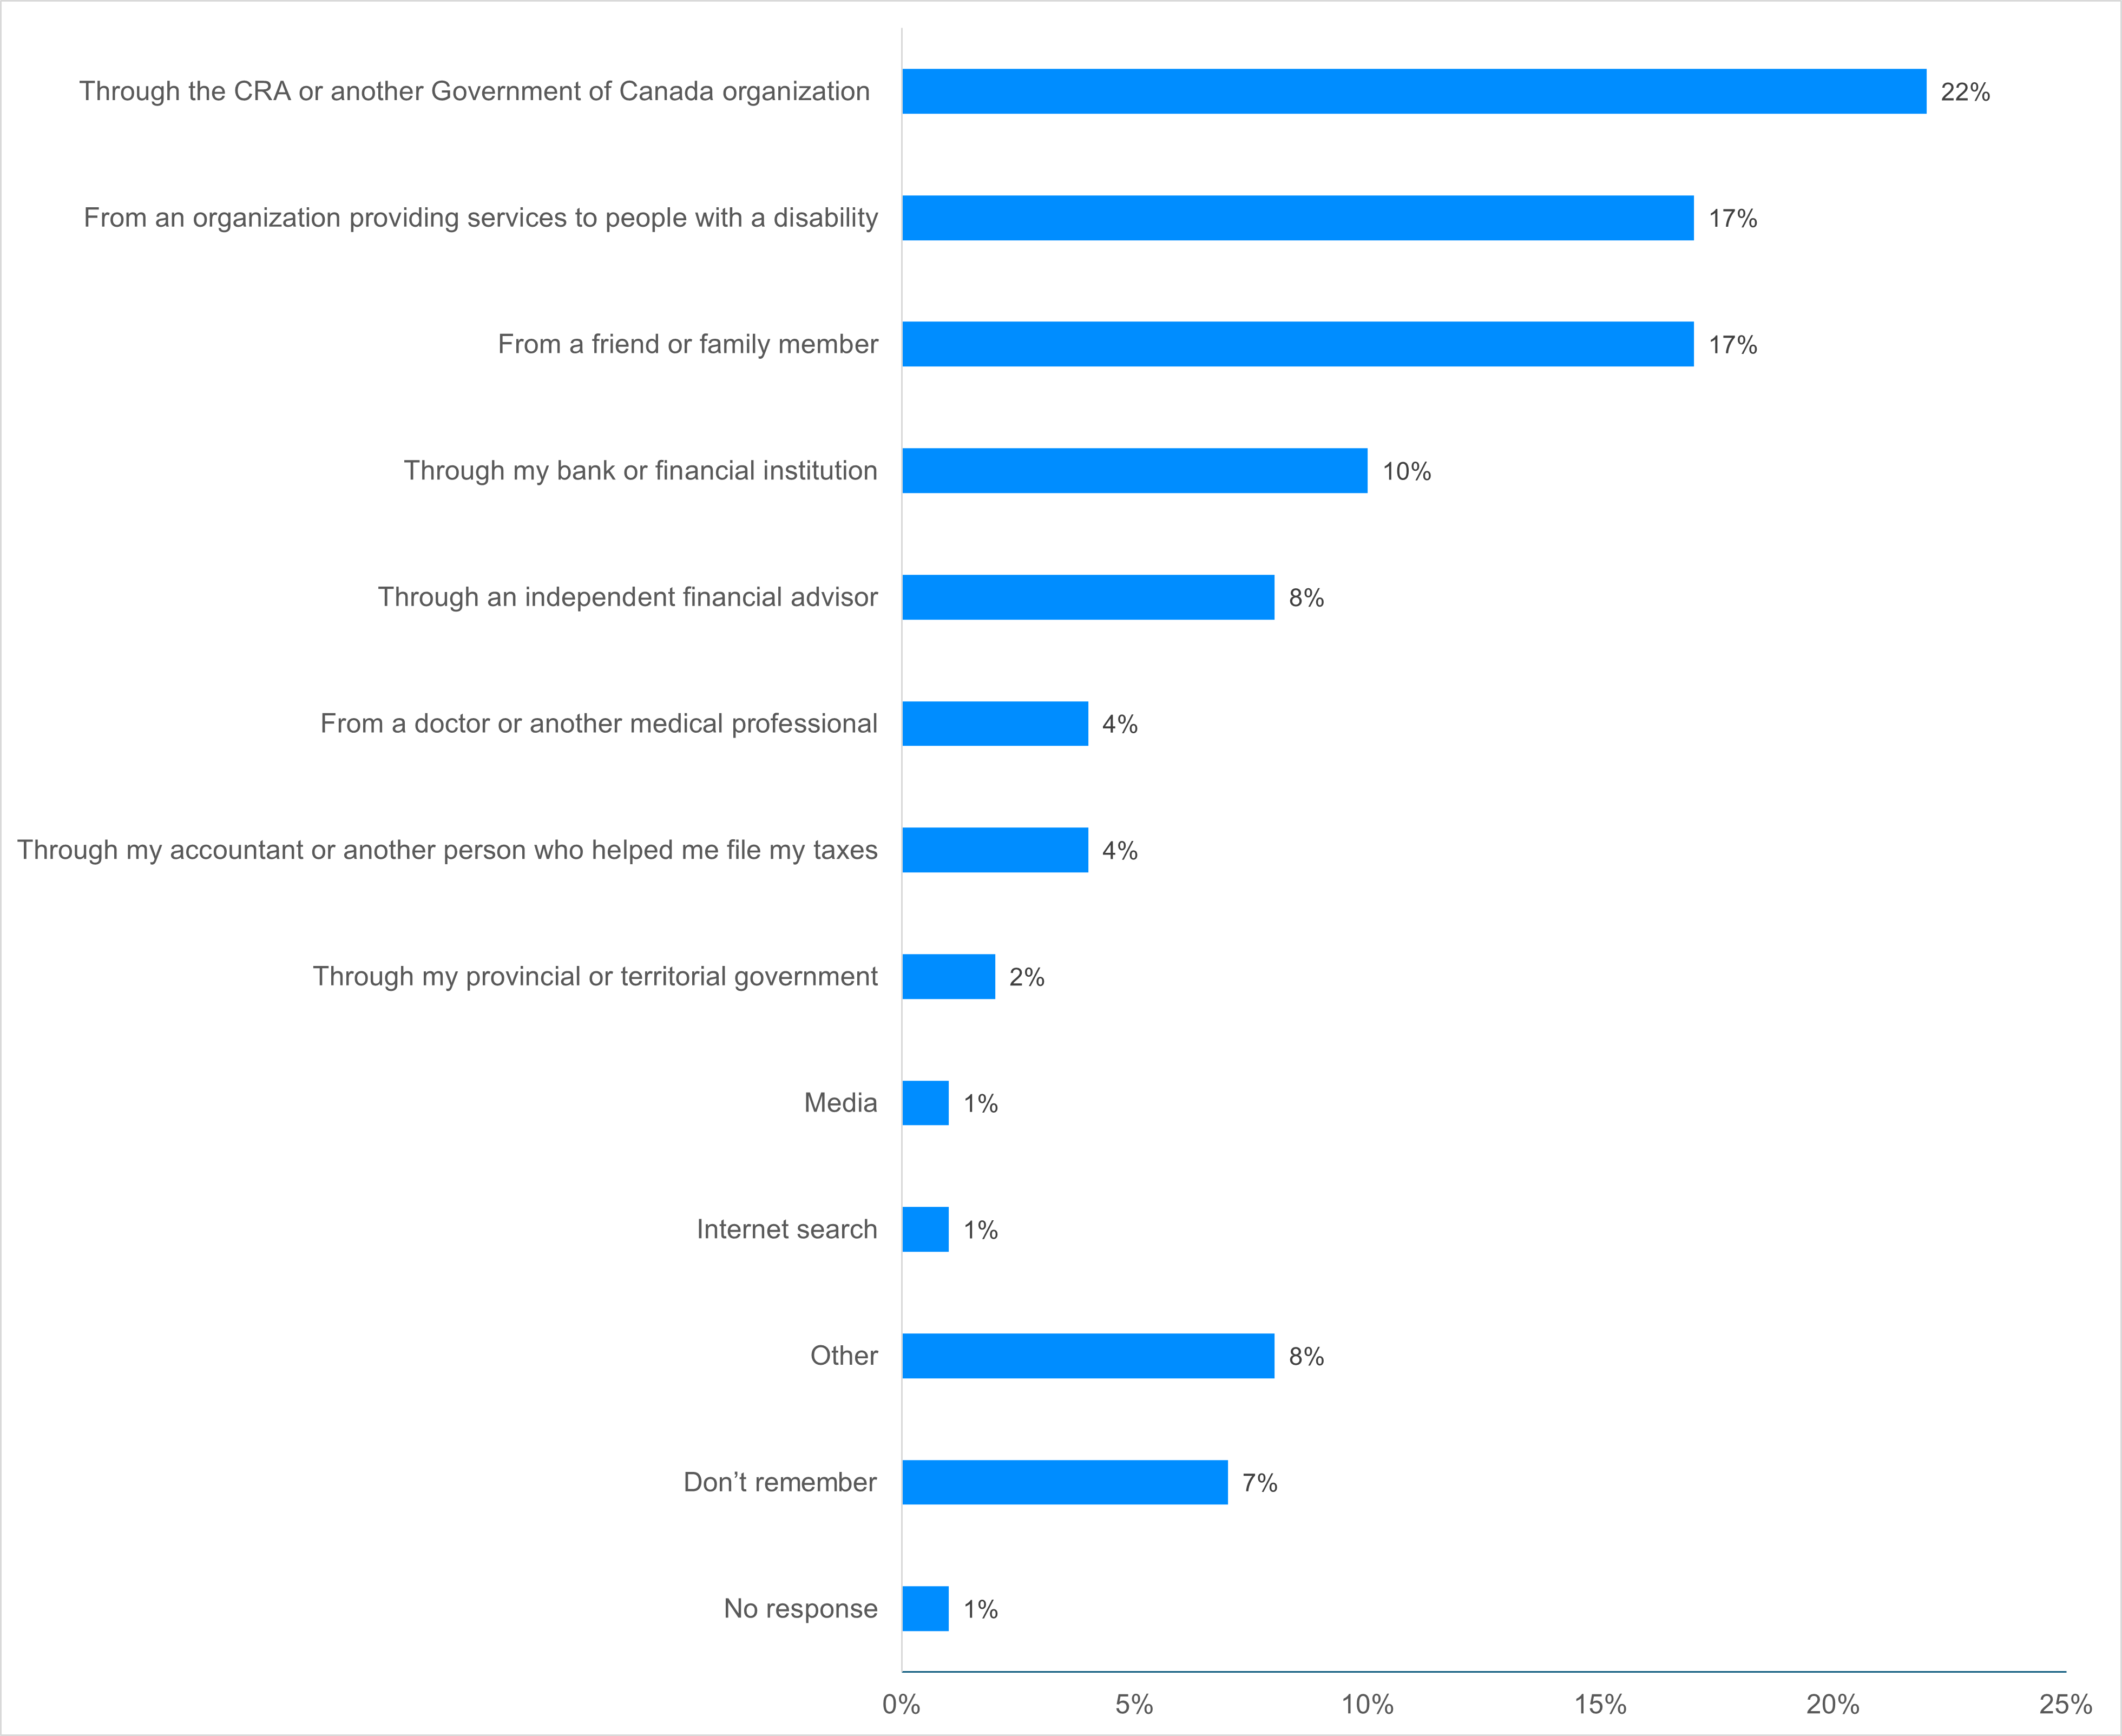
Figure 1: Text description
| Response | Proportion (%) |
|---|---|
| Through the Canada Revenue Agency or another Government of Canada organization | 22% |
| From an organization providing services to people with a disability | 17% |
| From a friend or family member | 17% |
| Through my bank or financial institution | 10% |
| Through an independent financial advisor | 8% |
| From a doctor or another medical professional | 4% |
| Through my accountant or another person who helped me file my taxes | 4% |
| Through my provincial or territorial government | 2% |
| Media | 1% |
| Internet search | 1% |
| Other | 8% |
| Don't remember | 7% |
| No response | 1% |
- Source: PRA (2024). Survey for the Evaluation of the CDSP, conducted for ESDC’s Evaluation Directorate. Unpublished technical report.
- Note: Figure 1 shows the different communication channels through which RDSP holders heard about the RDSP for the first time, based on responses to the following survey question: “Q18. Thinking back to when you first opened an RDSP, how did you first hear about this type of savings plan?” Respondents could give more than one answer; therefore, results will sum to more than 100%. The following three categories represent less than 1% of responses each: media, internet search and no response.
1.2 Mass mail-outs from CRA / ESDC were well-recognized and encouraged some individuals to open an RDSP
The most effective form of outreach appeared to be mass mail-outs from CRA / ESDC and other federal departments/agencies serving persons with disabilities:
- The most recognized formal communication among focus group participants was mail-outs from CRA or other government agencies that serve persons with disabilities.
- Some (11/37) key informants, most of whom were from financial institutions (6/11), suggested that the inclusion of information about the RDSP in communications from ESDC and CRA is an effective promotional strategy. However, a few (4/37) suggested that these mailouts could be more effective. For example, one informant said that the letters do not always reach the right targets since they only go to those who have been approved for the DTC.
- According to a few informants (3/37), the webinars and in-person sessions, including tax clinics, are also effective in conveying information about the RDSP.
Community-based organizations (CBOs) also played a role in encouraging and supporting applications to the RDSP. While promotion by CBOs was not as well-recognized as government sources of outreach, some considered it to be effective, often because CBOs are well-placed to reach and provide one-on-one application support to persons with disabilities:
- A few informants (5/37) suggested that CBOs are effective promoters of the program or are the type of organization most suited to promoting the program. A few (5/37) also said that the one-on-one support that they provide is very effective. However, informants (2/27) noted that there is no coordinated strategy among CBOs or that there is a need for more of them to promote the program (4/37).
- A few informants (4/37) suggested that promotion by CBOs is limited or non-existent. Thus, their efforts appear to be effective but not widespread.
- Focus group participants also indicated that communication from CBOs was informal and did not seem to be part of a formal outreach program.
Few plan holders, beneficiaries or stakeholders spoke about outreach and promotion by provincial and territorial partners. However, those that did found it to be informal:
- When focus group participants heard about the program through provincial agencies, it was usually through informal means, such as word of mouth from an employee.
Most plan holders, beneficiaries and stakeholders indicated that any promotion by financial institutions was primarily passive:
- When discussing promotion by financial institutions, some informants (14/37) mentioned various forms of passive promotion such as bank web pages (9/37) and a centralized call line (8/37).
1.3 Some stakeholders and partners felt that communication and outreach to their organization could be improved to help them better promote and support the delivery of the RDSP
Outreach
Most informants (5/8) from financial institutions suggested that the federal government should do more to promote the program to the public, through means such as additional promotion or advertising of the program and of the existence of independent financial advisors.
Some informants (3/7) from provincial government organizations also suggested that the federal government should do more to promote the grants and bonds.
Some informants (13/37) mentioned support provided by ESDC for CBOs such as webinars on the Program and attending in-person events. A few informants also referred to information that ESDC provides to help support CBOs with program promotion (5/37).
While most informants from CBOs (7/12) indicated that they were not aware of any tools or supports provided by ESDC, some (5/12) specified certain ESDC tools or supports that were helpful, such as:
- the package of information that is provided during tax clinics
- contacts and emails
- webinars/seminars or in-person sessions
- the website
- the availability of information in a variety of formats
Informants also had many suggestions for improving outreach to CBOs, such as:
- providing additional communication materials for use with their clients
- more information about specific topics, such as the withdrawal rules
- a dedicated contact person
- providing more training on the RDSP for their staff
Informants from CBOs discussed the accessibility of the Program website and expressed mixed views. A third of those who commented said that the format was accessible (4/12), while almost half (5/12) said that the website's accessibility could be improved.
Additionally, the majority of CBO informants (9/12) said that the content of the website was not clear enough, or that some of their clients might find it overwhelming.
Delivery
A few key informants (6/37) mentioned that ESDC provides financial institutions with training or webinars. However, a few informants (4/27) from the provinces and from CBOs suggested providing more training for financial institutions.
Additionally, half of the informants (4/8) from financial institutions suggested that ESDC could provide more information or improve communications with their organizations to facilitate their ability to open and maintain RDSPs. For example, a few informants asked if ESDC could provide them with information about clients' DTC eligibility or offer a contact that they could reach out to with questions about specific cases.
On the other hand, some informants (3/8) from financial institutions indicated that no additional tools or supports were needed, or that they were satisfied with the current tools. Financial institution informants also commented on specific tools that were useful.
Collaboration
A few informants (6/37) mentioned ESDC's or CRA's engagement with the provinces and/or territories through different activities such as participation in action groups or committees. However, a few informants (3/27) from provincial government and community-based organizations felt that there were opportunities to enhance engagement with ESDC.
While a few informants (5/37) mentioned grants to CBOs as a form of collaboration and support, a few informants (3/27) from provincial government and community-based organizations suggested adopting a more sustained and coordinated approach to supporting promotion of the Program amongst CBOs.
Some (3/12) informants from CBOs specifically suggested that they would be interested in additional collaboration with ESDC.
1.4 There is a need for more one-on-one support and improved targeting of outreach efforts to better enable some potential beneficiaries to open an RDSP
Despite the general effectiveness of certain outreach and communication efforts to promote the RDSP, there are two key barriers that either prevent certain individuals from opening an RDSP or from maximizing their contributions to the Plan, including the need for more one-on-one support after raising awareness and the limitations of communication and outreach efforts.
Need for more one-on-one support after raising awareness
Some informants (15/37),Footnote 13 including informants from all stakeholder groups and the majority of provincial/territorial government stakeholders (5/7), suggested that there is a need to provide more one-on-one support with applying for an RDSP following efforts to raise awareness.
Some informants (9/37) pointed out that the program can only benefit those who manage to open the RDSP, alluding to the barriers that some persons with disabilities or caregivers experience when accessing the Program.
Furthermore, some informants (5/37) indicated that the RDSP is easy to understand and access for some but less so for others.
A few (2/37) also indicated that marketing of the RDSP is effective, but that other elements of the Plan deter people, and that one-on-one support could help them better understand the complex elements.
Limitations of communication and outreach efforts
Some felt that the way outreach is targeted, and its timing, may be preventing certain individuals from maximizing their lifetime contributions.
Participants in several focus groupsFootnote 14 mentioned that the government should better promote the RDSP, especially early on in a person's disability, to allow more time for contributions.
Some participants felt they learned about the program too late, missing out on years of potential contributions due to lack of awareness.
A few informants (3/37) felt that the promotional strategies tend to be more appropriate for individuals with higher levels of financial literacy, hinting at the complexity of the RDSP and its rules for some people.
A few (2/37) informants felt that promotion tends to be directed at families with children rather than adults, so those who become disabled later in life might not become aware of the program in a timely manner to maximize the benefits.
1.5 From 2014 to 2021, the RDSP take-up rates increased.
According to the Program data in Table 8, take-up rates for the RDSP among all income levels increased between 2014 and 2021.
| Years | 2014 | 2015 | 2016 | 2017 | 2018 | 2019 | 2020 | 2021 |
|---|---|---|---|---|---|---|---|---|
| RDSP Take-up Rate (%) | 22.1 | 24.3 | 29 | 31.2 | 33.7 | 34.7 | 35.1 | 36.7 |
- Source: Employment and Social Development Canada (ESDC, 2025), Canada Disability Savings Program: 2023 Annual Report
The data used for Table 6 and Table 7 are drawn from the program's 2023 annual report. In the rest of the report some of the results come from quantitative analysis carried out at Statistics Canada via the linking of CDSP administrative data and personal income tax data. Among key limitations associated with the linking of both databases is the exclusion of beneficiaries under 19 years of age with no tax return. Therefore, results from this analysis should be interpreted accordingly and discrepancies may arise relative to the results presented in the program's annual report based on the entire population.
1.6 From 2010 to 2017 the take-up rates for low- and modest-income DTC-approved individuals increased steadily but started to slow around 2018.
The RDSP take-up rates in the low and modest family income groups increased steadily between 2010 and 2017 but were mostly stable between 2018 and 2021. The take-up rates for the low and modest family income groups increased from 20% and 10% in 2010 to 44% and 32% in 2017, respectively.
From 2014 to 2021, the take-up rates for DTC-approved individuals in the lowest and highest income groups were similar and exceeded those for the two intermediate income groupsFootnote 16. In 2021, for example, the take-rates for the "low family income" and "high family income level II" groups were 44.4% and 50.5% respectively, while those for the "modest family income" and "high family income level I" groups were 33.4% and 38.6%, respectivelyFootnote 17.
Appendix E provides additional information on the different income levels over time.
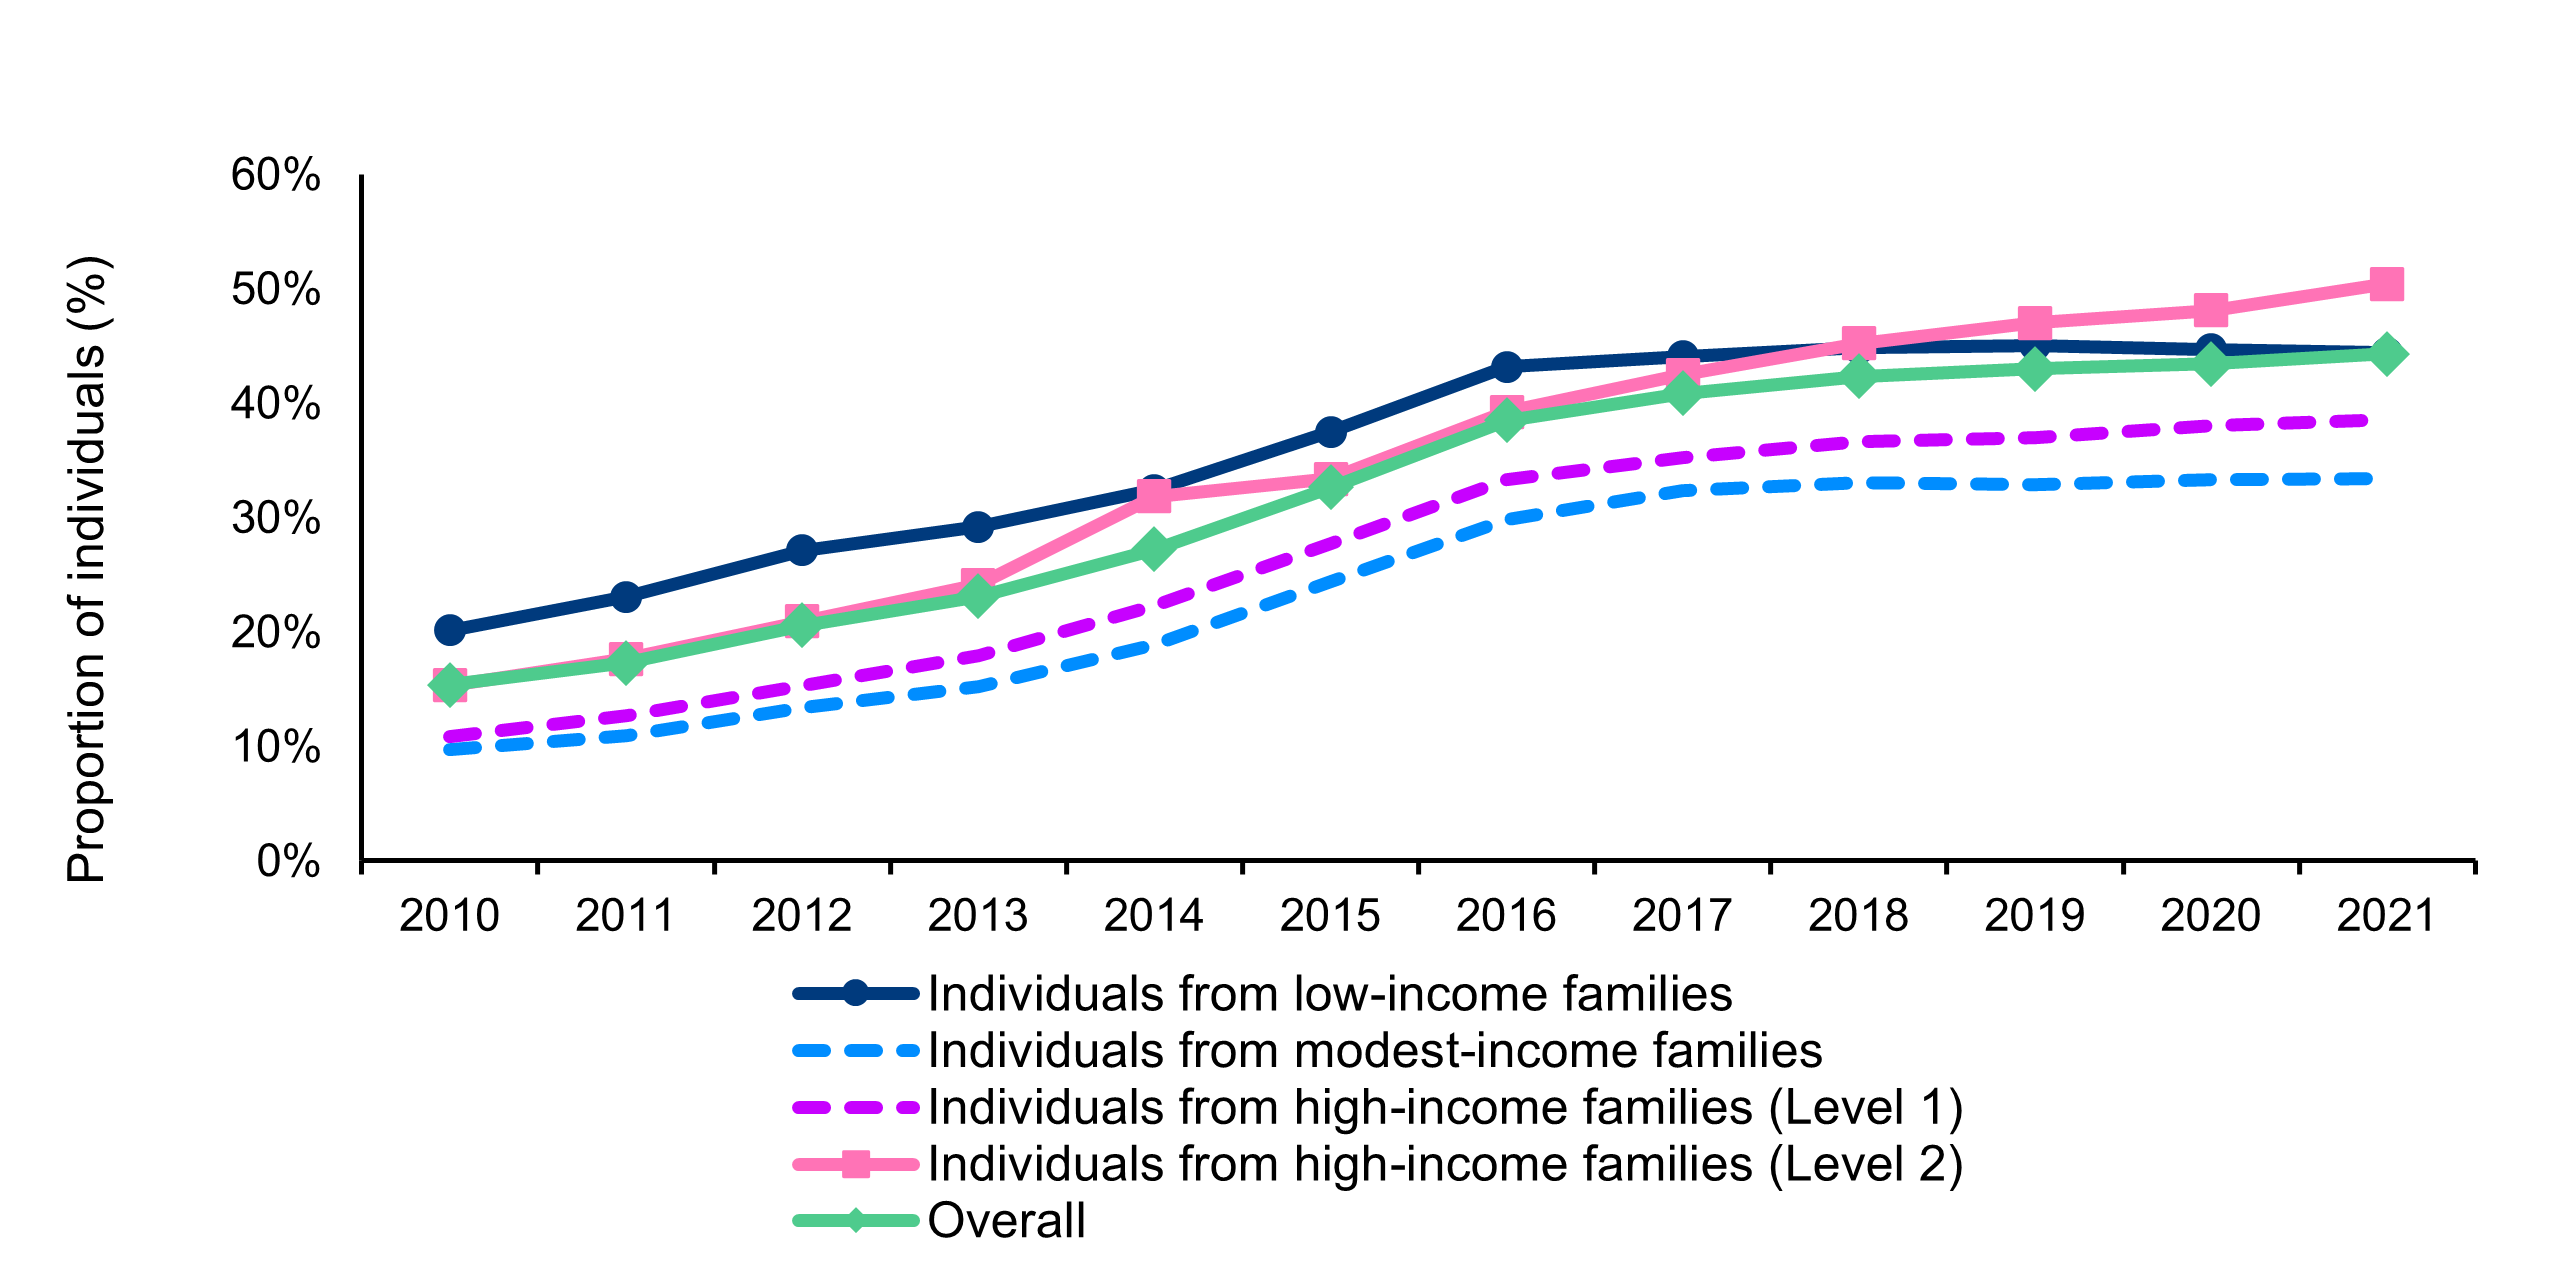
Figure 2: Text description
| Year | Proportion of individuals from low-income families (%) | Proportion of individuals from modest-income families (%) | Proportion of individuals from high-income families (Level 1) (%) | Proportion of individuals from high-income families (Level 2) (%) | Proportion of individuals overall (%) |
|---|---|---|---|---|---|
| 2010 | 20% | 10% | 11% | 15% | 15% |
| 2011 | 23% | 11% | 13% | 18% | 17% |
| 2012 | 27% | 13% | 15% | 21% | 21% |
| 2013 | 29% | 15% | 18% | 24% | 23% |
| 2014 | 32% | 19% | 22% | 32% | 27% |
| 2015 | 37% | 24% | 28% | 33% | 33% |
| 2016 | 43% | 30% | 33% | 39% | 39% |
| 2017 | 44% | 32% | 35% | 42% | 41% |
| 2018 | 45% | 33% | 37% | 45% | 42% |
| 2019 | 45% | 33% | 37% | 47% | 43% |
| 2020 | 45% | 33% | 38% | 48% | 43% |
| 2021 | 44% | 33% | 39% | 50% | 44% |
- Source: Employment and Social Development Canada (2025). Technical Report: Evaluation of the CDSP using linked administrative data
1.7 Certain aspects of the RDSP were identified as not well suited to the specific needs and circumstances of persons with disabilities
One aspect of the RDSP identified by focus group participants and key informants as being well-suited to the needs of persons with disabilities was the fact that the RDSP does not impact most provincial disability and income assistance benefits provided to the beneficiary, unlike other investments.
Focus group and interview participants, including RDSP account holders, beneficiaries and other stakeholders and partners, did not feel that the RDSP was well adapted to the unique circumstances or needs of persons with disabilities. They highlighted the following areas that could be improved to better meet the needs of persons with disabilities:
- penalties associated with early withdrawals
- age limit of 49 years for the grants and bonds
- perception of an age requirement of 60 before withdrawals begin
Penalties associated with early withdrawals
- The majority of interview informants (24/37) suggested that the penalties associated with early withdrawals were a source of concern for potential applicants or RDSP holders. It was often highlighted that they may be forced to withdraw the money due to factors such as unpredictable or imminent needs or expenses and/or financial strain or low income. Informants also mentioned that those who withdraw money early do so to meet urgent financial needs. In half of these cases, they withdraw money to pay for health-related expenses
- Some informants also suggested that time periods associated with withdrawals as per the AHA and the penalties are inappropriate for those with shorter or uncertain life expectancies. While beneficiaries can be eligible for exceptions from the AHA if they meet certain criteria, those who discussed this option felt that these criteria are too difficult to meet
- Some focus group participants felt that an increased flexibility of the RDSP to allow for early withdrawal, without triggering repayment, for sudden expenses related to their health or disability would better suit the unique circumstances of persons with disabilities
Age limit of 49 years for the grants and bonds
- In a few focus groups, there was confusion about why participants could no longer receive matching CDSGs for their contributions after the year in which they turn 49 years old. It was highlighted that other government programs (e.g., RRSPs) have a much higher age for ability to contribute and receive benefits (i.e., tax benefit for contributions)
- A few informants (10/37) also mentioned that the program does not benefit those who are over the age of 49 or close to that age when they sign up. Some persons with disabilities might discover their disabilities later in life and would therefore not benefit at all or as much from the grants and bonds. It was felt that the additional years of the CDSG after 49 could better help people in these situations to build savings to contribute to their financial security later in life
Perception of an age requirement of 60 before withdrawals begin
- While withdrawals from an RDSP must commence no later than the year that a beneficiary turns 60, there is a perception among multiple stakeholders, partners and beneficiaries that funds cannot be withdrawn without penalty until age 60. However,, withdrawal can generally be made without penalty 10 years after the last grant or bond is received
- Some interview informants (15/37) also suggested that the mandatory age to commence withdrawals should not be age 60, to allow for those who might want to start withdrawing from their RDSP after age 60Footnote 18
- In a few of the focus groups, both beneficiaries and their families/caregivers mentioned that the program should not have a set age of 60 for people to start withdrawing funds because people with a disability do not typically live to, or much beyond, that age
- While the Program has the Specified Disability Savings Plan, a few informants (4/37) indicated that it does not work for everyone with shorter life expectancies. For example, it may not be suitable for those whose life expectancy exceeds five years but remains uncertain, or for those experiencing administrative barriers to accessing the SDSP
| Description | Example | Citation |
|---|---|---|
| Complexity of RDSP and withdrawal rules | The complexity of withdrawal rules can deter people from opening an RDSP. The fear of losing money or having to repay grants and bonds can be overwhelming and deter individuals from contributing to an RDSP | "Yeah, it's a complex plan type to say the least. It's the withdrawal rules are pretty complicated in terms of what you can receive and when you can receive it." |
| Assistance Holdback Amount | The AHA requires government contributions to remain in the RDSP for at least 10 years, which can be challenging for certain beneficiaries. | "The other thing I, but in terms of the RDSP, is if you have an individual, right, with a cognitive impairment or somebody who qualifies but there's a risk, you know, they have very poor judgment and they will not-and it's a savings venue. They might go spend that money, right? There's nothing to stop them from spending the money within that 10 years and having to pay it back, creating a debt." |
| Uncertainty of Life Expectancy and Lifetime Disability Assistance Payment formula | For individuals with uncertain life expectancies, planning for the long term can be challenging, leading to early withdrawals. | "They may not live until 83, right? They may be passing away in their 50s or their 60s. So, parents are saying, well, why am I going to put money away in this vehicle? Why am I going to manage this plan and divert my attention to investing monies in this plan if they've got to wait 10 years after the date of the last government contribution?" |
John's experience with the RDSP
John, a single man aged 20 to 24, has a permanent disability affecting his mobility and is employed part-time. He opened his RDSP in 2013 to benefit from the Bond and Grant without impacting other benefits. He faced significant challenges applying for the Disability Tax Credit (DTC) and had to reapply several times. He found the process complex due to the rules and challenges recognizing his disability. Opening his RDSP was neither easy nor difficult, but he struggled to understand the RDSP, CDSG, and CDSB rules. He also faced challenges obtaining specific information from his financial institution regarding RDSPs and felt that financial institutions were not very helpful in maximizing RDSP benefits. As of 2024, his RDSP balance is $28,000, including $20,000 in personal contributions and $8,000 from the CDSP. John expressed frustration with early withdrawal penalties and difficulty accessing funds before age 60.
Note: The case studies presented in this report are intended to illustrate individual experiences of respondents and contain inaccuracies about the program's rules and procedures. These examples provide insight into respondent's perspectives and not official policy.
2. Barriers and facilitators to opening and maintaining an RDSP
2.1 It is becoming easier to find knowledgeable financial institutions who offer the RDSP, but there are ongoing challenges for some.
Across the different lines of evidence for the evaluation, participants identified ongoing challenges with finding financial institutions who are sufficiently knowledgeable about the RDSP. This created delays in opening RDSPs for some potential account holders.
However, finding a knowledgeable institution is becoming easier than in the past. Those with more recent experiences with the RDSP tended to report fewer barriers related to finding knowledgeable staff in financial institutions than those with experience in the earlier years of the Program.
When discussing barriers to opening or maintaining RDSPs, the majority of informants (20/37) identified barriers associated with financial institutions.
Some interview informants (14/37) and focus group participants suggested that staff from financial institutions lack sufficient knowledge of the RDSP, although many of these informants did not differentiate between frontline staff or staff who work in centralized RDSP teams within banks.
In almost all focus groups, participants felt that it was difficult to find individuals within their financial institutions who were knowledgeable about the RDSP. This left a lot of unanswered questions and confusion about the program.
In a few groups, participants mentioned having to work with a specialist in their institution. This specialist was often located in another city or province which made opening the RDSP difficult, because of issues with scheduling and communication.
Focus group participants who opened an RDSP early in the Program lifecycle encountered significant barriers such as finding a financial institution that offered the program, finding people within these institutions who were knowledgeable about the program, or finding information about the program more generally. However, those who opened an RDSP more recently reported experiencing fewer of these barriers.
In almost all focus groups, participants believed that people within their institutions have become more knowledgeable about the program. At the same time, participants in some groups say that they still do their own research and often know more about the program than those they interact with at their financial institutions. Participants in some groups felt that there could be more training for financial institutions in how to properly administer it.
When working with their financial institution or advisor to open an RDSP, survey respondents reported the greatest ease with obtaining an appointment with someone who is knowledgeable about RDSPs and understanding the right amounts to contribute to the RDSP, with 22% of respondents saying each of these was "very easy." This was followed by understanding the eligibility requirements for the Canada Disability Savings Bond, which 20% found "very easy" and 28% found "somewhat easy."
Respondents had the least ease in understanding when it will become possible to withdraw funds without penalty from some or all of the CBSGs and/or CDSBs received, and how much money could then be withdrawn annually or monthly. Only 10% of respondents said this was "very easy" and only 17% said this was "somewhat easy."
Therefore, survey respondents appeared to find financial institutions more knowledgeable about topics related to opening and contributing to the account, and less knowledgeable about specific rules and restrictions after the account is opened.
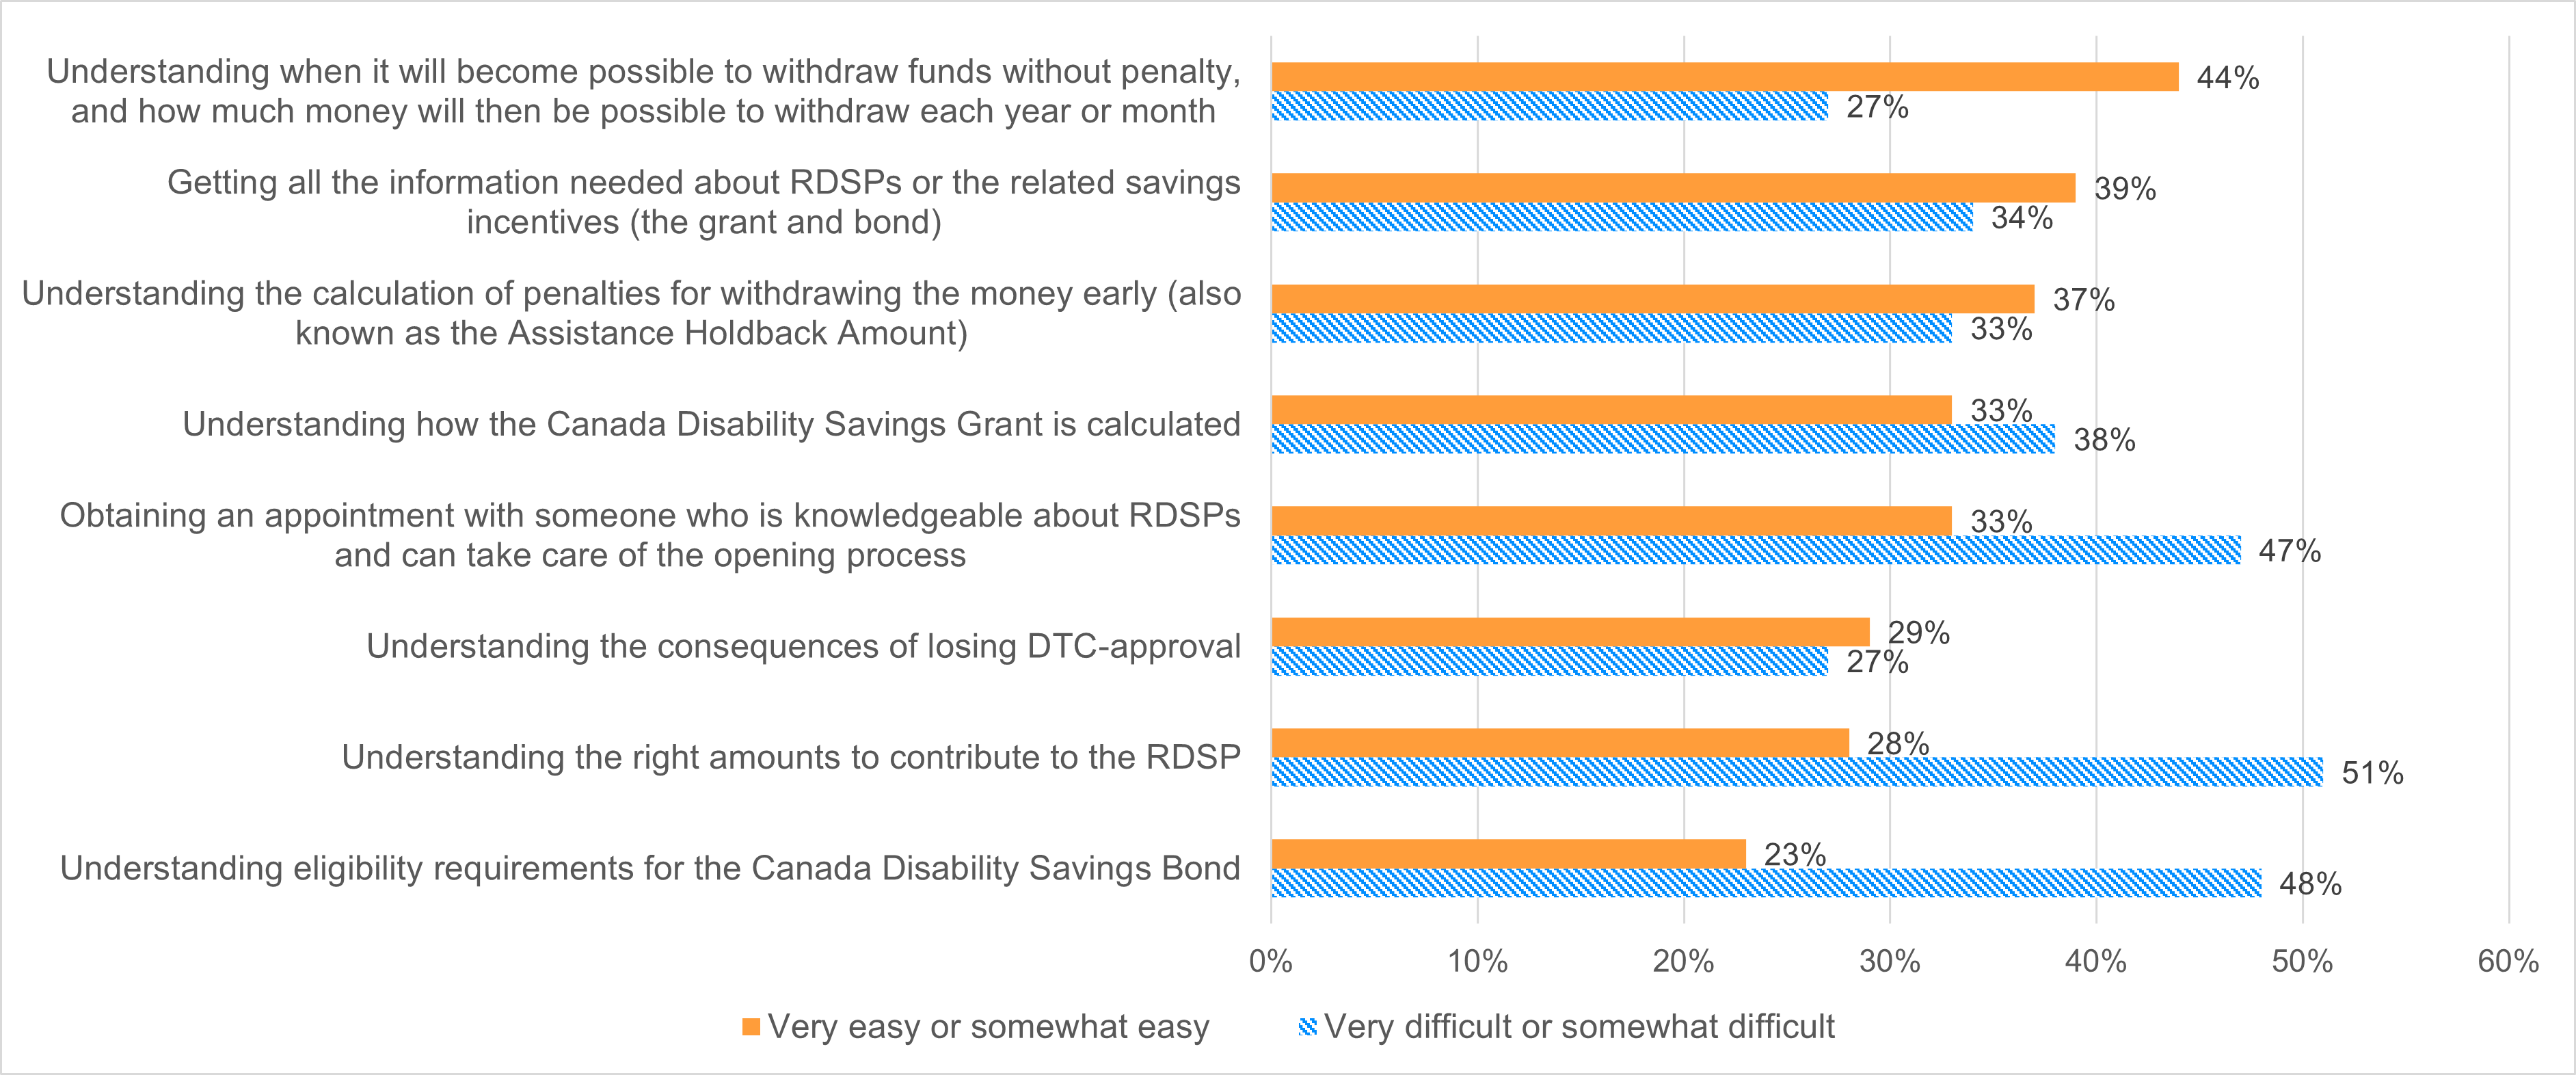
Figure 3: Text description
| Response option | Very easy or somewhat easy | Very difficult or somewhat difficult |
|---|---|---|
| Understanding when it will become possible to withdraw funds without penalty and how much money will then be possible to withdraw each year or month | 44% | 27% |
| Getting all the information needed about RDSPs or the related savings incentives (the grant and bond) | 39% | 34% |
| Understanding the calculation of penalties for withdrawing the money early (also known as the Assistance Holdback Amount) | 37% | 33% |
| Understanding how the Canada Disability Savings Grant is calculated | 33% | 38% |
| Obtaining an appointment with someone who is knowledgeable about RDSPs and can take care of the opening process | 33% | 47% |
| Understanding the consequences of losing DTC approval | 29% | 27% |
| Understanding the right amounts to contribute to the RDSP | 28% | 51% |
| Understanding eligibility requirements for the Canada Disability Savings Bond | 23% | 48% |
- Source: PRA (2024). Survey for the Evaluation of the CDSP, Conducted for ESDC’s Evaluation Directorate. Unpublished technical report
- Note: The information in this figure is from responses to survey questions 29 to 36: “The following questions are about when you met with your financial institution or with an independent financial advisor to set up an RDSP for the first time. Please rate how easy or difficult the following steps may have been in setting up the RDSP.”
2.2 The complexity of the application process and the level of effort required to complete it were the most common barriers for potential beneficiaries and plan holders
Barriers related to the complexity of the application process and the effort it requires were frequently identified by multiple sources. These barriers can be particularly challenging for those who have disabilities affecting mental functions or who are struggling with day-to-day expenses.
Multiple studies outside of this evaluation have found that the RDSP process is complicated and has discouraged people from opening an RDSP. For example, applicants have reported the DTCFootnote 19 and RDSP processes are both lengthy and complex (Abrams, 2017Footnote 20; Moss, 2012Footnote 21). In addition, recent data from the 2020 Survey on Savings for Persons with Disabilities reported that 15% of respondents described the process as being too complicated and opted to not open an RDSP, citing difficulties in completing tax forms and/or visiting financial institutions to open the plan (Statistics Canada 2022cFootnote 22).
Most interview informants (23/37) agreed that the complexity of the application process and the effort required to apply were barriers to opening or maintaining an RDSP. Some (16/37) discussed specific challenges related to families or individuals who are so focused on managing day-to-day requirements that they do not have the time or energy to consider the RDSP or follow through with the application process.
The 2024 Fifth Report of the Disability Advisory CommitteeFootnote 23 reported the following:
- navigating the application process remains a significant challenge for many applicants. A complete application requires Part A (tax filer information completed by applicant) and Part B (eligibility information completed by medical practitioner) of the T2201 form for the DTC
- one quarter of persons with disabilities who are likely eligible submit a completed DTC application. Most completed applications (96.6%) are approved (fewer than 4% are either rejected or under appeal). This suggests that more support and accessibility in the process is needed for applicants to successfully complete the process
Sarah's Experience Opening an RDSP
Sarah, a single woman aged 25 to 34, has a temporary disability that affects her mobility and independence. She is currently unemployed but actively looking for work. She opened her RDSP in 2019 to take advantage of both the Bond and the Grant and to accumulate assets without impacting eligibility for other benefits. She applied for the Disability Tax Credit (DTC) but faced significant challenges and found it very difficult. She had to reapply multiple times due to challenges having her disability recognized. Then, in opening her RDSP she found the process itself relatively easy but finds it difficult to understand the different parameters and rules of the RDSP and the CDSG and CDSB. As of 2024, Sarah has an RDSP balance of $6,000, funded entirely by the CDSB, as she has not made any personal contributions meaning she has not received the CDSG.
Note: The case studies presented in this report are intended to illustrate individual experiences of respondents and contain inaccuracies about the program's rules and procedures. These examples provide insight into respondent's perspectives and are not official policy.
2.3 Some beneficiaries and account holders found the process to obtain the DTC difficult and time-consuming to navigate.
The Disability Tax Credit (DTC) application process is easier for some than for othersFootnote 24. Since DTC approval is required to open an RDSP, challenges in understanding and applying for the tax credit can be a barrier to opening an RDSP.
Survey respondents were split on the difficulty of the DTC process. Some (37%) found the application forms and related documents somewhat or very easy to understand and a similar proportion (34%) found them somewhat or very difficult to understand.
Overall, focus group participants did not have many concerns or issues with understanding or applying for the DTC. In addition, family members who hold accounts on behalf of beneficiaries expressed fewer concerns than beneficiaries themselves indicating that the DTC process tends to be more difficult for beneficiaries trying to navigate it themselves.
| Responses | Number | Percentage |
|---|---|---|
| Bureaucratic/too many forms | 23 | 31% |
| Told disability was not severe enough to qualify/had to apply multiple times | 23 | 31% |
| Delays in getting approval | 15 | 20% |
| Had to get additional information from physician/missing information | 12 | 16% |
| DTC is not permanent/need to reapply | 9 | 12% |
| Costs associated with applying | 7 | 9% |
| Difficulties communicating with CRA | 5 | 7% |
| Need assistance from others to complete DTC application | 5 | 7% |
| Had to get information from multiple healthcare workers | 4 | 5% |
| Doctors unsure how to complete forms | 2 | 3% |
| Other | 2 | 3% |
| No response | 1 | 1% |
- Source: PRA (2024). Survey for the Evaluation of the CDSP, Conducted for ESDC’s Evaluation Directorate. Unpublished technical report
- Note: The information in the table is based on responses to survey question 25: “Please describe the difficulties you experienced getting approval for the DTC from the CRA.” (Base : Those who rated getting DTC approval from the CRA difficult)
2.4 There was a general lack of clarity related to the Assistance Holdback Amount
There is a lack of clarity related to the Assistance Holdback Amount (AHA).
Overall, it was apparent in all focus groups that participants did not understand the AHA well and perceive the repayment obligation as a penalty.
Some key informants (19/37) also felt that the program parameters for the Assistance Holdback Amount are not easy to understand for applicants and beneficiaries.
There were many different points of view in the focus groups concerning the timelines for when a participant could start withdrawing funds, with a particular lack of clarity around the 10-year rule for grant or bond withdrawals, and the age at which it becomes possible to withdraw without penalty. This demonstrated a lack of common understanding of the AHA, timelines and their purpose.
In all focus groups, participants spoke about the penalties associated with withdrawing early, although there was very little specific reference to exactly what the penalties would be. This demonstrated a concern amongst beneficiaries and their families/caregivers about the consequences of withdrawing funds early.
Survey results similarly suggested that understanding the parameters of the AHA was one of the primary areas of concern among respondents, all of whom were RDSP holders. Areas related to penalties or withdrawing funds were among the top areas of difficulty respondents had when first opening their RDSP.
Emily's Experience Opening an RDSP
Emily, a divorced woman aged 35 to 44 with a permanent mobility disability, is employed part-time. Her legal parent opened her RDSP in 2022 to leverage the Canada Disability Savings Grant (CDSG) alongside her contributions for medium-term financial needs. Emily found the DTC application process straightforward and reported no major difficulties. Managing her RDSP was relatively easy, though she faced challenges understanding the RDSP, CDSG, and CDSB rules. By 2024, her RDSP balance reached $4,500, including $1,500 in personal contributions, benefiting from the CDSG. Despite the generous grant, Emily struggled with withdrawal penalties and eligibility requirements, and her financial institution was not very helpful. Overall, she found managing her RDSP easier than John, likely due to third-party involvement in opening the account and straightforward DTC approval. Emily emphasized that the RDSP helps maintain her future quality of life, despite some rule comprehension challenges.
Note: The case studies presented in this report are intended to illustrate individual experiences of respondents and contain inaccuracies about the program's rules and procedures. These examples provide insight into respondent's perspectives and not official policy.
3. The role of the CDSG and the CDSB in motivating savings
3.1 The CDSG appears to be a stronger motivator than the CDSB for eligible beneficiaries and plan holders to open an RDSP
Survey respondents and focus group participants identified the CDSG and CDSB as strong motivators to open an RDSP:
- Access to the CDSG and CDSB was the second most selected (50%) reason for opening an RDSP amongst survey respondents
- However, the CDSG, which requires a contribution, seems to be a much stronger motivator as 24% of survey respondents selected the CDSG as a primary motivator compared to only 4% who selected the CDSB as a primary motivator
- Participants in all focus groups indicated that the grant and bond provide strong motivation to open an account and that the CDSG was a significant reason for opening and contributing to an RDSP
- In almost all focus groups participants said that they try to contribute as much as possible to the RDSP when they have additional money. However, in some groups participants said that putting money into their RDSP is a lower priority relative to covering their day-to-day expenses
- Participants primarily spoke about the value of the government matching contributions, and how those matched components add significantly to the value of their RDSP
- In some groups, there are others who mentioned that the bond is the primary benefit. These participants tended to be individuals who put less (or even no) money into their RDSP
The findings from the administrative data analysis also suggest that the Canada Disability Savings Bond (CDSB) has a positive impact on opening an RDSP account for those who have incomes close to the maximum allowable net income to receive the CDSBFootnote 25. In 2018, for example, individuals with net family income close to but lower than $46,605 and who were eligible to receive a portion of the bonds were more likely to have opened an RDSP account by 6.7 percentage points compared to similar non-eligible individuals with net family income just above $46,605 (consult Appendix H for more information). However, around the net-family income threshold of $93,208 (where the matching rate of the Canada Disability Savings Grant is reduced), there was no statistically significant difference in the probability of opening an account between those who were eligible for the higher matching rate and those eligible for the lower contribution rate.
The CDSG and CDSB were not the only significant motivators for focus group participants to open and contribute to an RDSP:
- Focus group participants also mentioned being motivated to open an RDSP because of the government grant and bond
- Participants also felt that it offered some assurance that their child would have sufficient income to support themselves in the future when they may no longer be able to support them. This helps to ease their anxiety and concern about the future well-being of their child
Why Marc chose to open an RDSP
Marc is a 41-year-old male living with a permanent disability who opened his own Registered Disability Savings Plan (RDSP) sometime between 2016 and 2019. Holding an undergraduate university degree, he is currently looking for a job and has an annual household income of less than $35,000. The total amount accumulated in his RDSP is approximately $30,000. Part of this amount includes his own personal contributions, as well as a mix of grants and bonds received from CDSP. In addition to the RDSP, Marc has other savings accounts totaling $1,256 but he chose to open an RDSP to maximize the benefits of both the Canada Disability Savings Bond (CDSB) and the Canada Disability Savings Grant (CDSG), increase his savings, and ensure his long-term financial security while preserving eligibility for other social programs.
Note: The case studies presented in this report are intended to illustrate individual experiences of respondents and contain inaccuracies about the program's rules and procedures. These examples, taken from survey responses, provide insight into respondents' perspectives and not official policy.
3.2 The proportion of RDSP beneficiaries who contributed decreased over time, but the amount they contributed has remained relatively stable over time and across income categories
The proportion of RDSPs in which a private contribution was made decreased by 22% over the evaluation period, from 62% in 2010 to 40% in 2021.
The average amount of contribution made remained relatively stable amongst all income levels over the evaluation period. Contribution amounts were higher for those with Low Income and High Income Level II.
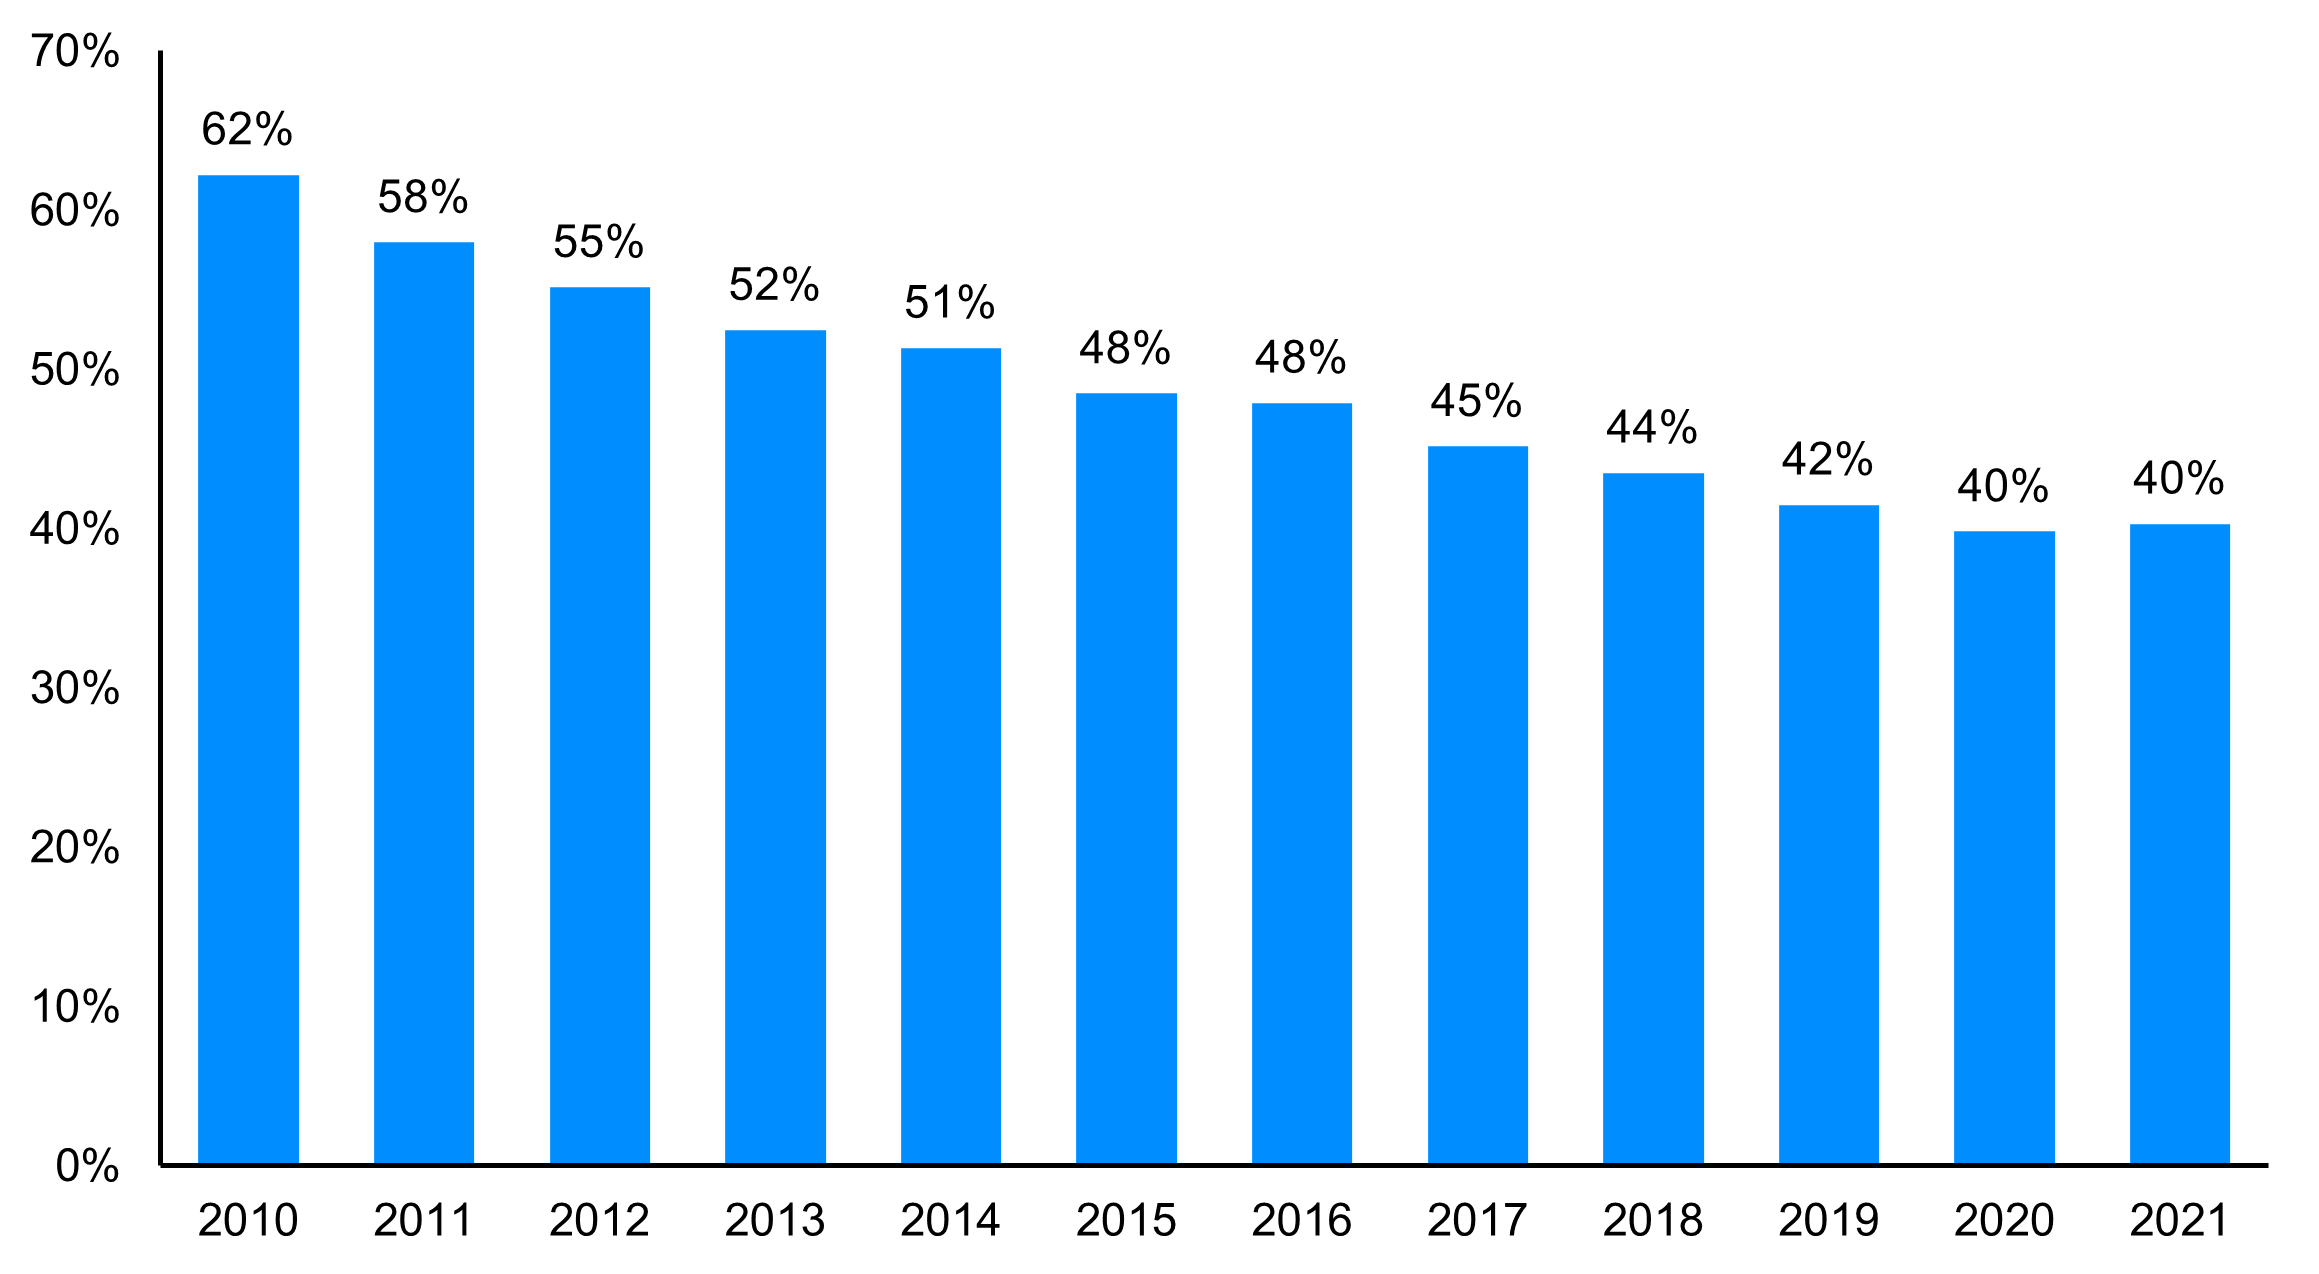
Figure 4: Text description
| Year | Proportion of RDSP beneficiaries who contributed to their accounts |
|---|---|
| 2010 | 62% |
| 2011 | 58% |
| 2012 | 55% |
| 2013 | 52% |
| 2014 | 51% |
| 2015 | 48% |
| 2016 | 48% |
| 2017 | 45% |
| 2018 | 44% |
| 2019 | 42% |
| 2020 | 40% |
| 2021 | 40% |
- Source: Employment and Social Development Canada (2025). Technical Report: Evaluation of the CDSP using linked administrative data
- Note: The calculations only considered RDSP beneficiaries and DTC-approved individuals who filed taxes individually and did not include a large proportion of individuals under 19 years. Therefore, results from this analysis should be interpreted accordingly and discrepancies may arise relative to the results presented in the program’s annual report based on the entire population.
Overall, more savings were made in RDSPs of High Income Level II and Low Income beneficiaries than those in other two income categories throughout the evaluation period.
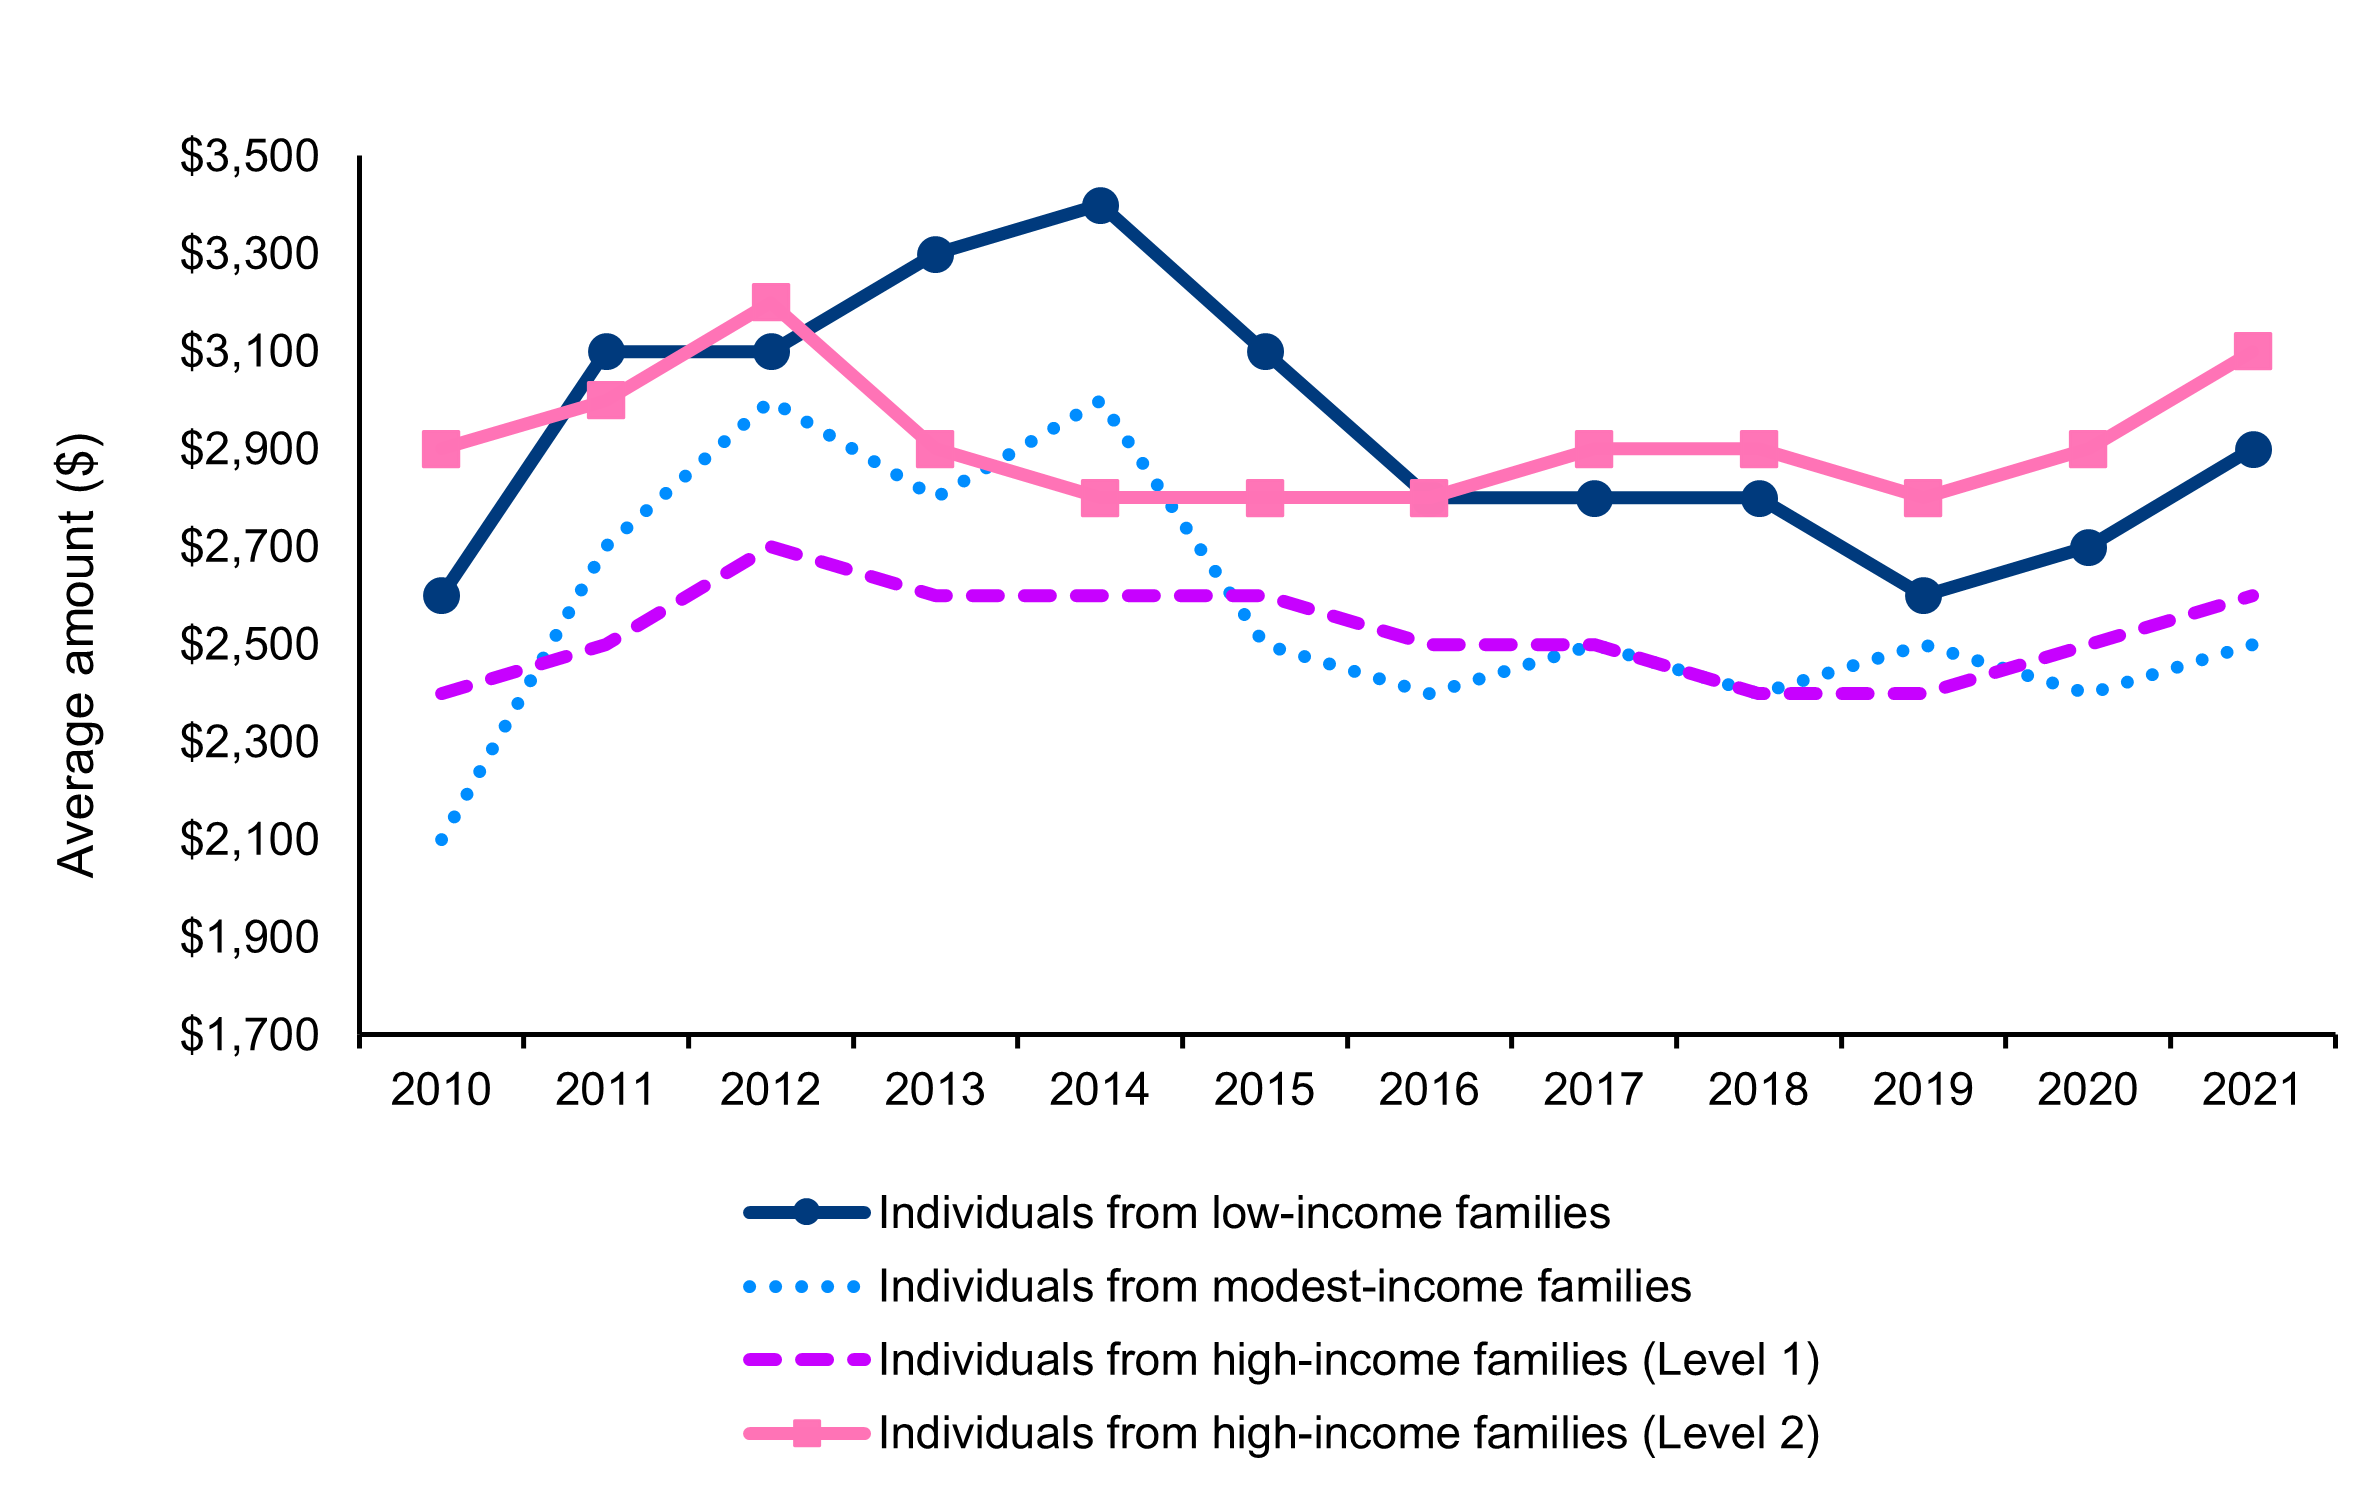
Figure 5: Text description
| Year | Individuals from low-income families | Individuals from modest-income families | Individuals from high-income families (Level 1) | Individuals from high-income families (Level 2) | Overall |
|---|---|---|---|---|---|
| 2010 | $2,600 | $2,100 | $2,400 | $2,900 | $2,400 |
| 2011 | $3,100 | $2,700 | $2,500 | $3,000 | $2,700 |
| 2012 | $3,100 | $3,000 | $2,700 | $3,200 | $2,800 |
| 2013 | $3,300 | $2,800 | $2,600 | $2,900 | $2,800 |
| 2014 | $3,400 | $3,000 | $2,600 | $2,800 | $2,900 |
| 2015 | $3,100 | $2,500 | $2,600 | $2,800 | $2,700 |
| 2016 | $2,800 | $2,400 | $2,500 | $2,800 | $2,600 |
| 2017 | $2,800 | $2,500 | $2,500 | $2,900 | $2,600 |
| 2018 | $2,800 | $2,400 | $2,400 | $2,900 | $2,600 |
| 2019 | $2,600 | $2,500 | $2,400 | $2,800 | $2,500 |
| 2020 | $2,700 | $2,400 | $2,500 | $2,900 | $2,600 |
| 2021 | $2,900 | $2,500 | $2,600 | $3,100 | $2,800 |
- Source: Employment and Social Development Canada (2025). Technical Report: Evaluation of the CDSP using linked administrative data
- Note: The calculation only considered RDSP beneficiaries and DTC-approved individuals who filed taxes individually and did not include a large proportion of individuals under 19 years. Therefore, results from this analysis should be interpreted accordingly and discrepancies may arise relative to the results presented in the program’s annual report based on the entire population.
3.3 The proportion of DTC-approved individuals from low- or modest- income families receiving grants and/or bonds remained relatively stable over the evaluation period with most RDSP beneficiaries receiving bonds.
The proportion of DTC approved individuals from low family income receiving grants or bonds between 2010 and 2016 remained stable.
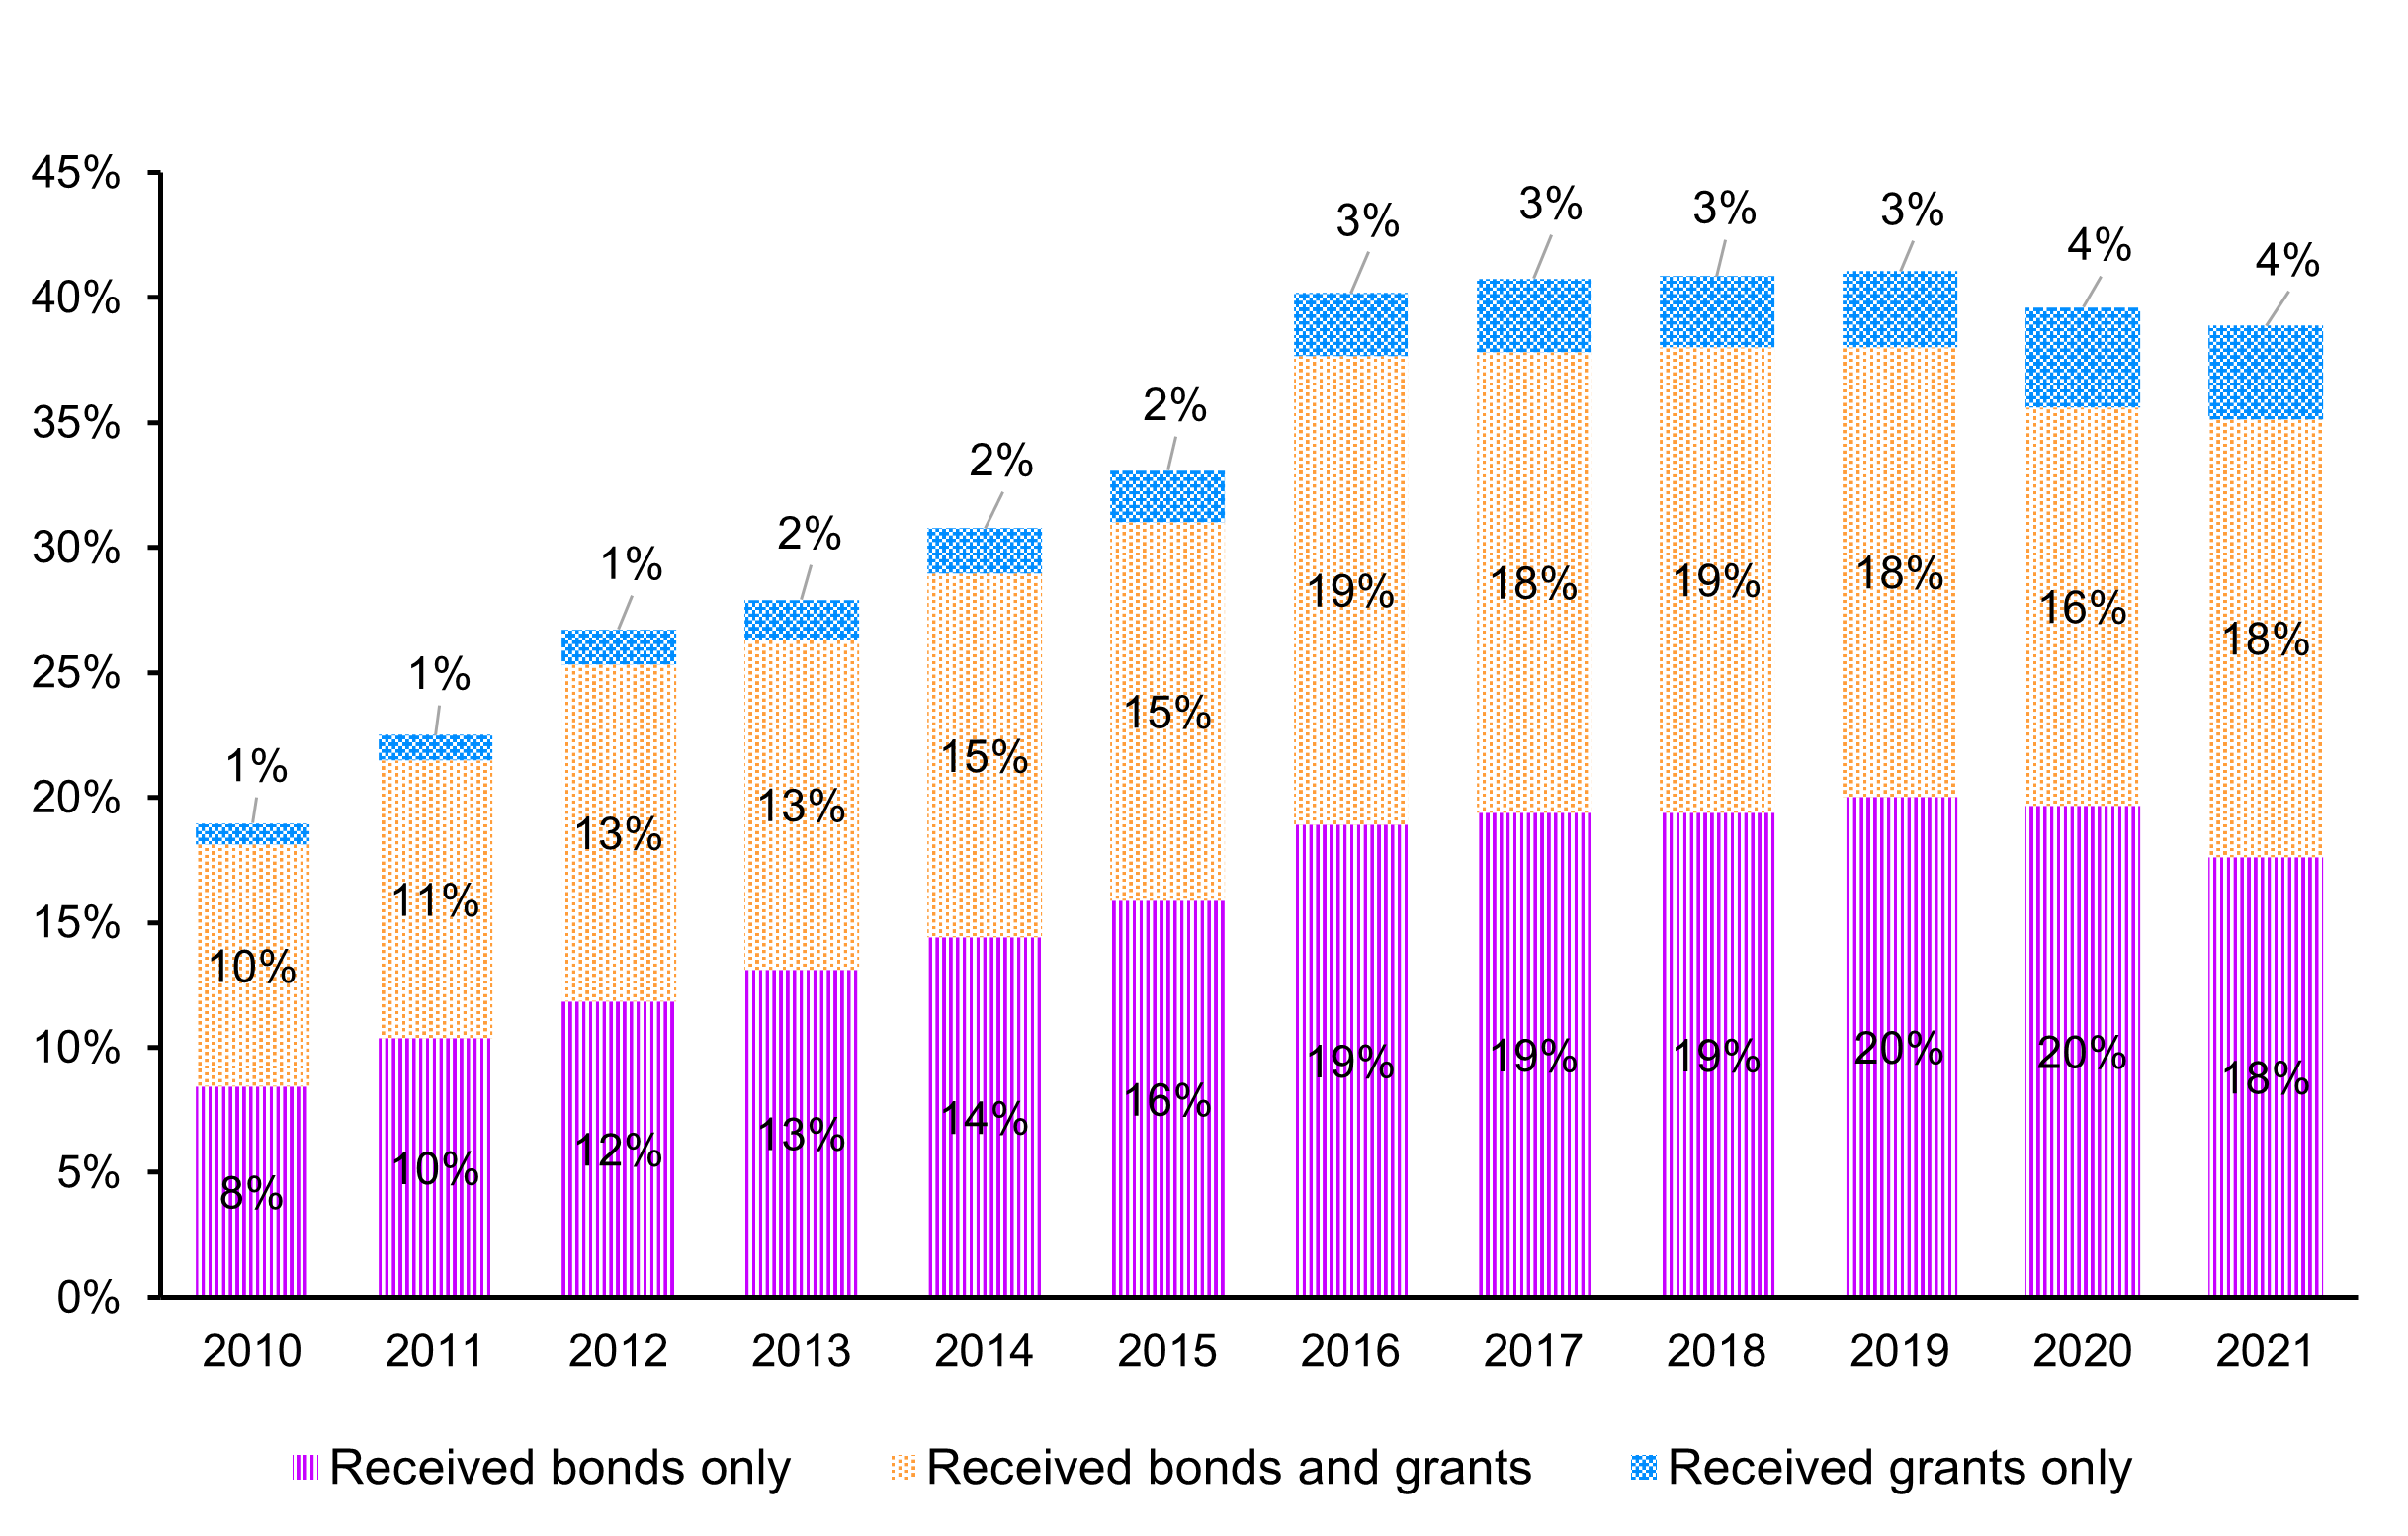
Figure 6: Text description
| Receipt of bonds and/or grants | 2010 | 2011 | 2012 | 2013 | 2014 | 2015 | 2016 | 2017 | 2018 | 2019 | 2020 | 2021 |
|---|---|---|---|---|---|---|---|---|---|---|---|---|
| Received bonds only | 8% | 10% | 12% | 13% | 14% | 16% | 19% | 19% | 19% | 20% | 20% | 18% |
| Received bonds and grants | 10% | 11% | 13% | 13% | 15% | 15% | 19% | 18% | 19% | 18% | 16% | 18% |
| Received grants only | 1% | 1% | 1% | 2% | 2% | 2% | 3% | 3% | 3% | 3% | 4% | 4% |
- Source: Employment and Social Development Canada (2025). Technical Report: Evaluation of the CDSP using linked administrative data (draft)
- Note: Calculation only considered RDSP beneficiaries and DTC-approved individuals who filed taxes individually and did not include a large proportion of individuals under 19 years. Therefore, results from this analysis should be interpreted accordingly and discrepancies may arise relative to the results presented in the program’s annual report based on the entire population.
The proportion of DTC approved individuals from modest family income receiving grants or bonds increased between 2010 and 2016, then remained stable from 2017.
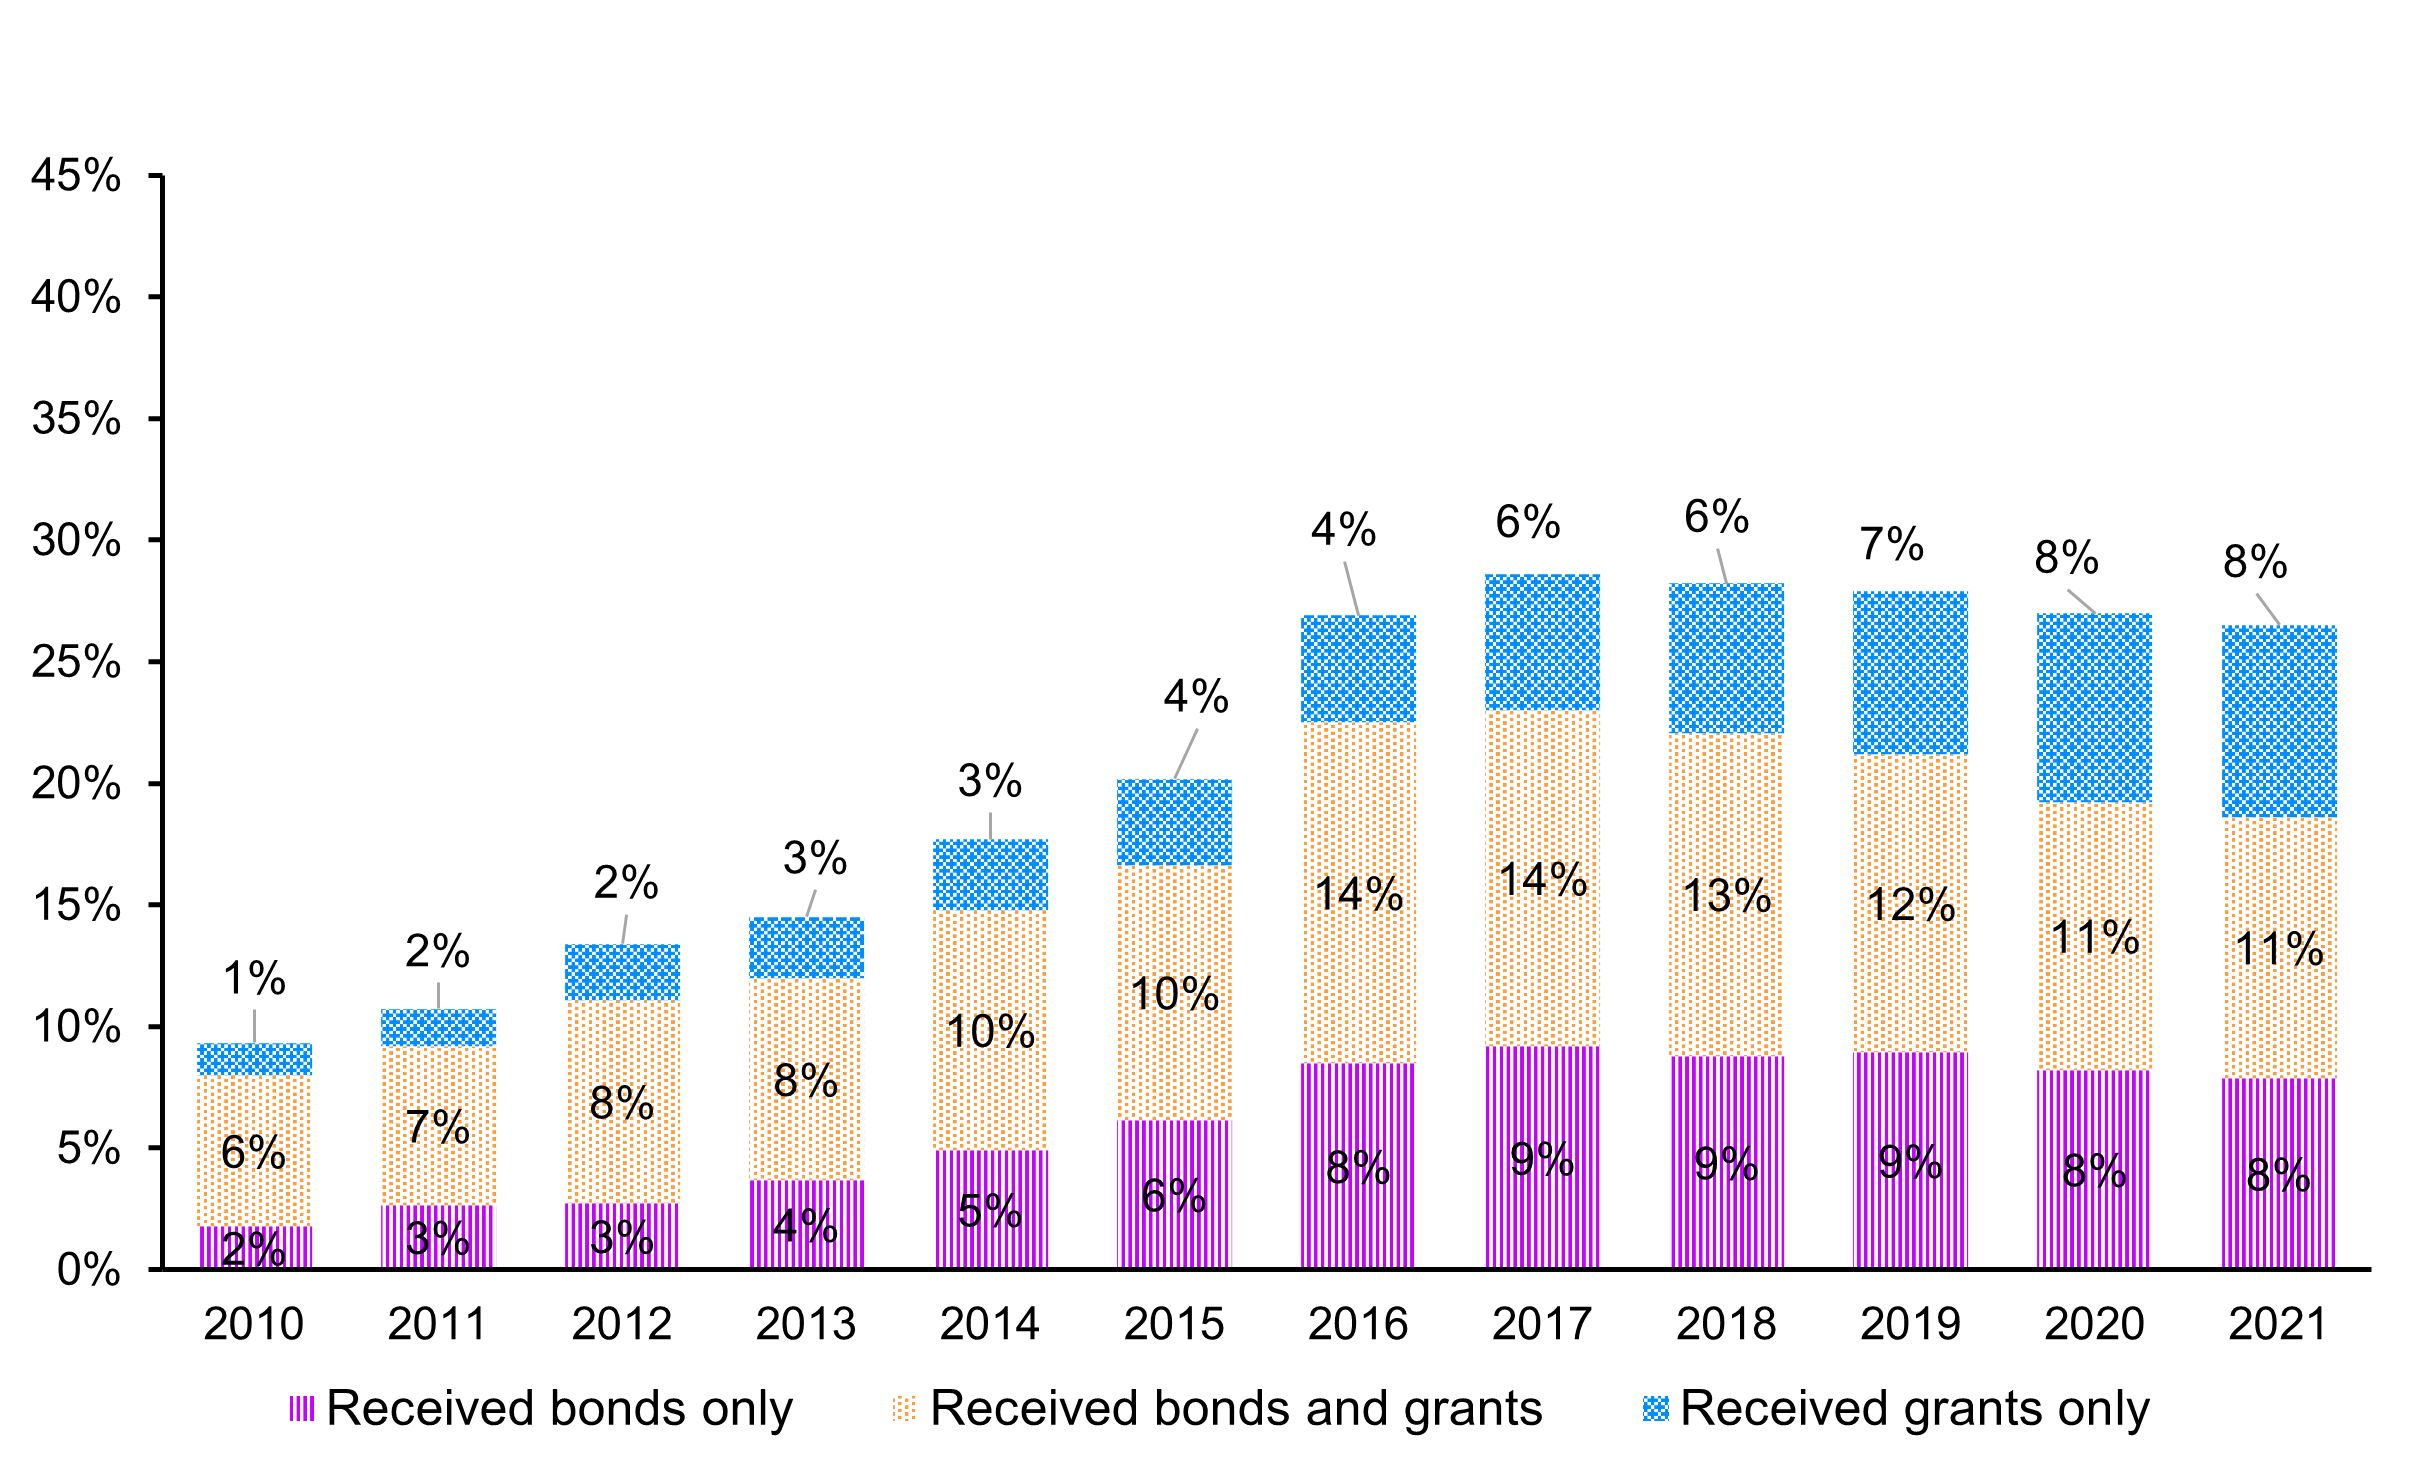
Figure 7: Text description
| Year | Received bonds only | Received bonds and grants | Received grants only |
|---|---|---|---|
| 2010 | 2% | 6% | 1% |
| 2011 | 3% | 7% | 2% |
| 2012 | 3% | 8% | 2% |
| 2013 | 4% | 8% | 3% |
| 2014 | 5% | 10% | 3% |
| 2015 | 6% | 10% | 4% |
| 2016 | 8% | 14% | 4% |
| 2017 | 9% | 14% | 6% |
| 2018 | 9% | 13% | 6% |
| 2019 | 9% | 12% | 7% |
| 2020 | 8% | 11% | 8% |
| 2021 | 8% | 11% | 8% |
- Source: Employment and Social Development Canada (2025). Technical Report: Evaluation of the CDSP using linked administrative data (draft)
- Note: calculation only considered RDSP beneficiaries and DTC-approved individuals who filed taxes individually and did not include a large proportion of individuals under 19 years. Therefore, results from this analysis should be interpreted accordingly and discrepancies may arise relative to the results presented in the program’s annual report based on the entire population.
3.4 Some plan holders or beneficiaries are saving money outside of an RDSP and it is often related to a perception that other accounts were better suited to the realities of persons with disabilities
The extent to which plan holders choose to save outside of an RDSP is unclear.
Some interviewees (5/37) felt that there were no better savings vehicles for persons with disabilities. The majority of these informants (3/5) pointed out that the benefit associated with the RDSP is more generous than the benefits offered through other savings options.
However, others felt that different account types were better suited to the needs of persons with disabilities:
- Some interviewees (15/37) suggested that other account types might be better adapted to the needs of persons with disabilities than RDSPs. Most of these informants (12/15) said that account types with greater flexibility to withdraw money without penalties might be more appropriate for some persons with disabilities
- In addition, a few informants (8/37) suggested that accounts that are easier to open or manage are appealing to persons with disabilities
Survey respondents who have savings in other types of accounts shared the perception that these options may be better suited to the realities of persons with disabilities. The most common reason for an alternative savings plan or account was for funds to be accessible more easily and without penalty in case of emergency (46%).
| Response | Number | Percentage |
|---|---|---|
| For funds to be accessible more easily and without penalty in case of emergency | 201 | 46% |
| To accumulate additional retirement savings | 148 | 34% |
| To accumulate money for major purchases | 114 | 26% |
| To diversify investments | 98 | 23% |
| Already contributed the maximum allowable to the RDSP(s) | 94 | 22% |
| For tax purposes | 85 | 20% |
| It was recommended by a financial professional | 85 | 20% |
| To obtain a higher interest rate/return on investments | 77 | 18% |
| For day-to-day banking/finances | 19 | 4% |
| Had before the RDSP | 12 | 3% |
| To avoid penalties from RDSP withdrawals | 3 | 1% |
- Source: PRA (2024). Survey for the Evaluation of the CDSP, Conducted for ESDC’s Evaluation Directorate. Unpublished technical report
- Note: The information is based on responses to the following survey question: “Why did you choose to open other types of savings plans or account, in addition to the RDSP? (Base: Those who have at least one other savings plan or account but do not currently contribute to it).” Of the informants who mentioned complementary or alternative investment or savings vehicles used by those who are eligible for RDSPs, most (15/19) mentioned TFSAs. Informants also mentioned the following other savings vehicles: RRSPs (5/27), RESPs (4/37), trusts (4/37), savings accounts (3/37), non-registered plans (2/37), segregated funds (1/37).
Survey responses provide a sense of the most common alternative investment vehicles used by plan holders and beneficiariesFootnote 29.
The most common types of other plans/accounts that survey respondents actively contribute to outside of their RDSP were:
- Registered savings account at a financial institution (37%)
- Tax Free Savings Accounts (32%)
- Registered Retirement Savings Plan (23%)
| Type of savings plan or account | Have and currently contribute to (Number) | Have and currently contribute to (Percentage) | Have and currently withdraw from (Number) | Have and currently withdraw from (Percentage) | Have but do not currently contribute to or withdraw from (Number) | Have but not currently contribute to or withdraw from (Percentage) | Do not have (Number) | Do not have (Percentage) |
|---|---|---|---|---|---|---|---|---|
| Regular savings account at a financial institution | 2,801 | 37% | 1,434 | 19% | 1,222 | 16% | 1,758 | 23% |
| Tax-Free Savings Account (TFSA) | 2,439 | 32% | 349 | 5% | 1,240 | 17% | 3,249 | 43% |
| Registered Retirement Savings Plan (RRSP) | 1,702 | 23% | 216 | 3% | 1,271 | 17% | 4,096 | 55% |
| Employer-sponsored pension plan | 1,351 | 18% | 323 | 4% | 435 | 6% | 5,120 | 68% |
| Mutual funds | 936 | 12% | 122 | 2% | 551 | 7% | 5,508 | 73% |
| Guaranteed Investment Certificates (GIC)s | 746 | 10% | 89 | 1% | 588 | 8% | 5,725 | 76% |
| Registered Education Savings Plan (RESP) | 526 | 7% | 205 | 3% | 331 | 4% | 6,267 | 83% |
| Tax-Free First Home Savings Account (FHSA) | 186 | 3% | 20 | <1% | 83 | 1% | 7,018 | 93% |
| Other type of trust fund | 53 | 1% | 51 | 1% | 96 | 1% | 6,983 | 93% |
| Henson Trust | 44 | 1% | 29 | <1% | 327 | 4% | 6,751 | 90% |
| Registered Retirement Income Fund (RRIF) | 40 | 1% | 151 | 2% | 95 | 1% | 6,954 | 92% |
| Other | 375 | 5% | 118 | 2% | 151 | 2% | 6,878 | 91% |
- Source: PRA (2024). Survey for the Evaluation of the CDSP, Conducted for ESDC’s Evaluation Directorate. Unpublished technical report
- Note: The information in the table is based on responses to the following survey question: “Q41. Which of the following other types of savings plans or accounts do you currently have, contribute to, or benefit from, if any? Currently refers to the past 12 months.” Percentages may not sum to 100% due to rounding.
4. Early impacts of the RDSP on quality of life or well-being
4.1 Beneficiaries, plan holders and other stakeholders believe that the program has the potential to help improve the quality of life and/or well-being of beneficiaries and/or plan holders in the future
There was a shared sense amongst interviewees and focus group participants that it is still too early to assess impacts to the quality of life of beneficiaries and/or plan holders as there are few beneficiaries who have begun receiving Lifetime Disability Savings Payments.
Most key informants (32/37) felt positive about the RDSP's potential impact on beneficiaries' future financial security and ability to maintain their current quality of lifeFootnote 30 in the future but said that this depends on various factors that might limit their ability to either access or to take full advantage of the program.
For example, the majority of these informants (21/32) expressed the view that future benefits depend on the RDSP holders' income or ability to save.
In addition, a few informants (8/37) suggested that the benefits depend on the age at which one becomes a beneficiary.
A few informants (4/37) mentioned that the withdrawal rules or Assistance Holdback Amount undermine the RDSP's contribution to long-term financial security for some beneficiaries, such as those with shortened life expectanciesFootnote 31.
In a few focus groups, participants shared concerns about the restrictions that can prevent beneficiaries from accessing money before they turn 60 years old. These participants were skeptical that the beneficiary would live much beyond 60 years of age and do not expect the beneficiaries will be able to experience the full benefits of their RDSP.
A majority (76%) of survey respondents felt at least "somewhat good" about the RDSP's ability to help meet the longer-term financial needs of beneficiaries.
Just over one-third of respondents rated the Program as excellent (12%) or very good (24%) at helping ensure that the future financial needs of the beneficiary will be met. Another 40% of respondents believe that the program is somewhat good at helping to meet the needs of the beneficiary.
When asked about the benefits of the RDSP that could affect their quality of life, survey respondents selected the following two impacts most frequently:
- makes it easier to save for the beneficiaries' future financial needs (37% strongly agree, 41% somewhat agree)
- helps ensure that the beneficiaries' quality of life will be maintained in the future (21% strongly agree, 40% somewhat agree)
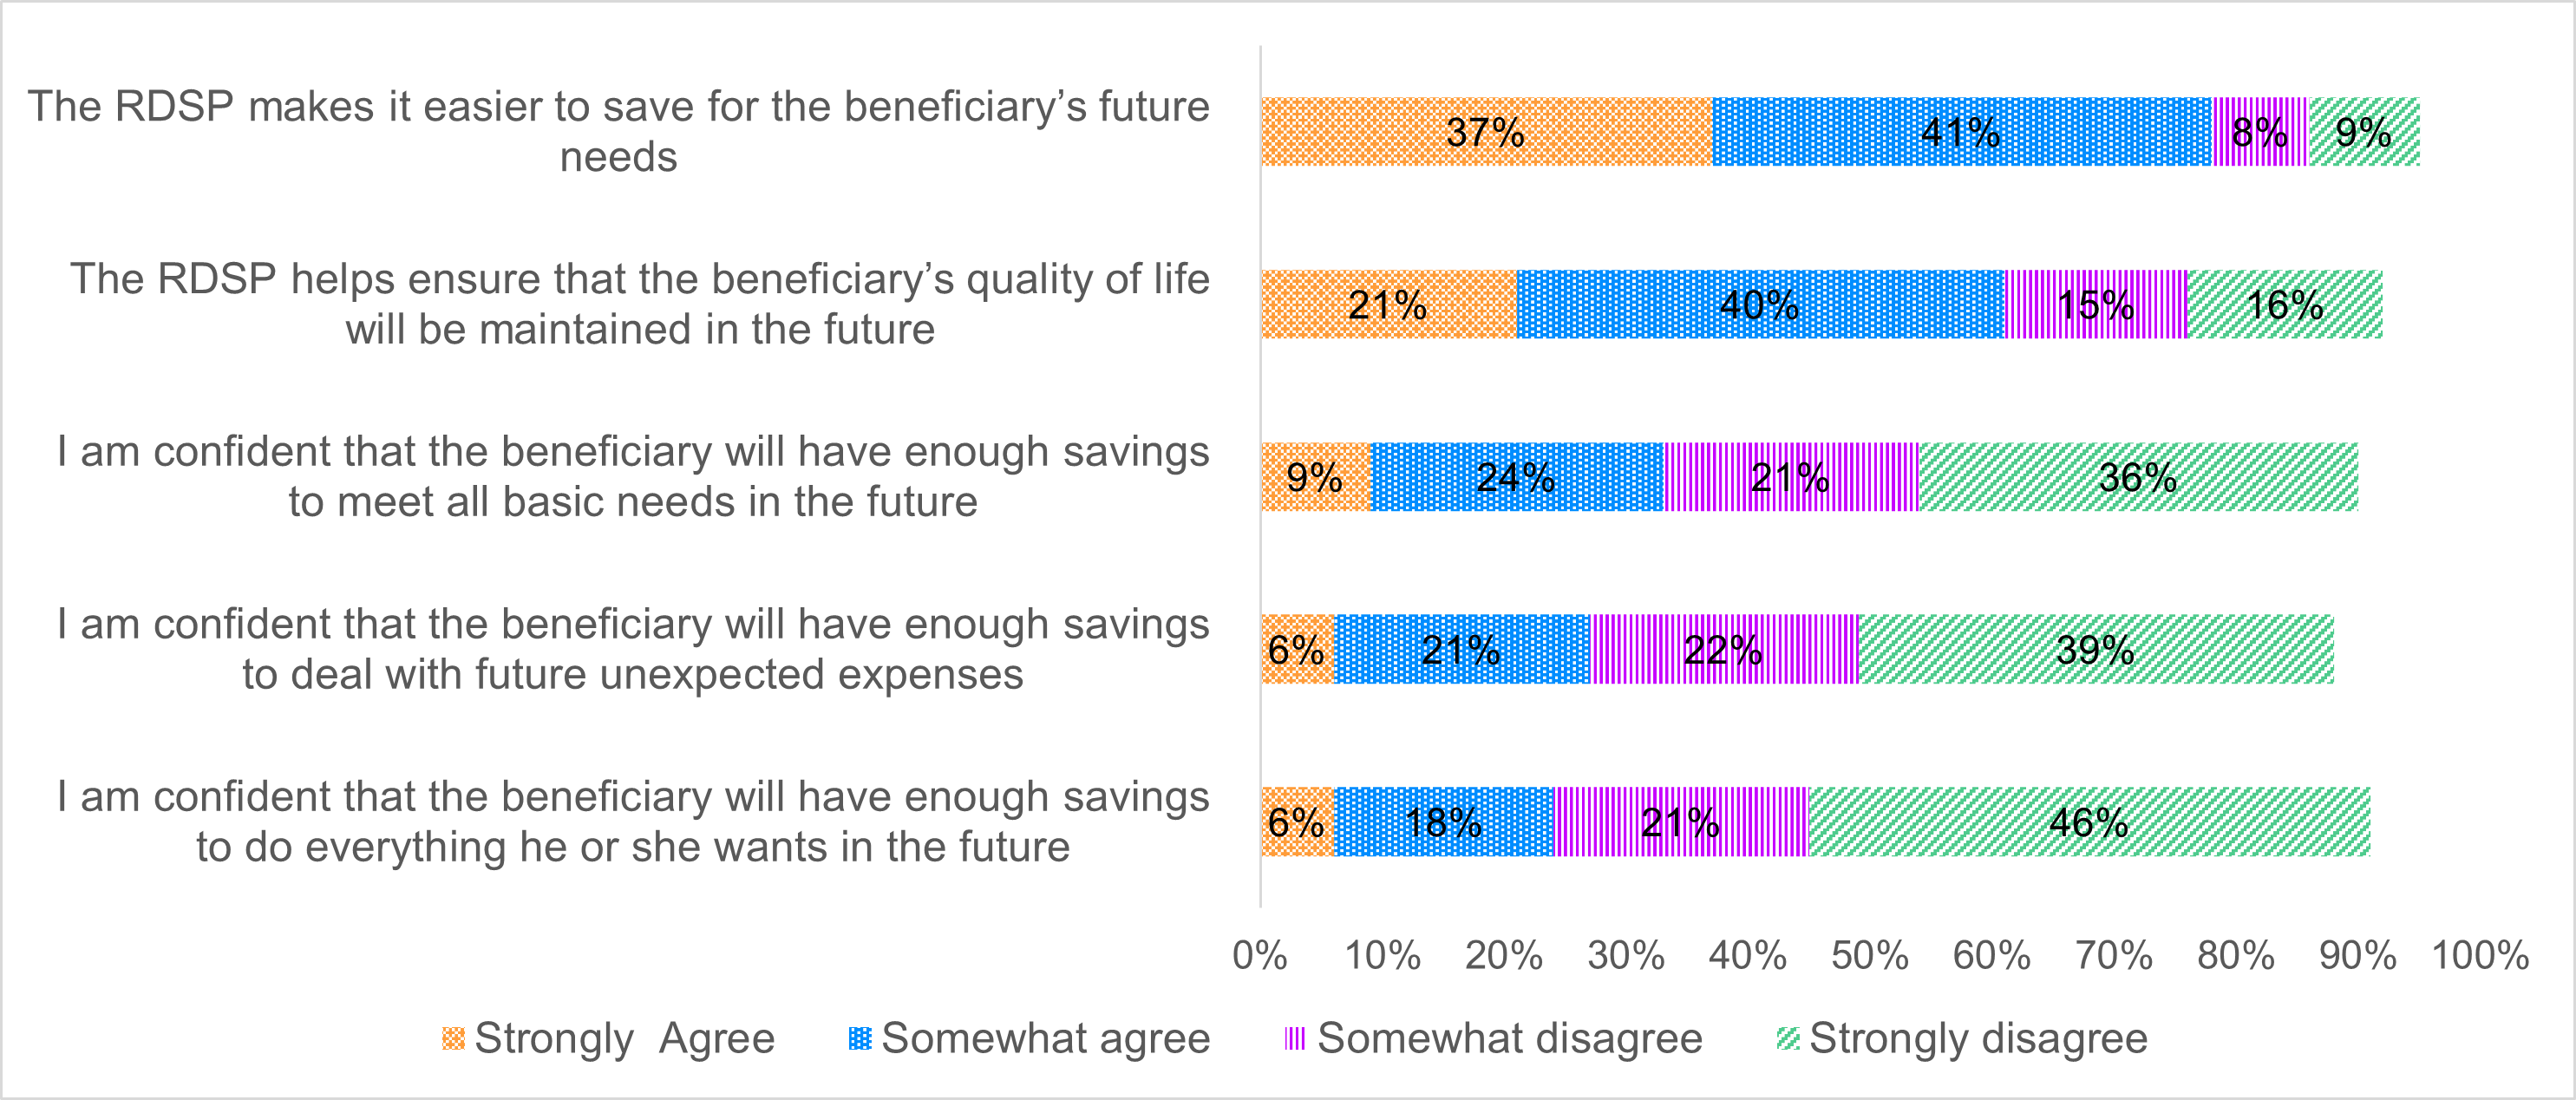
Figure 8: Text description
| Responses | Strongly agree (%) | Somewhat agree (%) | Somewhat disagree (%) | Strongly disagree (%) |
|---|---|---|---|---|
| The RDSP makes it easier to save for the beneficiary's future needs | 37% | 41% | 8% | 9% |
| The RDSP helps ensure that the beneficiary's quality of life will be maintained in the future | 21% | 40% | 15% | 16% |
| I am confident that the beneficiary will have enough savings to meet all basic needs in the future | 9% | 24% | 21% | 36% |
| I am confident that the beneficiary will have enough savings to do everything he or she wants in the future | 6% | 18% | 21% | 46% |
| I am confident that the beneficiary will have enough savings to deal with future unexpected expenses | 6% | 21% | 22% | 39% |
- Source: PRA (2024). Survey for the Evaluation of the CDSP, Conducted for ESDC’s Evaluation Directorate. Unpublished technical report.
- Note: The information is based on responses to survey questions Q48 – Q52.
4.2 The program helps improve the confidence of plan holders and beneficiaries in their ability to meet future financial needs
Some informants felt that the CDSP provides families and caregivers with a sense of confidence in the future financial security of beneficiaries:
- Some informants (16/37) indicated that the program improves families' or caregivers' confidence in the beneficiaries' ability to meet future financial needs. Of these informants, the majority felt that the program benefits caregivers or families, whereas only a few informants (4 / 37) mentioned that the program improves beneficiaries' confidence in this area
- Some informants (10/37), almost half of whom worked with community-based organizations (4), indicated that it improves confidence for RDSP holders who understand the program
- Participant responses in all focus groups with family members/guardians suggest that the RDSP provides some financial assurances for their child, which helps ease their anxiety and concern about the future well-being of their child
Beneficiaries, plan holders and stakeholders often indicated that the RDSP would help beneficiaries to meet their future financial needs but that it is not sufficient on its own:
- Most focus group participants indicated that the RDSP provides a source of savings but that it will not be sufficient to meet the beneficiary's future income needs. They believed that other sources (e.g., CPP, provincial disability programs) will be the beneficiaries' primary source of income
- Similarly, half of the interviewees (15/30) noted that savings through the RDSP must be combined with other sources of income to ensure financial security
- Participants (primarily beneficiaries and in most focus groups with beneficiaries, as well as in a few focus groups with family members or guardians), did not believe the RDSP would provide significant impacts primarily because most thought it would only provide them with a few thousand dollars per year. In some groups (beneficiaries and families), participants said that because of the impacts of inflation over the past few years, they had some uncertainty about future expenses and did not see their RDSP increasing at or above the rate of inflation
- However, most focus group participants indicated that the additional money that the RDSP provides gives them confidence that they or the beneficiary will be able to meet their day-to-day expenses once they can start withdrawing
Survey respondents also felt that the CDSP was not sufficient on its own to provide them with confidence in their future financial security:
- 57% disagree that they are confident the beneficiary will have enough savings to meet all basic needs in the future (33% agree)
- 61% disagree that they are confident that the beneficiary will have enough savings to deal with future unexpected expenses (27% agree)
- 77% disagree that they are confident that the beneficiary will have enough savings to do everything he or she wants in the future (24% agree)
4.3 Among the small number of beneficiaries who had started withdrawing funds, there was a fair proportion who had to payback some or all of their grants or bonds to withdraw funds early
Results of the survey show that only a small proportion of beneficiaries (4%) have withdrawn funds to date, and most (66%) did so at the age of 60.
However, of those who have withdrawn funds from their RDSP, a fair proportion (34%) of beneficiaries faced a payback requirement to withdraw funds early to meet financial needs, which were often related to day-to-day and health or disability-related expenses.
Among focus group participants who had withdrawn money from their RDSP, most had withdrawn money because they were required to after reaching 60 years of age. Those who withdrew money before the 10 years elapsed since they last received grants or bonds tended to do so because they needed the money to pay for day-to-day expenses (often expenses related to their disability).
Similarly, most key informants (27/37) mentioned that those who withdraw money from their RDSP despite penalties, do so out of an urgent financial need or a sudden change in financial circumstances. Half of these informants mentioned that the urgent financial need arises out of disability or health related costs (13/37). A few informants (6/37) mentioned RDSP holders might withdraw money from their RDSP early due to having a shortened life expectancy.
The results of the quantitative analysis also suggest that certain groups of beneficiaries were more likely to make a withdrawal such as those who are 60 years and over, divorced, widowed and those who are from low-income families.
Conclusion
The CDSP has been effective in promoting awareness of the RDSP amongst potential beneficiaries and their families/caregivers. The CDSG and CDSB encourage potential beneficiaries to open RDSPs and contribute savings. Overall, it is expected that the RDSP will help beneficiaries maintain their quality of life by contributing to a sense of financial security. However, there are some potential beneficiaries who face multiple barriers to open and maintain an RDSP, particularly given the complexity of the processes and rules which can be sources of confusion. These beneficiaries could benefit from more one on one support. Additionally, a number of beneficiaries and their families/guardians, as well as Program stakeholders, have raised concerns about certain parameters of the RDSP such as the AHA, withdrawal rules, timelines related to the CDSG and the CDSB, and the requirement to be approved for the DTC, with certain individuals indicating that some of these rules discourage potential beneficiaries from opening an RDSP, and in some cases reduce the potential benefit of the Program for certain beneficiaries.
ESDC worked with partners to improve its communication and outreach strategies to raise awareness of the RDSP amongst persons with disabilities. While these efforts have helped to encourage some potential plan holders to open an RDSP, there are still cases where more one-on-one support with applying could simplify the process for those who are struggling and those who have been discouraged from applying. Additionally, there appeared to be limitations to the reach of communication and outreach efforts to certain sub-segments of the target population, such as single individuals and those whose disability begins later in life.
Ongoing barriers to opening an RDSP included challenges finding knowledgeable financial institutions to help with the application process, and the complexity and effort of the process itself. These can be significant barriers for those who have disabilities affecting mental functions or those who are struggling with daily life, making it more difficult for them to follow through with the application process.
The take-up rate of RDSPs increased steadily over the evaluation period, especially for low- and modest-income individuals. Since 2017 the take up rate for these two groups of individuals have stabilized and stood at 44% and 33% in. The CDSG and CDSB appears to play a role in encouraging plan holders to open an account and to contribute savings.
However, there was strong perception amongst stakeholders, plan holders and beneficiaries that the Program was not adapted specifically to the unique circumstances or needs of persons with disabilities and that account types with greater flexibility to withdraw money without penalties might be more appropriate for some. Key challenges were related to penalties for early withdrawals, and certain age limits/restrictions.
There was a shared sense amongst interviewees and focus group participants that while it is still early to assess impacts to the quality of life of beneficiaries and/or plan holders, the Program has the potential to help improve their quality of life in the future.
Recommendation and observation
Recommendation 1: It is recommended that the Program continue to work with, and support partners and stakeholders, particularly community-based organizations, to improve their capacity to promote the RDSP and the grant and bond, broaden outreach and communication efforts, and provide more one-on-one support as required by certain individuals to open and maintain an RDSP.
- The program has made efforts to improve communication and outreach (key finding 1.1), but challenges remain, particularly in the way outreach efforts are targeted (when and to whom, key finding 1.2). A broader approach to outreach, such as through a national promotional campaign or advertising, could be considered to further increase awareness of the RDSP by reaching a broader audience.
- Beneficiaries, plan holders, and stakeholders also highlighted difficulties in applying for and opening an RDSP once they are aware of it, indicating a need for more individualized support (key finding 1.4). In the evidence, this support has sometimes been provided by community-based organizations. These organizations, which are well-positioned to reach people with disabilities, could be better enabled to promote the program and assist those facing barriers.
Observation 1: In light of the interdependency between the Canada Disability Savings Program (CDSP) and the Registered Disability Savings Plan (RDSP) and their respective policy objectives, the Program could work with partners to continue to explore ways to better respond to the unique needs of persons with disabilities. Focus could be placed on identifying barriers some individuals may be facing in opening an RDSP or from realizing the full potential of the CDSP and RDSP for long-term saving.
Appendices
Appendix A: Logic model
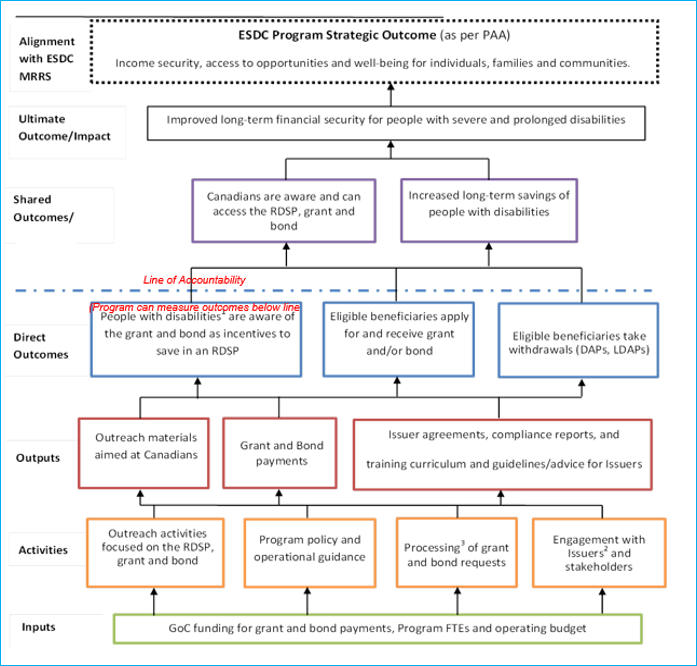
Figure 9: Text description
The inputs for the program, located at the base of the logic model, are Government of Canada funding for grant and bond payments, program full-time equivalents and operating budget.
These inputs are used for the following program activities:
- outreach activities focused on the RDSP, grant and bon
- program policy and operational guidance
- processing3 of grant and bond requests
- engagement with issuers2 and stakeholders
In turn, these activities are expected to lead to the following outputs:
- outreach materials aimed at Canadians
- grant and bond payments
- issuer agreements, compliance reports, and training curriculum and guidelines/advice for issuers
The outputs, in turn, are expected to lead to the following direct outcomes:
- people with disabilities1 are aware of the grant and bond as incentives to save in an RDSP.
- eligible beneficiaries apply for an receive the grant and/or bond
- eligible beneficiaries take withdrawals (DAPs, LDAPs).
In the model, there is a line of accountability above the program's direct outcomes, indicating that the program can measure direct outcomes below that line.
Immediately above the line of accountability and the direct outcomes, the model depicts the expected shared outcome of the program, which include the following:
- Canadians are aware and can access the RDSP, grant and bon
- increased long-term savings of people with disabilities
These shared outcomes are expected to lead to the program's ultimate outcome or impact, which is expected to be improved long-term financial security for people with severe and prolonged disabilities.
This ultimate outcome aligns with the following ESDC's Strategic Program Outcome, as part of the ESDC MRRS: Income security, access to opportunities, and well-being for individuals, families and communities.
- Notes:
- People with disabilities and/or their families/caregivers.
- Issuers are the Canadian financial institutions that offer the Registered Disability Savings Plan.
- Transactions processing is done through the CANADA DISABILITY SAVINGS PROGRAM Administrative System which includes these key activities: systems development, enhancement, maintenance and integrity.
Appendix B: Previous evaluation findings
Evaluations in 2019 and 2014
There have been two evaluations of the CDSP since its inception in 2008:
- Cycle I (formative evaluation completed in 2014) focused on implementation and helped determine if the Program was functioning as intended. It also addressed the issues of relevance and performance (achievement of intended results) during the period 2008 to 2012. Key findings from Cycle I evaluation include the following:
- Relevance: The program is relevant and responds to the needs of people with disabilities regarding their future financial security
- Design and delivery: The program is functioning as intended and is on target to meet its objectives; however, program complexity is a challenge for some
- Outreach: Promotion by program partners could be improved
- Cycle II (summative evaluation completed in 2019), focused on assessing: the Program's relevance; performance; and efficiency/economy; as well as resource utilization in relation to the production of outputs and progress toward expected outcomes. It covered the period from 2008 to 2016. Key findings from Cycle II evaluation include the following:
- Relevance: The Canada Disability Savings Program is one of a suite of programs, tax incentives and financial support measures established by the federal government aimed at persons with disabilities
- Efficiency: Following an initial start-up period when costs were incurred to implement necessary processes and systems, unit costs to administer the Canada Disability Savings Program have dropped rapidly as the number of registered plans rises while administration costs have also been declining
The Cycle II evaluation concluded that the CDSP responded to long-standing and ongoing needs identified by persons with disabilities, their families, and supporting organizations to reduce barriers to saving for an individual's future. In so doing, it encouraged long-term savings to facilitate the financial security of people with severe and prolonged disabilities through the provision of government grants and bonds, as applicable for eligible individuals who opened a RDSP.
Appendix C: Evaluation questions
Evaluation questionsFootnote 32
- How have communication and outreach strategies of ESDC and other partners helped in raising awareness among persons with disabilities, their families and others (friends, former colleagues, organizations, etc.) concerning accessing the RDSP (the CDSG and/or CDSB)?
- 1.1 What outreach efforts enable and encourage eligible beneficiaries and prospective plan holders to apply for an RDSP and receive the CDSG and/or CDSB?
- 1.2 How successful is the program in encouraging persons with disabilities with low to modest incomes to open an RDSP?
- 1.3 To what extent do eligible persons with disabilities who are aware of the program consider that the CDSP is adapted to their specific needs and circumstances, and why?
- What are the efforts made by ESDC to engage with key program stakeholders as well as provincial/territorial counterparts, with regards to the promotion of the program?
- 2.1 Do issuers and other organisations involved in the delivery or promotion of the program, as well as disability organizations who represent populations of potential beneficiaries, find ESDC's outreach activities and tools useful in promoting the RDSP to potential clients?
- What are the barriers or facilitators for those persons with disabilities who have been approved for the DTC and those who may provide them with support (i.e., family, friends, organizations, etc.) to open and maintain an RDSP?
- 3.1 Are the current program parameters for the DTC and Assistance Holdback Amount (AHA) easy to understand for applicants and RDSP beneficiaries?
- 3.2 Are those parameters easy to understand and administer from the perspective of financial institutions?
- To what extent do the CDSG and CDSB motivate eligible beneficiaries or plan holders to save money into an RDSP?
- 4.1 Has there been an increase in the proportion of eligible low- and modest-income families opening a RDSP and being issued either grants or bonds over the years?
- 4.2. To what extent do DTC approved individuals save money outside of a RDSP, and why?
- What are the early impacts of the program on the quality of life or well-being of program beneficiaries and/or plan holders?
- 5.1 How do beneficiaries or plan holders feel about their financial security and confidence towards the future?
- 5.2 What are the characteristics and motivations of those who have started withdrawing funds from their RDSP, including those who were subject to applicable penalties?
Appendix D: Methodology
Key informant interviews
Objective: Key informant interviews were conducted to gather more in-depth knowledge of the program and its various components, and to gain insights from people directly involved in the program's management and delivery, including representatives of organizations who interact directly with end users.
Sampling: 37 key informant interviews were conducted with stakeholders who play diverse roles vis-à-vis the program, including program officials, delivery partners, and other primary stakeholders (e.g., federal government administrative partners, provincial/territorial governments and provincial public guardian and trustee groups).
More specifically, the key informants included:
- Internal stakeholders
- ESDC program staff from the Office for Disability Issues (ODI) and Learning Branch, which is responsible for program operations (5)
- Other Government of Canada stakeholders, such as Canada Revenue Agency (CRA) staff and Disability Tax Credit program staff (5)
- External stakeholders
- Provincial/territorial (P/T) stakeholders, including representatives of P/T governments and P/T public guardian and trustee groups (7)
- Issuers and trustees (financial institutions) (8)
- Organizations providing services to, or representing, persons with disabilities (12)
Key informant interviews were conducted in both English and French, depending on each participant's preference. To obtain a diversity of responses to the evaluation questions, purposive sampling was used, where possible and applicable, to select key informants representing different regions of the country and/or who can speak to the issues faced by various segments of the population of potential program clients (i.e., DTC-eligible persons with disabilities and their family members).
Focus groups
Initial recruitment - survey component
A survey of RDSP holders was previously conducted to support the evaluation of the CDSP. To recruit participants for the survey, the Canada Revenue Agency (CRA) sent a letter to a random sample of RDSP holders, inviting them to complete an online survey posted on ESDC's website. The recruitment was made by the CRA, on behalf of ESDC, since it was not possible for either ESDC or PRA to access CRA's database of RDSP participants. In addition, the CRA could not share contact information with ESDC, since the Income Tax Act does not authorize the sharing of taxpayer information for the purpose of program evaluation.
The CRA sent two rounds of survey invitations. The first round of invitations, which included all provinces and territories except for Quebec, was sent on December 11, 2023. The second round, for RDSP holders in Quebec, was sent on February 7, 2024. The sample development for each round of invitations occurred separately although the sampling was based on the same method.
For both rounds of invitations, the CRA indicated that they generated a random sample of RDSP holders without stratification, after excluding those with the following characteristics:
- deceased RDSP primary caregiver or beneficiary
- have closed the RDSP due to the death of the beneficiary
- have closed the RDSP due to any other reason prior to 2020
- are organizations/agencies acting on behalf of one or more beneficiaries
- do not currently reside in Canada
- children under 18 (have not yet reached the age of majority in their province of residence)
Overall, the CRA sent 169,096 letters, which resulted in 7,522 individuals completing the survey. At the end of the survey, all respondents were invited to provide their contact information if they were also interested in participating in a focus group for the evaluation. In total, 3,715 people indicated their interest in participating in the focus groups. PRA then used the responses from the survey to assign those who responded positively to one of the 10 groups listed above.
Participant recruitment
The recruiting process then included the following steps:
- PRA randomly selected 15 potential participants from each group (where possible).
- PRA then continued randomly selecting and inviting potential participants until the required number of registered participants per group was reached, or until the number of potential participants from each group had been exhausted.
Literature review
The following rapid review principles were employed to conduct the literature review:
- only peer reviewed articles were selected, with the exception a few from grey literature
- inclusion criteria were limited by date, language, and geography
- a single reviewer screened and selected articles
- selected articles were analyzed, and relevant findings were extracted from each article (Tricco et al., 2017Footnote 33)
A total of 38 articles were accepted into the review:
- electronic searches from health and social science indexes were performed using the following keyword searches:
- disability, disabilities, persons with disabilities, people with disabilities
- adult children, family, caregivers, parent, mother, father, child, siblings, grandparents, legal guardian
- savings, financial security, assets, wealth
- registered disability savings plan, disability tax credit, taxation, tax credit
- barriers, facilitators, awareness, lifetime costs, burden, costs, supports, quality of life
Articles were accepted if they met the following inclusion criteria:
- published in English or French
- studies conducted and/or published in Canada and/or in a similar context (e.g., in other OECD countries)
- published from 2012- 2022
- academic journals or textbooks, governmental publications, reports from relevant non-governmental organizations, and other sources deemed appropriate
- relevant to at least one of the evaluation questions
Key challenges and limitations
- The literature does not directly address the effects of government programs on savings made by persons with disabilities and the other issues specifically examined by the evaluation. Nevertheless, the literature make it possible to better understand and consider the external factors that may affect program participation, RDSP savings patterns, or related issues.
- Limited information is available in the literature specifically on RDSP beneficiaries and persons eligible for the Disability Tax Credit (DTC) on behalf of whom no RDSP was opened (that is, eligible non-beneficiaries). The CDSP data have be linked to other datasets to address some evaluation questions, which is a mitigation strategy since it will help overcome some of these data limitations.
Survey
A contractor (PRA) was hired to conduct the survey. PRA worked in collaboration with ESDC to develop the final survey questions.
Sample development to leverage the CRA's database of RDSP participants. The CRA prepared the sample for the survey since the CRA could not share RDSP participant contact information with either ESDC or PRA. The Income Tax Act does not authorize the sharing of taxpayer information for the purpose of program evaluation. The CRA sent two rounds of survey invitations. The first round of survey invitations, which included all provinces and territories except for Quebec, was sent on December 11, 2023. The second round, for RDSP holders in Quebec, was sent on February 7, 2024. The survey was closed on ESDC's website on April 5, 2024. The sample development for each round of invitations occurred separately although the sampling was based on the same method.
For both rounds of invitations, the CRA indicated that they generated a random sample of RDSP holders without stratification, after excluding those with the following characteristics:
- deceased RDSP PCG or beneficiary
- have closed the RDSP due to the death of the beneficiary
- have closed the RDSP due to any other reason prior to 2020
- are organizations/agencies acting on behalf of one or more beneficiaries
- do not currently reside in Canada
- children under 18 (have not yet reached the age of majority in their province of residence)
Surveying: The invitation letters that the CRA sent to potential survey participants explained the purpose of the study and provided the address of a web page web page (URL) where respondents could find the online survey. Respondents also had the option of completing the survey with PRA by phone (with PRA entering information directly into the online survey form).
Response rate: In total, 7,522 people completed the survey, 7,350 responding online and 172 by telephone. Another 165 accessed the survey but did not provide their consent to participate in the survey. This marked a response rate of 4.4% based on those who consented and completed the survey. Based on the sample of 169,096 letters sent by the CRA, a sample of 7,522 yields a margin of error of ±1.1% (based on a 95% confidence interval).
Data cleaning: The survey files received by PRA contained 7,522 completed survey records. The file did not contain any partially completed survey records; therefore, all survey data was used for reporting. Because almost all questions were mandatory, there were no instances of missing data in the data set.
Analysis of linked administrative data
The methodology aimed to address evaluation questions 1.2, 4.1, 4.2, and 5.2 through quantitative analyses of the administrative data. It complemented the qualitative data collection and analysis planned as part of the evaluation cycle and helps provide insights into the Program's progress in achieving its expected outcomes. The methodology includes data quality assessment, descriptive statistics analysis, outcome trend, and logistic regression analysis. It is based on the available data. Richer data analysis could be completed in the future with additional variables added from integrated datasets. In addition to the approaches above, the evaluation also explores any relevant information from previous progress reports produced by the program. These reports may provide valuable insights into the program's implementation, achievements, and challenges.
Levels of family income and eligibility thresholds for bonds and grant recipients in CDSP
The evaluation questions place an important focus on low and modest-income families, in particular the savings behaviour and take-up rate among eligible individuals from low and modest-income families. To examine these groups, the study uses income levels that are based on the program thresholds used to determine bonds and grants levels (see Appendix E for detailed thresholds). This creates four categories by family income levels. The income used aligns with the program guidelines, that is, the family net income from two years prior (i.e., calculations for bonds in 2021 would use family net income from 2019 CRA tax data). Individuals over 50 years old are also removed.
Sociodemographic profiles of participants
The descriptive statistics analysis allows understanding the profile of the beneficiaries/plan holders using their socio-economic characteristics such as gender, age, marital status, income level, immigration status, location, as well as their savings behaviours, in terms of personal RDSP contributions, and from RDSPs.
Outcome trend
The outcome trend analysis can help look at the changes in outcome variables over time.
These outcome variables include CDSG and CDSB amounts, RDSP contributions and take-up rate, as well as withdrawal patterns.
- For Evaluation Question 1.2, the analysis examines the RDSP take-up rates among DTC-approved individuals under 50, by income level and from low-income and modest-income families, across various subgroups, including age, gender, marital status, and location (i.e., urban/rural) and by provinces/territories.
- For Evaluation Question 4.1, the analysis examines and compares the patterns in the distribution of total CDSG and CDSB amounts received annually, from 2010 to 2021, the most recent year for which data is available. Note that the receipt of CDSB signifies that these beneficiaries meet the income criteria for low-and modest-income households.
- For Evaluation Question 5.2, we analyze the profiles of RDSP participants who made withdrawals from their accounts, based on their socio-demographic characteristics.
Regression discontinuity design (RDD)
The evaluation also employs RDD to assess whether being eligible for some bonds and grants (at the highest matching rate) has an impact on opening an RDSP account. The RDD is well-suited to this situation because the CDSP relies on a defined set of net adjusted family income threshold to determine who is eligible to receive bonds or the level of matching grants and who is not.
The treatment variable is defined as being eligible to receive bond or grant (at the highest matching rate) and the outcome variable is defined as opening or not an RDSP account for a given year. The to estimate the impact of being eligible for some bond amounts or grants (treatment) on opening RDSP account. The main limitation of the RDD is that it provides estimates of local average treatment effects (LATE) around the eligibility cutoff/threshold at the point where treatment and comparison units are most similar.
Limitations and challenges
The analysis used linked CDSP administrative data and personal income tax data (T1 Family File (T1FF) data), integrated and accessed through Statistics Canada. It should be noted that the linked data file does not include RDSP beneficiaries who could not be linked to a T1FF record in at least one year over the reference period from 2010 to 2021. This mainly resulted in the exclusion individuals under 19 years old who did not file an income tax return during the evaluation period. Results from this analysis should be interpreted accordingly, and discrepancies may arise relative to the results presented in the program's annual report based on the entire population.
Appendix E: Program background
Benefits of the CDSP at different income levels
The CDSP is comprised of two federal saving incentives that the Government transfers into an active RDSP on an annual basis:
- the Canada Disability Savings Grant (CDSG) - an incentive paid into an RDSP if the plan holder/beneficiary made the required contribution; and,
- the Canada Disability Savings Bond (CDSB) - an incentive for low- and modest-income individuals, paid into their RDSPs without any required contribution.
| Income level | Income range | CDSB | Maximum CDSG |
|---|---|---|---|
| Level 1 | Less than or equal to $34,863 | $1,000 | $3,500 |
| Level 2 | Between $34,863 and $53,359 | < $1,000 | $3,500 |
| Level 3 | Greater than or equal to $53,359 and less than or equal to $106,717 | None | $3,500 |
| Level 4 | Greater than $106,717 | None | $1,000 |
| Other | No income information provided | None | $1,000 |
- Source: Employment and Social Development Canada (ESDC, 2025), Canada Disability Savings Program: 2023 Annual Report
The program uses 3 levels of income to determine whether the recipient is eligible for bonds, or the program's contribution levels, or both: Phase out income, first threshold, and second threshold. These are defined by the Canada Disability Savings Act and indexed each year according to inflation.
- If the household income is below the phase out income, then the income belongs to the Low Family Income category
- If the household income is between phase out income and the first threshold, then the income belongs to the Modest Family Income category
- If the household income is between the first threshold and the second threshold, then the income belongs to the High Income I category
- If the household income is above the second threshold, then the income belongs to High Income II
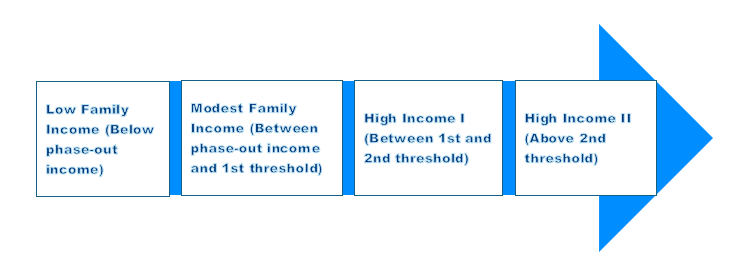
Figure 10: Text description
This figure shows the income thresholds used to determine eligibility for the grant and the bond from the lowest to the highest income categories. These categories include the following:
- Low Family Income (Below phase-out income)
- Modest Family Income (Between phase-out income and first threshold)
- High Income I (Between first and second threshold)
- High Income II (Above second threshold)
| Income Threshold | Definition |
|---|---|
| Phase out income | The income level above which the annual amount of Canada Disability Savings bond payable begins to decrease. |
| First threshold | The income level that, when reached or exceeded, the annual amount of Canada Disability Savings bond payable is nil. |
| Second threshold | The income level that, when below or equal to, the matching grant will be 300% of the first $500 in contributions and 200% of the next $1,000 in contributions. When income is above this level, the matching grant will be 100% of the first $1,000 in contributions. |
Below are the income thresholds used to determine eligibility and matching amounts for the Canadian Disability Savings Grant (CDSG) and the Canadian Disability Savings Bond (CDSB). These thresholds are based on net family income and are used to identify the levels of income at which the grant and bond amounts begin to phase out, ensuring that the financial assistance is targeted to those who need it most.
| Year | Phase out income | First threshold | Second threshold |
|---|---|---|---|
| 2022 | $32,797 | $50,197 | $100,392 |
| 2021 | $32,028 | $49,020 | $98,040 |
| 2020 | $31,711 | $48,535 | $97,069 |
| 2019 | $31,120 | $47,630 | $95,259 |
| 2018 | $30,450 | $46,605 | $93,208 |
| 2017 | $30,000 | $45,916 | $91,831 |
| 2016 | $26,364 | $45,282 | $90,563 |
| 2015 | $26,021 | $44,701 | $89,401 |
| 2014 | $25,584 | $43,953 | $87,907 |
| 2013 | $25,356 | $43,561 | $87,123 |
| 2012 | $24,863 | $42,707 | $85,414 |
| 2011 | $24,183 | $41,544 | $83,088 |
| 2010 | $23,855 | $40,970 | $81,941 |
| 2009 | $23,710 | $40,726 | $81,452 |
| 2008 | $21,287 | $37,855 | $75,769 |
- Source: Notice #506 - Registered Disability Savings Plan income matching rates for 2024 - Canada.ca, Notice # 302 - Registered Disability Savings Plan (RDSP) income matching rates for 2018
CDSG and CDSB disbursements
| Type of spending | 2017 to 2018 | 2018 to 2019 | 2019 to 2020 | 2020 to 2021 | 2021 to 2022 | 2022 to 2023 | 2023 to 2024 |
|---|---|---|---|---|---|---|---|
| Canada Disability Savings Grant - Actual Spending | $338,169,730 | $360,497,495 | $371,028,405 | $406,524,376 | $469,040,663 | $466,813,648 | $497,774,642 |
| Canada Disability Savings Bond - Actual Spending | $149,550,677 | $152,650,737 | $137,353,313 | $139,813,480 | $185,520,238 | $177,800,665 | $185,889,682 |
| Total - Actual Spending | $487,720,407 | $513,148,232 | $508,381,718 | $546,337,856 | $654,560,901 | $644,614,313 | $683,664,324 |
Appendix F: Demographic differences in take-up rates
Calculation only considered RDSP beneficiaries and DTC-approved individuals who filed taxes individually and did not include a large proportion of individuals under 19 years. Therefore, results from this analysis should be interpreted accordingly and discrepancies may arise relative to the results presented in the program's annual report based on the entire population
Differences by province/territory
The take-up rate among low and modest family income eligible DTC holders varies by province and territory, with the lowest rates in the Atlantic provinces, the Northwest Territories and Yukon. The highest take-up rates were seen in BC and Quebec.
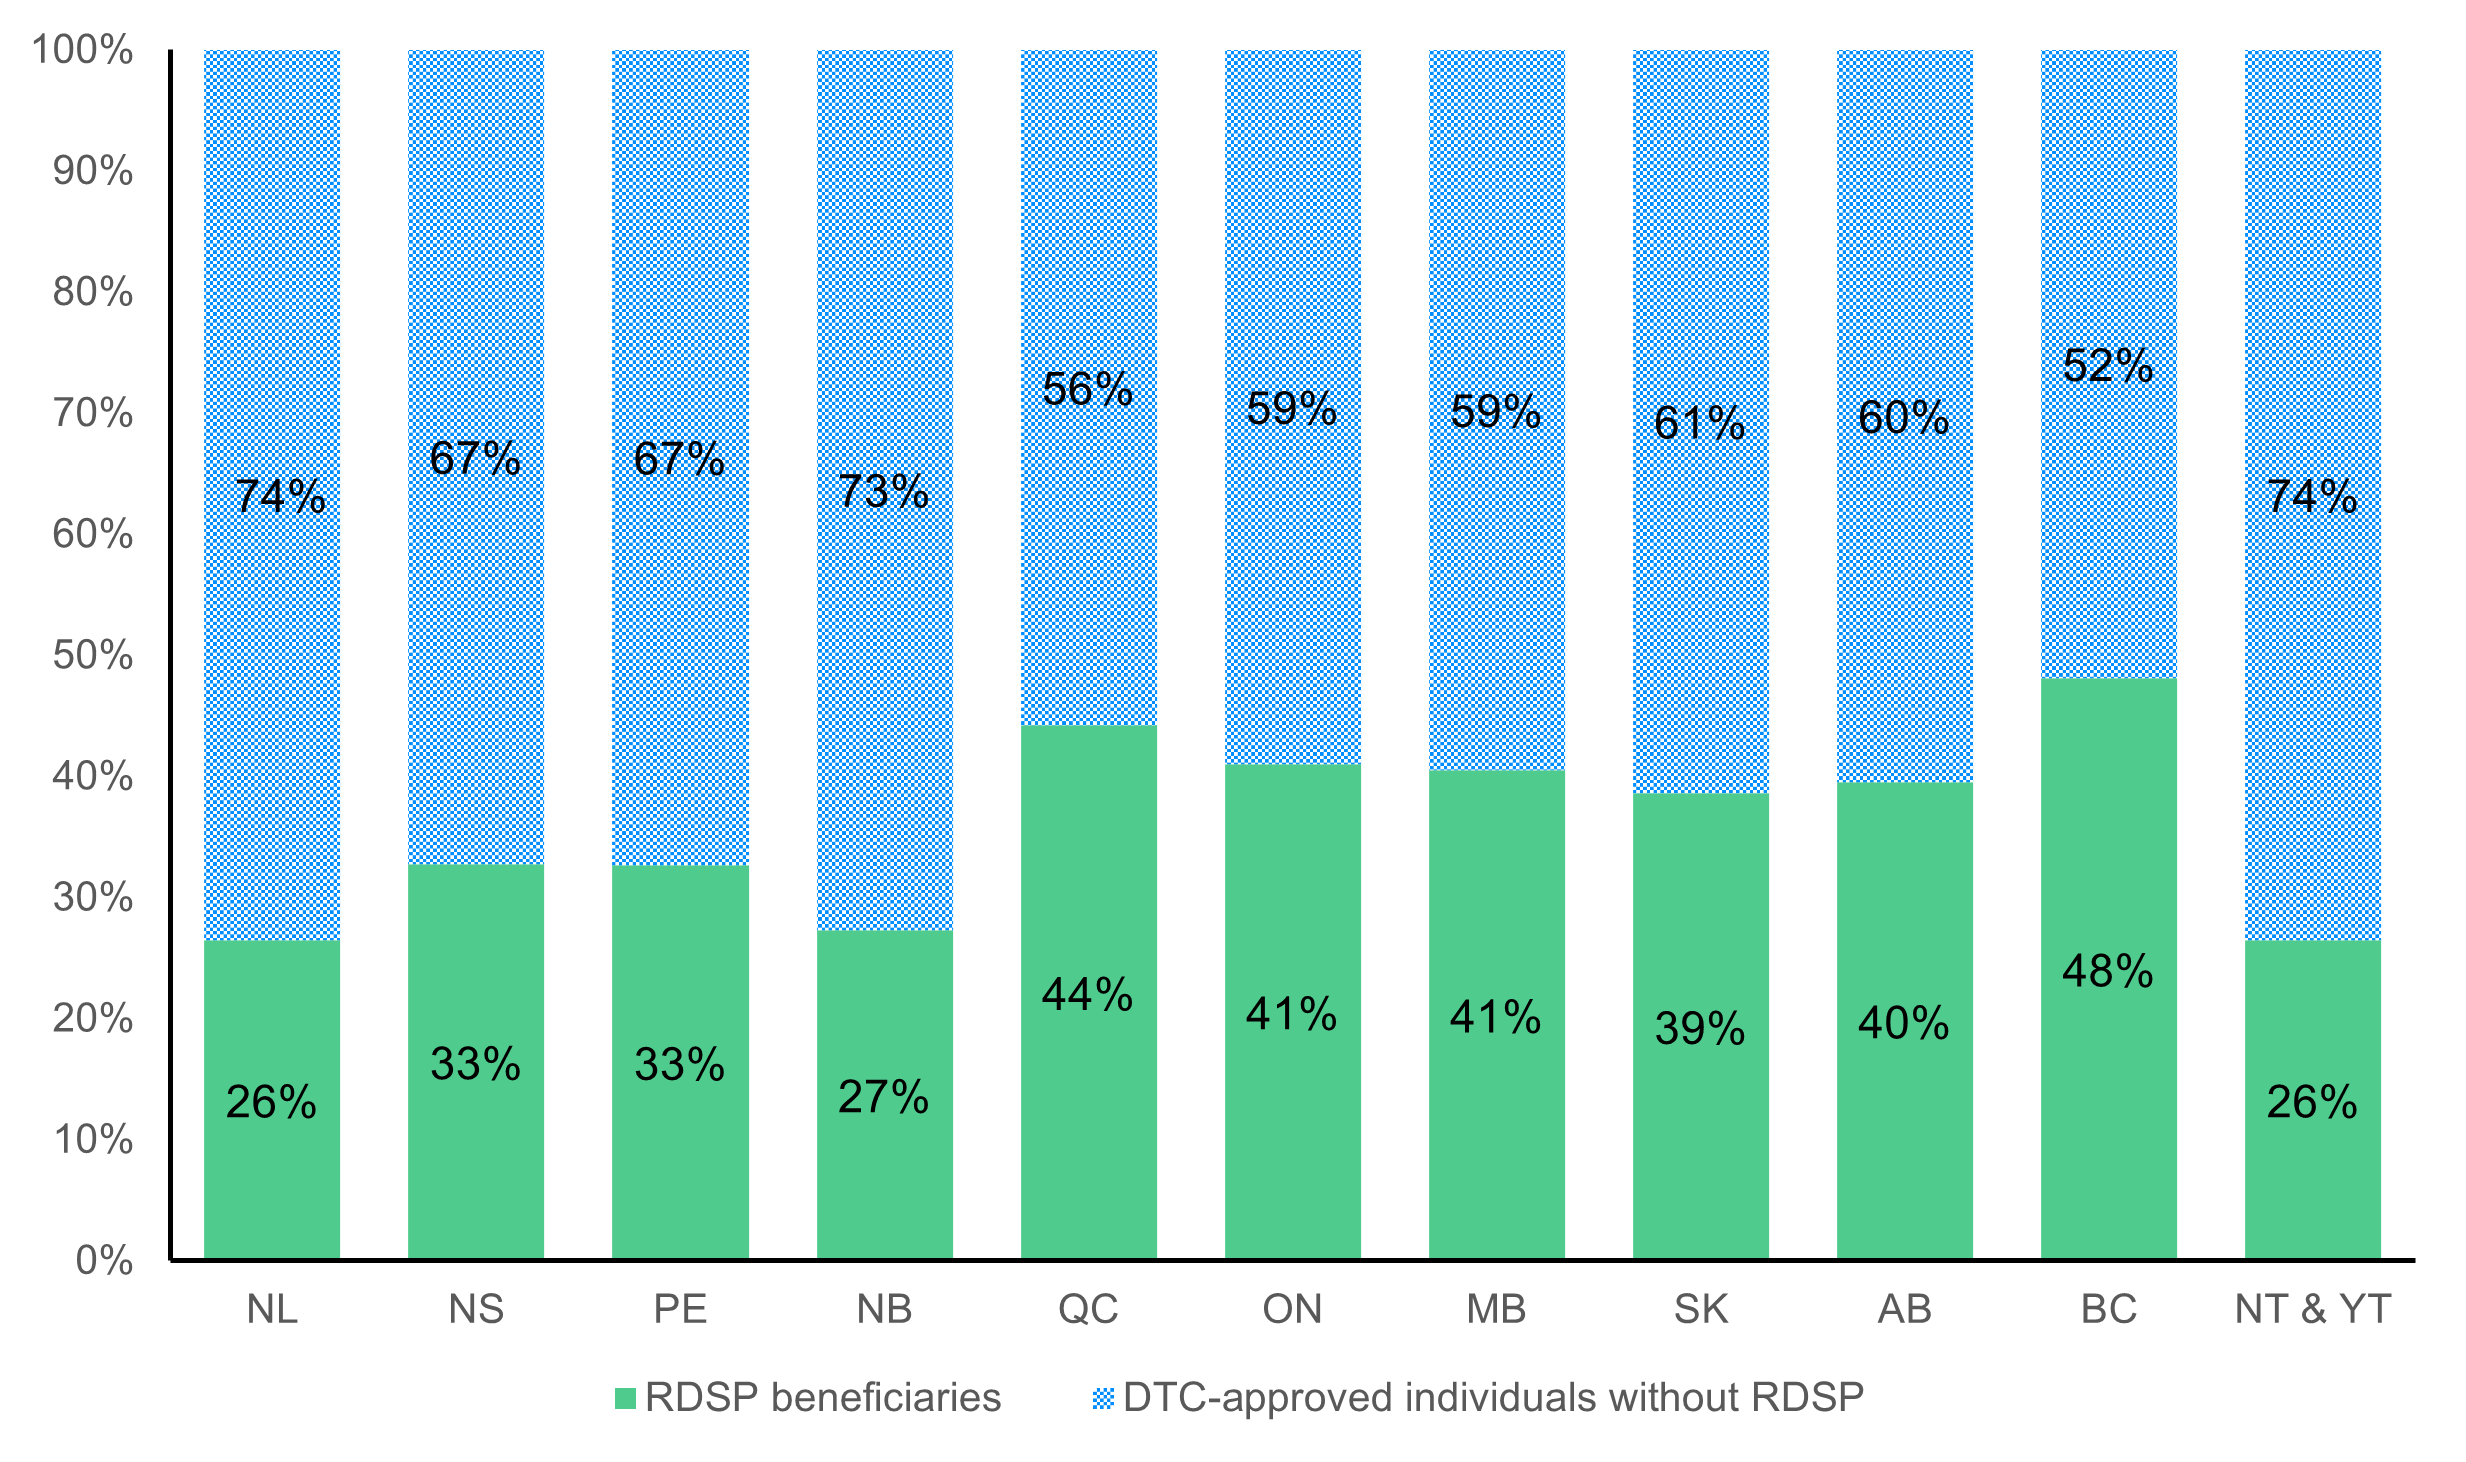
Figure 11: Text description
| Province or territory | Proportion of RDSP beneficiaries (%) | Proportion of DTC-approved individuals without RDSP (%) |
|---|---|---|
| NL | 26% | 74% |
| NS | 33% | 67% |
| PE | 33% | 67% |
| NB | 27% | 73% |
| QC | 44% | 56% |
| ON | 41% | 59% |
| MB | 41% | 59% |
| SK | 39% | 61% |
| AB | 40% | 60% |
| BC | 48% | 52% |
| NT and YT | 26% | 74% |
- Source: Employment and Social Development Canada (2025). Technical Report: Evaluation of the CDSP using linked administrative data
Differences by marital status and by age group
Among eligible DTC holders with low and modest incomes, the take-up rate is highest for single and divorced individuals and lowest for married and common law partners.
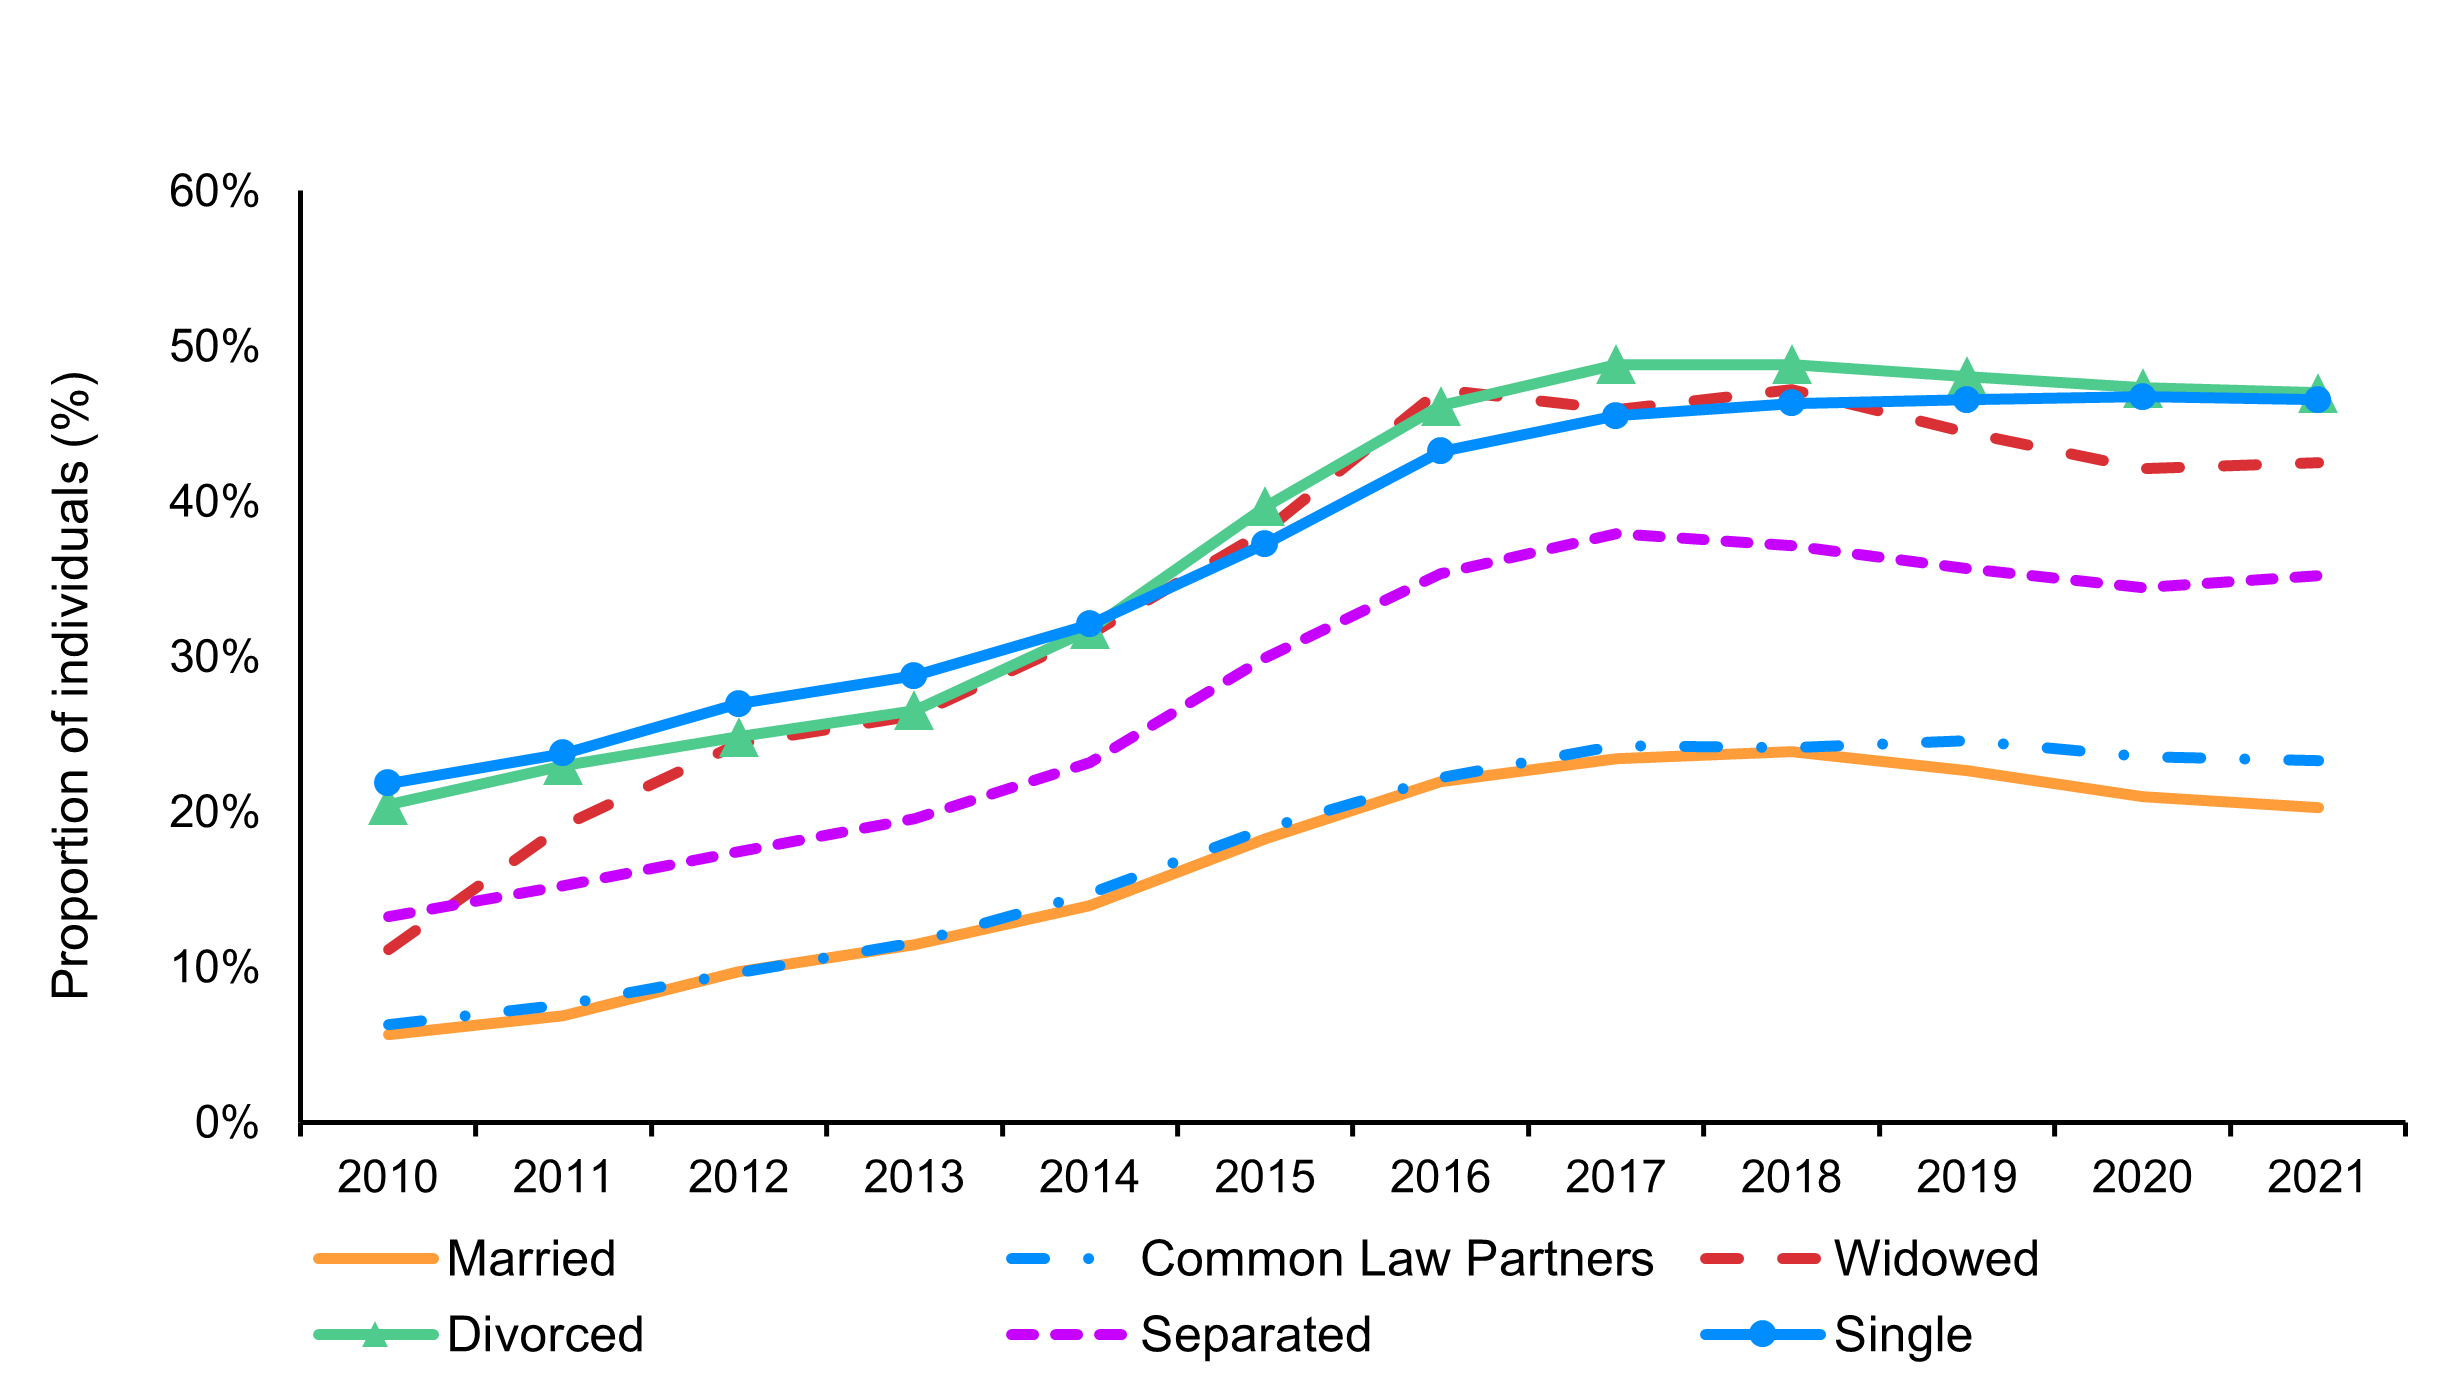
Figure 12: Text description
| Year | Married (%) | Common Law Partners (%) | Widowed (%) | Divorced (%) | Separated (%) | Single (%) |
|---|---|---|---|---|---|---|
| 2010 | 6% | 6% | 11% | 20% | 13% | 22% |
| 2011 | 7% | 8% | 19% | 23% | 15% | 24% |
| 2012 | 10% | 10% | 24% | 25% | 17% | 27% |
| 2013 | 11% | 12% | 26% | 27% | 20% | 29% |
| 2014 | 14% | 15% | 31% | 32% | 23% | 32% |
| 2015 | 18% | 19% | 38% | 40% | 30% | 37% |
| 2016 | 22% | 22% | 47% | 46% | 35% | 43% |
| 2017 | 23% | 24% | 46% | 49% | 38% | 46% |
| 2018 | 24% | 24% | 47% | 49% | 37% | 46% |
| 2019 | 23% | 25% | 44% | 48% | 36% | 47% |
| 2020 | 21% | 24% | 42% | 47% | 34% | 47% |
| 2021 | 20% | 23% | 43% | 47% | 35% | 47% |
- Source: Employment and Social Development Canada (2025). Technical Report: Evaluation of the CDSP using linked administrative data.
Among eligible DTC holders with low and modest incomes, the take-up rate varies by age group. Among those aged 35 to 49 and 19 to 34 years old, the rate increases over time and remains relatively stable after 2016.
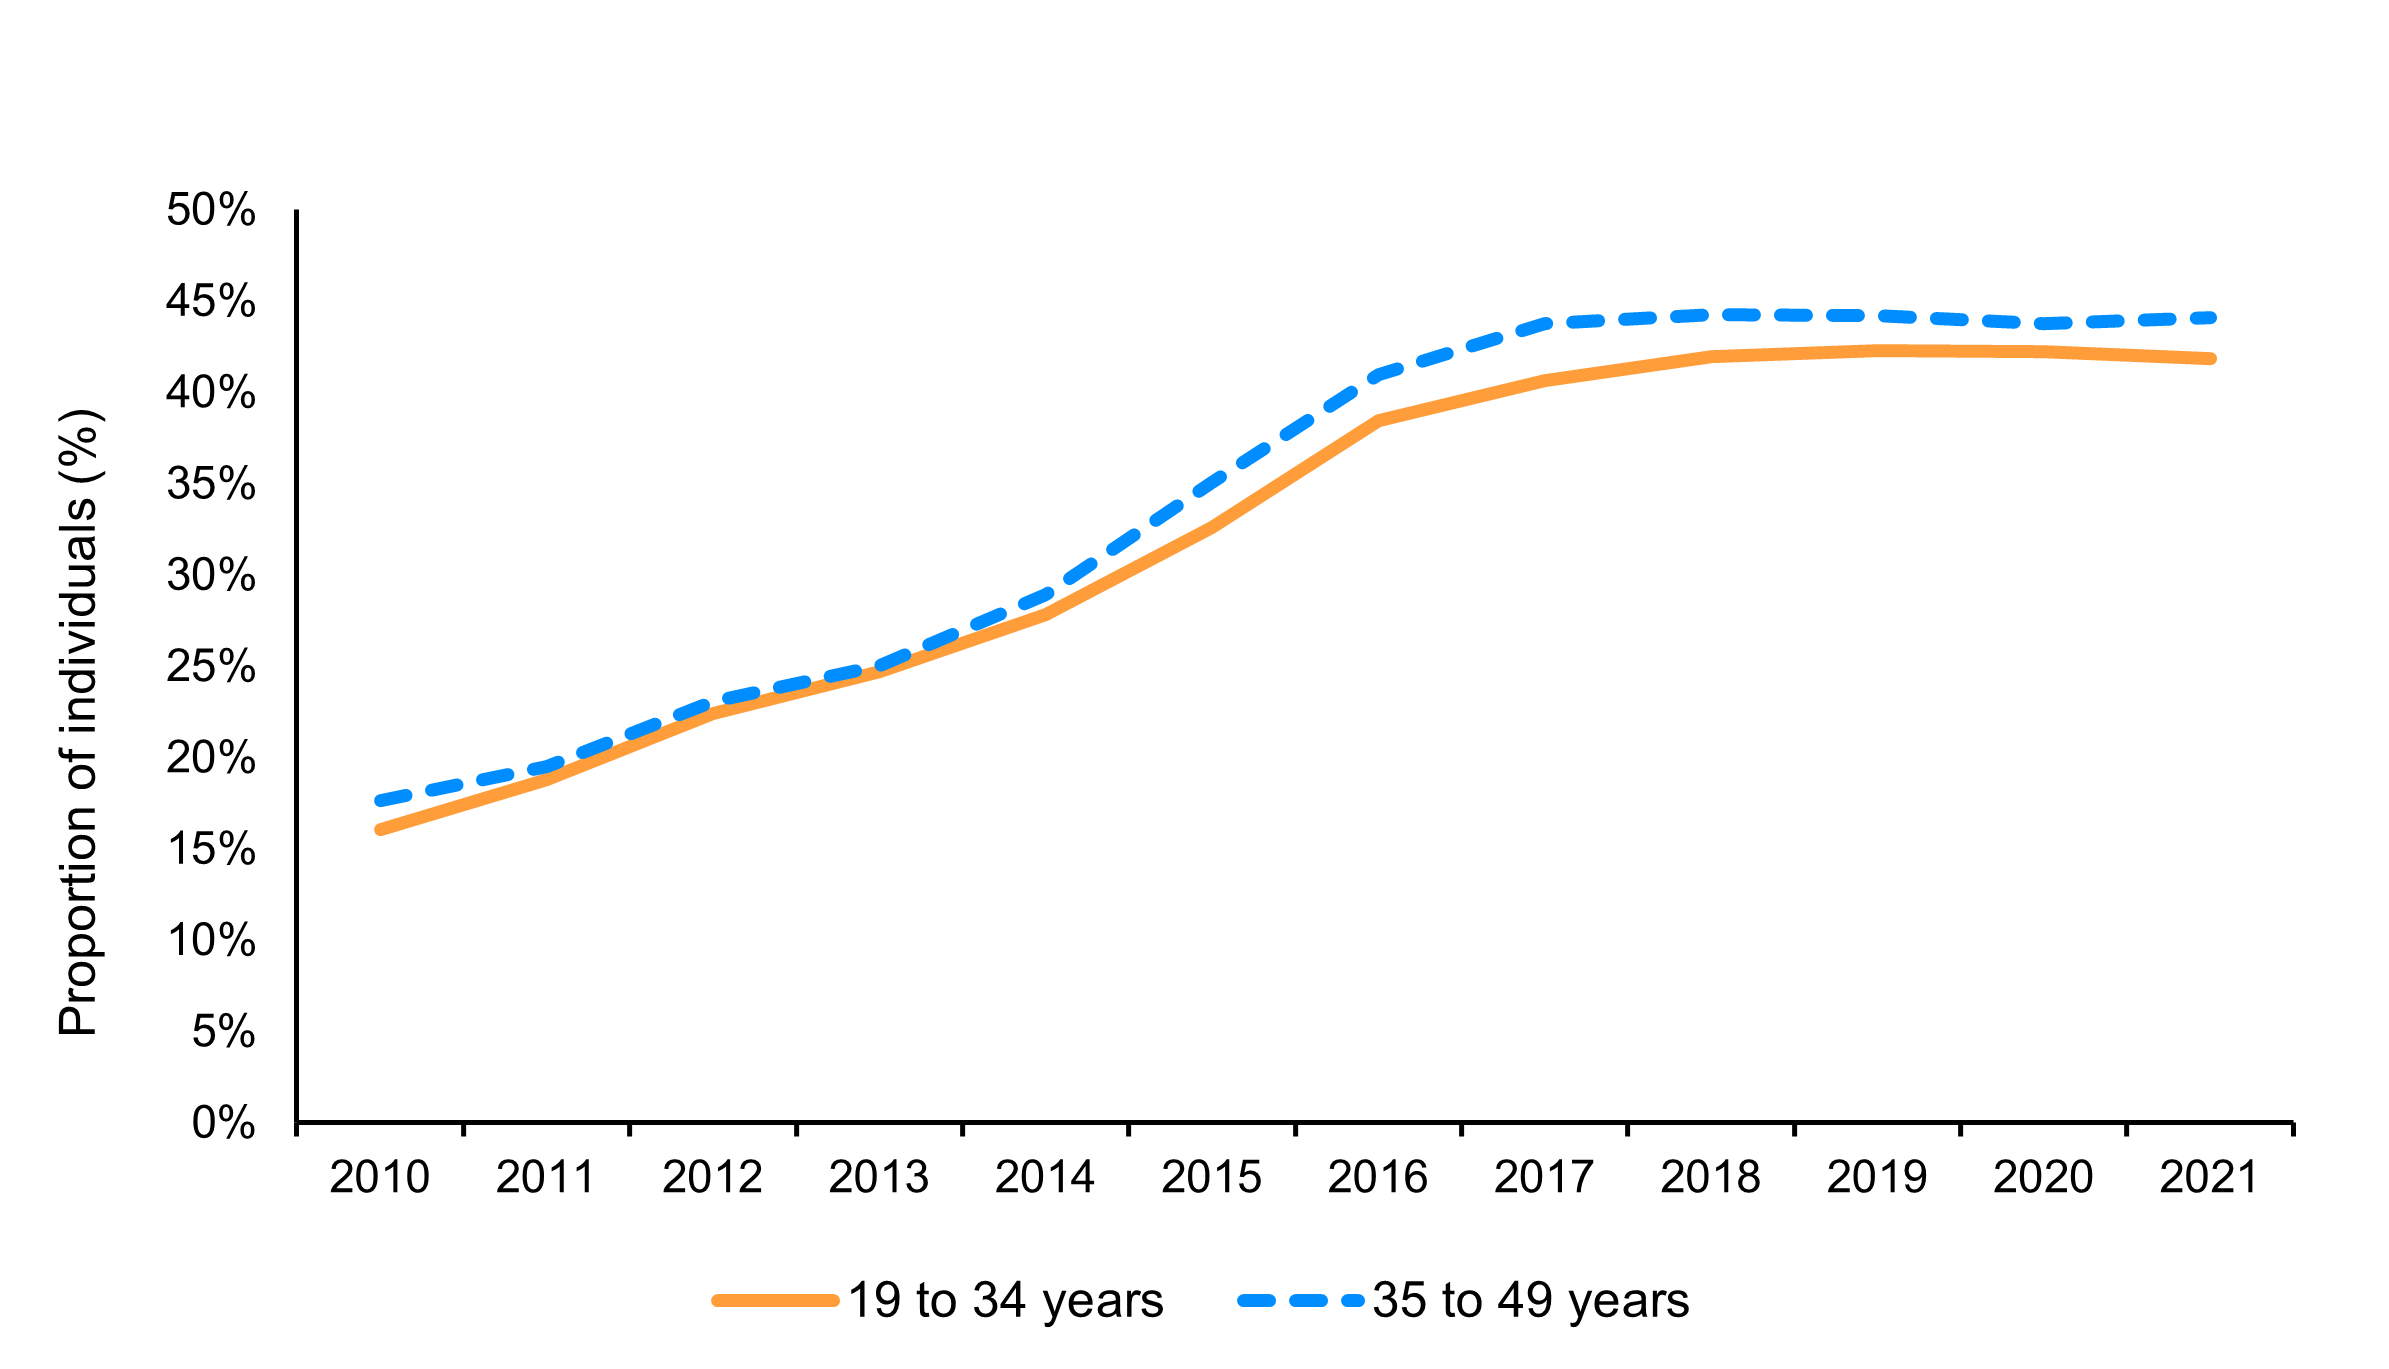
Figure 13: Text description
| Year | 0 to 18 years | 19 to 34 years | 35 to 49 years |
|---|---|---|---|
| 2010 | 2% | 16% | 18% |
| 2011 | 3% | 19% | 20% |
| 2012 | 3% | 22% | 23% |
| 2013 | 4% | 25% | 25% |
| 2014 | 5% | 28% | 29% |
| 2015 | 4% | 33% | 35% |
| 2016 | 5% | 38% | 41% |
| 2017 | 6% | 41% | 44% |
| 2018 | 6% | 42% | 44% |
| 2019 | 6% | 42% | 44% |
| 2020 | 7% | 42% | 44% |
| 2021 | 6% | 42% | 44% |
- Source: Employment and Social Development Canada (2025). Technical Report: Evaluation of the CDSP using linked administrative data.
Differences by gender and by area
A small gender gap remains in the take-up rate among low and modest income eligible DTC holders, with a lower proportion of female eligible individuals opening an RDSP.
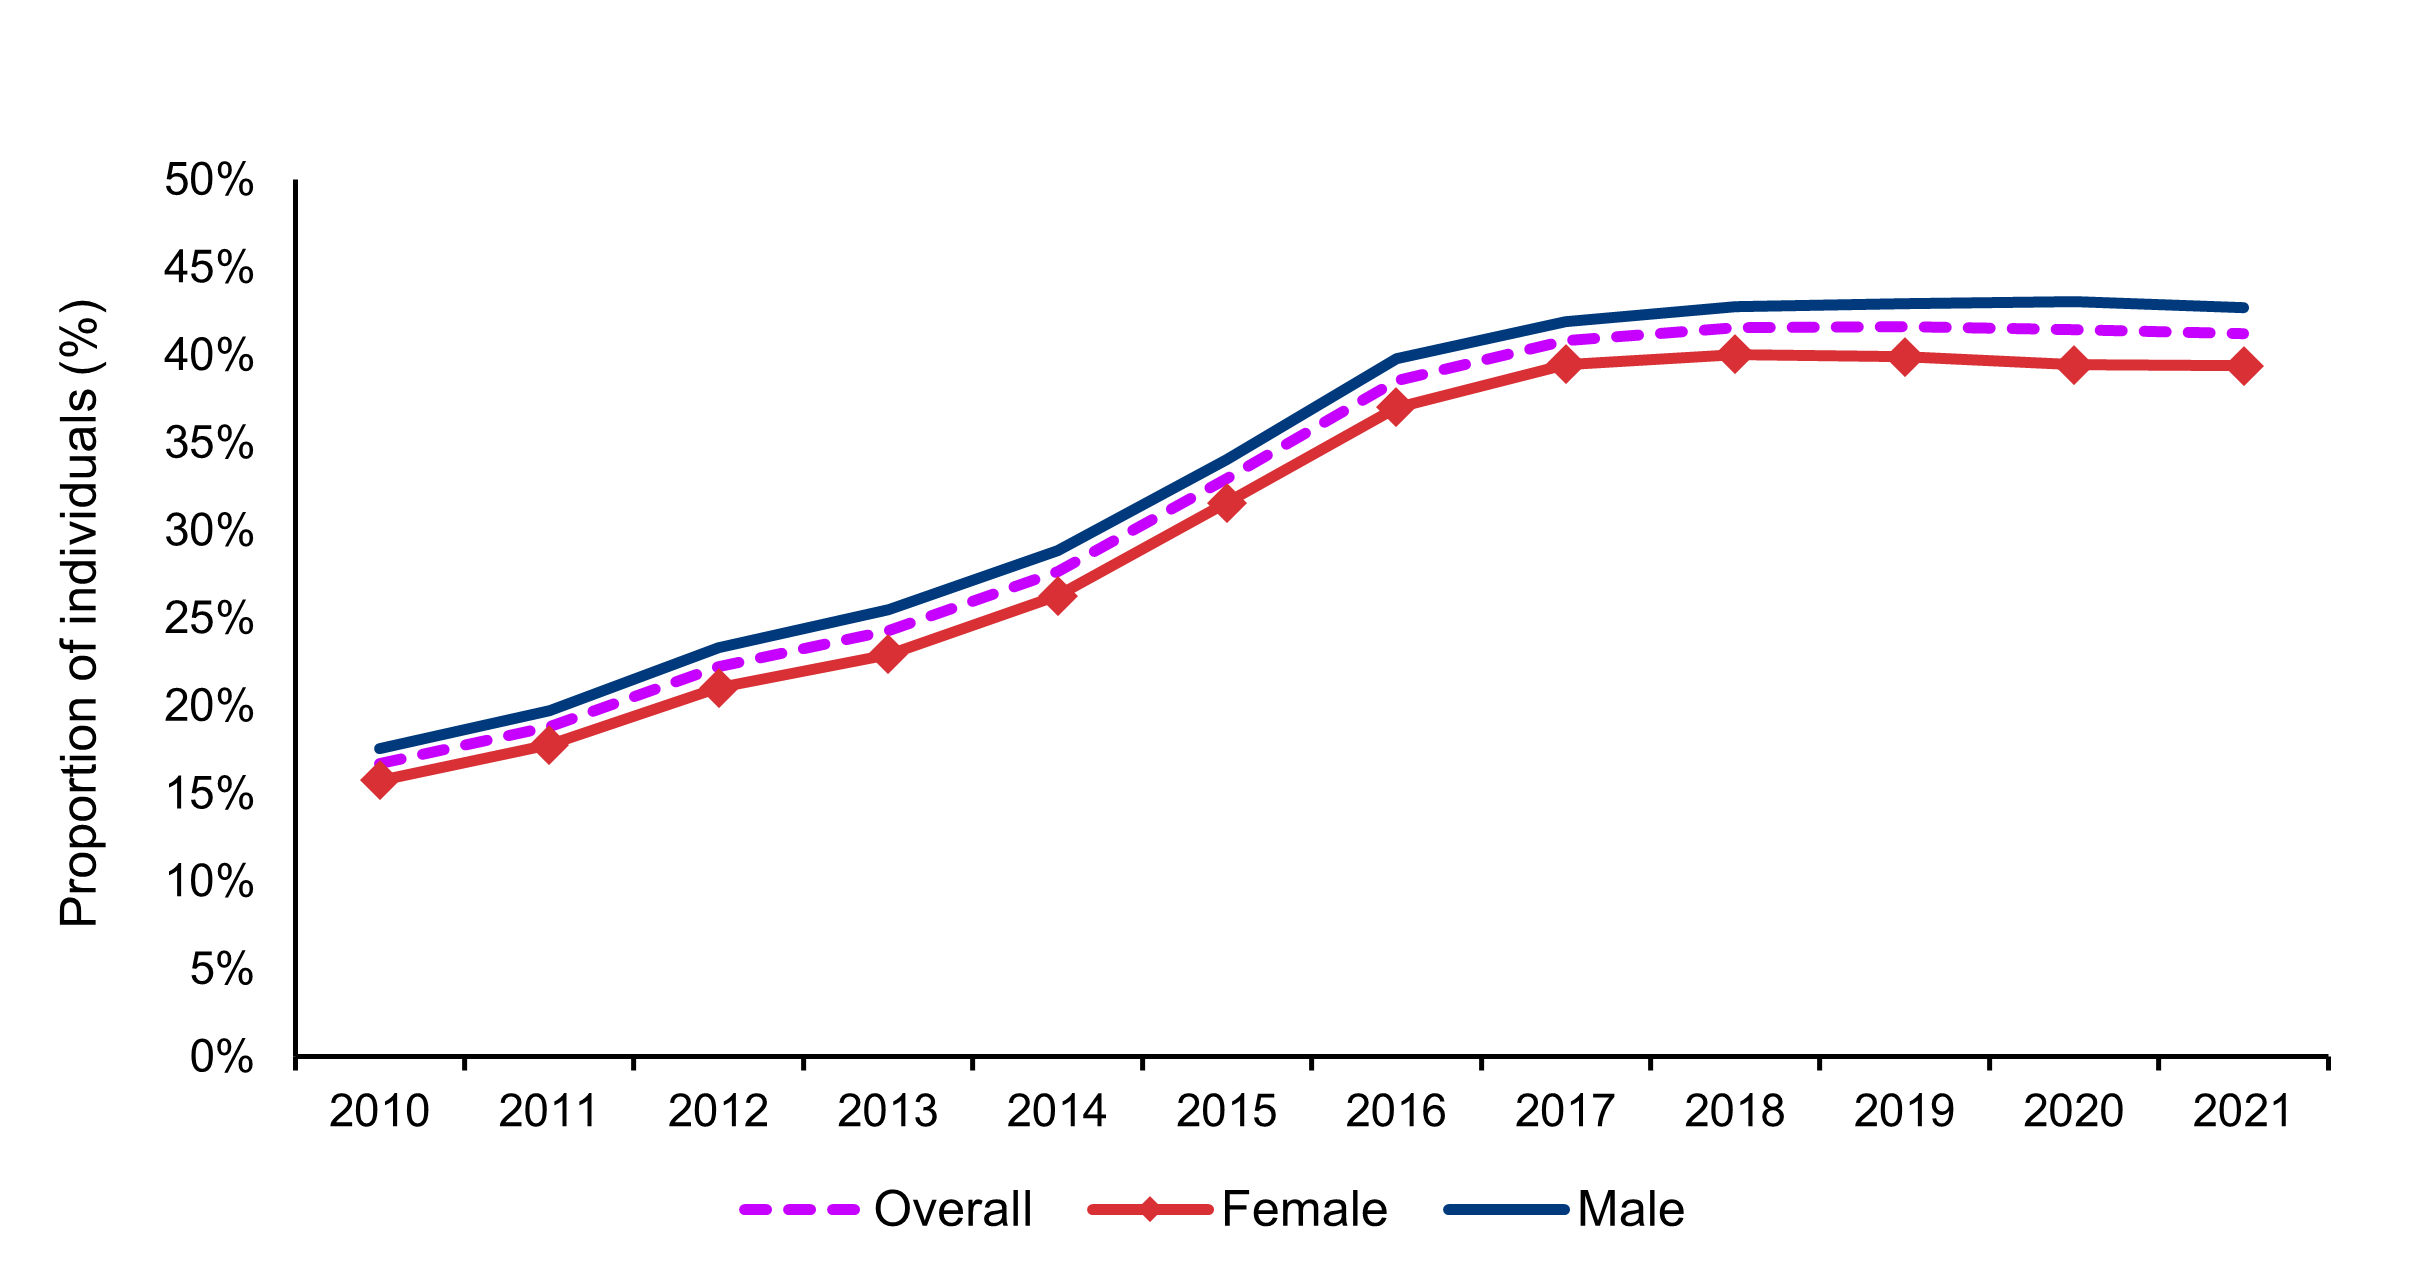
Figure 14: Text description
| Year | Overall | Female | Male |
|---|---|---|---|
| 2010 | 17% | 16% | 18% |
| 2011 | 19% | 18% | 20% |
| 2012 | 22% | 21% | 23% |
| 2013 | 24% | 23% | 25% |
| 2014 | 28% | 26% | 29% |
| 2015 | 33% | 32% | 34% |
| 2016 | 39% | 37% | 40% |
| 2017 | 41% | 39% | 42% |
| 2018 | 42% | 40% | 43% |
| 2019 | 42% | 40% | 43% |
| 2020 | 41% | 39% | 43% |
| 2021 | 41% | 39% | 43% |
- Source: Employment and Social Development Canada (2025). Technical Report: Evaluation of the CDSP using linked administrative data.
Among low and modest family income eligible DTC holders, the take-up rate is consistently higher for individuals living in urban areas.
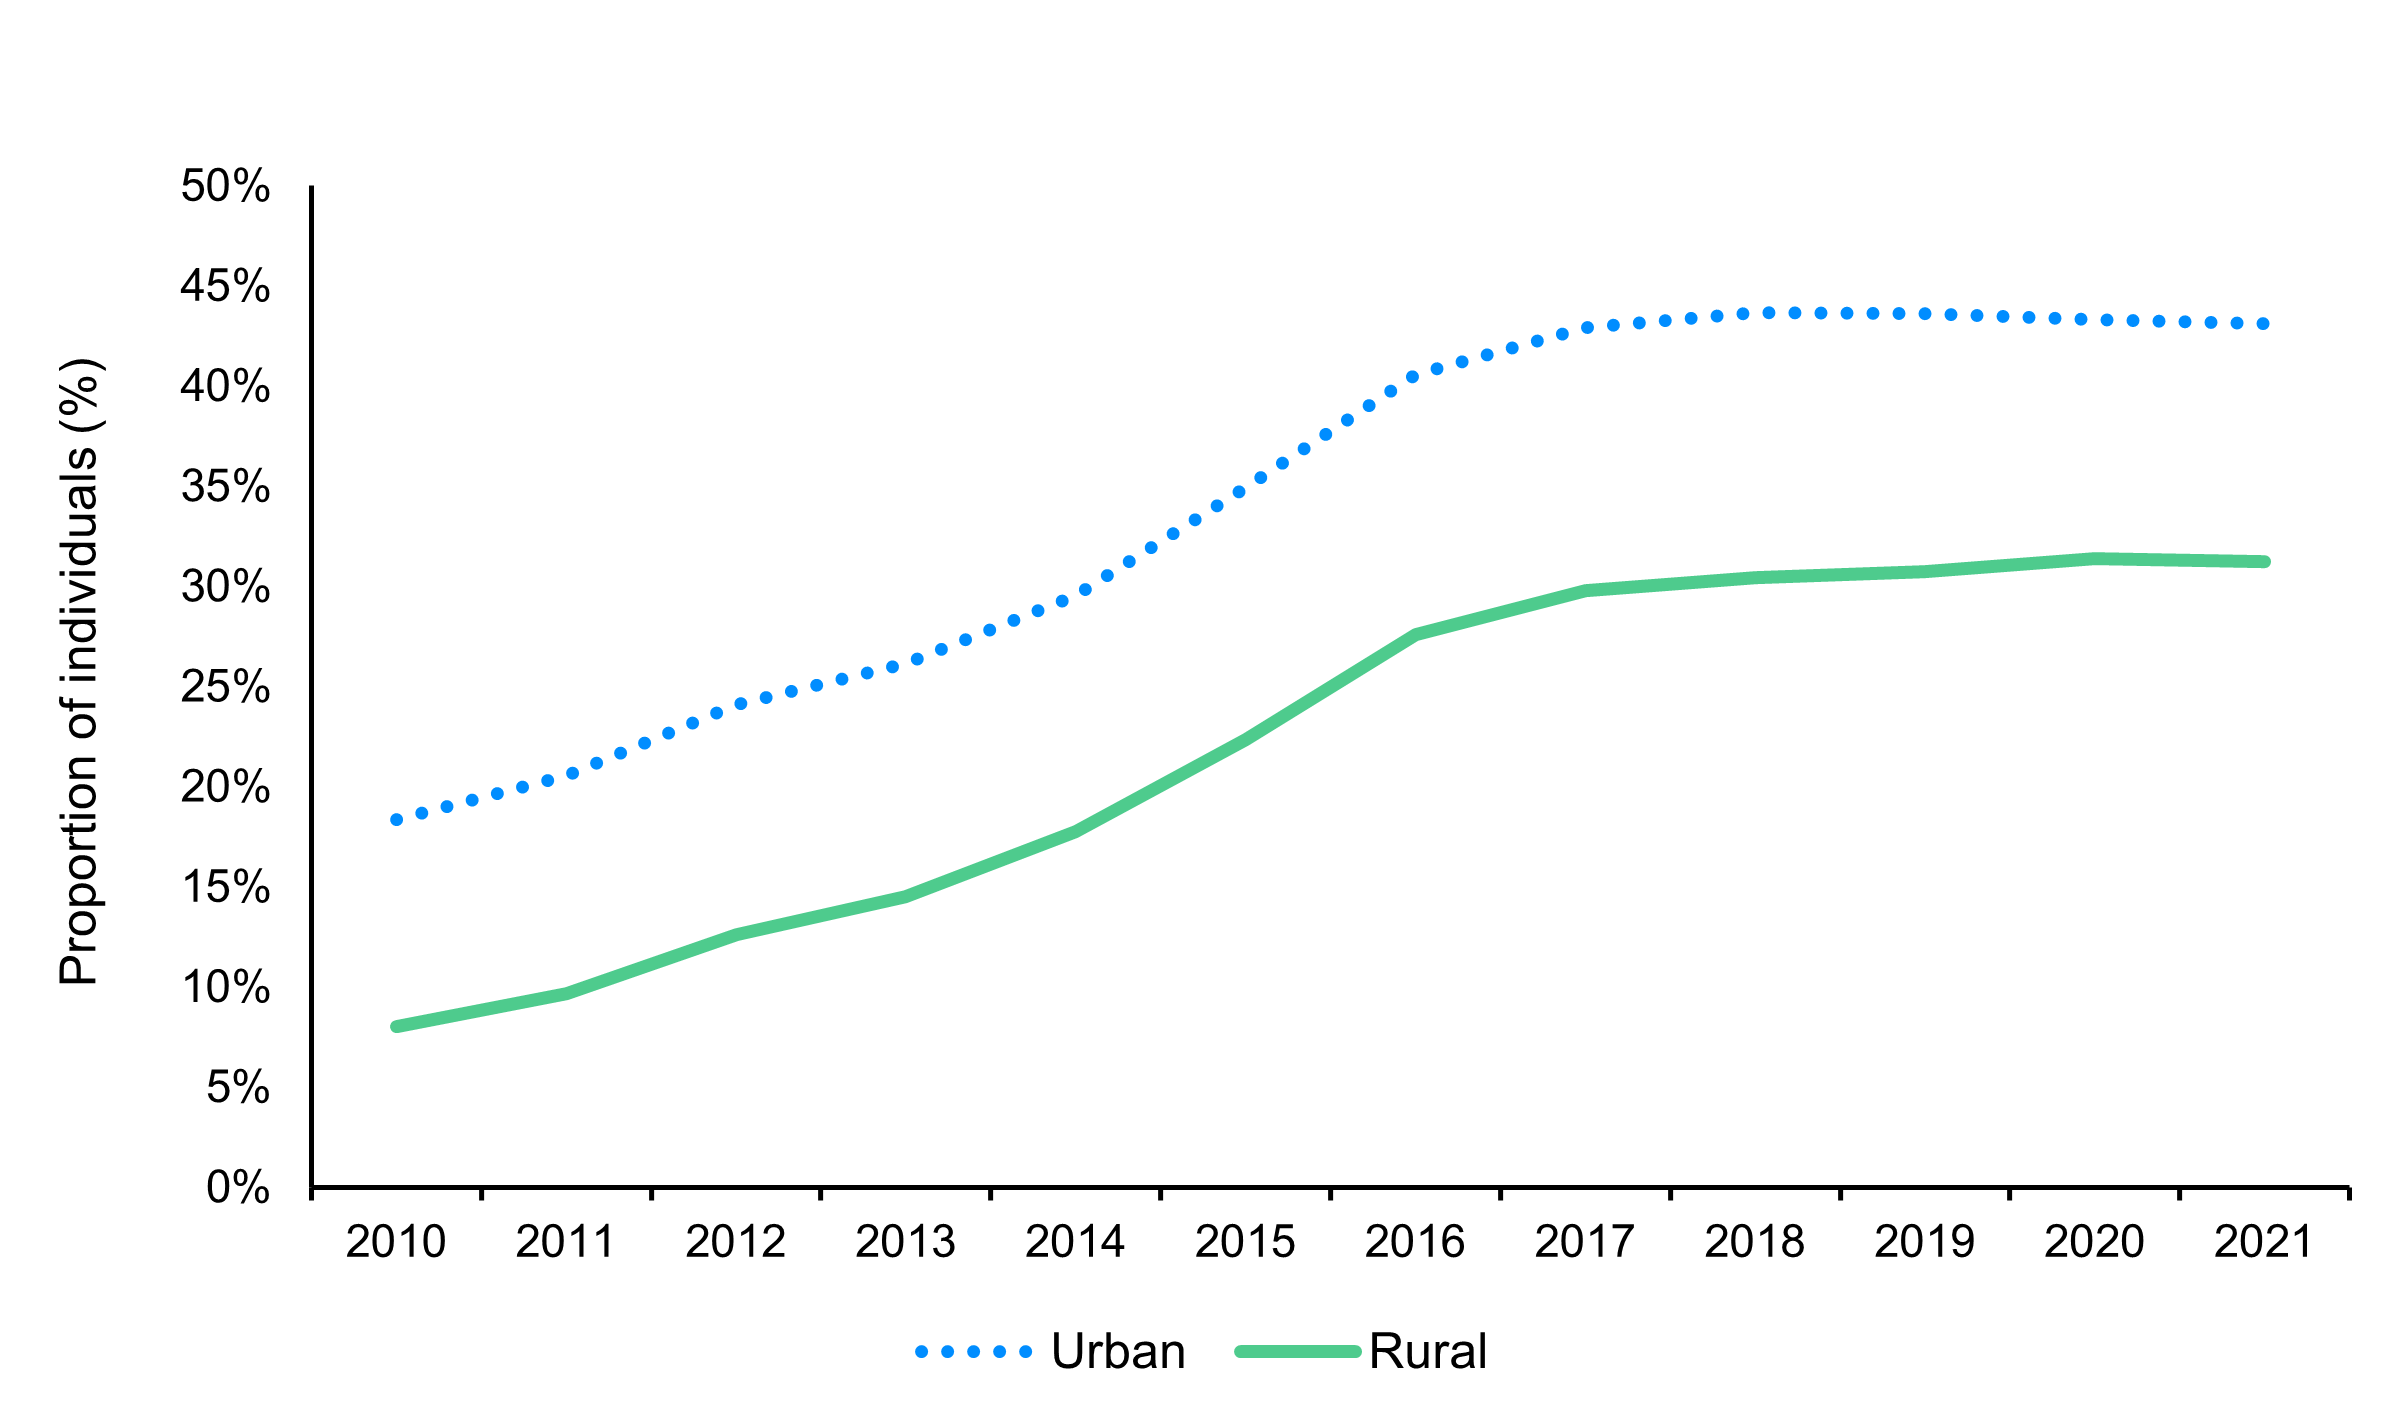
Figure 15: Text description
| Year | Urban | Rural |
|---|---|---|
| 2010 | 18% | 8% |
| 2011 | 21% | 10% |
| 2012 | 24% | 13% |
| 2013 | 26% | 14% |
| 2014 | 30% | 18% |
| 2015 | 35% | 22% |
| 2016 | 41% | 28% |
| 2017 | 43% | 30% |
| 2018 | 44% | 30% |
| 2019 | 44% | 31% |
| 2020 | 43% | 31% |
| 2021 | 43% | 31% |
- Source: Employment and Social Development Canada (2025). Technical Report: Evaluation of the CDSP using linked administrative data.
Appendix G: Withdrawals from the RDSPs
Among RDSP beneficiaries, the proportion of individuals who withdrew money from their accounts was higher than overall average for women, widowed, divorced, separated and low-income individuals.
Individuals from both high-income brackets (Level 1 and Level 2) had the lowest proportions who withdrew money from their accounts.
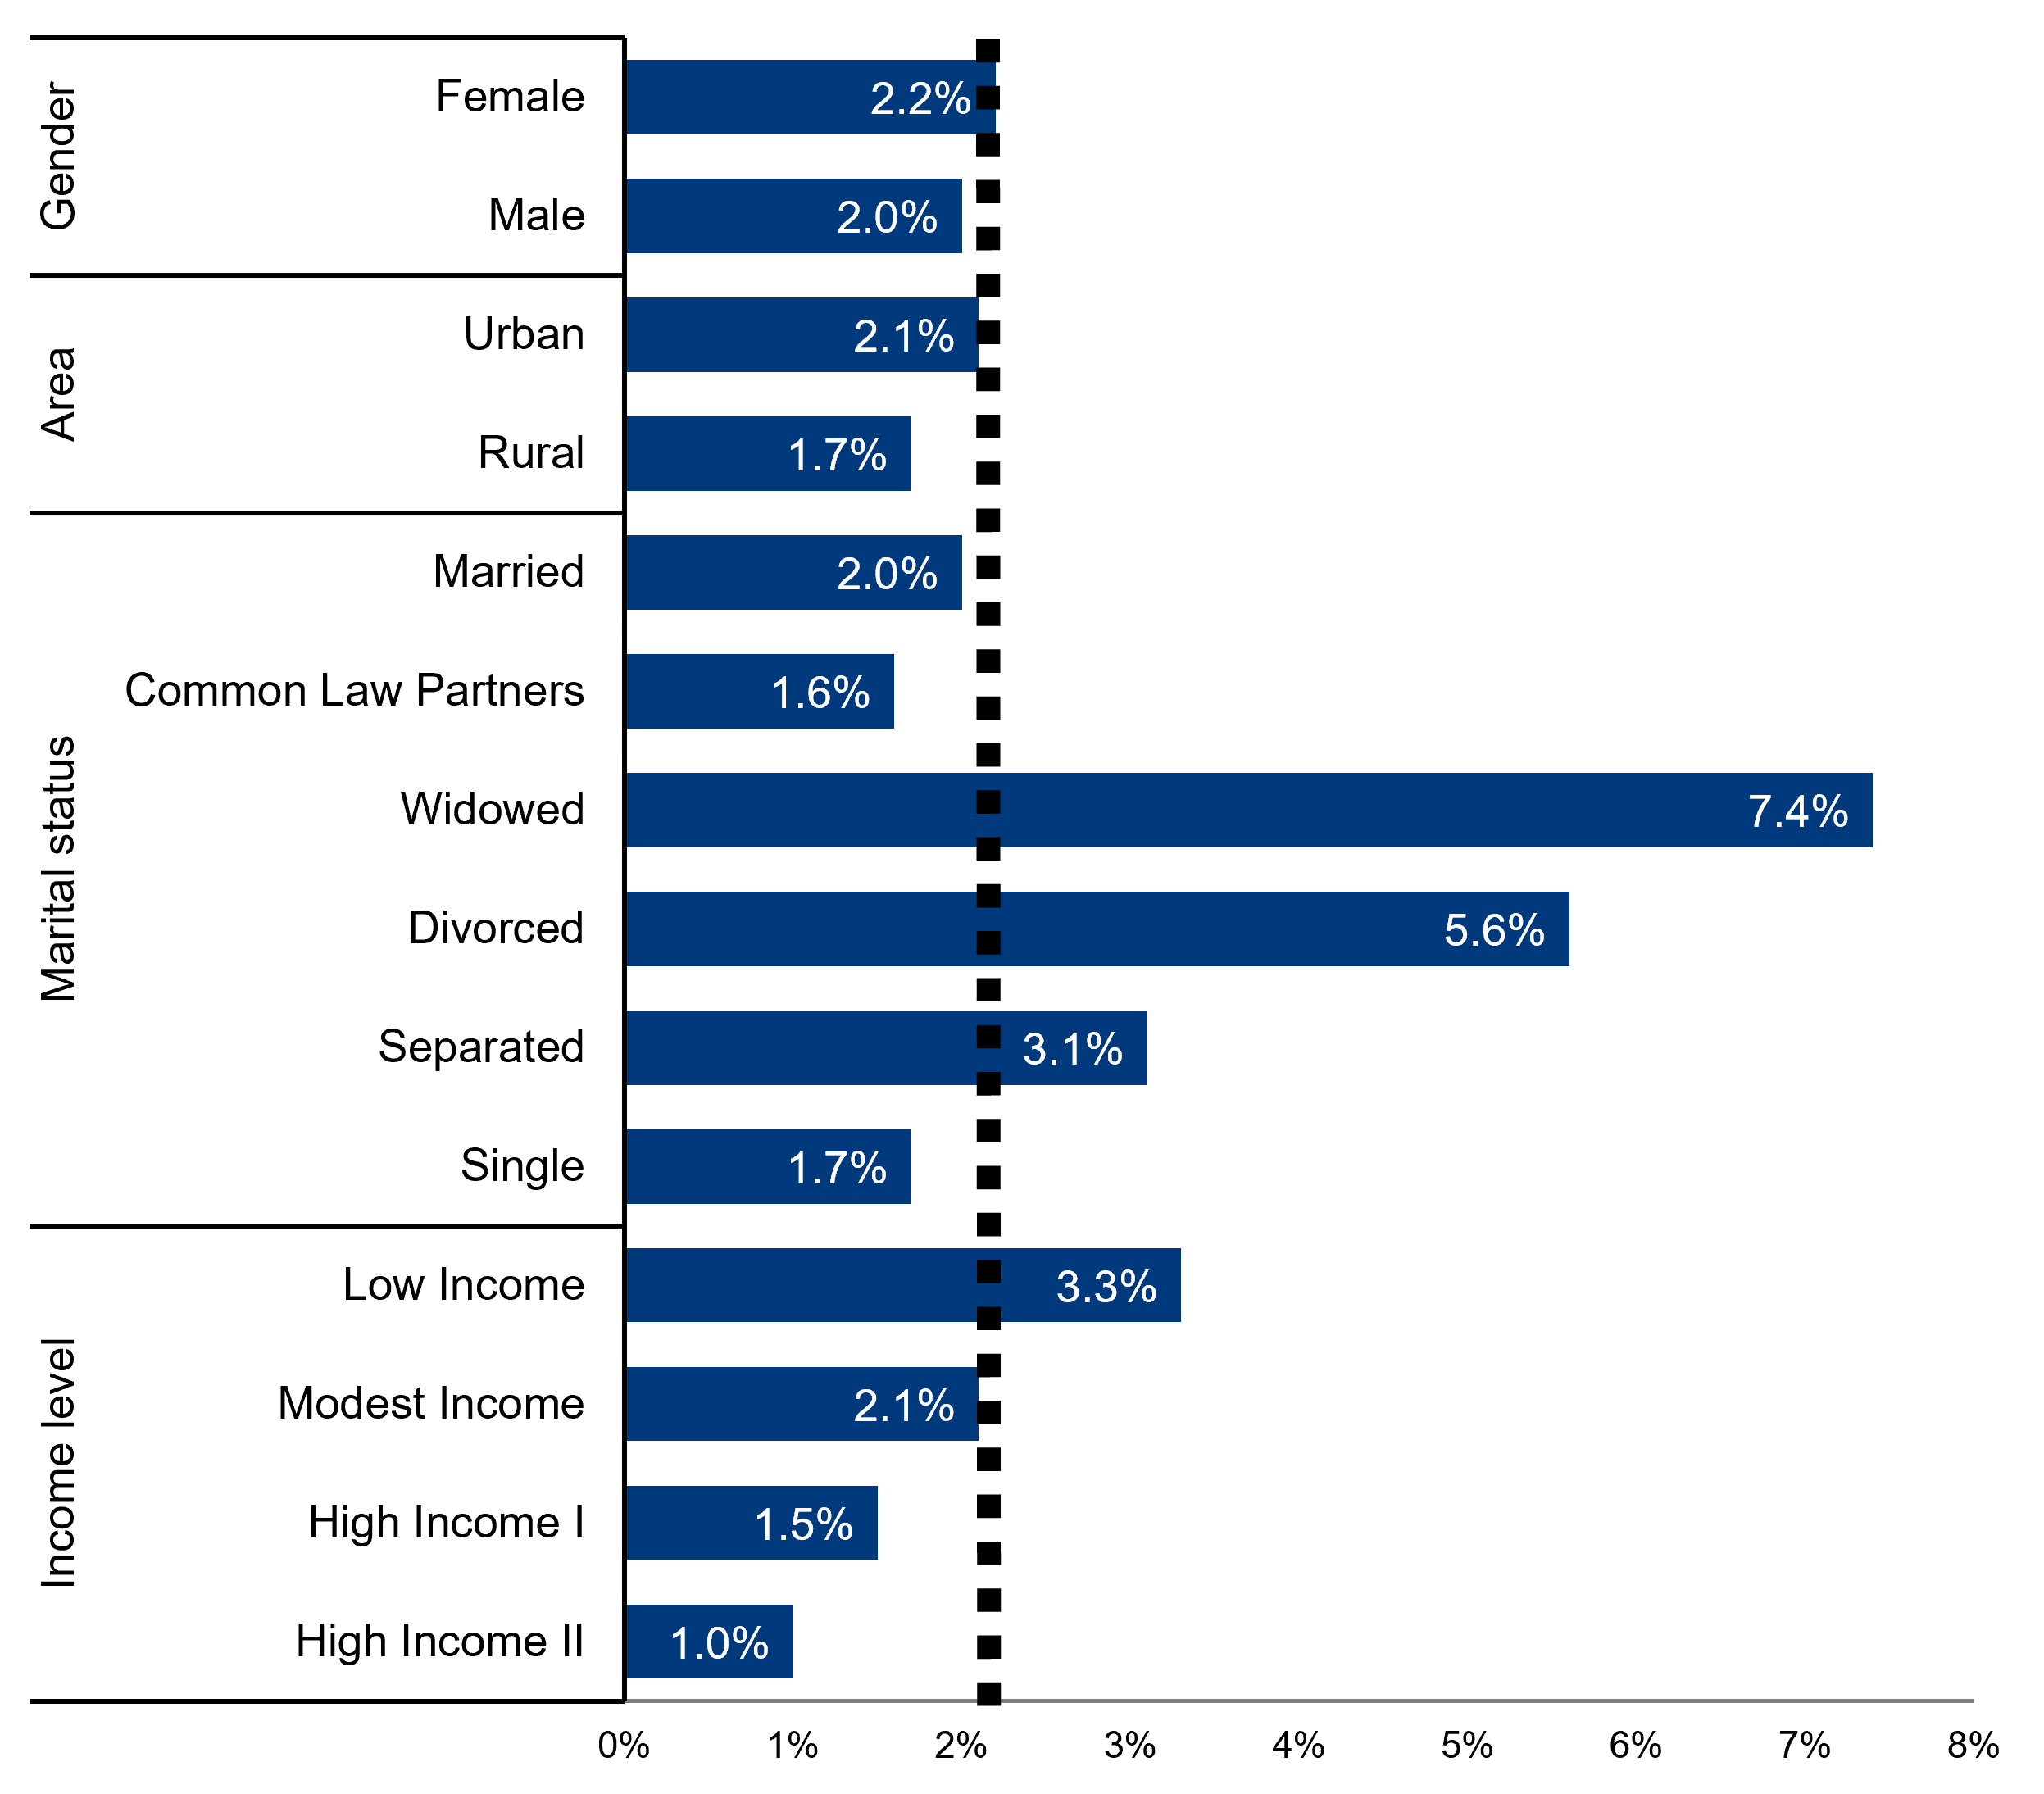
Figure 16: Text description
| Group | Sub-group | Average 2012 to 2021 (%) |
|---|---|---|
| Income level | High Income II | 1.0% |
| Income level | High Income I | 1.5% |
| Income level | Modest Income | 2.1% |
| Income level | Low Income | 3.3% |
| Marital status | Single | 1.7% |
| Marital status | Separated | 3.1% |
| Marital status | Divorced | 5.6% |
| Marital status | Widowed | 7.4% |
| Marital status | Common Law Partners | 1.6% |
| Marital status | Married | 2.0% |
| Area | Rural | 1.7% |
| Area | Urban | 2.1% |
| Gender | Male | 2.0% |
| Gender | Female | 2.2% |
| Gender | Overall | 2.1% |
- Notes:
- Proportion of RDSP beneficiaries represents individual tax filers, which could underestimate those under 18. Therefore, results from this analysis should be interpreted accordingly and discrepancies may arise relative to the results based on the entire population.
- Calculation includes those who are under and above 60.
- Percentages may not sum to 100% due to rounding.
- The vertical dotted line represents the proportion for RDSP beneficiaries overall, which is 2.1%.
Appendix H: Regression discontinuity analysis
The findings of Regression Discontinuity Analysis (RDD) suggest that for people whose net family income is close to the program threshold, being eligible to receive a portion of bonds has a positive impact on opening an RDSP account.
Regression discontinuity analysis for low and modest income, 2020
For example, in 2020, people whose net family income was close to the program threshold to receive a portion of bonds increased their participation by 6.7 percentage points compared to similar non-eligible individuals close to that threshold.
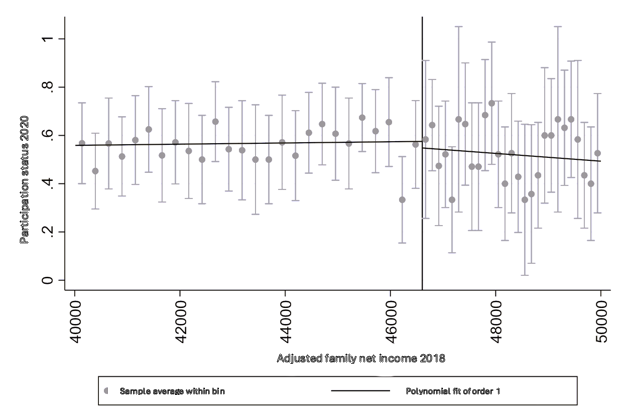
Figure 17: Text description
Figure 17 is a scatter plot showing, for the year 2020, the probability of opening a Registered Disability Savings Plan (RDSP) as a function of adjusted family net income. The horizontal axis represents income, while the vertical axis indicates the probability of opening an RDSP account. A vertical line marks the eligibility threshold for bonds. A visible discontinuity at this threshold shows that individuals on the eligible side are more likely to open an RDSP. This break in trend suggests a causal effect of eligibility on the decision to open an RDSP, interpreted using a regression discontinuity design.
In Figure 17, individuals with adjusted family net income just below the $46,605 threshold - and therefore eligible for a portion of the bonds - were more likely to have opened an RDSP than those with income slightly above the threshold who were not eligible. The estimated impact is 6.7 percentage points (see Table 16). This suggests that the bonds serve as an incentive in RDSP participation decisions.
- Source: Employment and Social Development Canada (2025). Technical Report: Evaluation of the CDSP using linked administrative data
| Coefficient (in pp) | Standard Error | Z score |
|---|---|---|
| 6.7 | 0.04 | 1.68 |
- *** p<0.01, ** p<0.05, * p<0.1 ; pp ≡ percentage point
- Source: Employment and Social Development Canada (2025). Technical Report: Evaluation of the CDSP using linked administrative data
- Note: Calculation only considered RDSP beneficiaries and DTC-approved individuals who filed taxes individually and did not include a large proportion of individuals under 19 years. Therefore, results from this analysis should be interpreted accordingly and discrepancies may arise relative to the results presented in the program’s annual report based on the entire population.
Regression discontinuity analysis for high income, 2020
Similarly, in 2020 people whose net family income was close to the program threshold to receive grants at the highest matching rate experienced an increase of 2.2 percentage points in opening an RDSP account relative to similar individuals close to that threshold who were eligible to receive grants at the lowest matching rate.
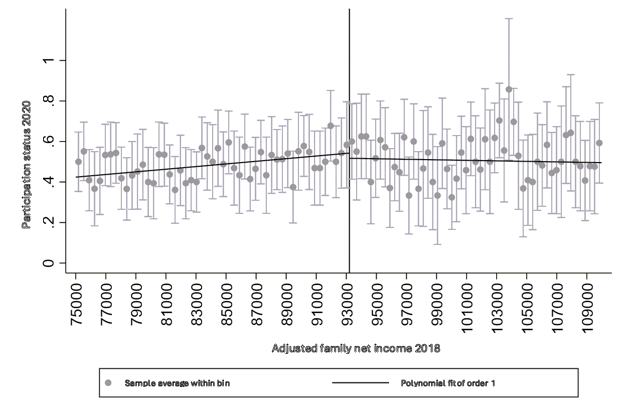
Figure 18: Text description
Figures 18 is a scatter plot showing, for the year 2020, the probability of opening a Registered Disability Savings Plan (RDSP) as a function of adjusted family net income. The horizontal axis represents income, while the vertical axis indicates the probability of opening an RDSP account. A vertical line marks the eligibility threshold for grants. A visible discontinuity at this threshold shows that individuals on the eligible side are more likely to open an RDSP. This break in trend suggests a causal effect of eligibility on the decision to open an RDSP, interpreted using a regression discontinuity design.
Figure 18 shows that individuals with adjusted family net income just below the $93,208 threshold - and eligible for a portion of the grants — were more likely to have opened an RDSP than those with income slightly above the threshold who were not eligible. The estimated impact is 2.2 percentage points (see Table 17). This indicates that the grants also play an incentive role in encouraging participation in the program.
- Source: Employment and Social Development Canada (2025). Technical Report: Evaluation of the CDSP using linked administrative data
| Coefficient (in pp) | Standard Error | Z score |
|---|---|---|
| 2.2 | 0.03 | 0.47 |
- *** p<0.01, ** p<0.05, * p<0.1 ; pp ≡ percentage point
- Note: calculation only considered RDSP beneficiaries and DTC-approved individuals who filed taxes individually and did not include a large proportion of individuals under 19 years. Therefore, results from this analysis should be interpreted accordingly and discrepancies may arise relative to the results presented in the program’s annual report based on the entire population.
- Source: Employment and Social Development Canada (2025). Technical Report: Evaluation of the CDSP using linked administrative data