Canada Education Savings Program part 2: Final evaluation report
On this page
- List of figures
- List of tables
- List of abbreviations and terms
- Executive summary
- Introduction
- Program background
- Key findings
- Conclusion
- Management response and action plan
- References
- Appendices
- Appendix A: Previous key evaluation findings
- Appendix B: Methodology and limitations
- Appendix C: Logic model – Canada Education Savings Program
- Appendix D: Accessing the RESP and CESG
- Appendix E: CESG take-up rate by gender
- Appendix F: Impact on PSE enrolment – regression results
- Appendix G: Factors associated with the likelihood of completing a PSE degree within 5 years
- Appendix H: Parental aspirations for children to reach PSE – regression results
- Appendix I: Certain groups are more likely to face some barriers to accessing PSE
- Appendix J: Other regression findings
Alternate formats

Canada Education Savings Program part 2: Final evaluation report [PDF – 1.3 MB]
Large print, braille, MP3 (audio), e-text and DAISY formats are available on demand by ordering online or calling 1 800 O-Canada (1-800-622-6232). If you use a teletypewriter (TTY), call 1-800-926-9105.
List of figures
- Figure 1: National CESG take-up rate between 2012 and 2021
- Figure 2: CESG take-up rate in 2021, by province and territory
- Figure 3: CESG awareness by family income
- Figure 4: CESG awareness by parental education
- Figure 5: CESG awareness by RESP status
- Figure 6: PSE enrolment rate for CESG beneficiaries and CESG non-beneficiaries
- Figure 7: Predicted gap in post-secondary enrolment rates between RESP holders and non-holders, by income quintile and age
- Figure 8: Differences in probability of PSE enrolment between Additional CESG beneficiaries and non-RESP beneficiaries for years 2011 to 2016 (in percentage points)
- Figure 9: PSE completion rates of CESG beneficiaries and non-beneficiaries enrolled in PSE, 2009-2014
- Figure 10: EAPs and PSE withdrawals in 2021 constant dollars, and number of beneficiaries making RESP withdrawals
- Figure 11: Average RESP withdrawals in 2021 constant dollars
- Figure 12: Highest level of education parents expect their child will attend (proxy of aspirations), by parental education
- Figure 13: Highest level of education parents expect their child will attend (proxy of aspirations), by family income
- Figure 14: Parents’ PSE savings vehicles by parents’ level of education
- Figure 15: Parents’ PSE savings vehicles, by family income
- Figure 16: Reasons given by parents who did not save for children’s PSE
- Figure 17: Differences in frequency of discussions on children’s future education or career options (between parents who have RESPs and those who do not)
- Figure 18: Proportion and number of RESP holders using additional types of savings
- Figure 19: Percentage of PSE students who received a loan or grant from CSFA by CESG status, 2009 to 2015
- Figure 20: Average debt levels of PSE students by CESG status in 2015 constant dollars, 2009 to 2015
- Figure 21: Logic model, Canada Education Savings Program
- Figure 22: CESG take-up rate by gender
List of tables
- Table 1: Additional CESG adjusted family income eligibility thresholds
- Table 2: CLB adjusted income eligibility thresholds by the number of children in a family, from July 1, 2021 to June 30, 2022
- Table 3: Impact on PSE enrolment – regression results, Average Treatment on Treated
- Table 4: Results of Mahalanobis distance estimation – Average Treatment Effects on Treated
- Table 5: Logistic regression estimating the marginal effect of being a CESP beneficiary on PSE completion
- Table 6: Probit regression estimating the marginal effect of parental education on parental aspirations (reference category for parental education: High school or less)
- Table 7: Impact on income – regression results, Average Treatment on Treated
List of abbreviations and terms
- Additional CESG
- Additional Amount of the Canada Education Savings Grant for low- (20%) and middle-income (10%) individuals
- Beneficiary
- A person who received a CESG or CLB payment into a Registered Education Savings Plan
- CESG
- Canada Education Savings Grant
- CESP
- Canada Education Savings Program
- CLB
- Canada Learning Bond
- Contributor
- A person depositing funds into a Registered Education Savings Plan
- CSFA
- Canada Student Financial Assistance
- CSLP
- Canada Student Loans Program
- EAP
- Educational Assistance Payments
- GIC
- Guaranteed Investment Certificate
- LAD
- Longitudinal Administrative Databank
- PCG
- Primary caregiver
- Program
- Canada Education Savings Program
- PSE
- Post-secondary education
- PSIS
- Post-secondary Student Information System
- RESP
- Registered Education Savings Plan
- SAEP
- Survey of Approaches to Educational Planning
- SIN
- Social Insurance Number
- Subscriber
- A person opening an RESP
- T1FF
- T1 Family File
- TFSA
- Tax-Free Savings Account
Executive summary
Key findings
- An increasing number of parents and caregivers are interested in the Canada Eduction Savings Program (CESP) education savings incentives. The Canada Education Savings Grant (CESG) take-up rate increased by 9.5 percentage points between 2012 and 2021, from 45.6% to 55.1%. However, while access to the CESG has improved over time, low-income families are less likely to benefit
- The CESG positively influences enrolment and completion of post-secondary education (PSE). CESG beneficiaries are more likely to access post-secondary education and to graduate from a post-secondary education institutionFootnote 1
- Between 2009 and 2012, the enrolment rate of CESG beneficiaries was about 30 percentage points higher than for non-beneficiaries
- The probability of enrolment in PSE for CESG beneficiaries from low- and middle-income families was higher than for youth in similar families not having benefited from the CESG
- When controlling for some of the factors known to influence post-secondary education outcomes, the probability of completing a post-secondary education degree within 5 years of enrolment was 7.0 percentage points higher for CESG beneficiaries than for non-beneficiaries
- According to the 2020 Survey of Approaches to Educational Planning (SAEP), the likelihood of saving for post-secondary education increases with parental education and family income. Most parents who save for their children’s education have a Registered Education Savings Plan (RESP). Still, some parents also rely on other savings vehicles or approaches
- On average, a lower proportion of students who received the CESG (32.7%) received a loan from the Canada Student Financial Assistance (CSFA) program compared to students who did not receive the CESG (40.8%). Of those who received a CSFA loan, average student loan amounts were 8% lower among CESG beneficiaries relative to non-beneficiaries
- Non-financial barriers prevent people from accessing post-secondary education, including:
- low parental education
- poor academic performance
- living in remote areas, and
- certain cultural influences
Low-income families and other distinct population groups are more likely to face these barriers.
Recommendations
- Explore ways of increasing take-up of education savings incentivesFootnote 2
- Explore outreach opportunities to increase awareness of education savings incentives and the benefits associated with pursuing post-secondary eduction, with a focus on groups facing barriers
Introduction
The evaluation of the CESP responds to a commitment that was made by the Department’s Deputy Minister in the Management Response and Action Plan to the Office of the Auditor General report in January 2020.
The CESP includes these elements:
- CESG (covered by the evaluation)
- Additional Amount of the CESG (Additional CESG) (covered by the evaluation)
- Canada Learning Bond (CLB) (covered by Part 1 of the evaluation)
The Evaluation Directorate conducted an evaluation of the CESP in 2020 to 2021 which focused on the CLB. Consult previous evaluation findings in Appendix A. The impact of the program (including both CESG and CLB) on access to post-secondary education (PSE) has not been previously evaluated.
This evaluation is based on 5 lines of evidence, including:
- a literature review
- administrative data analysis
- analysis of the Survey of Approaches to Educational Planning (SAEP)
- focus groups, and
- key informant interviews (KII)
Consult methodology in Appendix B.
The evaluation takes advantage of the integration of CESP data and the Post-secondary Student Information System (PSIS) data for at least 1 cohort of children who benefited from the CESG for the full availability period of 18 years. It is therefore possible to evaluate the impact of the program on access to PSE and on labour market outcomes such as personal earnings.Footnote 3
Evaluation questions
- How are the CESG and related earnings helping to ease financial barriers to access to PSE?
- Are there other barriers to accessing PSE for CESG beneficiaries?
- Are these barriers different for CESG eligible non-beneficiaries?
- Do these barriers differ across different sub-populations (for example, middle- or low-income families as opposed to high-income families, students with a disability, Indigenous status, women, newcomers)?
- To what extent do CESG beneficiaries use other financial supports such as CSLP to finance their PSE?
- Do students with RESPs have lower levels of student debt upon graduation than those without, all things being equal?
- What is the role of RESPs in addressing unmet financial needs among students receiving assistance from CSLP?
- What is the role of RESPs in meeting the financial needs of students who do not qualify for CSLP because their family’s income is too high?
- What are the impacts of the CESG on access to PSE?
- Does the receipt of CESG benefits increase the likelihood of enrolling in PSE and if so, to what extent?
- Does the receipt of CESG benefits increase the likelihood of graduating from a PSE institution and if so, at what level (for example, college versus university – bachelors, masters or Ph.D.)?
- Does the receipt of CESG benefits improve labour market outcomes (for example, employment status, personal earnings)?
- Are there any differences in perceptions of savings and the usefulness of PSE between parents who opened an RESP vs. those who did not?
Program background
The CESP administers 2 federal education savings incentives:
- the CESG, which includes the Additional CESG
- the CLB
Consult logic model in Appendix C.
Timeline of program development
- 1972: RESP established
- 1998: CESG launched
- 2003: CESP formative evaluation
- 2004: CLB introduced
- 2005: Additional CESG introduced
- 2015: CESP (CESG + CLB) summative evaluation
- 2021: CESP evaluation focused on the CLB
- 2023: CESP (CESG) impact evaluation
Established in 1972, Registered Education Savings Plans (RESPs) allow subscriber contributions to grow tax-free until beneficiaries enter a post-secondary program.
To encourage Canadians to build savings for a child’s PSE using RESPs, the CESG was launched in 1998. It provides a 20% grant on the first $2,500 in annual contributions to a child’s RESP. The basic amount of the grant can reach $500 per year, until the end of the calendar year in which the child turns 17. It can also be obtained retroactively. Consult CESP eligibility criteria in Appendix D.
A formative evaluation of the CESG in 2003 found that low-income families were not making full use of the program. An amendment to the CESG then introduced the Additional CESG in January 2005, to help low- and middle-income families build savings faster. The Additional CESG is a payment of 10% (for middle-income families) or 20% (for low-income families) on the first $500 of contributions made each year, from January 1, 2005 up to the end of the calendar year in which the beneficiary turns 17. The combined value of the basic and additional amounts of the grant can reach a lifetime maximum of $7,200 per beneficiary.
The basic amount of the grant (Basic CESG) is available to families of all income levels. Income thresholds (Table 1) are used to determine eligibility for the Additional CESG.
| Additional CESG | Adjusted income |
|---|---|
| 20% | Up to $49,020 |
| 10% | Greater than $49,020 but not more than $98,044 |
Introduced in the 2004 Budget, the CLB is a government payment to an eligible child’s RESP. It pays $500 for the first year of eligibility and $100 for each subsequent benefit year of eligibility until the beneficiary turns 15, for a maximum of $2,000.
The CLB is available to individuals born on or after January 1, 2004, from low-income families. Benefits are payable under the Children’s Special Allowance Act. Contributions are not required to receive the CLB. The CLB can also be claimed retroactively for previous years during which the child was eligible, until they turn 21, even if no RESP was opened during those years.
Eligibility for the CLB is based, in part, on the number of qualifying children and the adjusted family income (Table 2), as outlined in the Canada Education Savings Act. The primary caregiver or their spouse or common-law partner requests the CLB on behalf of an eligible child. A child is eligible for the CLB if they:
- are from a low-income family
- were born on or after January 1, 2004
- are a resident of Canada
- are named in an RESP
Children in care, for whom a Children’s Special Allowance is payable, are also eligible for the CLB.
| Number of children | Adjusted income |
|---|---|
| 1 to 3 | Less than or equal to $49,020 |
| 4 | Less than $55,311 |
| 5 | Less than $61,626 |
Key findings
CESG take-up rate and awareness
CESG take-up rate increased by 9.5 percentage points at the national level between 2012 and 2021, from 45.6% to 55.1% (Figure 1).
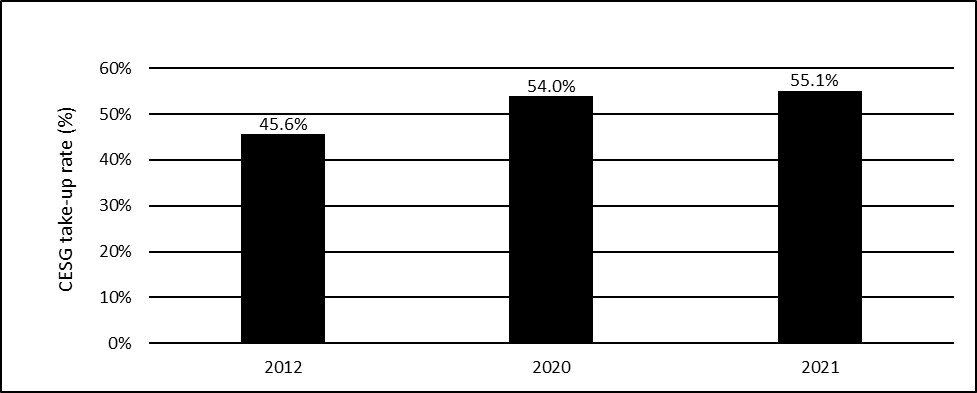
Text version – Figure 1
| Year | CESG take-up rate |
|---|---|
| 2012 | 45.6% |
| 2020 | 54.0% |
| 2021 | 55.1% |
In 2021, CESG take-up varied across regions (Figure 2).
The lowest program take-up rate was in Nunavut (5.6%).
The highest take-up rates were in British Columbia (59.3%) and Quebec (59%). This may be due to the fact that these 2 provinces offer education savings incentives in addition to the CESP.
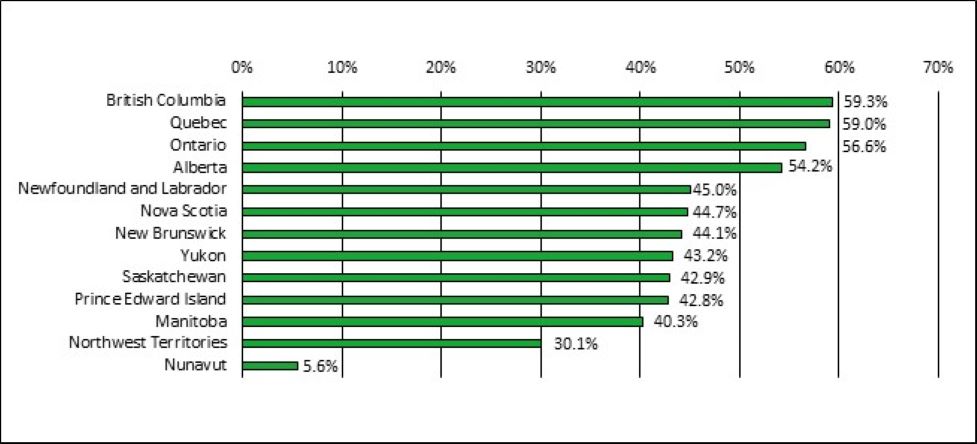
Text version – Figure 2
| Province or Territory | CESG take-up rate |
|---|---|
| Nunavut | 5.6% |
| Northwest Territories | 30.1% |
| Manitoba | 40.3% |
| Prince Edward Island | 42.8% |
| Saskatchewan | 42.9% |
| Yukon | 43.2% |
| New Brunswick | 44.1% |
| Nova Scotia | 44.7% |
| Newfoundland and Labrador | 45.0% |
| Alberta | 54.2% |
| Ontario | 56.6% |
| Quebec | 59.0% |
| British Columbia | 59.3% |
The CESG take-up rate constantly increased over the past decade for both females and males. Consult Appendix E for related results.
Females have a slightly higher CESG take-up rate than males. However, the gap decreased from 0.6 percentage points in 2012 to 0.2 percentage points in 2015.
Since 2015, the CESG take-up difference between females and males has remained relatively constant.
Enrolment in the CESG does not appear to be influenced by gender.
Awareness of the CESG increases with family income, from 53% among families with income less than $20,000, to 76% among families with income of $100,000 or more (Figure 3).
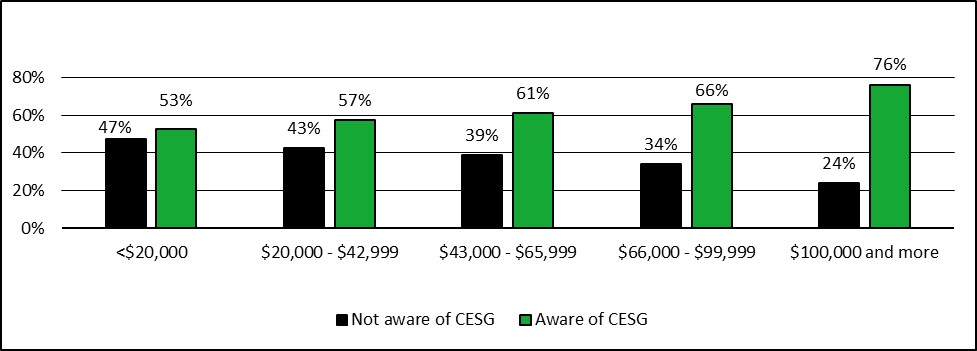
Text version – Figure 3
| CESG awareness | Family income <$20000 | Family income $20000 to $42999 | Family income $43000 to $65999 | Family income $66000 to $99999 | Family income $100000 and more |
|---|---|---|---|---|---|
| Not aware of CESG | 47% | 43% | 39% | 34% | 24% |
| Aware of CESG | 53% | 57% | 61% | 66% | 76% |
Awareness of the CESG also increases with parental education, from 50% among parents with a high school education or lower, to 76% among parents with a university education (Figure 4).
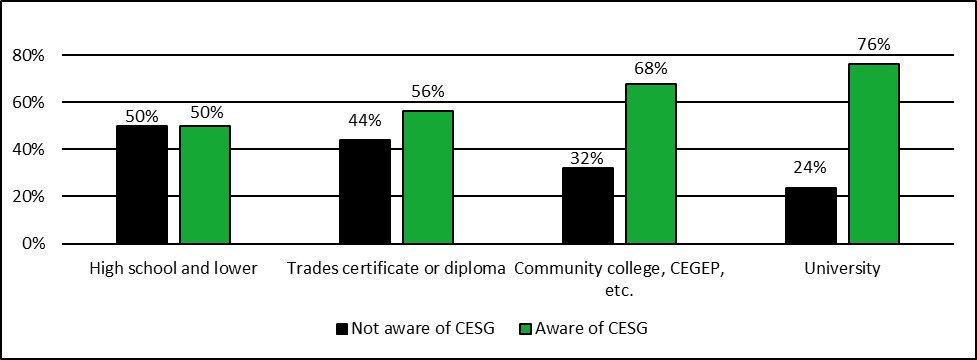
Text version – Figure 4
| CESG awareness | High school and lower | Trades certificate or diploma | Community college, CEGEP, et cetera | University |
|---|---|---|---|---|
| Not aware of CESG | 50% | 44% | 32% | 24% |
| Aware of CESG | 50% | 56% | 68% | 76% |
According to Figure 5, 19% of parents with an RESP for their children were not aware of the CESG.
About 49% of parents without RESPs were not aware of the CESG.
In light of these findings, the program could strengthen its promotional activities to enhance awareness and improve the take-up rate.

Text version – Figure 5
| CESG awareness | Without RESP | With RESP |
|---|---|---|
| Not aware of CESG | 49% | 19% |
| Aware of CESG | 51% | 81% |
Impact on enrolment, graduation, and labour market outcomes
CESG beneficiaries had a higher likelihood of enrolling in PSE by age 26 compared to non-beneficiaries
Slightly more than 60% of 18-year-olds who had received the CESG had enrolled in PSE by age 26 compared to 33% of 18-year-olds who had not received the CESG (Figure 6).
Similar results were observed between those who only received the Basic CESG and those who received the Basic and the Additional amount of CESG.
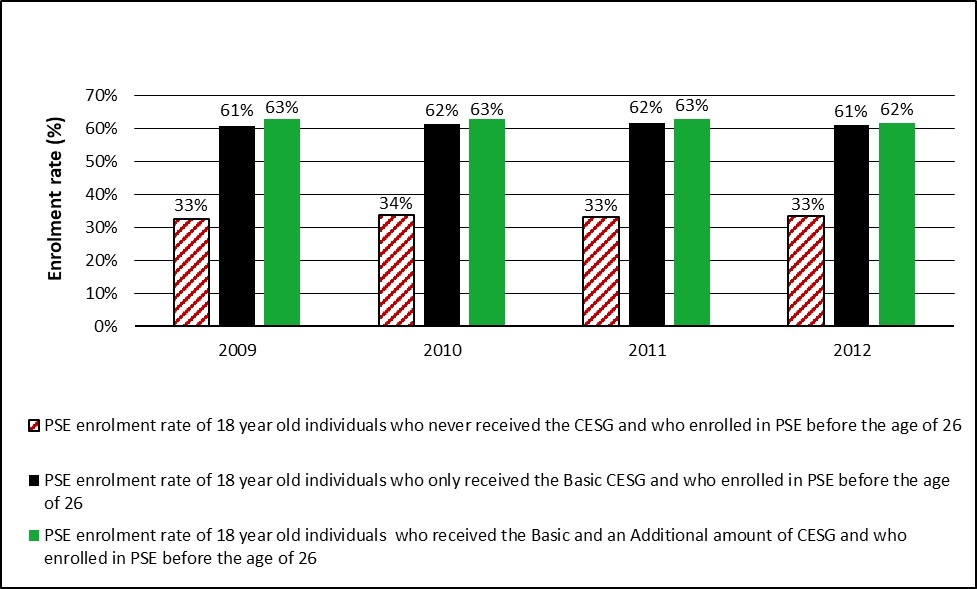
Text version – Figure 6
| PSE enrolment rate by CESG status | 2009 | 2010 | 2011 | 2012 |
|---|---|---|---|---|
| PSE enrolment rate of 18-year-old individuals who never received the CESG and who enrolled in PSE before the age of 26 | 33% | 34% | 33% | 33% |
| PSE enrolment rate of 18-year-old individuals who only received the Basic CESG and who enrolled in PSE before the age of 26 | 61% | 62% | 62% | 61% |
| PSE enrolment rate of 18-year-old individuals who received the Basic and an Additional amount of CESG and who enrolled in PSE before the age of 26 | 63% | 63% | 63% | 62% |
Differences in PSE enrolment rates between beneficiaries and non-beneficiaries cannot be entirely attributed to receipt of the CESG.
Socio-economic and demographic characteristics of both parents and children must be carefully considered to isolate the CESG’s impact.
Youth who have an RESP are more likely to pursue PSE
According to Frenette (2017), 75.4% of youth residing in a family with an RESP enrolled in a post-secondary institution by age 19. Comparatively, 59.7% of youth residing in a family without an RESP enrolled in a post-secondary institution by age 19.Footnote 12
Several factors are associated with PSE attendance (Frenette, 2007). These include standardized test scores at age 15, parental income, parental education, parental expectations, access to RESPs, as well as other student supports such as scholarships or loans.
Further data on youth and families is needed to clarify the complex relationship between having an RESP and PSE enrolment.
Frenette (2017) examined this relationship using linear probability models and accounting for differences in youth academic achievement, parental education, and other relevant factors. Frenette found that the predicted gap in post-secondary enrolment rates at age 19 between those with and without RESPs is 5.9 percentage points.
- The predicted gap decreases as youth get older, dropping to 2.7 percentage points by age 27 (Figure 7)
- The predicted gaps are also twice as strong among young men compared to young women
- The predicted gap between young men with and without RESPs was 7.8 percentage points by age 19 and 3.7 percentage points by age 27. The same predicted gaps between young women with and without RESPs were 4.3 and 1.6 percentage points, respectively
Data from the 2020 SAEP shows that having an RESP can be partly related to parent and youth characteristics, such as parental level of education or family income, which are positively associated with post-secondary attendance. Consult findings in “Parental influence and savings behaviour.”
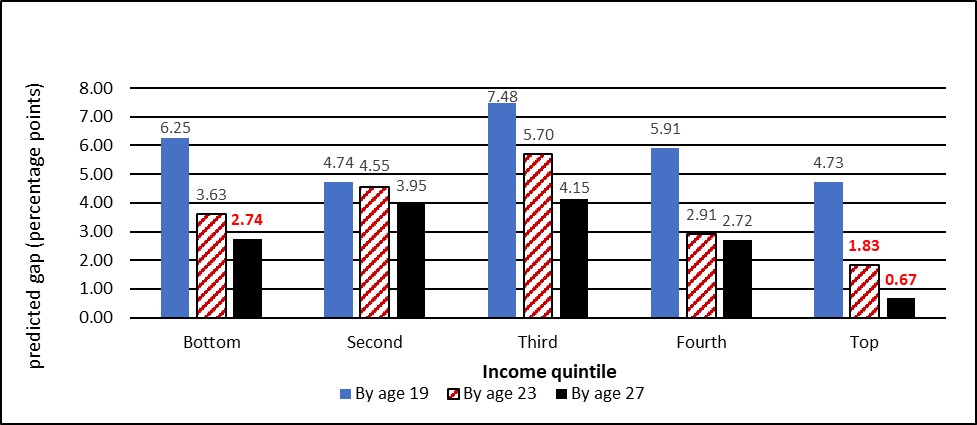
Text version – Figure 7
| Income quintile | Predicted gap by age 19 | Predicted gap by age 23 | Predicted gap by age 27 |
|---|---|---|---|
| Bottom | 6.25 | 3.63 | 2.74 |
| Second | 4.74 | 4.55 | 3.95 |
| Third | 7.48 | 5.7 | 4.15 |
| Fourth | 5.91 | 2.91 | 2.72 |
| Top | 4.73 | 1.83 | 0.67 |
Exploratory analysis between the Additional CESG and PSE
Building on Frenette (2017), the evaluation used an exploratory approach to compare the PSE enrolment outcomes of youth who benefited from only the Additional CESG (treatment group) to a group of youth without RESPs (comparison group). This analysis excluded those who received only the Basic CESG to focus on beneficiaries belonging to low- and middle-income families.
The analysis was based on the CESG administrative data linked with Longitudinal Administrative Databank (LAD) and family tax data from the Canada Revenue Agency.
Using 4 different matching methods, the analysis compared treatment and control groups of youth with similar observable characteristics. These included sex, age, Indigenous status, location, family type, and family income.
This analysis showed that on average, between 2011 and 2016, the probability of enrolment in PSE for beneficiaries of the Additional CESG was higher than for youth without an RESP. Consult Figure 8.
However, the difference in probability of enrolment in PSE cannot be attributed to receipt of the Additional CESG alone. Differences may be attributed to other factors not used in this evaluation, such as differences in youth academic achievement and parents’ level of education. Consult Appendix B for more details on the methodology and Appendix F for detailed results.
It is therefore suggested to explore these questions in greater depth through further research.
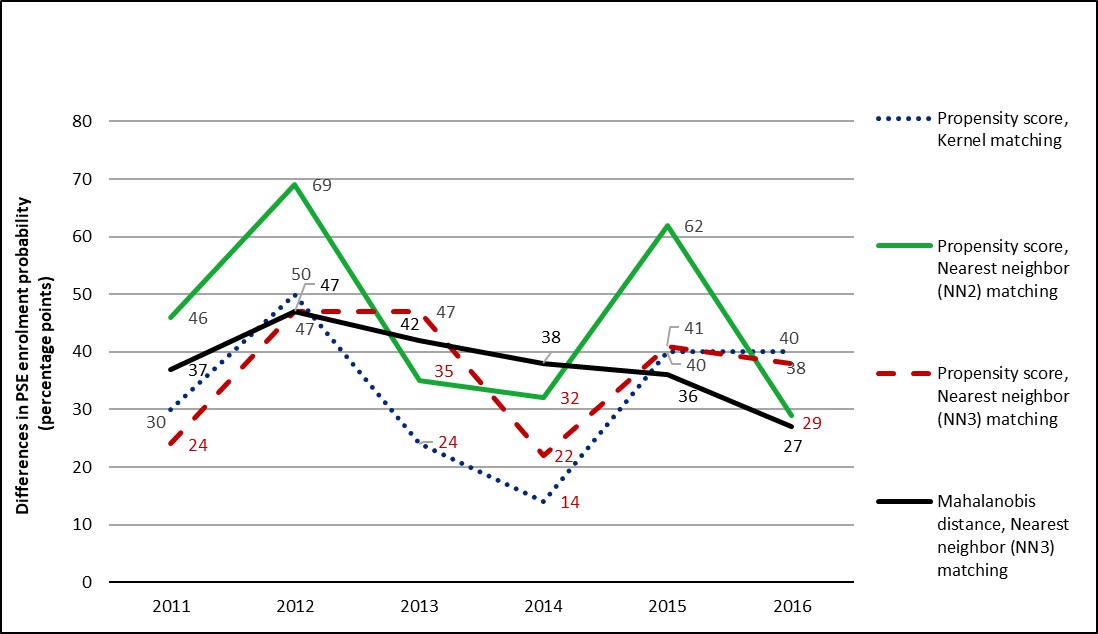
Text version – Figure 8
| Year | 2011 | 2012 | 2013 | 2014 | 2015 | 2016 |
|---|---|---|---|---|---|---|
| Propensity score, Kernel matching | 30 | 50 | 24 | 14 | 40 | 40 |
| Propensity score, Nearest neighbor (NN2) matching | 46 | 69 | 35 | 32 | 62 | 29 |
| Propensity score, Nearest neighbor (NN3) matching | 24 | 47 | 47 | 22 | 41 | 38 |
| Mahalanobis distance, Nearest neighbor (NN3) matching | 37 | 47 | 42 | 38 | 36 | 27 |
CESP incentives help children access PSE even though amounts are modest
Parents in the Nova Scotia focus group agreed that the savings incentives made PSE more feasible.Footnote 15
Participants in focus groups for parents and for youth observed that CESP savings and incentives afford more freedom to choose programs or schools, including ones away from home. One Vancouver parent explained that without these government contributions, their children might be less likely to attend PSE.Footnote 16
Some key informants asserted that it is not necessarily the monetary value of the incentives that explains the difference in PSE enrolment between beneficiaries and non-beneficiaries:
- half of the key informants commenting on this specific question (7 of 14) indicated that positive attitudinal factors such as motivation or expectation to pursue PSE may be more important than the amount of incentivesFootnote 17
- a majority of informants (16 of 28) indicated in responses to various questions that the availability of education savings, even in relatively small amounts, encourages children to see PSE as a likely part of their futureFootnote 18
In addition to encouraging parents to save early for their children’s PSE, the CESG thus helps children develop aspirations, attitudes, and behaviors favourable to PSE.
The CESG increases persistence and the likelihood of graduating from a PSE institution
By encouraging education savings, the CESG helps put funds dedicated to PSE at students’ disposal, thus contributing to retention and higher completion rates.
Three key informants, replying to different questions, stated that education savings have an impact on behavior by facilitating persistence in PSE.Footnote 19
- As 1 of these informants noted, savings can be an influential factor especially among students from lower-income families who are averse to taking on debt
- One informant reported, based on their knowledge of National Graduates Survey data, that students with RESPs had a higher graduation rate
The PSE completion rates of CESG beneficiaries were about 10 percentage points higher than those of non-beneficiaries between 2009 and 2014 (Figure 9).
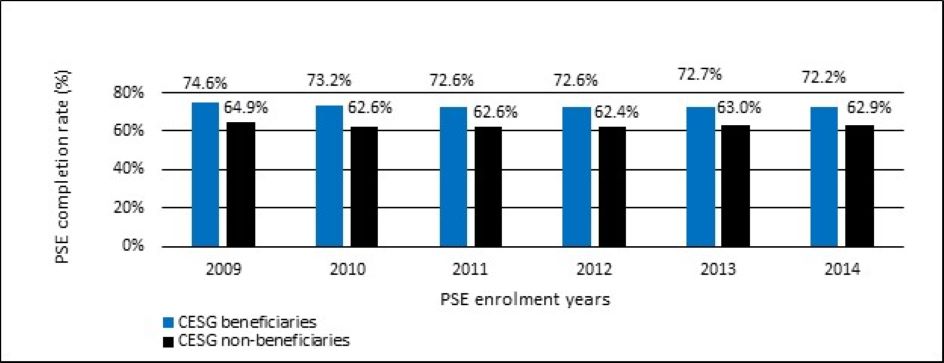
Text version – Figure 9
| Year | 2009 | 2010 | 2011 | 2012 | 2013 | 2014 |
|---|---|---|---|---|---|---|
| Completion rate of CESG beneficiaries | 74.6% | 73.2% | 72.6% | 72.6% | 72.7% | 72.2% |
| Completion rate of CESG non-beneficiaries | 64.9% | 62.6% | 62.6% | 62.4% | 63.0% | 62.9% |
Other factors such as gender or parental income could explain why a higher percentage of students receiving the CESG complete their PSE degree within 5 years compared to students not receiving the CESG. To isolate the specific impact of CESG receipt on the chances of graduating from PSE, the CESP conducted logistic regressions and found that the likelihood of graduating is higher for CESG beneficiaries. Consult Appendix G for related results.
For students who enrolled in PSE between 2009 and 2014, the probability of graduating within 5 years was 7.0 percentage points higher for CESG beneficiaries than for non-beneficiaries. The probability was:
- 5.8 percentage points higher for programs below a bachelor’s degree
- 5.1 points higher for bachelor’s degrees
- 0.5 points higher for graduate degrees
Impact on labour market outcomes
Preliminary analysis did not show a significant link between receipt of CESG incentives and labour market outcomes such as income. This analysis should be considered preliminary due to lack of sufficient data. Consult Appendix J for details.
Contribution to PSE
RESP withdrawals help to reduce financial barriers to accessing PSE
The funds withdrawn from RESPs include Educational Assistance Payments (EAPs) and PSE withdrawals.
EAPs consist of CESG and CLB amounts, as well as amounts paid under a provincial education savings program and income earned through assets in the RESP. This income is taxable income for the beneficiary.
PSE withdrawals consist of the contributions that have been made to the RESP by subscribers.
EAPs, PSE withdrawals, and the number of beneficiaries with RESP withdrawals increased between 2012 and 2021 (Figure 10).Footnote 21
These increases suggest that the program’s contribution towards PSE has increased.
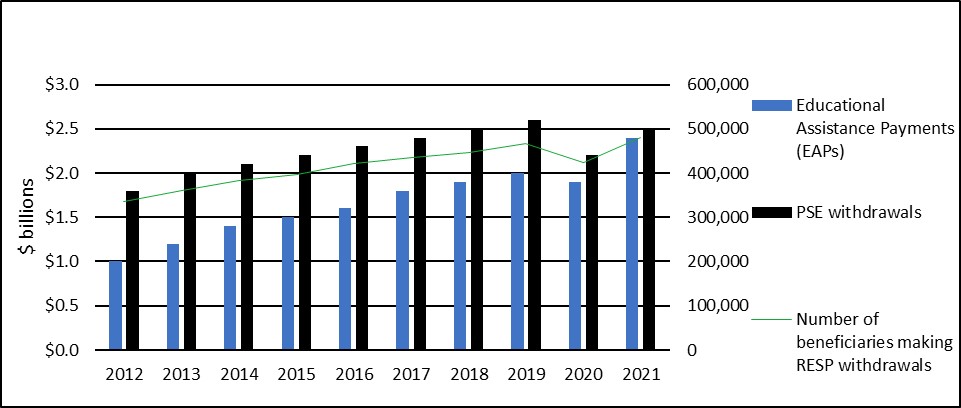
Text version – Figure 10
| Year | 2012 | 2013 | 2014 | 2015 | 2016 | 2017 | 2018 | 2019 | 2020 | 2021 |
|---|---|---|---|---|---|---|---|---|---|---|
| Educational Assistance Payments (EAPs) in billions of dollars | $1.00 | $1.20 | $1.40 | $1.50 | $1.60 | $1.80 | $1.90 | $2.00 | $1.90 | $2.40 |
| PSE withdrawals in billions of dollars | $1.8 | $2.00 | $2.10 | $2.20 | $2.30 | $2.40 | $2.50 | $2.60 | $2.20 | $2.50 |
| Number of beneficiaries making RESP withdrawals | 336057 | 361206 | 382557 | 397556 | 422562 | 434013 | 446483 | 466254 | 422847 | 481225 |
All key informants commenting on the issue (22 of 22) agreed that people who receive CESP incentives find it easier to offset the costs of PSE than those who do not.Footnote 23
The majority of informants (14 of 22) expressed the idea that even if the CESP does not pay for everything, it still makes a difference.Footnote 24
The vast majority of informants (20 of 22) indicated that students combine CSFA or other government student financial assistance with RESP withdrawals to pay for PSE.Footnote 25
From 2012 to 2021, the number of beneficiaries making an RESP withdrawal increased. The average RESP withdrawal also increased, from $8,442 to $10,115. Average RESP withdrawals include both EAPs and PSE withdrawals. Consult Figure 11.
The increasing level of average annual RESP withdrawals per CESP beneficiary attests to the role RESPs play in meeting students’ financial needs.
For example, Canadian students (citizens and permanent residents) who were enrolled full-time in PSE in the academic year 2021 to 2022 paid $6,660 on average in tuition fees for undergraduate programs, and $7,315 for graduate programs.
Average RESP withdrawals exceeded these tuition fees, thus decreasing financial barriers to PSE.
The degree to which RESP withdrawals support youth throughout their post-secondary studies warrants further examination.

Text version – Figure 11
| Year | 2012 | 2013 | 2014 | 2015 | 2016 | 2017 | 2018 | 2019 | 2020 | 2021 |
|---|---|---|---|---|---|---|---|---|---|---|
| Average RESP withdrawals | $7 255 | $7 670 | $8 045 | $8 297 | $8 512 | $8 832 | $9 169 | $9 453 | $9 402 | $10 115 |
Parental influence and savings behaviour
Parents who have PSE expect their children to pursue it
A high proportion of parents expect their children to attend PSE, regardless of their own level of education (Figure 12).
On average, 93% of parents with PSE aspire for their children to achieve PSE compared to 83% of parents whose level of education is high school or lower.
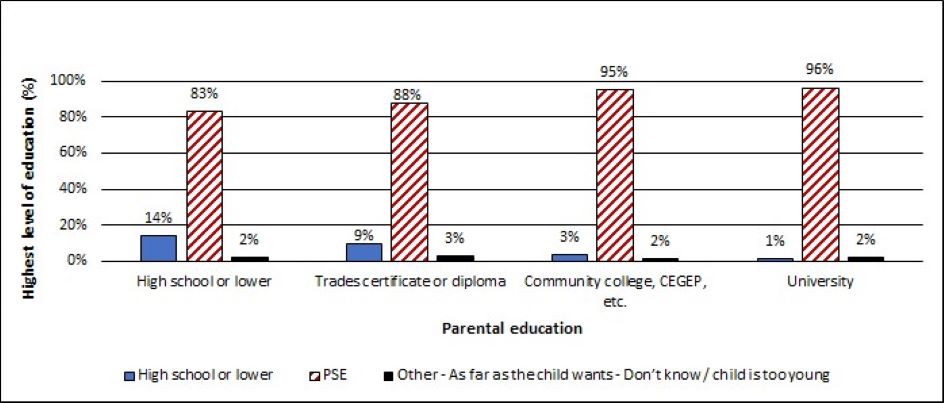
Text version – Figure 12
| Parental education | High school or lower | Trades certificate or diploma | Community college, CEGEP, etc. | University |
|---|---|---|---|---|
| High school or lower | 14% | 9% | 3% | 1% |
| PSE | 83% | 88% | 95% | 96% |
| Other – As far as the child wants – Don’t know / child is too young | 2% | 3% | 2% | 2% |
Some key informants (9 of 23) commented on the importance of having parents who attended PSE as role models to encourage children’s belief that they belong in PSE.Footnote 28
Some informants (8 of 17) indicated that demonstrating expectation through an RESP is an important way that parents and caregivers can reinforce a child’s intention to go to college or university. Key informants referred to this as a college-bound identity.Footnote 29
Probit regression
According to the results of the probit regression (based on SAEP data), the fact that a parent has a university education increases the probability of expecting their children to go to university by more than 9 percentage points. Consult Appendix H for related results.
The level of education parents expect their child to attain increases with family income
The proportion (96%) of parents with family income of $100,000 or more who expect their children to attend PSE is higher than parents with lower family incomes (Figure 13).
About 2% of parents with a family income of $100,000 or more expect their children’s highest level of education to be high school or lower. This percentage increases for lower income levels.
High income families are more likely to expect their children to pursue PSE, and are more likely to have RESPs or savings for PSE.
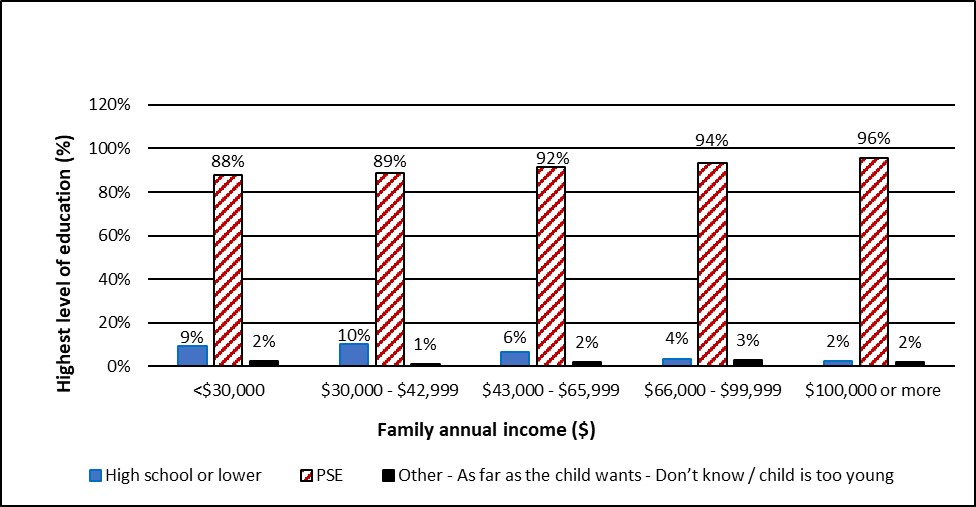
Text version – Figure 13
| Highest level of education | Family income <$30000 | Family income $30000 to 42999 | Family income $43000 to 65999 | Family income $66000 to 99999 | Family income $100000 or more |
|---|---|---|---|---|---|
| High school or lower | 9% | 10% | 6% | 4% | 2% |
| PSE | 88% | 89% | 92% | 94% | 96% |
| Other – As far as the child wants – Don’t know / child is too young | 2% | 1% | 2% | 3% | 2% |
The proportion of parents with savings for children’s PSE (including RESPs) increases with the parental level of education
According to SAEP:
- 50% of parents with high school education or lower
- 49% of parents with a trade certificate or diploma, and
- 20% of parents with university degrees
- had no savings for their children’s PSE (consult Figure 14)
Among parents with university degrees, 33% combined RESPs with other means of savings. Only 16% of parents with a high school education or lower and 17% of parents with a trade certificate or diploma did so.
Among parents with high school education or lower, 34% used RESPs either alone (18%) or in combination with other savings vehicles (16%).
Parents with PSE more often used RESPs either alone or in combination with other savings vehicles.
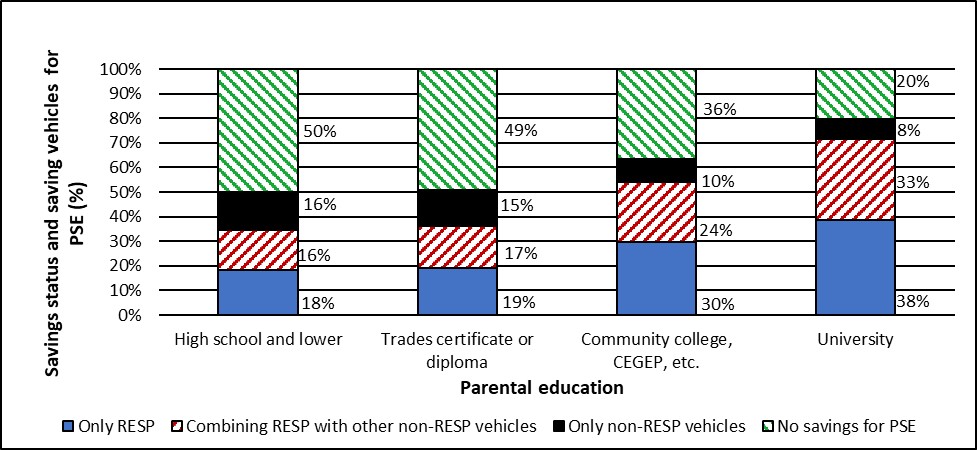
Text version – Figure 14
| Highest level of education | Only RESP | Combining RESPs with other non-RESP vehicles | only other non-RESP vehicles | No savings for PSE |
|---|---|---|---|---|
| High school and less | 18% | 16% | 16% | 50% |
| Trades certificate or diploma | 19% | 17% | 15% | 49% |
| Community college, CEGEP, etc. | 30% | 24% | 10% | 36% |
| University | 38% | 33% | 8% | 20% |
Family income is an important determinant of saving for PSE
Of families whose income was less than $20,000, 60% had no savings for PSE. Only 19% of families whose income was $100,000 or more had no savings for PSE (Figure 15).
Low-income families who were saving for their children’s PSE were less likely to use RESPs compared with high-income families.
The percentage of parents with an RESP increased from 29% among families with incomes below $20,000 to 72% among families with incomes of $100,000 or more.
High-income families ($100,000 or more) were more likely to combine RESPs with other means of saving (35%) than families with incomes below $20,000 (12%).
Irrespective of income, about 11% of families were saving for their children’s PSE through non-RESP vehicles only.
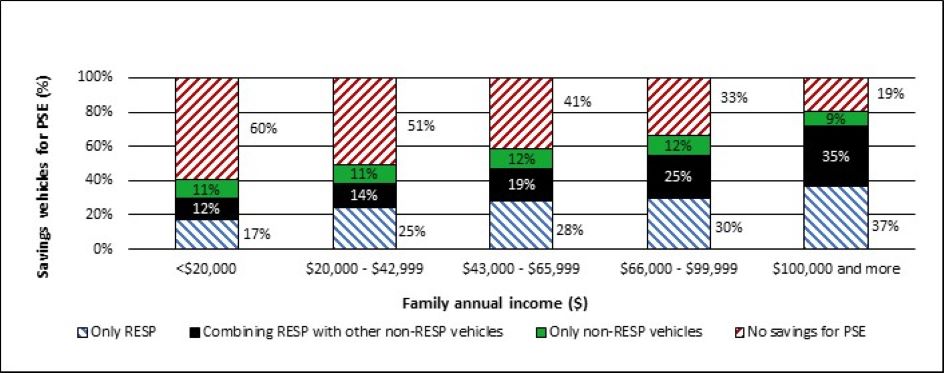
Text version – Figure 15
| Savings vehicles for PSE | Family income <$20000 | Family income $20000 to $42999 | Family income $43000 to $65999 | Family income $66000 to $99999 | Family income $100000 and more |
|---|---|---|---|---|---|
| Only RESP | 17% | 25% | 28% | 30% | 37% |
| Combining RESP with other non-RESP vehicles | 12% | 14% | 19% | 25% | 35% |
| Only non-RESP vehicles | 11% | 11% | 12% | 12% | 9% |
| No savings for PSE | 60% | 51% | 41% | 33% | 19% |
According to key informant interviews, many eligible families do not open an RESP and receive the CLB, for a variety of reasonsFootnote 33:
- most informants (18 of 23) stated that a lack of money to save is a primary reason why people do not open RESPs
- a majority (17 of 23) also cited a lack of awareness of, or misinformation about, RESPs
- some informants (7 of 23) noted that low-income families sometimes lack the documents (ID, birth certificates, SIN) required to open an RESP
CESP incentives are an important motivator of saving for PSE
Some key informants (6 of 16 commenting) said that parents open RESPs because of the CESP incentives.Footnote 34
Parents in the Vancouver and Quebec focus groups said that the incentives encouraged them to save. One parent in Vancouver said that the grants and interest to be earned motivated them to start their RESP and contribute what they could, even with modest incomes.Footnote 35
Parents in the Nova Scotia focus group agreed that the grant and the bond (for those eligible) were important motivators in encouraging them to start saving:
- “I do not know if or when I would have even started saving for their education if it were not for the grant”
- “[the grant] is also the number 1 reason why I actually started saving”
- “[the grant] was the reason that we started [an RESP] with 5 kids. I knew we could not save very much… and this gave a great big boost to get us started”Footnote 36
CESP incentives are an important motivator, but some parents face challenges when opening an RESP or withdrawing money
Parents in the Toronto focus group expressed difficulty understanding the basics of how RESPs work. They were uncertain:
- whether RESPs can be used to fund college, trade school, or an apprenticeship
- whether RESPs only cover tuition, and what happens if students get a full-tuition scholarship
- what happens to their money if their child does not go to PSE
- about the relationship between an RESP and a Registered Disability Savings PlanFootnote 37
One of 2 parents in an Edmonton focus group had difficulty opening and contributing to an RESP. The parent stated that the process was “overwhelming” and should be simpler.Footnote 38
Four of 10 parents in a Toronto focus group had difficulty withdrawing money from RESPs. One parent, when their child’s apprenticeship program was not recognized, stopped contributing to another child’s RESP as a result of the inconvenience.Footnote 39
Most parents care about their children’s PSE but many, for various reasons, have not saved for it
Almost all parents (99.8%) care about PSE but many, for various reasons, have not saved for it (Figure 16).
Among reasons given by parents for not saving for their children’s PSE, lack of money (29%) is the most frequent.
At least 1 parent in 10 did not plan to finance their children’s studies by saving. They would rather pay for PSE when the time comes.
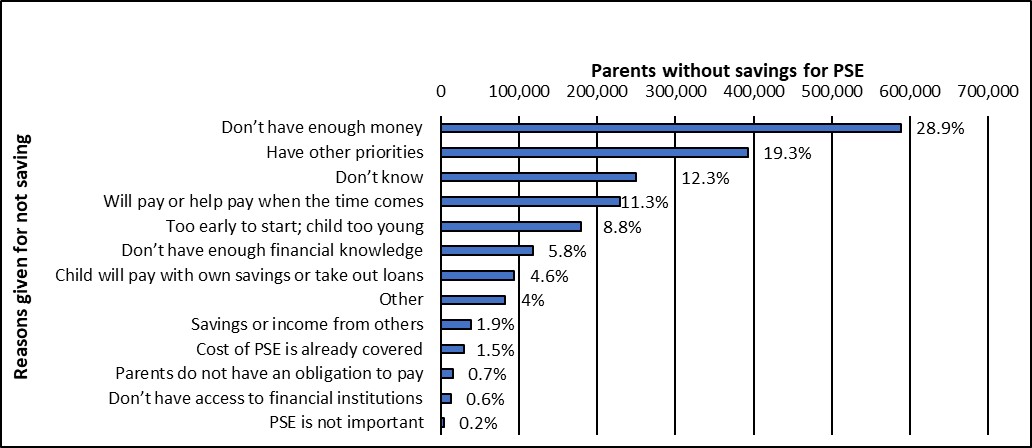
Text version – Figure 16
| Reasons given for not saving | Number of parents |
|---|---|
| Don’t have enough money | 587988 |
| Have other priorities | 392732 |
| Don’t know | 249632 |
| Will pay or help pay when the time comes | 228731 |
| Too early to start; child too young | 179473 |
| Don’t have enough financial knowledge | 117805 |
| Child will pay with own savings or take out loans | 93765 |
| Other | 81461 |
| Savings or income from others | 38791 |
| Cost of PSE is already covered | 30039 |
| Parents do not have an obligation to pay | 15066 |
| Don’t have access to financial institutions | 12810 |
| PSE is not important | 3462 |
A majority of key informants (18 of 23) cited a lack of extra money to save as the main reason for not opening an RESP.Footnote 41
Both parents in an Edmonton focus group struggled to make ends meet and had difficulty finding the money to save.Footnote 42
Several focus group participants stressed the value of PSE for their children.
Most parents spoke about the importance of saving for their children’s PSE, but some also mentioned wanting their children to take responsibility and learn to be independent.Footnote 43
Parents’ perceptions are mixed as to the impact of education savings incentives on attitudes, aspirations, or behaviors regarding PSE
A majority of key informants commenting on the issue (15 of 17, from 3 of the 4 informant groups) stated that the availability of education savings has a positive impact on attitudes, aspirations, or behaviours regarding PSE.Footnote 44
Nine of these informants indicated that the CESP either makes PSE seem more attainable or encourages aspirations to pursue it.Footnote 45
Some informants (4 of 16) noted that parents open RESPs because they value education, are aware of the costs, and want to support their children.Footnote 46
A few informants (3 of 16) spoke of a positive emotional or psychological impact on parents when they feel they have helped their children prepare for their future education.Footnote 47
However, parents in some focus groups indicated that the savings incentives did not change their children’s overall post-secondary direction. They stated that the support is welcome but their children would have gone on to PSE regardless.Footnote 48
Some youth focus group participants indicated that the CESP would only have a marginal impact on access to PSE and on their family’s behaviour. Others indicated that it did make an impact by:
- giving students more options on the institution to attend, including schools in different cities
- allowing students to attend school and explore options without fully knowing the path they want to take
- covering the financial costs for the first years, until they are able to leverage their schooling to gain employment (such as entry into a co-op program)
According to 1 parent, the savings incentives appear to be more influential for low-income families. The same parent explained that the savings incentives make PSE more affordable for their family.
Both parents attending an Edmonton focus group stated that the CESP was not enough to help low-income families because the CLB is too little and the CESG requires contributions.
Having an RESP does not contribute to differences in frequency of discussions between children and parents on future education or career options
Frequency of discussions on future education or career options between children and parents is almost the same for parents with or without an RESP (Figure 17).
About 38% of parents with an RESP have had discussions with their children once or twice since birth, compared to 35% of those without an RESP.
More parents without an RESP (62%) have had discussions at least once a month compared to parents with an RESP (59%).
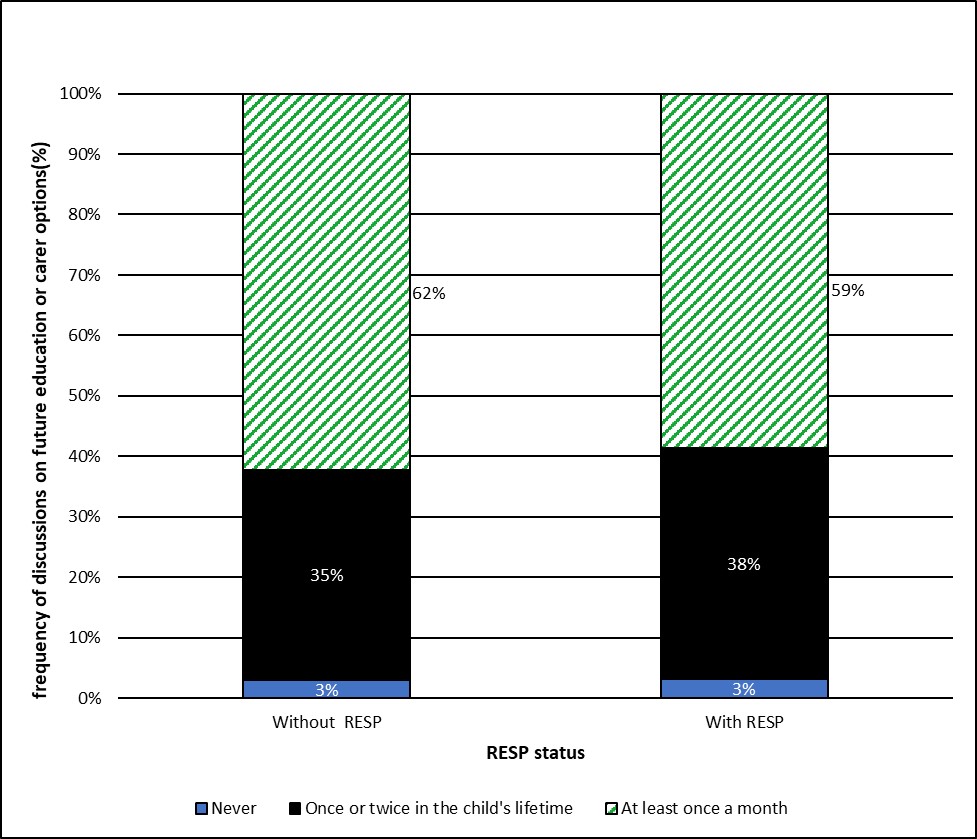
Text version – Figure 17
| Frequency of discussion | Without RESP | With RESP |
|---|---|---|
| Never | 3% | 3% |
| Once or twice in the child’s lifetime | 35% | 38% |
| At least once a month | 62% | 59% |
Other financial supports
Parents with RESPs also use additional means to finance their children’s PSE
According to SAEP, bank accounts or in-trust accounts opened in a child’s name (28%) are the most popular additional savings vehicles used by RESP holders (Figure 18).
About 15% of parents who are RESP holders use Tax-Free Savings Accounts (TFSA) to save for their children’s PSE.
Very few parents (2%) used real estate as a means to help finance their child’s PSE.
Other analyses from SAEP demonstrated that British Columbia (31%) and Ontario (30%) regions have the highest percentage of parents combining RESPs with other means of savings.
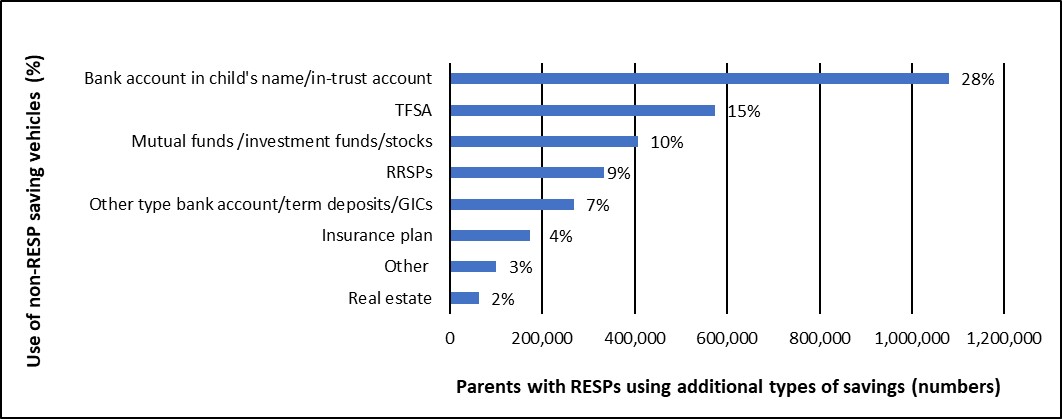
Text version – Figure 18
| Non-RESP savings vehicles used by parents to pay for PSE | Number of parents | Proportion of parents |
|---|---|---|
| Real estate | 63369 | 2% |
| Other | 100696 | 3% |
| Insurance plan | 173103 | 4% |
| Other type bank account/term deposits/GICs | 267948 | 7% |
| RRSPs | 333979 | 9% |
| Mutual funds /investment funds/stocks | 406906 | 10% |
| TFSA | 573866 | 15% |
| Bank account in child name/in-trust account | 1080381 | 28% |
The majority of key informants (8 of 9) indicated that CESG beneficiaries combine banking products with government financial assistance to finance PSE.Footnote 51
Another informant reported that students from high-income families combine savings vehicles. These students also combine “government debt” with “non-government debt.”Footnote 52
The same informant also indicated that lower-income families rely more heavily on government student financial assistance.
Many parents indicated in focus groups that they expect their children to get jobs to help fund their education. One parent’s children contributed to their own RESPs. Others used provincial loans and grants as well as RESPs and scholarships.
Some Nova Scotia parents mentioned that part-time or summer jobs will not provide enough money. One parent stated that a part-time job is too much work to combine with a rigorous PSE program like engineering. Another mentioned that there are fewer job opportunities for students in small towns as opposed to larger cities.Footnote 53
Impact on student debt
CESP beneficiaries made less use of CSFA than non-beneficiaries
From 2009 to 2015, an average of 29% of students who received the CESG benefited from a CSFA loan or grant. An average of 38% of students who did not receive the CESG benefited from a CSFA loan or grant during the same period (Figure 19).
The use of CSFA by students who received the CESG, and by those who did not, increased over time between 2009 and 2015:
- the proportion of students receiving the CESG who also received CSFA increased from 24% in 2009 to 33% in 2015
- among students who did not receive the CESG, the proportion who received CSFA increased from 34% in 2009 to 41% in 2015
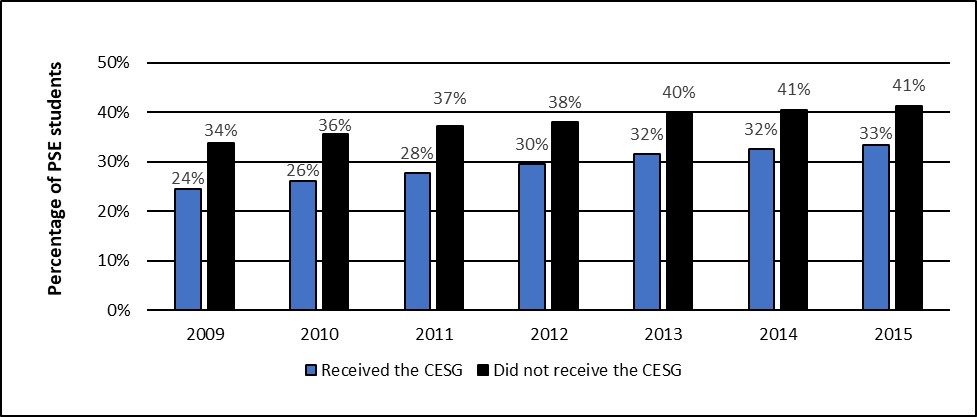
Text version – Figure 19
| Year | 2009 | 2010 | 2011 | 2012 | 2013 | 2014 | 2015 |
|---|---|---|---|---|---|---|---|
| Students who received the CESG | 24% | 26% | 28% | 30% | 32% | 32% | 33% |
| Students who did not receive the CESG | 34% | 36% | 37% | 38% | 40% | 41% | 41% |
According to an internal study conducted jointly by the CESP and CSFA programs in 2011, CSFA borrowers with RESP withdrawals tended to borrow less than all other borrowers.Footnote 55
The results of the study showed that this was true for all income quintiles. For instance, in 2007 CSFA borrowers from low-income families who made an RESP withdrawal borrowed 12% less than those from low-income families who had no withdrawals.
Most key informants (13 of 15) suggested that students with RESPs have lower levels of student debt upon graduation than those without, or that RESPs would help to reduce the amount that students need to borrow.Footnote 56
Between 2009 and 2015, the Canada Student Loan debt of CESG beneficiaries was lower than the debt of non-beneficiaries
The proportion of students taking loans continues to rise in spite of the CESP. Loan amounts also continue to rise.
From 2009 to 2015, students who received the CESG took, on average, 10% fewer loans under the CSFA than students who did not receive it (Figure 20).
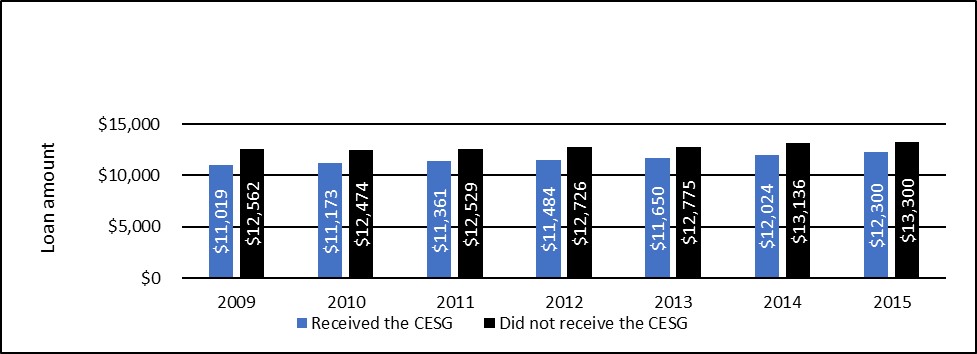
Text version – Figure 20
| Year | 2009 | 2010 | 2011 | 2012 | 2013 | 2014 | 2015 |
|---|---|---|---|---|---|---|---|
| Debt of students who received the CESG | $11 109 | $11 173 | $11 361 | $11 484 | $11 650 | $12 024 | $12 300 |
| Debt of students who did not receive the CESG | $12 562 | $12 474 | $12 529 | $12 726 | $12 775 | $13 136 | $13 300 |
The results of the 2011 study conducted jointly by the CESP and CSFA programs revealed that CSFA borrowers who had an RESP tended to have lower debt loads upon completion of their PSE than borrowers who never had an RESP.Footnote 58
- Among CSFA borrowers who consolidated their loans in 2007, those with RESPs had about $2,700 (21%) less debt than borrowers without RESPs
- The differences were more pronounced for students in the highest income quintile, where debt was 25% lower for those with an RESP
Most of the 4 parents in the Nova Scotia focus group expected their children to take on student debt, especially if they pursue out-of-province programs. One parent in a Quebec focus group saw PSE debt more as an investment that will pay off in higher income later.Footnote 59
A few of the 10 Toronto focus group parents mentioned that their children are considering medical school or engineering. These programs would make debt much more likely due to higher tuition or longer programs. So would the need to attend PSE away from home.Footnote 60
Parents in some focus groups stated that students going to community colleges or trade schools will not have to take on as much debt.Footnote 61
Parents in some focus groups expressed the desire for their children to avoid large debts for PSE. One Toronto parent said that “It would be nice to not have my kid graduate with 10 years of debt, so I am pushing him towards an apprenticeship and the trades so he can get out there and do more with fewer years of schooling.”Footnote 62
Barriers to PSE access
Low parental education is a barrier to PSE
Several studies conducted in Canada have demonstrated the positive correlation between the level of parental education and the probability of accessing PSE.Footnote 63
Finnie and Mueller (2017) revealed that students whose parents’ highest level of education is a university degree have a higher probability, by 12 to 13 percentage points, of pursuing PSE compared with students whose parents only have a high school diploma.
According to a few key informants (5 of 24) who discussed barriers to PSE, parents who do not have PSE would be less likely to encourage their children to pursue it.Footnote 64
A majority (17 of 24 informants) said that children whose parents lack or do not value PSE are less likely to pursue it themselves.Footnote 65
Children’s career knowledge and attitudes toward PSE
Finnie (2014) explained the importance of information in the decision to pursue PSE by stating that individuals must have access to comprehensive information to make an optimal choice.
The same author indicated that students need to be aware of future benefits related to pursuing PSE (such as labour demand, better career opportunities, or higher wages) as well as be knowledgeable of the costs associated with each option.
Parents’ failure to provide adequate information on PSE to their children at an early age (before grade 9) may constitute a major barrier to PSE access.Footnote 66
The Ontario Undergraduate Student Alliance also pointed out the importance of having information about PSE at an early age in a 2011 study.Footnote 67 It stated that if students who chose not to pursue PSE had received more information about programs and funding options earlier in school, their likelihood of accessing PSE would have increased.
A few key informants (3 of 20) mentioned that career indecision due to lack of information can inhibit students from pursuing PSE.Footnote 68
Career indecision was seen as a barrier by participants in a focus group for Nova Scotia parents and a group for Vancouver youth.Footnote 69
Parents in a Vancouver focus group mentioned that a student’s aptitudes can be a barrier, as can their commitment to completing a full-length program.Footnote 70
Lack of academic preparation and poor academic performance
According to a study using the Youth In Transition Survey, high school students whose average grade was 60% to 69% showed a low probability of pursuing PSE.Footnote 71
Frenette (2007) and Kamanzi, Doray, Murdoch, Moulin, Comoé, Groleau, Leroy, and Dufresne (2009) also indicated that the probability of participating in PSE strongly depended on the average grades obtained in languages, mathematics and sciences.
- For instance, a student who had a mark between 70% and 80% in languages, mathematics or sciences had a 43% probability of pursuing PSE compared to 13% for students who had 60% or less
- The authors noted that the PSE participation rate was higher among people who had developed good work habits in high school
Kamanzi, Doray, Bonin, Groleau, and Murdoch (2010) showed that devoting more time to homework increased the probability of accessing PSE. Students who spent 4 to 7 hours per week on homework had a 56% probability of accessing PSE. Students who devoted 1 hour or less to homework only had a 23% probability.
Half of the key informants (12 of 24) who spoke about barriers agreed that insufficient grades, inadequate academic preparation, or failure to meet academic prerequisites are obstacles to PSE access for both CESP beneficiaries and non-beneficiaries.Footnote 72
The importance of aspirations, motivation, and a sense of belonging
The lack of aspirations, objectives, commitment, or a sense of belonging are factors linked to academic performance which constitute a barrier to access to PSE.
Some key informants (9 of 24) suggested that a lack of motivation or negative attitudes toward PSE on the part of some students can be barriers to access.Footnote 73
On the other hand, students with strong aspirations to pursue PSE are likely to work harder on their schoolwork and thus obtain better grades.
According to Frenette (2009), students who realized earlier that they need a PSE degree to achieve their career aspirations had a higher PSE attendance rate.
Lambert, Zeman, Allen, and Bussière (2004) indicated that young people who had a strong sense of belonging were more likely to continue their PSE.
Distance from educational institutions and challenges related to accessing services
Some key informants (8 of 24) mentioned distance from educational institutions or programs as a significant barrier to accessing PSE.Footnote 74
One of these informants observed that students who do not have appropriate programs near them must move away from home, which incurs social and financial costs.Footnote 75
Some informants (8 of 22) speaking about the use of digital technology suggested that lack of access to services in remote areas can be a barrier to PSE.Footnote 76
According to Frenette (2002 and 2006), due to the large number of colleges that are available even in rural areas, distance is more often a barrier to university attendance. The author showed that students with a commuting distance greater than 80 kilometers had lower university participation rates than students from urban centres.
Parents in a Nova Scotia focus group mentioned that some children may not be ready to leave home and live independently in a new city. Some noted that housing presents a barrier because community colleges often do not have residences, requiring students to find off-campus housing.Footnote 77
Two participants in a focus group for Toronto youth spoke about the barrier of commuting to school. One stated that their long commutes to campus take upwards of 60 minutes, which can be taxing and stressful.Footnote 78
Talking with parents about future education significantly influences a child’s likelihood of attending PSE
Finnie (2012) demonstrated that parent-child discussions about school are a major determinant in the decision to pursue PSE. This decision is made early in childhood, in many cases very early, based on information that children receive from parents.
Childs, Finnie and Mueller (2015) showed, using the Youth in Transition Survey, that the following factors are significantly related to PSE attendance:
- home environment
- family habits and behaviors
- the frequency of discussions between parents and children
Certain groups are more likely to face some barriers to accessing PSEFootnote 79
Low-income families
A few key informants (2 of 11) who spoke about barriers for low-income families suggested that parents in these families are less likely to have completed PSE.Footnote 80
A few (6 of 24) who spoke about barriers in general said that parents without PSE are less likely to encourage their children to pursue it.Footnote 81 One of these informants said that parents who did not complete PSE are less likely to save for their children’s education.Footnote 82
According to Frenette (2007), students from high-income families are almost 5 times more likely to have at least 1 parent with a graduate or vocational degree, compared to those from low-income families.
- The author noted that students from low-income families are more likely to face barriers related to academic achievement
- In addition, students from low-income families are more likely to face barriers related to a lack of parental involvement and commitment
According to Clay (2015), young people living in low-income families often do not have equal access to educational supports or parental support compared to their peers in high-income families.
Indigenous communities
Among key informants who discussed how barriers differ for certain groups, a majority (12 of 21) mentioned obstacles to PSE access faced by Indigenous people.
Of those informants, some (3 of 12) suggested that Indigenous people may have weaker academic preparation or more difficulty with school than other students.Footnote 83
Some informants (4 of 12) suggested that Indigenous people may have a lack of trust in formal education stemming from historical experiences of colonization and residential schools.Footnote 84
Some informants (4 of 12) suggested that Indigenous people could face challenges accessing the CESP due to a lack of trust in government and a lack of necessary documents such as a birth certificate or SIN.Footnote 85
A few informants (2 of 12) suggested that living in remote areas means that some Indigenous people have reduced access to the internet or to government and financial services.Footnote 86
According to Bougie et al. (2013), many Indigenous people live in remote areas without opportunity to see the positive outcomes of obtaining PSE, so are less likely to pursue it.
Bekenn (2016) highlighted domestic violence and abuse as major barriers to accessing PSE for Indigenous communities.
Newcomers, immigrants, and racialized groups
According to analysis by the CESP program, a higher percentage of children with primary caregivers who are immigrants received the Basic CESG than children whose caregivers are not immigrants:
- 48.1% of children with a primary caregiver (PCG) who was an immigrant received the Basic CESG
- 36.1% of children with a Canadian-born PCG received it
Regression results also suggested that children with a PCG born in Canada had a higher likelihood (by nearly 9.3 percentage points) of not receiving the Basic CESG relative to children of recent immigrants.Footnote 87
Still, some key informants (6 of 21) suggested that newcomers may have low awareness of education savings products (including RESPs and the CESP) and how they function. They may also lack awareness of requirements to access these products, such as filing income tax returns.Footnote 88
The post-secondary education completion rates of specific groups may differ.
According to Statistics Canada (2021), “Black youth (27%) and youth who are not a visible minority (23%) are significantly less likely than other groups to have obtained a university degree.”Footnote 89 In contrast, 68% of Chinese and 58% of South Asian youth who are not immigrants attain a bachelor’s degree or higher.
Some key informants (9 of 21) suggested that newcomers are more highly motivated to participate in PSE than people in other groups. One said that their children have higher rates of participation.Footnote 90
A majority (12 of 21) noted that language barriers can hinder some newcomers’ ability to participate in PSE.Footnote 91
A few (2 of 21) said that some newcomers (such as refugees) suffer disruptions in their education which may require them to repeat grades. They also noted that some communities devalue girls’ education, making them less likely to encourage their daughters to pursue it.Footnote 92
Magnan, Pilote, Collins and Kamanzi (2019) noted that a lack of appropriate information is a major barrier to PSE access for immigrants.
Some immigrant parents mistakenly believe that the system for PSE will be the same in Canada as in their country of origin.
According to Kamanzi and Collins (2021), a lack of a sense of belonging is also a barrier for students of immigrant parents.
People with disabilities
Some key informants (9 of 21) who were asked if barriers differ for certain groups noted specific obstacles faced by persons with disabilities. Five mentioned a lack of educational resources, and 2 noted that students with disabilities have greater difficulty making academic progress.Footnote 93
Sweet, Anisef, Brown, Adamuti-Trache, and Parekh (2012) compared Grade 11 and 12 students with disabilities to those without disabilities in Ontario. They found that only 7% of students with disabilities scored above 80%, compared to 30% of students without disabilities.
Reid, Bennett, Specht, White, Somma, Li, Lattanzio, Gavan, Kyle, Porter, and Patel (2018) highlighted several barriers that students and their parents face in Ontario’s public schools. Their study, based on a survey of 280 parents or caregivers of students with intellectual disabilities, found that:
- 53% of parents reported that their child was not receiving proper academic accommodations
- 67% of parents reported that their child had been excluded from the appropriate curriculum based on their level of learning
- 62.7% reported that their child had been excluded from extracurricular activities
- 32% of parents reported that their child did not have access to additional support staff when it was needed (educational assistants, for example)
Parents in 3 focus groups mentioned that mental health issues could interfere with students’ pursuit of PSE. One Edmonton parent was unable to save for PSE due to their child’s disability-related expenses.Footnote 94
Conclusion
The CESG was launched in 1998 to encourage Canadians to use RESPs to build savings for a child’s PSE. The Evaluation Directorate conducted the fourth evaluation of the Canada Education Savings Program (CESP) based on multiple lines of evidence and a variety of methods to respond to questions about the program’s contribution to PSE.
The program has increased its take-up rate over time. Despite this improvement, low-income families are less likely to benefit than families with higher incomes. The evaluation findings demonstrate that CESG beneficiaries are more likely to access PSE and graduate than non-beneficiaries. As a result, increasing awareness of the program may continue to support positive PSE outcomes.
An examination of CSFA and the CESG indicates that CESG beneficiaries made less use of CSFA and took fewer loans under CSFA than non-beneficiaries.
In addition, the evaluation found that parents’ savings behaviours are related to their socio-economic and demographic characteristics as well as to their aspirations and attitudes towards PSE. Therefore, a better understanding of the impact of these factors on PSE outcomes would contribute to more informed decision-making by the program. Non-financial barriers such as parental attitudes and savings behaviours have an important influence on access to PSE. The program, in collaboration with other programs that have relevant tools, should explore ways to enhance its promotional activities to better target groups who may benefit.
Management response and action plan
Overall management response
Canada Education Savings Program part 2: final evaluation report
This impact evaluation is an important milestone for the Canada Education Saving Program (CESP). For the first time, using recent data linkages it was possible to measure key program outcomes of children who received the Canada Education Savings Grant (CESG) and who are old enough to participate in post-secondary education (PSE).
The evaluation finds that the CESG has a positive impact on both enrolment and completion of PSE, even when isolating the specific impact of the CESG from other factors known to influence PSE participation.
In addition, the evaluation finds that CESG beneficiaries are less likely to rely on student loans, and when they do, they tend to have smaller loans. However, findings show that those with low income are less likely to benefit from the CESG as they face access challenges to education savings incentives. Management recognizes that while the CESP significantly benefits many Canadian children and youth, there is a need to enable greater program access among populations with low income who also tend to face more PSE participation barriers. While beneficiaries of the Canada Learning Bond (CLB) low-income population are too young to have completed PSE, our data show that in 2021, almost three quarters (73%) of CLB beneficiaries made RESP contributions resulting in CESG payments.
Since 2015, the CESP has undertaken multiple outreach initiatives to increase awareness and take-up of RESPs and education savings benefits; especially for children from families with low incomes, Indigenous People, newcomers to Canada, and those living in rural and remote communities. These activities include:
- co-chairing the CLB Champions’ Network, and expanding it to include over 300 organizations across Canada who actively promote the CLB
- undertaking mailings to the primary caregivers and community-based organizations to raise awareness of opportunities to access the CLB
- partnering with the Canada Revenue Agency (CRA) to include inserts on the CLB in CRA’s mailing of Canada Child Benefit Notices of Entitlement
- planning, organizing and supporting outreach events, such as the annual Education Savings Week, information sessions and regional engagement; and
- collaborating with provincial ministries and child welfare organizations to facilitate RESP opening and CLB opening for children in care, through an electronic “tool kit”
The CESP has also implemented initiatives to make it easier for eligible parents to apply online for the CLB. This includes a strategic collaboration with the Province of Ontario to integrate an Education Savings Referral Service within Service Ontario’s online Newborn Registration System. Parents can be referred to an RESP promoter of their choice to begin the process of opening an RESP and requesting the CLB.
To help more low-income families benefit from the CLB, ESDC is also investing close to $12.0 million over 6 years in the CLB Pilot Project to fund community initiatives testing new and innovative ways to increase CLB awareness and reduce barriers to access.
Phase I provided approximately $5.0 million in funding to 12 community-based projects to deliver activities from March 2019 to March 2021. The CESP anticipates the completion of the second phase of 13 projects in the fall of 2024. These projects target groups facing greater access challenges, including Indigenous Peoples, recent immigrants, children in care and those living in rural and remote communities.
Recommendation #1
Explore ways of increasing take-up of education savings incentives.
Management response
Management agrees with this recommendation.
The CESP is exploring ways to increase access to education savings benefits by simplifying program access.
Management action plan
- Complete a collaborative project with ESDC’s Innovation Lab aiming to understand clients’ needs and preferences regarding simplified service delivery options to access the CLB
- Estimated completion date: June 2023
- Explore and assess the feasibility of simplified service delivery options enabling the opening of RESPs and access to the education savings benefits, particularly for low-income children
- Estimated completion date: November 2023
Recommendation #2
Explore outreach opportunities to increase awareness of education savings incentives and the benefits associated with pursuing PSE, with a focus on groups facing barriers.
Management response
Management agrees with this recommendation.
ESDC is planning a range of outreach and awareness-building initiatives to help increase access to education savings benefits among low-income families and hard-to-reach populations over the coming years, in collaboration with community partners, Indigenous organizations, provinces and territories, and financial organizations.
Management action plan
- Ensure greater coordination of CESP mailings with both government and community organizations undertaking community-outreach initiatives raising awareness of, and enabling access to, the education savings benefits
- Estimated completion date: ongoing
- Develop a comprehensive package of tools and supports for partners to facilitate supported enrolment and RESP engagement for marginalized groups and populations in remote areas
- Estimated completion date: winter 2024
- Updating the education savings information on Canada.ca based on user testing, to make it easier for Canadians to learn about education savings benefits, and access the list of RESP promoters who offer the benefits
- Estimated completion date: winter 2024
References
Angelo, V. (2012). “An Analysis of Access Barriers to Post-Secondary Education.” College Quarterly, Volume 15 Number 4. https://files.eric.ed.gov/fulltext/EJ998777.pdf
Bekenn C. (2016). “Indigenous access to post-secondary education. How federal policy can help close the gap.” Major Research Paper. https://ruor.uottawa.ca/bitstream/10393/35307/1/BEKENN%2C%20Clare%2020165.pdf
Bougie, E., Kelly-Scott, K. and Arriagada, P. (2013). The Education and Employment Experiences of First Nations People Living off Reserve, Inuit and Métis: Selected Findings from the 2012 Aboriginal Peoples Survey. Ottawa, ON: Statistics Canada, Social and Aboriginal Statistics Division. https://www150.statcan.gc.ca/n1/pub/89-653-x/89-653-x2013001-eng.htm
Bushnik, T., Barr-Telford, L., and Bussière, P. (2004). In and Out of High School: First Results from the Second Cycle of the Youth in Transition Survey, 2002. Statistics Canada, Catalogue 81-595-MIE- No.014. https://www150.statcan.gc.ca/n1/en/pub/81-595-m/81-595-m2004014-eng.pdf?st=yeA2XbR6
Card, D. and Payne, A. Abigail (2015). Understanding the Gender Gap in Postsecondary Education Participation The Importance of High School Choices and Outcomes. Toronto: Higher Education Quality Council of Ontario. https://heqco.ca/pub/understanding-the-gender-gap-in-postsecondary-education-participation-the-importance-of-high-school-choices-and-outcomes
Chatoor, K., MacKay, E. and Hudak, L. (2019). Parental Education and Postsecondary Attainment: Does the Apple Fall Far from the Tree? Toronto: Higher Education Quality Council of Ontario.
Childs, S., Finnie, R. and Mueller, R.E. (2015). Assessing the importance of cultural capital on post-secondary education attendance in Canada. http://scholar.ulethbridge.ca/sites/default/files/mueller/files/childs-finnie-mueller.cultural_capital.november.2015.complete.pdf?m=1480459831
ESDC (2022). Canada Education Savings Program: 2021 Annual Statistical Review https://www.canada.ca/en/employment-social-development/services/student-financial-aid/education-savings/reports/statistical-review.html
ESDC (2023). Canada Education Savings Program, Evaluation Part II: Key Informant Interviews, unpublished technical report.
Finnie, R. (2012). “Access to postsecondary education: the importance of culture.” Children and Youth Services Review. No. 34.
Finnie, R. (2014). “Does Culture Affect Post-Secondary Education Choices?” Higher Education and Management Policy (OECD), 24 (3), 57-85.
Finnie, R., Mueller R.E. (2017). “Access to post-secondary education: how does Québec compare to the rest of Canada?” L’actualité économique, Vol. Number 3, September 2017, p. 441–474. https://www.erudit.org/en/journals/ae/1900-v1-n1-ae04480/1058428ar/
Frenette, M. (2002). Too Far To Go On? Distance to School and University Participation. https://www150.statcan.gc.ca/n1/en/pub/11f0019m/11f0019m2002191-eng.pdf?st=dmXqvj5O
Frenette, M. (2007). Why Are Youth from Lower-income Families Less Likely to Attend University? Evidence from Academic Abilities, Parental Influences, and Financial Constraints. Statistics Canada. Cat. 11, No. 295. p. 1-38. https://www150.statcan.gc.ca/n1/en/pub/11f0019m/11f0019m2007295-eng.pdf?st=1RYPO8ss
Frenette, M. (2009). “Career Goals in High School: Do Students Know What it Takes to Reach Them, and Does it Matter?” Analytical Studies Branch Research Paper Series - Statistics Canada Social Analysis Division. https://www150.statcan.gc.ca/n1/en/pub/11f0019m/11f0019m2009320-eng.pdf?st=GNJY__mt
Frenette, M. (2017). Investments in Registered Education Savings Plans and Postsecondary Attendance. Ottawa: Statistics Canada. https://www150.statcan.gc.ca/n1/pub/11-626-x/11-626-x2017071-eng.htm
Kamanzi, P.C. and Collins, T. (2021). Perspective chapter: Behind the exceptional educational pathways of Canadian youth from immigrant background – Between equality and ethnic hierarchy. https://www.intechopen.com/chapters/78605
Kamanzi, P.C., P. Doray, S. Bonin, A. Groleau, and J. Murdoch (2010). “Les étudiants de première génération dans les universités: L’accès et la persévérance aux études au Canada.” Revue canadienne de l’enseignement supérieur / Canadian Higher Education Review, vol. 4(3), pp. 1-24.
Kamanzi, P.C., Doray, P., Murdoch, J., Moulin, S., Comoé, E., Groleau, A., Leroy, C., and Dufresne, F. (2009). “The Influence of Social and Cultural Determinants on Post-Secondary Pathways and Transitions.” Project Transitions, Research Paper 6. Montreal: Canada Millenium Scholarship Foundation (Number 47).
Lambert, M., Zeman, K., Allen, M. and Bussière, P. (2004). Who pursues postsecondary education, who leaves and why: Results from the Youth in Transition Survey. Ottawa, ON: Culture, Tourism and the Centre for Education Statistics Division, Statistics Canada.https://www150.statcan.gc.ca/n1/en/pub/81-595-m/81-595-m2004026-eng.pdf?st=bVz_32EG
Magnan, M. O., Pilote, A., Collins, T., and Kamanzi, P.C. (2019). “Discours de jeunes issus de groupes minoritaires sur les inégalités scolaires au Québec.” Diversité urbaine, 19, 93-114.
Neil, C. (2009). “Tuition fees and the demand for university places.” Economics of Education Review 28, p. 561-570.
Ontario Undergraduate Student Alliance (2011). Breaking barriers: A strategy for equal access to higher education. Toronto, Canada: Ontario Undergraduate Student Alliance, College Student Alliance, and the Ontario Student Trustees’ Association https://assets.nationbuilder.com/ousa/pages/124/attachments/original/1473432552/2011-02_Submission_-_Breaking_Barriers_with_CSA_and_OSTA-AECO_document.pdf?1473432552
Rahman, A., Situ, J. and Jimmo, V. (2005). Participation aux études postsecondaires : Résultats de l’Enquête sur la dynamique du travail et du revenu. Documents de recherche. Division de la Culture, tourisme et centre de la statistique de l’éducation. https://publications.gc.ca/Collection/Statcan/81-595-MIF/81-595-MIF2005036.pdf
Reid, L., Bennett, S., Specht, J., White, R., Somma, M., Li, X., Lattanzio, R., Gavan, K., Kyle, G., Porter, G., and Patel, A. (2018). “If inclusion means everyone, why not me?” Inclusive Education Research. https://www.inclusiveeducationresearch.ca/docs/why-not-me.pdf
Shaienks, D., Gluszynski, T., and Bayard, J. (2008). Postsecondary Education – Participation and Dropping Out: Differences Across University, College and Other Types of Postsecondary Institutions. Ottawa, Canada: Statistics Canada, Culture, Tourism and the Centre for Education Statistics; https://publications.gc.ca/collections/collection_2008/statcan/81-595-M/81-595-MIE2008070.pdf
Statistics Canada. “Study: Youth and education in Canada.” The Daily. https://www150.statcan.gc.ca/n1/daily-quotidien/211004/dq211004c-eng.htm
Sweet, R., Anisef, P., Brown, R., Adamuti-Trache, M. and Parekh, G. (2012). Special needs students and transitions to postsecondary education. Higher Education Quality Council of Ontario. https://heqco.ca/wp-content/uploads/2020/03/Special-Needs-ENG.pdf
Willms, J. and Flanagan, P. (2003). Ready or not? Literacy skills and postsecondary education. Montreal: Canada Millennium Scholarship Foundation.
Appendices
Appendix A: Previous key evaluation findings
Part 1 of the CESP evaluation focused on challenges and barriers to take-up of the CLB among low-income families.Footnote 95 The main findings were as follows.
- The CESP serves its function by providing an incentive for parents, family and friends of children to save for their PSE, including those from low- and middle-income families. In 2020, $3.9 billion in funds were withdrawn from RESPs to assist students with their PSE expenses. This has increased by 102% from approximately $1.95 billion in 2010
- At the end of 2020, the total number of children who had ever received the CLB represented 41.9% of the eligible population. This figure indicates a need for greater awareness and easier access to the bond
- The education savings gap between children from low- and middle-income families (such as those eligible for the Additional Canada Education Savings Grant and/or CLB) and those from high-income families has narrowed significantly over time. The education savings gap diminished from over 33% in 2010 to approximately 3% in 2019. However, this trend reversed in 2020 when the gap grew to approximately 8% during the COVID-19 pandemic
- Barriers such as a lack of awareness, lack of understanding, and the complexity of the RESP opening process still exist. These barriers prevent potential beneficiaries from receiving the Canada Learning Bond
The 2022 evaluation offered 1 main recommendation:
- explore options to simplify the process to access the CLB, and consider targeted strategies to increase CLB take-up among marginalized groups and populations in remote areas
Appendix B: Methodology and limitations
1. Literature review completed by the Evaluation Directorate
- Studies published after 2000 that incorporate factors explaining differences in caregivers’ and students’ attitudes and perceptions towards PSE
- Academic journals or textbooks, governmental publications
- Key search terms such as:
- barriers
- non-financial barriers
- access to PSE
- PSE participation rate
- academic performance
- students with disability
- attainment
- education outcomes
- middle- and low-income families
- high-income families
- Indigenous status
- women
- newcomers
Key challenges and limitations
- The literature generally does not directly address the effects of government programs on PSE
- Limited literature focusing on CESG beneficiaries and CESG-eligible non-beneficiaries.
- The literature makes it possible to consider factors external to the program that affect the pursuit of PSE
2. Key informant interviews completed by the Evaluation Directorate
Key informant interviews were intended to gather information on the contribution of the CESG to access to PSE. They also sought to better understand the barriers that might prevent CESG beneficiaries from accessing PSE. A total of 28 interviews were conducted from June 23 to September 29, 2022 with:
- 7 internal stakeholders including ESDC employees; and
- 19 external stakeholders including:
- 4 representatives from organizations promoting PSE
- 7 representatives from financial institutions, and
- 8 representatives from organizations serving low-income families
Key challenges and limitations
- Some interview questions asked about caregivers’ attitudes to savings or students’ ability to meet their financial needs using RESPs or CSFA. Such questions would be best asked of caregivers and students
- Evaluation questions focus on CESG impact but interviews focused on the CESP as a whole, thus confusing the focus of the interviews. In addition, many informants spoke at length about the CLB
- There were no key informants from Atlantic Canada and few from Quebec
- Only 4 French speakers were interviewed. Two of them asked to speak in English
3. Focus groups completed by contractors hired by the Evaluation Directorate
The focus groups aimed to provide evidence based on explanations, perceptions and experiences of various stakeholder groups. Eight focus groups including between 1 and 8 participants each (2 streams) were conducted:
- total: 28 participants
- 18 caregivers and 10 youth
- 18 females and 10 males
- 6 focus groups with parents or caregivers of children who have opened an RESP and those who have not, including:
- 2 in rural or secluded areas (rural Nova Scotia and rural Quebec)
- 2 in large urban centers (Toronto and Montreal)
- 1 in a community (other than a First Nation reserve) with a relatively high number of people who identify as being Indigenous (Whitehorse, Yellowknife and Edmonton combined)
- 1 in a community with a relatively high number of recent immigrants or members of racialized minority groups (Vancouver)
- 2 focus groups with students between the ages of 16 and 22 years for whom an RESP was opened or not:
- 1 in a large urban center (Toronto)
- 1 in a community with a relatively high number of recent immigrants or members of racialized minority groups (Vancouver)
Key challenges and limitations
- Major recruitment challenges due to lack of contact information in the CESP program database
- Focus groups faced challenges in recruiting sufficient numbers of participants:
- groups were only able to recruit between 5 and 15 participants
- the gross participation rate was 1 to 3 percent
- Potential self-selection biased since some types of people were more or less likely to participate
- Almost all participants had an RESP, though the intention was to recruit people with and without RESPs
- Self-declared information
4. Analysis of linked administrative data completed by the Evaluation Directorate
Program beneficiaries from low- and middle-income families who received Additional CESG (treatment group) were compared with those without RESPs (comparison group) with a view to isolate the impact of receiving CESGs on PSE and labour market outcomes. Three administrative databases were linked:
- CESP Administrative data
- T1FF-T1 Family File (Canada Revenue Agency, Income tax)
- LAD - Longitudinal Administrative Databank register
a) Limitations related to the choice of the cohorts and reference period
- Some individuals in the selected cohort (born in 1993 and 1994) may still have been at school in 2016, which in turn may affect their labour market outcomes. While some youth may have transitioned into the labour market after 2016, income tax data for these years was not available at the time of the analysis
- Cohorts born before 1993 may have benefitted from the Additional CESG since it was launched in 2005. However, these cohorts were not selected for the following reasons:
- they would not have benefited from the Additional CESG long enough to measure its contribution
- the sample after matching would have been very small because there were not enough observations or data available for previous cohorts to run the regression
b) Limitations that affected the comparability of the treatment (program) and control groups
The following variables were used to match the treatment and control groups:
- sex (CESP)
- age (CESP)
- parental income (LAD linked to T1FF-T1)
- Indigenous status (LAD linked to T1FF-T1)
- location (LAD linked to T1FF-T1)
- family type (LAD linked to T1FF-T1) – family composition
However, the following factors were not available to be included in this analysis. Having those factors would have increased the confidence in comparability of both groups:
- educational attainment (for example, grade levels, performance) before individuals enter university
- other financial aids
- parents’ attitude toward PSE
- parents’ education level
It should be noted that other lines of evidence provide qualitative information to address these issues. Labour market outcomes are measured based on the individual income variable as proxy.
5. Analysis of Statistics Canada’s Survey of Approaches to Educational Planning (SAEP) completed by the Evaluation Directorate
Data from the SAEP cross-sectional survey from Statistics Canada which examines how Canadians are preparing their children for PSE were analyzed based on 2 methods:
a) Crosstabs
Crosstabs were developed for descriptive analysis and to generate graphs.
b) Probit regression
Used to predict the likelihood that parents aspire for their children to reach PSE.
- Binary dependent variable: having parental aspirations for children to reach PSE
- Yes: if highest level of education that parents expect their children to reach is PSE
- No: if highest level of education that parents expect their children to reach is below PSE
- Independent variables:
- having RESP
- parental education
- family income
- age (child)
- sex (child)
- region
- type of economic family
- number of children
Key challenges and limitations
- Age of children: SAEP targeted children aged 17 or less, but it is certain that some may enroll in PSE later. In addition, observations are reduced for variables related to PSE
- Reverse or simultaneous causality: the reverse causality problem occurs when a first factor is supposed to cause a second while the second could also cause the first. For instance, having an RESP could influence parents' aspirations for PSE enrolment for their children. Conversely, having these aspirations might also lead parents to open an RESP
- Data self-declared by parents
- Omitted variables bias: this bias is caused by certain variables not being available and therefore not being included in the analysis, such as:
- child’s grades
- experience in high school
- engagement
- sense of belonging
6. Administrative data analysis completed by the CESP program (or by the Evaluation Directorate based on analysis conducted by the CESP program)
a) Crosstabs and rates
- Crosstabs were developed for descriptive analysis and to generate Figure 19
- PSE enrolment and completion rates were calculated (Figure 6 and Figure 9)
- Debt levels of PSE students were calculated (Figure 20)
b) Regression
Logistic regression used to identify the factors associated with a higher likelihood of not receiving the Basic CESG.
- Binary dependent variable: Did not receive the Basic CESG in 2016 (reference: Received the Basic CESG in 2016)
- Did not receive the Basic CESG: 1
- Received the Basic CESG: 0
- Independent variables:
- age category of beneficiary
- gender of beneficiary
- age of PCG
- province or territory of residence of the PCG
- PCG lives in rural area (yes=1, no=0)
- PCG is immigrant (recent immigrant, non-recent immigrant, Canadian-born)
- Indigenous status of the PCG
- child has an activity limitation
- PCG has an activity limitation
- family type
- language spoken most often at home
- highest level of education of the PCG
- PCG labour force attachment
- accommodation status (owner, renter, band housing)
- number of kids in the household
- PCG received some government transfers
Logistic regression used to identify the factors associated with a higher likelihood of completing a PSE degree within 5 years of enrolling in PSE.
- Binary dependent variable: Completed a PSE degree within 5 years of enrolling in PSE
- Yes: 1
- No: 0
- Independent variables:
- student received the CESG
- parental total income category
- sex of student
- year student was first enrolled in a PSE program
- citizenship status of the student (permanent resident or Canadian citizen)
- student has a disability
- student is a dependant
- number of kids in a family
- type of instructional programs
- marital status
- province or territory of residence of the student
- age category of the student at the time the student first enrolled in a PSE program
Key challenges and limitations
- Omitted variable bias: some variables correlated with completion were not available in the data and as a result, they were not included in the regression model. As a result, the model may overestimate the importance of receiving the CESG in completing a PSE degree. These variables include:
- student cognitive skills
- student non-cognitive skills
- persistence
- employment status
- Comparability of control group and treatment group: the logistic regression model as specified made it possible at this stage to establish an association between receipt of the CESG and completion. A quasi-experimental approach would have made it possible to correct several sources of endogeneity in order to make the 2 groups comparable. Such an approach would have made it possible to establish a causal relationship between receipt of the CESG and completion in order to better measure the impact of the program
Appendix C: Logic model – Canada Education Savings Program
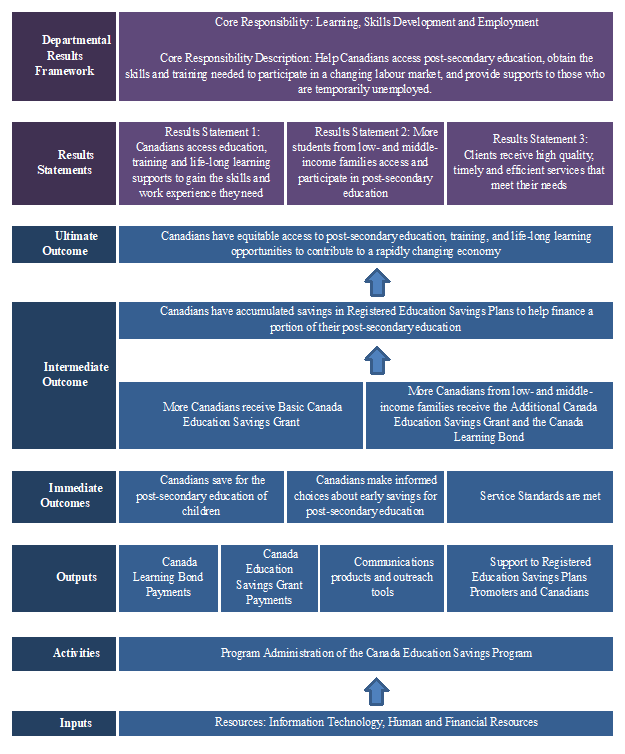
Text version – Figure 21
Departmental results framework
Core responsibility: Learning, Skills Development and Employment.
Core responsibility description:
- help Canadians access post-secondary education
- obtain the skills and training needed to participate in a changing labour market, and
- provide supports to those who are temporarily unemployed
Results statements
- Results Statement 1: Canadians access education, training and life-long learning supports to gain the skills and work experience they need
- Results Statement 2: More students from low- and middle-income families access and participate in post-secondary education
- Results Statement 3: Clients receive high quality, timely and efficient services that meet their needs
Ultimate outcome
Canadians have equitable access to post-secondary education, training, and life-long learning opportunities to contribute to a rapidly changing economy.
Intermediate outcomes
- Canadians have accumulated savings in Registered Education Savings Plans to help finance a portion of their post-secondary education
- More Canadians receive Basic Canada Education Savings Grant
- More Canadians from low- and middle-income families receive the Additional Canada Education Savings Grant and the Canada Learning Bond
Immediate outcomes
- Canadians save for the post-secondary education of children
- Canadians make informed choices about early savings for post-secondary education
- Service standards are met
Outputs
- Canada Learning Bond Payments
- Canada Education Savings Grant Payments
- Communications products and outreach tools
- Support to Registered Education Savings Plans Promoters and Canadians
Activities
Program Administration of the Canada Education Savings Program.
Inputs
Resources: Information Technology, Human and Financial Resources.
Appendix D: Accessing the RESP and CESG
- Gather personal information:
- birth certificate
- Social Insurance Number (SIN)
- Open and contribute to an RESP:
- choose an RESP provider and the right type of RESP
- open an RESP
- Fill in application form with RESP promoter
- Check to confirm that the grant has been deposited
Eligibility for the basic CESG:
- be a resident of Canada
- have a valid SIN
- be named as a beneficiary in an RESP
Eligibility for the Additional amount of CESG:
- be a child from middle- and low-income families
- have an adjusted family income of $100,392 or less in 2022
Holding an RESP is an essential prerequisite for accessing the CESG.
Before opening an RESP, subscribers must have the required personal information and documents on hand:
- a SIN for their child, and one for themselves. There is no fee for a SIN but certain documents, such as birth certificates, are required
Once subscribers have gathered the required personal information, 2 essential choices must be made to open the RESP:
- select the right plan among the 3 types (individual, family, or group plan)
- choose a suitable promoter for their needs. Most financial institutions (such as banks and credit unions), as well as certified financial planners and group plan dealers, provide RESPs
After opening the RESP, subscribers must complete a CESP application form with the chosen RESP provider.
Finally, subscribers must verify that the CESG and the Additional CESG (if applicable) have been deposited in the RESP.
Appendix E: CESG take-up rate by gender
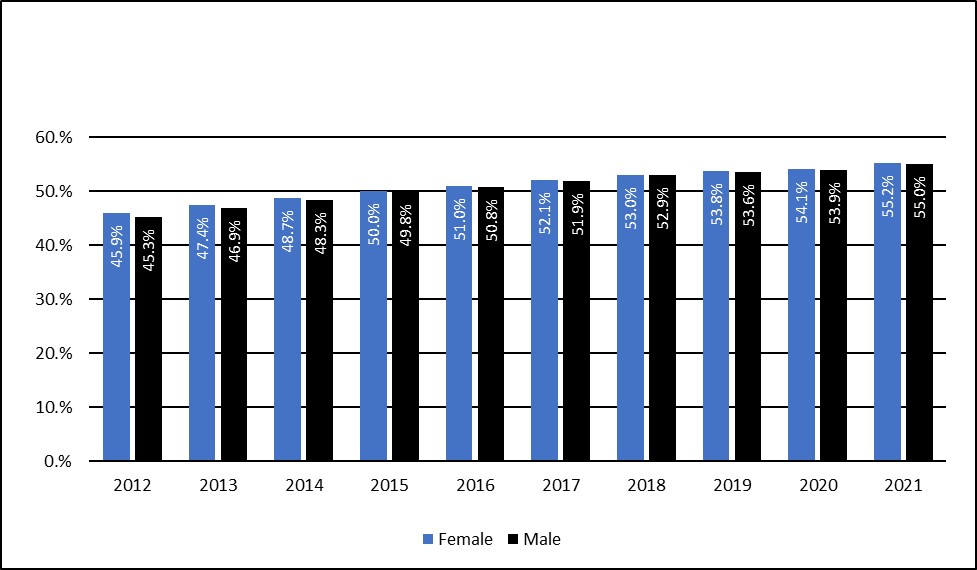
Text version – Figure 22
| Year | 2012 | 2013 | 2014 | 2015 | 2016 | 2017 | 2018 | 2019 | 2020 | 2021 |
|---|---|---|---|---|---|---|---|---|---|---|
| Female | 45.9% | 47.4% | 48.7% | 50.0% | 51.0% | 52.1% | 53.0% | 53.8% | 54.1% | 55.2% |
| Male | 45.3% | 46.9% | 48.3% | 49.8% | 50.8% | 51.9% | 52.9% | 53.6% | 53.9% | 55.0% |
Appendix F: Impact on PSE enrolment – regression results
Table 3: Impact on PSE enrolment – regression results, Average Treatment on TreatedFootnote 98
Note: this table was modified for accessibility reasons.
| Matching algorithms | Treated | Controls | Difference | Standard error | T – stat |
|---|---|---|---|---|---|
| Kernel | 0.4212 | 0.1237 | 0.297** | 0.1047 | 2.84 |
| Nearest neighbor (2) | 0.4758 | 0.0146 | 0.461** | 0.1514 | 3.04 |
| Nearest neighbor (3) | 0.4758 | 0.2347 | 0.241 | 0.1306 | 1.84 |
- **significant at the 5% level, p<0.05
| Matching algorithms | Treated | Controls | Difference | Standard error | T – stat |
|---|---|---|---|---|---|
| Kernel | 0.6669 | 0.1585 | 0.508*** | 0.1502 | 3.39 |
| Nearest neighbor (2) | 0.7123 | 0.0246 | 0.687*** | 0.1981 | 3.47 |
| Nearest neighbor (3) | 0.7123 | 0.2456 | 0.466** | 0.1709 | 2.73 |
- ***significant at the 1% level, p<0.01
- **significant at the 5% level, p<0.05
| Matching algorithms | Treated | Controls | Difference | Standard error | T – stat |
|---|---|---|---|---|---|
| Kernel | 0.6806 | 0.4431 | 0.237 | 0.1626 | 1.46 |
| Nearest neighbor (2) | 0.7382 | 0.3879 | 0.3502 | 0.21804 | 1.61 |
| Nearest neighbor (3) | 0.7382 | 0.2701 | 0.468** | 0.18254 | 2.56 |
- **significant at the 5% level, p<0.05
| Matching algorithms | Treated | Controls | Difference | Standard error | T – stat |
|---|---|---|---|---|---|
| Kernel | 0.5453 | 0.6844 | 0.139 | 0.16766 | 0.83 |
| Nearest neighbor (2) | 0.7198 | 0.3958 | 0.324 | 0.22440 | 1.44 |
| Nearest neighbor (3) | 0.7198 | 0.4977 | 0.222 | 0.189664 | 1.17 |
| Matching algorithms | Treated | Controls | Difference | Standard error | T – stat |
|---|---|---|---|---|---|
| Kernel | 0.6588 | 0.2601 | 0.398** | 0.16137 | 2.47 |
| Nearest neighbor (2) | 0.7198 | 0.3958 | 0.324** | 0.22440 | 2.82 |
| Nearest neighbor (3) | 0.6871 | 0.27144 | 0.415* | 0.18878 | 2.20 |
- **significant at the 5% level, p<0.05
- *significant at the 10% level, p<0.1
| Matching algorithms | Treated | Controls | Difference | Standard error | T – stat |
|---|---|---|---|---|---|
| Kernel | 0.5958 | 0.1958 | 0.400** | 0.1610 | 2.48 |
| Nearest neighbor (2) | 0.6262 | 0.3326 | 0.293 | 0.21944 | 1.34 |
| Nearest neighbor (3) | 0.6262 | 0.2490 | 0.377* | 0.18753 | 2.01 |
- **significant at the 5% level, p<0.05
- *significant at the 10% level, p<0.1
Table 4: Results of Mahalanobis distance estimation – Average Treatment Effects on Treated
Note: this table was modified for accessibility reasons.
| Matching algorithms | Coefficient | Standard error | Z | P>|z| |
|---|---|---|---|---|
| Nearest neighbor (3) | 0.370997*** | 0.0138 | 26.78 | 0.000 |
- ***significant at the 1% level, p<0.01
| Matching algorithms | Coefficient | Standard error | Z | P>|z| |
|---|---|---|---|---|
| Nearest neighbor (3) | 0.468140*** | 0.0191 | 24.45 | 0.000 |
- ***significant at the 1% level, p<0.01
| Matching algorithms | Coefficient | Standard error | Z | P>|z| |
|---|---|---|---|---|
| Nearest neighbor (3) | 0.42341*** | 0.2132 | 19.86 | 0.000 |
- ***significant at the 1% level, p<0.01
| Matching algorithms | Coefficient | Standard error | Z | P>|z| |
|---|---|---|---|---|
| Nearest neighbor (3) | 0.3768*** | 0.0206 | 18.21 | 0.000 |
- ***significant at the 1% level, p<0.01
| Matching algorithms | Coefficient | Standard error | Z | P>|z| |
|---|---|---|---|---|
| Nearest neighbor (3) | 0.3646*** | 0.0214 | 17.04 | 0.000 |
- ***significant at the 1% level, p<0.01
| Matching algorithms | Coefficient | Standard error | Z | P>|z| |
|---|---|---|---|---|
| Nearest neighbor (3) | 0.2707*** | 0.0214 | 12.64 | 0.000 |
- ***significant at the 1% level, p<0.01
Appendix G: Factors associated with the likelihood of completing a PSE degree within 5 years
Note: this table was modified for accessibility reasons.
| Ever been a CESP beneficiary | Predicted probability | (1) Marginal effect | (2) Standard error | (3) T statistic |
|---|---|---|---|---|
| 0=No | 0.6564437*** | n/a | n/a | n/a |
| 1=Yes | 0.7267442*** | 0.0703*** | -0.000711 | 98.82 |
- ***significant at the 1% level, p<0.01
Appendix H: Parental aspirations for children to reach PSE – regression results
| Parental education by categories (reference category: High school or less) | Marginal effects | Standard error |
|---|---|---|
| Trades certificate or diploma | 0.0260904 | 0.0241153 |
| Community college, CEGEP, etc. | 0.0862946*** | 0.0177246 |
| University | 0.0915752*** | 0.0171569 |
- ***significant at the 1% level, p<0.01
Appendix I: Certain groups are more likely to face some barriers to accessing PSE
Males have a lower likelihood of accessing PSE than females
Various studies attribute this gap to differences between women and men in academic performance and student aspirations.Footnote 101
Women tend to have better grades in high school and are therefore more likely to be accepted into post-secondary programs.
Women tend to have higher educational aspirations, fewer behavioral problems, and be more engaged in school than men.
Cultural factors
Angelo (2012) and Finnie (2015) used the term “culture of post-secondary education” to highlight a set of factors related to parents’ backgrounds and students’ environment that influence the decision to access PSE.
These factors include:
- the overall parental pressure to attend PSE
- student’s peer influence
- student’s own willingness to attend PSE
Some key informants (6 of 24) who discussed non-financial barriers to PSE mentioned that cultural factors could constitute barriers for some groups.Footnote 102 For example, a majority of these informants (4 of 6) noted that some ethno-cultural groups value and encourage PSE while some do not.Footnote 103
Among informants who agreed that barriers differ for certain groups, a few (3 of 21) suggested that people from low-income backgrounds or remote areas, including Indigenous people, might not feel that they belong in post-secondary institutions.Footnote 104
Appendix J: Other regression findings
Receipt of CESG benefits does not appear to have a demonstrable impact on labour market outcomes such as individual income (exploratory results)
Several matching algorithms that have been used to measure the impact of Additional CESG on the employment income of beneficiaries have all revealed statistically insignificant results.Footnote 105
Some potential methodological limitations including differences between the treatment and control groups and the matching models that were used may have had an impact on the analysis.Footnote 106
- Differences between the treatment and control groups: since students from the control group did not have an RESP opened for them, they did not have access to benefits related to tax-free savings growthFootnote 107
- Covariates: selection and combination of the covariates can affect matching quality and have a significant impact on the measurement of the estimated treatment effect
- Data availability: no labour market outcomes data is available after 2016 from the linked CESP-LAD-T1FF dataset for the selected cohort born in 1993 or 1994
These labour market outcomes should be considered preliminary given that some of the students in the database were still quite young or had not yet graduated.
Table 7: Impact on income – regression results, Average Treatment on Treated
Note: this table was modified for accessibility reasons.
| Matching algorithms | Treated | Controls | Difference | Standard error | T – stat |
|---|---|---|---|---|---|
| Kernel | 7400 | 11200 | -3800 | 5487.798 | -0.69 |
| Nearest neighbor (2) | 8400 | 9500 | -1100 | 3527.61 | -0.32 |
| Nearest neighbor (3) | 12300 | 15800 | -3500 | 5090.98 | -0.69 |
| Matching algorithms | Treated | Controls | Difference | Standard error | T – stat |
|---|---|---|---|---|---|
| Kernel | 11800 | 15200 | 3400 | 5519.65 | -0.61 |
| Nearest neighbor (2) | 12300 | 9800 | 2500 | 6352.58 | 0.40 |
| Nearest neighbor (3) | 15800 | 16700 | -1000 | 5707.28 | -0.17 |
| Matching algorithms | Treated | Controls | Difference | Standard error | T – stat |
|---|---|---|---|---|---|
| Kernel | 15400 | 16400 | -1000 | 6609.221 | -0.16 |
| Nearest neighbor (2) | 15800 | 10300 | 5500 | 6586.20 | 0.83 |
| Nearest neighbor (3) | 19200 | 19100 | 120 | 7876.80 | 0.02 |
| Matching algorithms | Treated | Controls | Difference | Standard error | T – stat |
|---|---|---|---|---|---|
| Kernel | 18600 | 19400 | -900 | 7197.73 | -0.12 |
| Nearest neighbor (2) | 19200 | 13500 | 5700 | 9640.611 | 0.59 |
| Nearest neighbor (3) | n/a | n/a | n/a | n/a | n/a |
| Matching algorithms | Treated | Controls | Difference | Standard error | T – stat |
|---|---|---|---|---|---|
| Kernel | 22000 | 20800 | 1200 | 7939.47 | 0.15 |
| Nearest neighbor (2) | 22800 | 13800 | 9000 | 8637.914 | 1.04 |
| Nearest neighbor (3) | 22800 | 20500 | 2300 | 7427.558 | 0.32 |
| Matching algorithms | Treated | Controls | Difference | Standard error | T – stat |
|---|---|---|---|---|---|
| Kernel | 25700 | 28500 | -2800 | 8146.43 | -0.34 |
| Nearest neighbor (2) | 26600 | 28700 | -2100 | 9653.65 | -0.22 |
| Nearest neighbor (3) | 26600 | 31300 | -4800 | 8639.23 | -0.55 |