
Evaluation of the Canada – New Brunswick Labour Market Development Agreement
From: Employment and Social Development Canada
Alternate formats

Evaluation of the Canada-New Brunswick Labour Market Development Synthesis Report [PDF - 1.15 MB]
Large print, braille, MP3 (audio), e-text and DAISY formats are available on demand by ordering online or calling 1 800 O-Canada (1-800-622-6232). If you use a teletypewriter (TTY), call 1-800-926-9105.
Executive summary
Introduction
Employment and Social Development Canada (ESDC) worked jointly with New Brunswick and 11 other Provinces and Territories (P/Ts) to undertake the 2012 to 2017 second cycle of the Labour Market Development Agreement (LMDA) evaluation. The first cycle of the LMDA evaluation was carried out between 1998 and 2012 and involved conducting bilateral formative and summative evaluations in all P/Ts. Under the second cycle, the evaluation work consisted of conducting two to three studies per year on the Employment Benefits and Support Measures (EBSMs) similar programming delivered under these agreements. The studies generated evaluation evidence on the effectiveness, efficiency and design/delivery of EBSMs for Canada, for New Brunswick and for 11 other P/Ts that opted for a joint evaluation process with Canada.
Under LMDAs, Canada transfers $2.14B in Employment Insurance (EI) Part II funds to P/Ts for the design and delivery of programs and services to help unemployed individuals, mainly eligible under EI, to find and maintain employment.
Programs and services delivered by New Brunswick have to correspond to the EBSM categories defined under the Employment Insurance Act. The following is a short description of the four programs and services examined in the evaluation:
- Training and Skills Development (including Apprenticeships) helps participants obtain employment skills by giving them financial assistance in order to attend classroom training.
- Targeted Wage Subsidies (Employer Wage Subsidy) help participants obtain on-the-job work experience by providing employers with a wage subsidy.
- Self-Employment provides financial assistance and business planning advice to participants to help them start their own business.
- Employment Assistance Services such as counselling, job search skills, job placement services, provision of labour market information and case management.
Four additional programs and services are available under the LMDA and they are: Job Creation Partnerships, Labour Market Partnerships, Research and Innovation and Targeted Earnings Supplements. They were not evaluated as part of this evaluation. The Job Creation Partnerships and Targeted Earnings Supplements programs were not used in New Brunswick while Labour Market Partnerships and Research and Innovation will be evaluated at a later date.
Table 1 provides an overview of the share of funding allocated to the five EBSMs examined under the second cycle for LMDA evaluation and the average costs per participant.
| Program and service | Share of funding 2014 to 2015 | Average cost per participant 2002 to 2005 |
|---|---|---|
| Training and Skills Development, including Apprenticeship | 61% | $9,237 |
| Employment Assistance Services | 13% | $658 |
| Employer Wage Subsidy | 11% | $6,316 |
| Self-Employment Benefit | 6% | $11,036 |
| Total | 91%* | – |
* Other programs and services account for 9% of LMDA investments.
Sources: EI Monitoring and Assessment Reports 2002-2003 to 2014-2015.
This report presents a summary of the findings from nine studies produced on the New Brunswick LMDA interventions. Results are presented for active and former EI claimants, and for long-tenured workersFootnote 1, youth (under 30 years old) and older workers (55 years old and over) when the number of participants was sufficient to conduct quantitative analyses. Active EI claimants were receiving EI benefits at the time of their EBSM participation. Former EI claimants received EI up to three years before starting their EBSM participation.
Key findings
Effectiveness and efficiency of EBSMs
Incremental impacts and cost-benefit analyses addressed EBSM effectiveness and efficiency. Overall, incremental impacts demonstrate that LMDA programs and services are improving the labour market attachment of active and former EI claimant Participants, including youth and older workers. As well, social benefits of participation exceeded the cost of investments for most interventions over time. Finally, providing Employment Assistance Services interventions earlier during an EI claim (first four weeks) produced larger impacts on earnings and employment and facilitated an earlier return to work. This demonstrated the importance of targeting early participation of EI active claimants.
Figure i presents the incremental impacts on the incidence of employment for active and former claimants by type of program. The estimates can be interpreted as a change in the probability of being employed following participation. For example, participation in Training and Skills Development increases the probability of being employed by 4.7 percentage points for active EI claimants relative to unemployed non-participants.
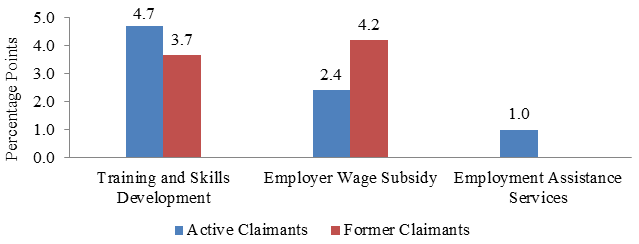
Text description of Figure i
| Training and Skills Development | Employer Wage Subsidy | Employment Assistance Services | ||
|---|---|---|---|---|
| Percentage points | Active claimants | 4.7 | 2.4 | 1.0 |
| Former claimants | 3.7 | 4.2 | 0 |
Figure ii presents the cumulative increase in employment earnings for active and former claimants over the 5 years post-participation. It is noted that Employment Assistance Services are relatively modest activities and, by themselves, are not expected to lead to substantial effects on labour market outcomes. In other words, these services aim to support the return to work of unemployed participants and not necessarily to secure a better paying job than pre-participation. However, as demonstrated later in the report, providing Employment Assistance Services earlier during the EI claim (first 4 weeks) produced larger impacts on earnings and employment and facilitated earlier returns to work.

Text description of Figure ii
| Training and Skills Development | Employer Wage Subsidy | Employment Assistance Services | ||
|---|---|---|---|---|
| Gains in Earnings | Active Claimants | $17,903 | $5,408 | $6,182 |
| Former Claimants | $12,612 | $7,188 | $0 |
Table 2 presents the number of years required for the social benefits to exceed the program costs. Social benefits to participation exceeded investment costs in a period ranging between the 2nd year of program participation to just over 6 years after participation.
| Training and Skills Development | Employer Wage Subsidy | Employment Assistance Services | |
|---|---|---|---|
| Active claimants | 5.1 | 5.1 | 3.4 |
| Former claimants | 6.3 | 2nd participation year | n/a |
Main challenges about EBSM design and delivery
Key informant interviews with service providers and program managers as well as reviewed documents and questionnaires completed by New Brunswick representatives also generated a few challenges about program design and delivery:
Training and Skills Development
- The Training and Skills Development application process aims to ensure that prospective participants are choosing a trade that will meet labour market demand.
- New Brunswick plans their training investment to target labour market trends which may contribute to Training and Skills Development effectiveness.
- According to the interviewed service providers and managers, the main challenges related to Training and Skills Development design and delivery included:
- The eligibility criteria exclude some individuals who could benefit from training and upskilling.
- The financial assistance for tuition is too limited in some situations.
- Barriers to employment or to accessing and completing training under Training and Skills Development included:
- Financial hardship;
- Access to childcare and transportation;
- Learning, mental or physical disabilities;
- Language barriers;
- Low education, literacy levels and lack of work experience;
- Having to complete high school upgrading to take training; and,
- Personal issues such as a criminal record.
Training and Skills Development for Apprentices
- Existing literature showed that there is a fairly high non-completion rate among apprentices in Canada (40 to 50%)Footnote 2. Furthermore, subject matter literature revealed that despite the growth in apprenticeship registrations in Canada, there has not been a corresponding increase in completion ratesFootnote 3. While it is not possible with available data to generate a reliable estimation of the completion rate of Training and Skills Development-Apprentices participants in New Brunswick, key informants involved in apprenticeship delivery confirmed the stagnation in completion rates.
- According to key informants, apprenticeship drop-out is due to factors such as lack of incentive to complete the training; a learning disability; lack of essential skills; and living a long distance away from the location of the training.
- Other challenges noted by key informants regarding the design and delivery of Skills Development-Apprentices included a lack of awareness about how the apprenticeship system works; lack of electronic application and funding supports system; delays in reimbursing the tuition rebate; and the level of funding is perceived to be insufficient, particularly the level of financial support for childcare and transportation.
Employer Wage Subsidy
- While evaluation results have demonstrated the effectiveness of Employer Wage Subsidy, its use has been falling in recent years. According to EI Monitoring and Assessment reports, the number of new interventions decreased from 3,109 in 2004 to 2005 to 1,632 in 2014 to 2015. According to key informants, the reasons for the decline included:
- Changes to the eligibility criteria reduced the number of participants who can benefit from the program.
- Significant outmigration of potential workers to Western Canada.
- Local economic conditions as some regions of New Brunswick have a high unemployment rate and the number of employers is decreasing.
Employment Assistance Services
- Key informants confirmed the need for labour market information to support the program. However, they pointed out that labour market information was often out-of-date, inconsistent, and not specific or timely.
- Challenges with the design and delivery of Employment Assistance Services included:
- Access to services due to a lack of transportation and a lack of telephones.
- Service delivery has a substantial administrative burden.
- Lack of awareness about services.
Recommendations
A total of six recommendations emerge from the evaluation findings. They are as follows:
The study on the timing of Employment Assistance Services participation showed that receiving assistance early after starting an employment insurance claim can lead to better labour market impacts. However, key informants reported a lack of awareness about the program.
Recommendation 1: Consideration should be given to providing New Brunswick with timely access to data on new EI recipients to support targeting and increase awareness.
Key informants reported that low education, learning disabilities and literacy issues may be barriers to accessing and completing training.
Recommendation 2: Consideration should be given to removing barriers to accessing and completing training such as literacy/essential skills training and learning disability assessments. These measures would help individuals with multiple barriers prepare for vocational training and to integrate into the labour market. These measures should be reported separately from other Skills Development interventions given their unique objectives.
Incremental impacts showed improvements in participant’s earnings and employment in the Employer Wage Subsidy program although its use has been declining in recent years. According to key informants, the decline may be related to the changes in the program’s eligibility criteria, outmigration of workers, lack of vacant positions and a decrease in potential employers.
Recommendation 3: New Brunswick should explore ways of removing barriers to employer participation in the Employer Wage Subsidy program.
Key informants interviewed in the evaluation confirmed the necessity of having labour market information to support the delivery of Training and Skills Development and Employment Assistance Services. They, however, pointed out that labour market information was often out-of-date, inconsistent, and not specific or timely.
Recommendation 4: Consideration should be given to strengthening the production and availability of local labour market information to support program delivery.
The evaluation was not able to produce a conclusive assessment of the Self-Employment Benefit effectiveness and efficiency since the data used to assess impacts on earnings may not be the best source of information available to reflect the financial wellbeing of the participants. As well, it is not clear whether the participant’s success in improving their labour market attachment through self-employment is more closely associated with their business idea and their entrepreneurship skills than the assistance provided under the Self-Employment Benefit.
Recommendation 5: Consideration should be given to examine in more detail the design and delivery of the Self-Employment Benefit and whether the performance indicators for this program are appropriate.
Overall, the LMDA evaluation was able to produce a sound assessment of EBSM effectiveness and efficiency because the team had access to rich data on EI claimants, EBSM participation data and Canada Revenue Agency taxation files. However, some data gaps limited the evaluation’s ability to assess how EBSMs operate.
Recommendation 6: Improvements in data collection is recommended to address key program and policy questions of interest to the federal and provincial/territorial governments. Specifically:
Collect data on whether participants are members of designated groups including Indigenous peoples, persons with disabilities and recent immigrants.
Collect data on the type of training funded under Training and Skills Development and the type of assistance provided under Employment Assistance Services. New Brunswick, ESDC and other P/Ts should work together to define common categories for both EBSMs.
Collect detailed data on the cost of interventions.
Management response
The Department of Post-Secondary Education, Training and Labour accepts the evaluation recommendations and has responded to the following actions in relation to the conclusions of the evaluation:
Recommendation 1: Consideration should be given to providing New Brunswick with timely access to data on new EI recipients to support targeting and increase awareness.
Response: New Brunswick is open to targeting and referral of new EI recipients based on a recent signing of an information sharing agreement which occurred on February 21, 2017. We are currently working toward the creation of an implementation plan.
Recommendation 2: Consideration should be given to removing barriers to accessing and completing training such as literacy/essential skills training and learning disability assessments. These measures would help individuals with multiple barriers prepare for vocational training and integrate into the labour market. These measures should be reported separately from other Skills Development interventions given their unique objectives.
Response: New Brunswick provides a variety of program and services designed to help adults acquire literacy and essential skills training. We are currently involved in discussions with the Forum of Labour Market Ministers as part of ongoing work for the Performance Measurement Strategy for the new Labour Market Transfer Agreements. If it is determined that these interventions are to be reported separately from other Skills Development interventions, New Brunswick will explore options for implementation.
Recommendation 3: New Brunswick should explore ways of removing barriers to employer participation in the Employer Wage Subsidy program.
Response: New Brunswick will commit to work with employers to reduce barriers to employer participation in our Employer Wage Subsidy programs.
Recommendation 4: Consideration should be given to strengthening the production and availability of local Labour Market Information to support program delivery.
Response: New Brunswick is working closely with the Forum of Labour Market Ministers on the creation of a Labour Market Information Council. At the local level (regional offices across the province), Employment and Continuous Learning Services is exploring a process to gather and interpret local labour market knowledge to inform New Brunswick’s labour force needs.
Recommendation 5: Consideration should be given to examine in more detail the design and delivery of the Self-Employment Benefit and whether the performance indicators for this program are appropriate.
Response: New Brunswick would agree to fully participate in discussions on the design of performance indicators.
Recommendation 6: Improvements in data collection is recommended to address key program and policy questions of interest to the federal and provincial/territorial governments. Specifically:
Collect data on whether participants are members of designated groups including Indigenous peoples, persons with disabilities and recent immigrants.
Response: Currently, the collection of designated group data is done through self-identification. This relates to a broader legal and privacy issue both at the provincial level. We are currently involved in discussions with the Forum of Labour Market Ministers as part of ongoing work for the Performance Measurement Strategy for the new Labour Market Transfer Agreements. If it is determined that this reporting is mandatory New Brunswick will explore solutions to the privacy and legal concerns and explore options for implementation.
Collect data on the type of training funded under Training and Skills Development and the type of assistance provided under Employment Assistance Services. New Brunswick, ESDC and other provinces and territories should work together to define common categories for both EBSMs.
Response: New Brunswick would collaborate on defining common categories for EBSMs.
Collect detailed data on the cost of EBSM interventions.
Response: Currently, New Brunswick is not in a position to provide detailed data on the cost of EBSM interventions. We are currently involved in discussions with the Forum of Labour Market Ministers as part of ongoing work for the Performance Measurement Strategy for the new Labour Market Transfer Agreements. If it is determined that a more detailed cost breakdown is required we will explore options to implement these changes on annual audited financial statements.
1. Introduction
Employment and Social Development Canada (ESDC) worked jointly with New Brunswick and 11 provinces and territories to undertake the 2012 to 2017 second cycle of the Labour Market Development Agreement (LMDA) evaluations. The first cycle of LMDA evaluation was carried out between 1998 and 2012 and involved the conduct of bilateral formative and summative evaluations in all provinces and territories. Under the second cycle, the evaluation work consisted of conducting two to three studies per year on the Employment Benefits and Support Measures (EBSMs) similar programming delivered under these agreements. The studies generated evaluation evidence on the effectiveness, efficiency and design/delivery of EBSMs for Canada, New Brunswick and for the 11 provinces/territories that opted for a joint evaluation process with the Government of Canada.
This report presents a summary of the findings from studies conducted for New Brunswick. The report is organised as follows:
- Introduction with an overview of the studies summarized in this report including their scope, methodology, and contextual information on the LMDAs.
- Findings section with a discussion around the rationale for investing in labour market programming.
- Conclusions and lessons learned.
- Recommendations that emerge from the evaluation findings.
1.1 Labour Market Development Agreement background
LMDAs are bilateral agreements between Canada and each province/territory and were established under Part II of the 1996 Employment Insurance Act. As part of these agreements, Canada transfers $2.14B annually in EI Part II funding to the provinces and territories to design and deliver programs and services to assist individuals prepare for, obtain and maintain employment. Specifically, New Brunswick receives approximately $90M in EBSM funding each year.
The Canada-New Brunswick LMDA was signed on December 13, 1996. The agreement transferred responsibility for the design and delivery of the program and services classified under two categories: 1) Employment Benefits and 2) Support Measures to New Brunswick.
Employment Benefits
Employment Benefits funded under the LMDAs are offered to unemployed individuals who 1) are actively on EI (active claimants); 2) ended their benefit period within three years before participating (former claimants); or 3) established a claim for maternity or parental benefits within the past five years and are returning to the labour force for the first time (former claimants)Footnote 4. Employment benefits include the following categories:
- Skills Development (Training and Skills Development, including apprenticeship) helps participants obtain employment skills by giving them financial assistance to enable them to select, arrange and pay for classroom training.
- Targeted Wage Subsidies (Employer Wage Subsidy) help participants obtain on-the-job work experience by providing employers with financial assistance to help with the wages of participants.
- Self-Employment (Self-Employment Benefit) provides financial assistance and business planning advice to EI-eligible participants to help them start their own business. This financial assistance is intended to cover personal living expenses and other expenses during the initial stages of the business.
- Job Creation Partnerships provides participants with opportunities to gain work experience that will lead to ongoing employment. Employment opportunities are provided by projects that contribute to developing the community and the local economy. The program is not offered in New Brunswick.
- Targeted Earnings Supplements encourage unemployed persons to accept employment by offering them financial incentives. This program was not covered by the evaluation.
Support measures
Support Measures are available to all unemployed individuals including those not eligible to receive EI and include:
- Employment Assistance Services such as individual counselling, action planning, help with job search skills, job-finding clubs, job placement services, the provision of Labour Market Information, case management and follow-up.
- Labour Market Partnerships provide funding to help employers, employee and employer associations, and communities improve their capacity to deal with human resource requirements and implement labour force adjustments. These partnerships involve developing plans and strategies, and implementing labour force adjustment measures. This support measure was not covered by the evaluation.
- Research and Innovation supports activities that identify better ways of helping people prepare for or keep employment and be productive participants in the labour force. Funds are provided to eligible recipients to enable them to carry out demonstration projects and research for this purpose. This support measure was not covered by the evaluation.
Table 3 provides an overview of the share of funding allocated to the five programs and services examined under the second cycle for LMDA evaluation and the average cost per participant. It is noted that the average cost per participant was calculated based on the 2002to 2005 data from the EI Monitoring and Assessment Reports. The 2002 to 2005 period corresponds to the cohort of participants selected for incremental impacts and cost-benefit analysis in the LMDA evaluation.
| Program and service | Share of funding 2014 to 2015 | Average cost per participant 2002 to 2005 |
|---|---|---|
| Training and Skills Development | 61% | $9,237 |
| Employment Assistance Services | 13% | $658 |
| Employer Wage Subsidy | 11% | $6,316 |
| Self-Employment Benefit | 6% | $11,036 |
| Total | 91%* | – |
Sources: EI Monitoring and Assessment Reports 2002-2003 to 2014-2015.
*Other programs and services account for 9% of LMDA investments.
1.2 Methodology
This section presents key aspects of the quantitative analyses carried out as part of the LMDA studies, while a more detailed description of the methodology is provided in Appendix A.
All quantitative analyses were based on administrative data from the EI Part I (EI claim data) and Part II (EBSM participation data) linked to the T1 and T4 taxation files from the Canada Revenue Agency. Incremental impact analyses and the cost-benefit analyses were based on up to 100% of participants in the reference period selected.
Incremental impacts analysis
Five studies assessed program effectiveness by estimating incremental impacts from EBSM participation on participants’ labour market experience (for example, earnings from employment/self-employment, incidence of employment, use of EI or Social Assistance and dependence on income support) after participation. The role of the incremental impact analysis is to isolate the effects of participation from other factors such as the economic cycle. In order to achieve this, the incremental impact analysis compared the labour market experience of participants before and after their participation, with that of non-participants before and after the period that corresponds to the EBSM participation (see the Example of Incremental Impact Calculation in Figure 1).
The matching of participants and comparison group members used up to 75 socio-demographic and labour market variables observed over five years before participation. Two different comparison groups were used to measure impacts for active and former EI claimants. For active claimants, the incremental impacts were measured relative to a comparison group of active claimants who were eligible to participate in EBSMs but did not during the reference period.
Former claimants can be underemployed and unable to requalify for EI, out of the labour force for various reasons or on social assistance. Based on previous evaluation methodologies, on expert advice and given the difficulty in generating a suitable comparison for former claimants using administrative data alone, the comparison group for former claimants was created using individuals who only participated in Employment Assistance Services during the reference period. This is a conservative approach given the fact that participation in Employment Assistance Services can lead to limited effects on labour market outcomes. In other words, the experience of former claimants who received employment benefits (that is, Training and Skills Development, Employer Wage Subsidy and Self-Employment Benefit) was compared to the experience of former claimants who received a low intensity employment service (that is Employment Assistance Services only). Due to this difference in measurement, incremental impacts estimated for active claimants should not be directly compared to former claimants.Footnote 5
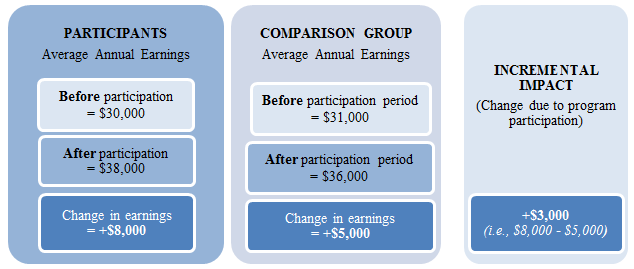
Text description of Figure 1
| Participants | |||
|---|---|---|---|
| Average annual earnings | Before participation | After participation | Change in earnings |
| $30,000 | $38,000 | $8,000 | |
| Comparison group | |||
| Average annual earnings | Before participation | After participation | Change in earnings |
| $31,000 | $36,000 | $5,000 | |
Incremental impact (Change due to program participation): + $3,000 (in other words, $8,000 - $5,000)
Factors accounted for in the cost-benefit analysis
Program efficiency was assessed through a cost-benefit analysis which compared the cost of participating in the program for the participants and the cost of delivering the program for the government to the benefits generated by the program. Overall, this analysis provided insights on the extent to which the program is efficient for society (that is, for both the participants and the government). The costs and benefits accounted for in the calculations were as follows (see detailed definitions in Appendix A):
- Program costs include program and administration costs paid by the government.
- Marginal social costs of public funds represent the loss incurred by society when raising additional revenues such as taxes to fund government programs.
- Employment earnings consist of incremental impacts on participants’ earnings during and after participation. The calculation accounts for the participant’s forgone earnings during participation (that is opportunity cost). Employment earnings were also increased by 15% for fringe benefits such as employer-paid health, life insurance and pension contributions.
Strengths and limitations of the studies
One of the key strengths from the studies is that all quantitative analyses were based on administrative data rather than survey responses. Compared to survey data, administrative data are not subject to recall errors or response bias.
The propensity score models used to match participants and non-participants for the incremental impact analyses are judged to be robust in part because they were based on five years of pre-participation data and on a vast array of variables including socio-demographic characteristics, location, skills level related to last occupation and indicators of labour market attachment. Sensitivity analysis and the use of alternative estimation methods have increased confidence in the incremental impact estimates. However, one limitation with the propensity score matching techniques is that no one can be fully sure the impacts were not influenced by factors not captured in the data.
The cost-benefit analysis accounted for all quantifiable costs and benefits directly attributable to the EBSMs and could be estimated with the available administrative data. The analysis did not account for non-quantifiable benefits such as improvements in participant’s wellbeing or for the multiplier effect of increased spending on the economy.
In some studies that relied on the use of qualitative data collection methods, the number of interviewed key informants was relatively small. Responses provided by key informants reflect their own experience in their own region and may not be fully representative of the entire province.
1.3 Overview of the studies summarized in this report
Findings presented in this report were drawn from nine separate studies. These studies examined issues related to EBSM effectiveness, efficiency, design/delivery and used a mix of qualitative and quantitative methods. Each study examined evaluation issues in relation to active and former EI claimants.
Table G1 in Appendix G presents an overview of these studies, including the type of evidence generated, the methods used, the reference period and the length of the post-program period over which program effects were observed.
2. Evaluation findings
2.1 Rationale and labour market context
LMDA investments align with Provincial Government priorities
Active labour market programs are fairly similar across the Organization for Economic Co-operation and Development countries and consist of skills training in a classroom setting, work experience with employers (often subsidized) or in the public/non-profit sector, return-to-employment assistance and self-employment assistance. In New Brunswick, the Department of Post-Secondary Education, Training and Labour administers a range of active labour market programming targeted at various groups of individuals. Programs and services offered to active and former EI claimants are primarily funded under the LMDA.
The Department of Post-Secondary Education, Training and Labour’s 2015 to 2018 strategic planFootnote 6 outlines key result areas and goals linking with LMDA investments in order to meet New Brunswick’s labour market needs. These include:
- Investing in youth population in order to remain and work in New Brunswick.
- Improving literacy and essential skills to contribute to greater productivity.
- Accelerating training and educational opportunities to ensure consistent link between training and labour force needs.
- Enhance experiential learning opportunities to facilitate the integration into the labour force.
- Create opportunities to all New Brunswickers to enter and remain in the labour market.
- Connecting people to jobs and jobs to people to make it easier to know where to find jobs to keep people in New Brunswick.
- Investing in employment programs and services to respond to current and future labour market opportunities.
Overall, incremental impacts reported in the LMDA evaluation and discussed in this report demonstrated that LMDA funded programs and services delivered in New Brunswick are generally helping participants improve their labour market experience after participation and contribute to meeting the Department of Post-Secondary Education, Training and Labour’s key result areas and goals.
2.2 Training and Skills Development
2.2.1 Program description
Based on a document review and 4 key informant interviews completed in the summer of 2015
The objective of Training and Skills Development is to help individuals determine the shortest training path to obtain the necessary skills to either successfully transition into today’s labour market or obtain/maintain long-term sustainable full-time employment.
The program provides financial assistance to cover the following expenses:
- Living allowance
- Exam/certification/licensing allowance
- Tuition
- Fixed rate allowance
- Books and other materials
- Student fees
- Special equipment, clothing and tools
- Childcare and dependent care
- Tutoring
- Transportation
Training supported under the program includes academic upgrading preparation (general educational development or adult high school diploma testing) as well as workplace essential skills and regular training (up to 2 years or 3 years for co-op programs at a recognized post-secondary institution). Training and Skills Development funding may support the completion of a university degree for a maximum of two years if the person had already started a university program.
Table 4, below, shows the proportion of expenditures and interventions by type of supported training. Most of the interventions in New Brunswick provide assistance to individuals pursuing vocational/occupational training (89% of investments and 74% of total interventions). Eleven percent of expenditures are provided for adult basic education/essential skills training and account for 26% of total interventions.
| Types of training | Expenditures | Interventions |
|---|---|---|
| Proportion | Proportion | |
| Adult Basic Education/Essential Skills | 11% | 26% |
| Vocational/Occupational Training, including college or university | 89% | 74% |
| Total | 100% | 100% |
Source: Post-Secondary Education, Training and LabourL
In 2013 and 2014, Training and Skills Development incorporated changes including increases in funding for travel, childcare, income replacement, transportation, and a top up for active EI claimants. The eligibility criteria were reduced from 3 years to 2 years out of the public school system for all participants and individuals with a second degree/diploma approved as an exception by a regional director no longer sees the cost of their previous Training and Skills Development funding deducted from their new funding amount. A new academic upgrading component 5-6 (Level 1, step 3) was added and the minimum age requirement for academic upgrading participants was lowered from 21 to 19 years of age.
According to the questionnaire completed by New Brunswick representatives, the preferred training delivery method is client-specific and is determined though the employment counselling process. The delivery method may be a co-op program, classroom, distance education, etc., as long as the program is delivered by an eligible institution.
2.2.2 Program delivery
Based on a document review and 4 key informant interviews completed in the summer of 2015
The application process typically starts by referring individuals to an information session. Employment counsellors also meet with the individual to conduct a needs determination assessment in order to establish an Employment Action Plan and determine what type of assistance is required. If Training and Skills Development is identified as the required intervention in the Employment Action Plan, the individual is assessed to determine if he/she meets the criteria established in the program guidelines. The individual is then required to conduct labour market research to confirm that he/she is making the right training choice.
To be eligible for training, applicants must be out of the school system for the last 2 years; be 19 years old and over; not be job ready (that is do not have the capacity to get a job in the current labour market); be unemployed, under-employed, threatened by lay off, or seasonally employedFootnote 7; not have received overpayments from the program; and be motivated to return to school.
The length of the application process depends on the individual and may range from few meetings spread over a few weeks or a few months.
All participants are monitored during training however the means and frequency of monitoring may vary by region. Counsellors may also contact the participants on an as-needed basis. Follow up with the participant occurs after training to assist them with further services that may be required. The follow-up may occur about every 4 months until the individual is employed or no longer wants services.
2.2.3 Targeting to Labour Market demand
Based on a document review and 4 key informant interviews completed in the summer of 2015
Overall, Training and Skills Development counsellors steer the prospective participants toward in-demand occupations through counselling and labour market research. As part of the labour market research process, the individual may have to speak to employers or employees from their chosen occupation. As well, the counsellors may recommend the individual attend an observation day at a community college or to speak with a student or professor. The prospective participant may also be directed to use available labour market information from websites or reports.
Table 5 presents the top 5 occupations that program participants were trained for in 2013 to 2014.
| Occupation | Number of participants |
|---|---|
| Registered nursing assistants | 225 |
| Carpenters | 196 |
| Nurse aides and orderlies | 186 |
| Welders | 151 |
| Electricians (Except industrial and power system) | 135 |
Source: Post-Secondary Education, Training and Labour.
2.2.4 Profile of Training and Skills Development participants
As shown in Table B1 in Appendix B, the majority of active claimants who started Training and Skills Development participation between 2002 and 2005 were male (63%) compared to 53% females for the 2006 to 2008 cohort of participants. As well, 56% of participants in both cohorts were between 25 and 44 years old, and they most frequently held occupations requiring secondary or occupational training prior to participation (45% for the 2002 to 2005 cohort and 41% for the 2006 to 2008 cohort). Active claimants who participated in Training and Skills Development in 2002 to 2005 had higher employment earnings in the year before participation ($16,633) compared to those who participated in 2006 to 2008 ($14,849).
Former claimants who started Training and Skills Development participation in the 2002 to 2005 and 2006 to 2008 periods were mainly female (51% and 61% respectively), and most were between 25 to 34 years of age (38% and 42% respectively). Participants most frequently held occupations requiring secondary or occupational training before participation (40% and 42% respectively). The 2002 to 2005 cohort had higher employment earnings in the year before participation ($9,394) compared to the average earnings for the 2006 to 2008 cohort ($8,171).
2.2.5 Incremental impacts
Active claimants
As shown in Table B2 in Appendix B, active claimants who started Training and Skills Development participation between 2002 and 2005 had incremental gains in earnings and incidence of employment in each of the five years after participation. As shown in Figure 2, earnings continuously increased over time with gains ranging between $592 and $5,673 following participation. Similarly, the increases in incidence of employment ranged between 3.3 and 5.4 percentage points. Participants also decreased the use of EI and social assistance during the post-program period and reduced their level of dependence on income support between 1 and 2 percentage points during the first three years following participation.
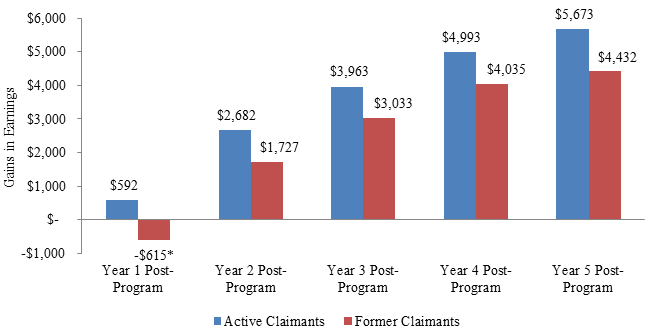
Text description of Figure 2
| Year 1 Post-program | Year 2 Post-program | Year 3 Post-program | Year 4 Post-program | Year 5 Post-program | ||
|---|---|---|---|---|---|---|
| Gains in earnings | Active claimants | $592 | $2,682 | $3,963 | $4,993 | $5,673 |
| Former claimants | -$615* | $1,727 | $3,033 | $4,035 | $4,432 |
* Estimate non-statistically significant at the 95% confidence level.
Active claimants who started Training and Skills Development participation in the 2006 to 2008 period had incremental gains in earnings and incidence of employment over the entire three years post-participation. Participants also decreased their use of social assistance and experienced short-term decreases in EI use and in dependence on government income support.
Overall, active claimants increased their labour market attachment through increases in earnings, incidence of employment and a decrease in the level of dependence on government income support (use of EI and social assistance).
The results for sub-groups of active claimants were as follows:
- Youth (under 30 years old) who started Training and Skills Development participation in the 2002 to 2005 period had incremental gains in earnings and incidence of employment in all years after participation. As well, they decreased the use of EI and social assistance and their dependence on income support over most post-program years.
- Older workers (55 years old and over) who started Training and Skills Development participation in the 2002 to 2005 period had incremental increases in earnings and incidence of employment during the post-program period. Their use of EI increased over most of the post-program period and their dependence on income support increased in the second and fourth years following participation. Impacts on the use of social assistance were non-statistically significant. The increase in EI use reflects the inability of some older workers to retain the employment secured following participation.
- Long-tenured workers who started Training and Skills Development participation between 2007 and 2009 had incremental gains in their incidence of employment in the second and third year post-program. They also increased their earnings in the third year after participation but this increase did not compensate for losses in earnings during the participation years and in the first year after participation. Most incremental impact estimates on the use of EI and social assistance and the level of dependence on income support were non-statistically significant, though social assistance decreased by $63 in the third year after participation and dependence on income support decreased by 2.3 percentage points in the second year following participation.
Former claimants
Former claimants who started Training and Skills Development participation between 2002 and 2005 had incremental gains in earnings in most years after participation. Gains in earnings increased from $1,727 in the second year post-program to $4,432 in the fifth year (see Table B3). As well, participants had increases in incidence of employment ranging between 3.9 and 4.5 percentage points in four of the five post-participation years. Former claimants decreased the use of social assistance by a cumulative of $692 and reduced their dependence on government income support by 2 percentage points in years 4 and 5 post-participation. Incremental impacts on the use of EI were non-statistically significant.
Former claimants who started participation between 2006 and 2008 had a decrease in earnings in the first post-program year but gains in the subsequent years. Participants also increased their incidence of employment in the second and third years after participation. Their use of EI decreased in the first year post-program and their use of social assistance and dependence on income support also decreased over the entire post-program period.
Overall, former claimants increased their labour market attachment through increases in earnings, incidence of employment and a decrease in the use of social assistance.
The results for sub-groups of former claimants were as follows:
- Youth who started participation between 2002 and 2005 experienced an overall increase in earnings, as well as gains in incidence of employment during several post-program years. Youth also decreased their use of social assistance and dependence on government income support during several post-program years. The incremental impacts on the use of EI were non-statistically significant.
- Incremental impacts for long-tenured workers who started participation in the 2007 to 2009 period were non-statistically significant for the entire three years post-participation.
2.2.6 Cost-benefit results
As shown in Table B4 in Appendix B, for active claimants, the benefits of Training and Skills Development for society were $4,965 higher than the costs six years after participation. The benefits matched the costs 5.1 years after participation. For former claimants, the benefits were $1,337 lower than the costs six years after the end of participation. As such, the benefits matched the costs 6.3 years after participation.
2.2.7 Challenges and lessons learned about Training and Skills Development design and delivery
Based on a document review and 4 key informant interviews completed in the summer of 2015
Key informants identified the following challenges in relation to the design and delivery of Training and Skills Development:
- Training and Skills Development eligibility criteria exclude some individuals who would benefit from training and upskilling.
- The financial assistance for tuition is too limited in some situations.
- The following barriers were identified as being barriers to employment as well as to accessing and completing training:
- Financial hardship.
- Access to childcare and transportation.
- Learning, mental or physical disabilities.
- Language barriers.
- Low education and literacy levels and lack of work experience.
- The need to complete high school upgrading as pre-requisite to training.
- Personal issues such as a criminal record.
Key informants also identified a number of lessons learned and best practices:
- Having flexible program criteria while ensuring consistency in applying program guidelines.
- Examining the possibility of providing employment supports (for example access to specialized clothing).
- Providing additional funding for participants pursuing training in high-demand occupations.
- Providing more support (for example, increase funding for tuition) to youth to retain them in their local communities.
- Providing funding for a period of time after the end of the training in order to support the individual while conducting job search.
- Providing diagnostic assessments for those with multiple barriers to employment to address barriers to training and employment and to implement needed accommodations.
2.3 Skills Development-Apprentices
2.3.1 Program description
Based on a document review and 3 key informant interviews completed in the summer of 2015
Skills Development - Apprentices provides funding to EI eligible individuals who are on block release apprenticeship training. The purpose of the program is to assess eligible apprentices and provide interventions and accommodations to those requiring learning supports. Funding is provided to apprentices to cover the following expenses while they are on training including tuition, books, travel costs and tutors. Funding also covers the salary of a learning strategist in each of the four New Brunswick regions.
2.3.2 Program delivery
Based on a document review and 3 key informant interviews completed in the summer of 2015
The program is delivered by regional staff from the apprenticeship office, under the supervision of regional apprenticeship managers. Apprenticeship counsellors meet with eligible apprentices once they are registered for classroom training. The counsellors provide them with information and assist with applying for all available supports.
Counsellors do follow-up with apprentices while they are in training to monitor the financial aspects and their progression along the apprenticeship path. Monitoring can be site visits and/or verifying attendance. The counsellors also ensure that apprentices are employed, working enough hours to progress in their apprenticeship and are ready for training.
2.3.3 Profile of Skills Development - Apprentices participants
The majority of active claimants who started Skills Development - Apprentices participation in 2003 to 2005 and 2013 to 2014 were male (86% and 98% respectively) and were below 35 years of age (81% and 63%). See Table C1 in Appendix C for more details. As well, participants most frequently held occupations requiring college or apprenticeship training before participation (65% and 86% respectively). Active claimants who started participation in 2003 to 2005 had lower employment earnings in the year before participation ($21,429) compared to those who participated in 2013 to 2014 ($30,004).
Seventy percent of former claimants who participated in Skills Development - Apprentices in 2003to 2005 were male, and the majority of participants were below 35 years of age (79%). Most of them (46%) had an occupation requiring college or apprenticeship prior to participation. As well, in the year before participation, the participants had an average of $16,113 in earnings from employment.
2.3.4 Labour Market outcomes
The labour market outcomes were based on individuals who began their participation during the 2003-2005 period. Statistics presented in Tables C2 and C3 in Appendix C focused on 5 years prior and 7 years after the program start year.
Active claimants
As shown in Figure 3, the employment earnings of active claimants increased from $13,631 in the fifth year pre-program to $48,295 in the seventh year after the participation start year. However, their annual average incidence of employment was slightly lower in the seven years after the participation start year (94% to 97%) compared to before participation (95% to 99%). Higher proportions of self-employed participants and lower proportions of participants on social assistance were observed during the post-program period.

Text description of Figure 3
| 5 yrs pre-program | 4 yrs pre-program | 3 yrs pre-program | 2 yrs pre-program | 1 yr pre-program | Program start year | 1 yr post-program | 2 yrs post-program | 3 yrs post-program | 4 yrs post-program | 5 yrs post-program | 6 yrs post-program | 7 yrs post-program | |
|---|---|---|---|---|---|---|---|---|---|---|---|---|---|
| Employment earnings | $13,631 | $15,950 | $17,232 | $19,214 | $23,314 | $20,824 | $24,657 | $31,020 | $37,485 | $43,487 | $46,218 | $48,123 | $48,295 |
Former claimants
As shown in Figure 4, former claimants had steady increases in their employment earnings in all years before participation and the first six years following the participation start year. Over that period, their average annual earnings grew from $10,633 to $40,321 in the sixth year post-program. The average annual proportion of employed participants fluctuated between 88% and 99% in the five years before participation and then between 93% and 99% in the seven years following the participation start year. Participants reported higher levels of self-employment during the post-program period and they had a decrease in the use of social assistance.
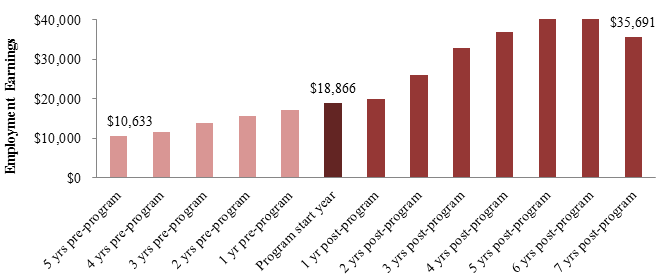
Text description of Figure 4
| 5 yrs pre-program | 4 yrs pre-program | 3 yrs pre-program | 2 yrs pre-program | 1 yr pre-program | Program start year | 1 yr post-program | 2 yrs post-program | 3 yrs post-program | 4 yrs post-program | 5 yrs post-program | 6 yrs post-program | 7 yrs post-program | |
|---|---|---|---|---|---|---|---|---|---|---|---|---|---|
| Employment Earnings | $10,633 | $11,529 | $13,986 | $15,754 | $17,299 | $18,866 | $19,972 | $26,023 | $32,911 | $36,957 | $40,157 | $40,321 | $35,691 |
2.3.5 Challenges and lessons learned about Skills Development - Apprentices design and delivery
Based on a document review and 3 key informant interviews completed in the summer of 2015
Existing literature has shown that there is a fairly high non-completion rate among apprentices in Canada (40-50%)Footnote 8. Furthermore, subject matter literature revealed that despite the growth in apprenticeship registrations in Canada, there has not been a corresponding increase in completionsFootnote 9. While available data do not provide reliable information on completion and non-completion rates for Skills Development - Apprentices participants, key informants interviewed in the evaluation identified reasons that could lead apprentices to drop-out from the apprenticeship process. These include:
- The apprentice realizes that he/she is not suited for the trade selected.
- Change in the economy such as downturn and sudden lack of work.
- Financial constraints.
- Delays in getting EI benefits.
- Employers not willing or able to let their apprentices go on training.
- Lack of incentive to complete the training.
- Learning disability or lack of essential skills.
- Living in a remote location when the apprentice has to leave their family and travel a long distance to the location of the training.
Challenges in relation to the design and delivery of Skills Development - Apprentices or apprenticeship training in general included:
- Lack of awareness about how the apprenticeship system works.
- No electronic systems for the apprenticeship application and for funding supports.
- Delay in reimbursing the tuition rebate.
- Apprentices do not see a big financial gain from attending apprenticeship training.
- Level of funding is perceived to be insufficient; particularly the level of financial support for childcare and transportation.
Lessons learned and good practices related to program design and delivery included:
- Conducting essential skills assessment up front to ensure that the person has the necessary support before starting training.
- Having access to learning strategists whom are able to implement accommodations for apprentices with special needs based on psycho-educational assessments.
- Having apprenticeship training counsellors monitor the progress of apprentices, communicate with them personally, provide them with relevant information and help them access available supports.
2.4 Employer Wage Subsidy
2.4.1 Program description
Based on a document review and 5 key informant interviews completed in the summer of 2015
The intent of Employer Wage Subsidy is to foster employer/employee relationships and enhance the skills of unemployed individuals ultimately resulting in long-term sustainable full-time employment. Program-specific objectives include:
- Stimulate the creation of long-term employment opportunities in the private sector, non-profit organization or First Nations.
- Assist unemployed individuals to secure sustainable employment.
- Stimulate the hiring of identified priority groups in New Brunswick (that is, Indigenous people, social assistance recipients, persons with disabilities, visible minority, newcomers, older workers and recent post-secondary graduates).
Potential participants must meet the following criteria in order to become eligible for Employer Wage Subsidy:
- Be EI eligible and unemployed (that is individual is working 15 hours or less/week).
- Be legally entitled to work in Canada.
- Be residing in New Brunswick or be willing to establish residency in New Brunswick.
- Not be a full-time student.
- Not be an immediate family member of the employer (for example spouse, child, parent, brother, sister), nor can they be an officer or a director of the organization or a member of their immediate family.
Priority for program funding is given to individuals in the following groups, whom may or may not be EI eligible: Indigenous people, social assistance recipients, persons with disabilities, visible minorities, newcomers, older workers and recent post-secondary graduates. Individuals who are not EI eligible would receive funding from other non-LMDA programs.
Employer Wage Subsidy funds full-time permanent positions and seasonal employment in seasonal industries. The level and duration of the subsidy varies depending on the type of participants or employment:
- For EI eligible individuals, the subsidy represents 50% of their hourly wages up to a maximum of $8 per hour. The duration varies between 12 and 24 weeks depending on the job.
- For EI eligible individuals who are seasonally employed, the subsidy consists of 50% of the hourly wage to a maximum of $8 per hour. The job must be at least 14 weeks in duration and the subsidy is granted for a minimum of 7 weeks and up to 10 weeks maximum.
- For unemployed individuals from a priority group, the subsidy represents 70% of the hourly wage, up to a maximum of $8 per hour. The duration ranges from 12 to 24 weeks. For recent post-secondary graduates who obtained their diploma in the past 4 years and are being hired in their field of study, the subsidy is offered over 52 weeks at a rate of $10 per hour provided that the employer pays an hourly wage of at least $14 per hour.
2.4.2 Program delivery
Based on a document review and 5 key informant interviews completed in the summer of 2015
Employer Wage Subsidy is managed and delivered by the regional director and program staff of the Department of Post-Secondary Education, Training and Labour. A central Employer Wage Subsidy program consultant is responsible for coordinating the program on behalf of the regions.
The program can be either employer or participant driven. When the program is employer driven, the employer contacts a regional office to submit an application. Program officers determine the employer’s eligibility and, if eligible, the employer becomes responsible for finding an employee. The qualifications and the skill level of the potential employee are assessed by the employer. The Department of Post-Secondary Education, Training and Labour’s staff develop a contract with the employer once a suitable candidate is found.
When the application process is driven by the participant, the employment counsellor provides a recommendation letter to the case-managed candidate. The individual uses this letter of recommendation to inform potential employers about the subsidy. Program officers may also help the employer identify potential candidates by referring them to case-managed individuals or by informing case-managed individuals of possible employment opportunities.
To be eligible for Employer Wage Subsidy, employers have to use the subsidy to fill a new position. As part of the program application form, employers must provide their payroll history for the last 12 months so program officers can validate the creation of a new position. Employers who do not keep the position after the end of the subsidy would not qualify for the program a second time.
There is no systematic follow-up of participants during the subsidy. However, program officers may meet the participants or conduct a monitoring visit with the employer on an as-needed basis.
The top five occupations most frequently subsidized during fiscal year 2013 to 2014 were: labourers in food, beverage and associated products processing; administrative assistants; nurse aides, orderlies and patient service associates; early childhood educators and assistants; and retail salespersons.
2.4.3 Profile of Employer Wage Subsidy participants
As shown in Table D1 in Appendix D, active claimants who started participation in 2002 to 2005 and 2006 to 2008 were mainly male (57% and 54% respectively). Sixty one percent of those who started participating between 2002 and 2005 were 35 years of age and over compared to 63% of the 2006 to 2008 participants. Thirty-five percent of the 2002 to 2005 participants most frequently held occupations requiring secondary or occupational training prior to program participation. For the 2006 to 2008 cohort, 35% of participants held occupations requiring college or apprenticeship training prior to their participation. Employment earnings in the year before participation were similar between the two cohorts ($14,235 versus $14,895).
Former claimants who started program participation in 2002 to 2005 and 2006 to 2008 were mainly male (55% and 62% respectively). Slightly more than half of participants in these two cohorts were 34 years of age and younger (51% each). Thirty-six percent of the 2002 to 2005 participants most frequently held occupations requiring secondary or occupational training prior to program participation. For the 2006 to 2008 cohort, 36% of participants held occupations requiring college or apprenticeship training prior to participation. Employment earnings in the year before participation were similar between the two cohorts ($11,534 versus $12,192).
2.4.4 Incremental impacts
Detailed incremental impact results for active and former claimants are presented in Tables D2 and D3 in Appendix D.
Active claimants
Active claimants who started Employer Wage Subsidy participation between 2002 and 2005 had incremental increases in earnings after participation ranging from $813 to $1,415 (see Figure 5). Their incidence of employment increased between 2.1 and 2.7 percentage points following participation. Participants reduced the use of EI by a cumulative of $1,120 or 3 weeks following participation. Results for social assistance use and the level of dependence on income support were non-statistically significant.
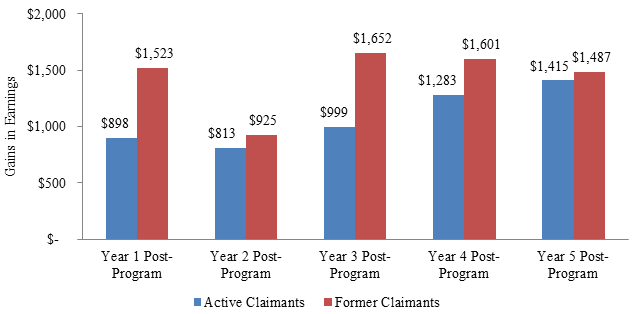
Text description of Figure 5
| Year 1 Post-program | Year 2 Post-program | Year 3 Post-program | Year 4 Post-program | Year 5 Post-program | ||
|---|---|---|---|---|---|---|
| Gains in earnings | Active claimants | $898 | $813 | $999 | $1,283 | $1,415 |
| Former claimants | $1,523 | $925 | $1,652 | $1,601 | $1,487 |
Active claimants who started Employer Wage Subsidy participation between 2006 and 2008 increased their earnings and incidence of employment over most of the post-program years as well as their use of EI after participation. Incremental impacts on the use of social assistance were non-statistically significant. The increase in EI use reflects the inability of some Employer Wage Subsidy participants to maintain the employment secured during or after the end of the subsidy. When interpreting these results, readers should keep in mind that participants collect insurable hours under EI while working in the subsidized job. This may allow them to start claiming EI if they are not able to maintain their subsidized job.
Overall, despite the increase use of EI, active claimants improved their labour market attachment through increases in earnings and incidence for employment.
Results for the various sub-groups showed:
- Youth (under 30 years old) who started Employer Wage Subsidy participation between 2002 and 2005 experienced short-term positive impacts with increased earnings ($1,150), incidence of employment (3.4 percentage points), and decreased dependence on income support (5 percentage points) in year 1 post-program. They also reduced their EI use following participation by a cumulative of $2,224 or 5 weeks. All other incremental impacts were non-statistically significant.
- Long-tenured workers who started Employer Wage Subsidy participation between 2007 and 2009 experienced decreases in their employment earnings by a cumulative of $7,456 over the three years post-program period. They increased the use of EI by a cumulative of $1,486 or 4.1 weeks and decreased their use of social assistance by $117 following participation. Incremental impacts on the incidence of employment were non-statistically significant.
Former claimants
Former claimants who started Employer Wage Subsidy participation in 2002 to 2005 had incremental increases in earnings ranging between $925 and $1,652 annually over the five years post-participation. They also increased their incidence of employment between 3.5 and 4.9 percentage points following participation. They increased the use of EI by a cumulative of $1,430 or 2.8 weeks, while the use of social assistance decreased by a cumulative of $915 post-participation.
Similar to the 2002 to 2005 participants, former claimants who started Employer Wage Subsidy in 2006-2008 had increases in earnings (cumulative of $9,893) and incidence of employment (ranging between 3.6 and 6.5 percentage points) over the three post-program years. Their social assistance use and dependence on income support decreased over the post-program period.
Overall, former claimants increased their use of EI following participation. This indicates the inability of some former claimants to maintain the employment secured in the short-term. It can also be argued that the increase in EI use is an indication of an increase in labour market attachment for this client group since they did experience increases in employment earnings and incidence of employment as well as a decrease in the use of social assistance. As a reminder, former claimants are participants for whom the EI benefit period ended up to three years pre-participation.
Results were similar for other groups of former claimants:
- Youth who started participation in the 2002 to 2005 period increased their earnings (cumulative of $10,112) and incidence of employment (ranging between from 3.3 to 6.6 percentage points) over the five years post-participation. They decreased their use of social assistance (cumulative of $1,128), as well as their dependence on income support during several post-program years. There was a short-term increase in EI use, indicating the inability of some youth to retain the employment secured during the subsidy.
- Long-tenured workers who started their participation between 2007 and 2009 increased their incidence of employment between 5.3 to 8.4 percentage points following participation. They also reduced their use of social assistance by a cumulative of $675 following participation. Incremental impacts on earnings and the use of EI were non-statistically significant.
2.4.5 Cost-benefit results
As shown in Table D4, for active claimants who started Employer Wage Subsidy participation between 2002 and 2005 the benefits of Employer Wage Subsidy recovered the costs within 5.1 years after participation from the social perspective. The total benefits six years after program end exceeded the costs by $1,390. Similarly the benefits of Employer Wage Subsidy for former claimants exceeded the costs during the second year of the participation period. The benefits six years after the end of participation exceeded the costs by $10,789.
2.4.6 Challenges and lessons learned about Employer Wage Subsidy design and delivery
Based on a document review and 5 key informant interviews completed in the summer of 2015
Despite being effective at helping participants to find and maintain employment, there has been a steady decline in the number of new Employer Wage Subsidy interventions delivered per year. The number of new interventions decreased from 3,109 in 2004 to 2005 to 1,632 in 2014 to 2015.
Key informants identified the following reasons to explain the decline in the use of Employer Wage Subsidy:
- Changes to the eligibility criteria reduced the number of participants who can benefit from the program.
- There is significant outmigration of potential workers to Western Canada.
- Local economic conditions indicate that, in some regions of New Brunswick, the number of employers is decreasing. As well, business expansion may be limited in regions with a struggling economy.
They also identified the following reasons to explain why employers may not be inclined to use the program:
- Some employers believe there is too much paperwork required for the program.
- Employers may have difficulty finding an employee who is EI eligible and who has the right skill sets.
- There is a lack of awareness about the program.
Challenges with the design and delivery of Employer Wage Subsidy include:
- Employer eligibility criteria limit the number of employers that can access the program.
- Validating whether the requested subsidy will be used to support a new position is time consuming for program officers.
- The level of awareness about the program could be improved.
- The Program Officers’ high workload can be an issue in urban centers.
Key informants were asked about the best practices and the lessons they learned in terms of the design and delivery of the program. These included:
- Employers generally appreciate that the program is delivered at the regional level because regional staff are better placed to understand the needs of the local labour market.
- Conducting on-site assessments of employer applications and maintaining contact with employers is beneficial and allows counsellors to assess how the employee is fitting in the position.
- Managing employer’s expectations.
- The program has flexibility with access to additional funding to assist different client groups.
- The post-secondary component is very important for the retention of youth in New Brunswick.
- It would be helpful if the administrative process depended on email and scanned forms rather than correspondence by regular mail.
- Program officers should be consistent when applying program guidelines.
- Using the employer-driven approach for the application process is a best practice.
2.5 Self-Employment Benefit
2.5.1 Program description
The Self-Employment Benefit program assists unemployed individuals create a job for themselves by starting a new business. Financial support and advice is provided to unemployed individuals as they develop their business.
2.5.2 Profile of participants
As shown in Table E1 in Appendix E, active claimants who started participating in Self-Employment Benefit in 2002 to 2005 and 2006 to 2008 were primarily male (66% and 68% respectively). Most participants in both cohorts were 35 years of age and older (62% and 68% respectively). Both the 2002 to 2005 and 2006 to 2008 participants most frequently had occupations requiring college or apprenticeship training prior to participation (36% and 43% respectively). Both cohorts had similar earnings in the year before participation ($23,343 and $23,086 respectively).
Former claimants who started Self-Employment Benefit participation in 2002 to 2005 were mainly male (52%) and in 2006 to 2008, participants were primarily female (52%). Most participants in both cohorts were 35 years of age and older (64% and 65% respectively). Former claimants in both cohorts most frequently held occupations requiring college/apprenticeship training (35% and 32% respectively) prior to participation. As well, respectively, 27% and 36% of these participants had an occupation requiring secondary or occupational training. The 2002 to 2005 cohort had slightly higher earnings in the year before participation ($12,745) than the 2006 to 2008 cohort ($10,127).
2.5.3 Challenges in measuring Self-Employment Benefit incremental impacts
Like other EBSMs, incremental impacts were estimated for Self-Employment Benefit participants in the 2002 to 2005 and 2006 to 2008 periods. Results showed large decreases in employment/self-employment earnings and decreases in the incidence of employment. As well, compared to similar non-participants, participants decreased their use of EI and social assistance and reduced their dependence on government income support.
Detailed estimates are presented in Tables E2 and E3 in Appendix E. However, they are not discussed in the report since they may not provide an accurate depiction of the financial well-being of Self-Employment Benefit participants in the post-program period. Impacts were examined using individual earnings reported in the T1 and T4 taxation files from Canada Revenue Agency, and measured relative to active claimants who did not participate in Self-Employment Benefit and may have been in any employment/unemployment situation following participation (for example, unemployed, paid employee or self-employed).
According to a study from Statistics Canada, self-employed individuals in Canada have a lower average annual income than paid employees ($46,200 versus $52,400 in 2009), but the average net worth of their households is 2.7 times greater than that of the paid employee households, which indicates that some self-employed individuals may leave funds within their business for reinvestment purposesFootnote 10. Overall, this suggests that looking at individual earnings alone, without taking the net worth into consideration, may not provide a fair assessment of how well participants are doing financially after participation.
As well, little is known about the design and delivery of this program. In particular, there is a lack of understanding around the role played by this program in helping future entrepreneurs implement viable business plans and develop their entrepreneurship skills. Overall, it is not clear whether participant’s success in improving their labour market attachment through self-employment is more closely associated with their business idea and their entrepreneurship skills than the assistance provided under the Self-Employment Benefit program.
2.6 Employment Assistance Services
2.6.1 Program description
Based on a document review and 11 key informant interviews completed in the summer of 2013
Employment Assistance Services assists unemployed individuals prepare for, obtain and maintain employment. Services are accessible to all unemployed persons seeking employment-related supports.
Key Employment Assistance Services in New Brunswick include:
- Individualized case management - including employment counselling, skills assessment, assessment of strengths and weaknesses, and development of employment action plans. All LMDA participants must have an employment action plan.
- Help with career decisions.
- Job search activities and workshops (job search, networking, etc.).
- Referral services - linking employers, educational institutions and government, and coordination of support services.
- Marketing clients and client groups.
- Job preparation intervention such as interview skills and techniques.
- Help with résumé writing and cover letters.
- Networking with employers and job placements.
- One-on-one job assistance.
- Long-term follow-up for employment maintenance.
- Essential skills training (soft skills training, first aid, job shadowing, on-the-job work exploration experience).
- Access to labour market information (newspapers and internet).
- Off-site employment services to companies that are laying-off employees.
- Drop-in career information centres with access to computers, newspapers and community resources.
2.6.2 Program delivery
Based on a document review and 11 key informant interviews completed in the summer of 2013
In New Brunswick, the Department of Post-Secondary Education, Training and Labour delivers Employment Assistance Services through external contracts in partnership with non-profit, private and/or public organizations. Participants are referred to Employment Assistance Services by employment counsellors and may also be self-referred. Department of Post-Secondary Education, Training and Labour’s Regional Offices are responsible for identifying participants’ needs and target participants to be served under Employment Assistance Services as well as to set and achieve targets.
2.6.3 Profile of Employment Assistance Services participants
The socio-demographic profile was produced for individuals who only received Employment Assistance Services without participating in other employment benefits programs.
Active claimants
As shown in Table F1 in Appendix F, active claimants who started their Employment Assistance Services participation in 2002 to 2005 and in 2006 to 2008 were mostly males (57% and 64% respectively). Over half of the participants in both cohorts were between 25 and 44 years of age (59% and 51% respectively). Active claimants who participated in Employment Assistance Services most frequently held occupations requiring secondary or occupational training before participation (39% each). As well, both cohorts had similar employment earnings ($16,504 and $16,263).
Former claimants
Former claimants were predominately males in both the 2002 to 2005 and 2005 to 2008 periods (54% and 58% respectively). Fifty-eight percent of the 2002 to 2005 participants were between 25 and 44 years old compared to 55% for 2006 to 2008 participants. Both the 2002 to 2005 and 2006 to 2008 groups most frequently held occupations requiring secondary or occupational training before participation (36% and 38% respectively). Participants from the 2002 to 2005 cohort had lower earnings ($8,646) in the year before participation compared to the 2006 to 2008 cohort ($10,934).
Labour Market barriers faced by Employment Assistance Services participants
Based on a document review and 11 key informant interviews completed in the summer of 2013
The program managers and representatives from service delivery organizations interviewed identified a number of barriers that Employment Assistance Services participants are facing in terms of labour market participation. Examples of barriers include low educational attainment, low literacy and numeracy skills, lack of on-the-job skills, limited job opportunities (especially during the off-season), bilingual requirements, older workers competing with younger workers for similar positions, transportation (especially in rural areas), poverty in general (lack of transportation and no telephones), mental health issues, and pressure to hold multiple jobs in order to support a basic level of sustenance.
Other Employment Assistance Services participants, such as persons with disabilities, face unique barriers to work. They often have low educational attainment, low literacy and numeracy skills, lack of work experience, difficulties multi-tasking on-the-job. Persons with disabilities often take lower skilled jobs as a result of competing with people that have higher skill sets. In addition, it was identified that there is social stigmatism towards people with disabilities.
2.6.4 Incremental impacts
Results presented in Table F2 in Appendix F indicated that active claimants who participated in Employment Assistance Services between 2002 and 2005 increased their earnings by a cumulative of $6,182 after participation despite a short decrease in earnings in year 1. As well, their incidence of employment increased between 1.0 and 1.4 percentage points after participation (see Figure 6). Participants reduced their use of EI in all years after participation by a cumulative of $1,905 or 5.5 weeks. Their level of dependence on income support also decreased between 1.1 and 1.3 percentage points annually during four out of five post-program years.
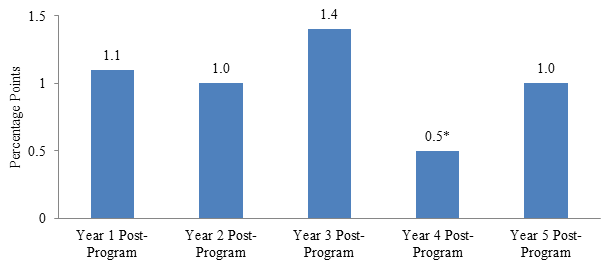
Text description of Figure 6
| Year 1 Post-program | Year 2 Post-program | Year 3 Post-program | Year 4 Post-program | Year 5 Post-program | |
|---|---|---|---|---|---|
| Percentage points | 1.1 | 1.0 | 1.4 | 0.5* | 1.0 |
* The estimate is not statistically significant at the 95% confidence level.
Results for active claimants who participated in Employment Assistance Services in 2006 to 2008 also showed incremental increases in earnings and gains in incidence of employment in the three years after participation. Their use of EI increased by a cumulative of 1.5 weeks and the dependence on income support showed an increase of 1.6 percentage points in year three post-participation.
The results varied for the three sub-groups examined:
- Youth (under 30 years old) who started an Employment Assistance Services intervention between 2002 and 2005 had incremental gains in earnings starting in the third year after participation. Their use of EI decreased in all post-program years along with a decrease in the dependence on income support in the first and third post-program years.
- Older workers (55 years old and over) who started an Employment Assistance Services intervention between 2002 and 2005 had incremental gains in earnings starting in the second post-program year and increases in incidence of employment during most of the post-program period. While the incremental impacts on the use of EI and social assistance were non-statistically significant, older workers increased their dependence on income support overall.
- Long-tenured workers who started an Employment Assistance Services intervention between 2007 and 2009 had decreased earnings in the first year post-program, decreases in the use of EI but an increase in social assistance use. This reflects their difficulty to reintegrate into the labour market.
Earlier participation in Employment Assistance Services improves participant’s labour market outcomes
The study on the effects related to the timing of participation showed that incremental impacts on earnings and employment were larger for individuals who received Employment Assistance Services early during their EI claim compared to individuals who remained on EI longer before receiving these services (see Figure 7 below and Table F3 in Appendix F). Specifically, individuals who started their participation within four weeks following the start of their EI benefit period had a total increase of $16,193 in their earnings over the five years post-program.

Text description of Figure 7
| 1 to 4 weeks | 5 to 8 weeks | 9 to 12 weeks | 2nd quarter | 3rd quarter | 4th quarter | |
|---|---|---|---|---|---|---|
| Cumulative gains in earnings | $16,193 | $12,513 | $5,411 | $4,240 | -$118* | $2,457* |
* Estimates are not statistically significant at the 95% confidence level
As well, the study looked at the difference between the number of EI weeks unused by participants and their comparison group to determine the effect of the timing of Employment Assistance Services participation on the return to employment. Those who started receiving assistance within the first four weeks of their claim returned to employment faster than the comparison group. Specifically, they returned to employment 3.5 weeks earlier than the comparison group (see Table F4 in Appendix F). Participants who started Employment Assistance Services after the fourth week of their EI claim returned to employment 0.8 to 3.9 weeks later than the comparison group.
Among all Employment Assistance Services participants in the 2002 to 2005 period, 1,555 received assistance within the first 4 weeks of establishing an EI claim. With an average weekly EI benefits of $294 during this period, the 1,555 participants did not use $1,600,095 in EI benefits (1,555 * $294 * 3.5 weeks). The average cost of receiving only Employment Assistance Services interventions in the 2002-2005 period was $658. This represents a cost of $1,023,190 [(1,555) * $658] for a net saving of $576,905.
2.6.5 Cost-benefit results
As shown in Table F5 in Appendix F, the benefits of Employment Assistance Services from the society perspective exceeded the cost by $5,280 six years after participation. It took 3.4 years after the end of participation for the benefits to recover the costs.
Incremental impact analyses showed that Employment Assistance Services are achieving this objective since it increased participant’s earnings and employment, and decreased their EI use after participation. The value of the return in employment was not accounted for in this analysis since it is difficult to attribute a dollar figure to this impact. The decrease in EI use was also not considered from the social perspective because it represents a benefit for the government and a cost to the individual – they cancel each other out.
2.6.6 Challenges and lessons learned about Employment Assistance Services design and delivery
Based on a document review and 11 key informant interviews completed in the summer of 2013
Key informants highlighted a number of challenges with delivering Employment Assistance Services which fall under the following categories: accessibility, capacity for delivery and lack of awareness of programs and services. Examples of challenges identified include:
- Accessibility: participants have transportation issues especially in rural areas; limited support for transportation cost; and some participants do not have telephones.
- Capacity for Delivery: limited budgets and resources to provide Employment Assistance Services; budgets have not increased over time; difficulty in meeting targets; delivery of services has a substantial administrative burden; and providing services to those who require multiple interventions is costly.
- Awareness: there is a need to promote services since some clients may not be aware of the services offered; however, service delivery organizations do not necessarily have the funding to advertise their services.
Best practices and lessons learned related to the general design and delivery of program and services included:
- Conducting individual case management and providing a client-centered/holistic approach can help participants build self-esteem.
- Investing time to help participants become independent and use the drop-in resources and computers on their own.
- Demonstrating a standard business environment at the employment centre to help identify potential social or behavioural problems.
- Making appropriate employee-employer matches helps build relationships with employers and organizations as well as providing participants with opportunities to explore career choices (job shadowing).
- Working closely with referral agencies, employment counsellors and social workers.
- Having longer service provider contracts and budgets would improve service delivery.
- The computer system “ContactNB.net” is seen by service providers as assisting in tracking participants and verifying that they get additional support after referrals.
- Monitoring participants’ files at the service provider level to ensure that the right services are provided to participants.
2.6.7 Challenges and lessons learned for individuals facing multiple barriers
Based on a document review and 11 key informant interviews completed in the summer of 2013
Challenges identified by key informants in terms of providing Employment Assistance Services to individuals with multiple barriers to employment include:
- Participants with multiple barriers need multiple services, but are limited since very few third party organizations are able to provide all the services they need.
- There is a lack of literacy training available for participants with multiple barriers under EAS funding.
- Transportation in rural areas was identified as a barrier for persons with disabilities; in some rural regions there is no transportation at all.
Examples of best practices for participants with multiple barriers to employment in New Brunswick included:
- Individualized case management and detailed assessment of participants’ strength and weaknesses.
- Partnering with other third-party service providers and sharing tools.
- Support for transportation in rural communities to facilitate access to Employment Assistance Services workshops.
- Informing participants about the importance of personal hygiene and wearing appropriate clothing, driving an automobile.
- Drop-in career information centres help participants build confidence and continue looking for work.
- Computer skills training.
- Providing support to improve participant’s self-esteem.
- Résumé services.
- Working closely with the Workplace Essential Skills program to address barriers related to lack of essential workplace skills.
- Conducting one-on-one job search support by accompanying participants in handing out résumés or meeting one-on-one with employers to market individual participants.
- Providing Indigenous participants with role models.
3. Comparison of key findings by program type
This section provides an overview of the key findings from the incremental impact analysis for Training and Skills Development, Employer Wage Subsidy and Employment Assistance Services for both active and former EI claimant participants who started participation in the 2002 to 2005 period.
Overall, incremental impacts demonstrate that LMDA programs and services are improving the labour market attachment of participants, including youth and older workers. As well, social benefits of participation exceeded the cost of investments for most interventions over time. Finally, providing Employment Assistance Services interventions earlier during an EI claim (first four weeks) produced larger impacts on earnings and employment and facilitated earlier return to work. This demonstrates the importance of targeting early participation of EI active claimants.
Program participants have a higher probability of being employed than comparison group members.
As show in Figure 8, active EI claimants who participated in Training and Skills Development, Employer Wage Subsidy and Employment Assistance Services had a higher probability of being employed (that is increased their incidence of employment) compared to similar non-participants. As well, former EI claimants who participated in Training and Skills Development and Employer Wage Subsidy had a higher probability of being employed compared to former EI claimants who received low intensity interventions under Employment Assistance Services.
It is noted that Employment Assistance Services are relatively modest activities such as counselling, job search assistance and case management. By themselves, they are not expected to lead to substantial effects on labour market outcomes. However, as demonstrated in the report, providing Employment Assistance Services earlier during the EI claim (first four weeks) generates significantly greater returns (see Figure 7 in sub-section 2.6.4).
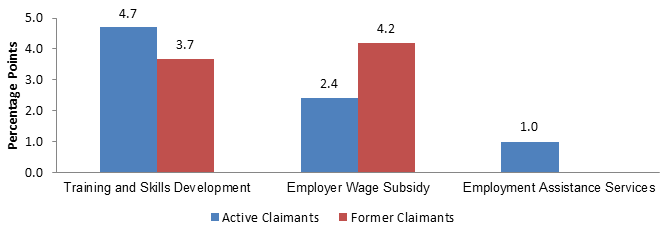
Text description of Figure 8
| Training and Skills Development | Employer Wage Subsidy | Employment Assistance Services | ||
|---|---|---|---|---|
| Percentage points | Active claimants | 4.7 | 2.4 | 1.0 |
| Former claimants | 3.7 | 4.2 | 0 |
Increased earnings for participants compared to comparison group members
As shown in Figure 9, active EI claimants who participated in Training and Skills Development, Employer Wage Subsidy and Employment Assistance Services increased their employment earnings compared to similar non-participants. As well, former EI claimants who participated in Training and Skills Development, Employer Wage Subsidy increased their employment earnings compared to former EI claimants who received Employment Assistance Services exclusively.
As already noted, providing Employment Assistance Services earlier during the EI claim (first 4 weeks) generates significantly greater returns.

Text description of Figure 9
| Training and Skills Development | Employer Wage Subsidy | Employment Assistance Services | ||
|---|---|---|---|---|
| Gains in earnings | Active claimants | $17,903 | $5,408 | $6,182 |
| Former Claimants | $12,612 | $7,188 | $0 |
LMDAs are also improving the probability of employment and the earnings of most youth and older worker participants
Incremental impacts demonstrate that active and former EI claimants who were youth and older workers, and who participated in Training and Skills Development and Employment Assistance Services increased their employment earnings compared to comparison group members. As well, former claimants who were youth and who participated in Employer Wage Subsidy improved their employment earnings (see Figure 10 and 11). Among active claimants, youth and older workers who participated in Training and Skills Development had the largest cumulative gain in earnings. This suggests that providing training to youth and older workers yield strongest results.
Among active claimants, youth who participated in Training and Skills Development and older workers who participated in Training and Skills Development and Employment Assistance Services increased the probability of employment compared to comparison group members. As well, youth who were former claimants and who participated in Employer Wage Subsidy increased their probability of employment. Among active claimants, older workers experienced higher impacts on the incidence of employment than youth participants in Training and Skills Development and Employment Assistance Services.
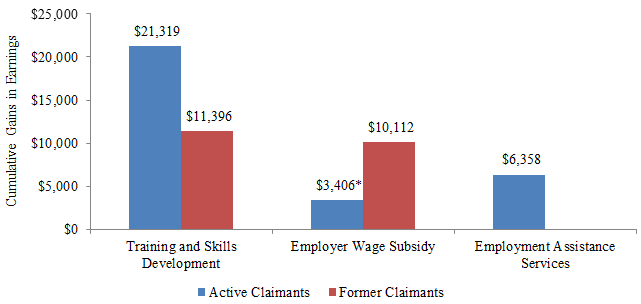
Text description of Figure 10
| Training and Skills Development | Employer Wage Subsidy | Employment Assistance Services | ||
|---|---|---|---|---|
| Cumulative gains in earnings | Active claimants | $21,319 | $3,406* | $6,358 |
| Former claimants | $11,396 | $10,112 | $0 |
* The estimate is not statistically significant at the 95% confidence level
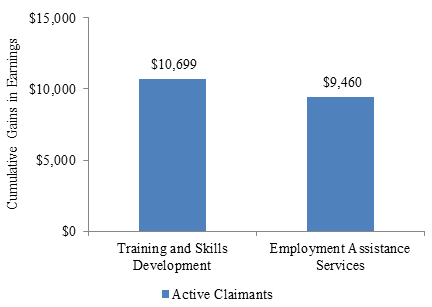
Text description of Figure 11
| Training and Skills Development | Employment Assistance Services | |
|---|---|---|
| Cumulative gains in earnings | $10,699 | $9,460 |
The use of EI is reduced for all active claimant participants. While EI use increased for former claimants who participated in Employer Wage Subsidy, it can be argued that this reflects an increase in labour market attachment since the incremental impacts on employment earnings and incidence of employment are positive and given the decrease in the use of social assistance.
As shown in Figure 12, active EI claimants who participated in Training and Skills Development, Employer Wage Subsidy and Employment Assistance Services decreased their use of EI compared to similar non-participants. Active claimants who participated in Training and Skills Development decreased their use of social assistance.
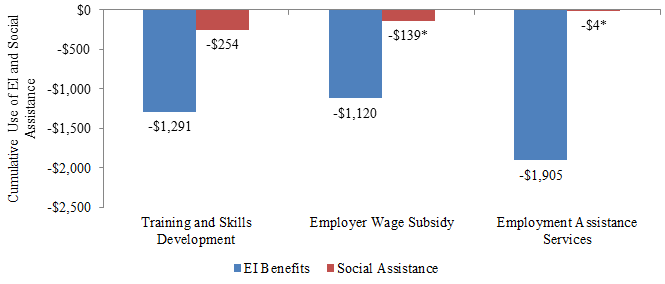
Text description of Figure 12
| Training and Skills Development | Employer Wage Subsidy | Employment Assistance Services | ||
|---|---|---|---|---|
| Cumulative use of EI and Social Assistance | EI Benefits | -$1,291 | -$1,120 | -$1,905 |
| Social Assistance | -$254 | $-139* | -$4* |
* The estimates are not statistically significant at the 95% confidence level
As shown in Figure 13, former claimants who participated in Employer Wage Subsidy increased their use of EI following participation. This indicates the inability of some former claimants to maintain the employment secured in the short-term. It can also be argued that the increase in EI use is an indication of an increase in the labour market attachment for this client group since they did experience increases in employment earnings and incidence of employment as well as a decrease in the use of social assistance. As a reminder, former claimants are participants for whom the EI benefit period ended up to three years pre-participation.
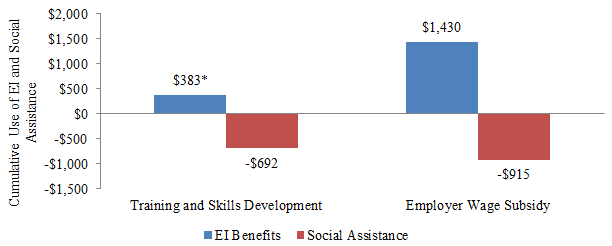
Text description of Figure 13
| Training and Skills Development | Employer Wage Subsidy | ||
|---|---|---|---|
| Cumulative use of EI and Social Assistance | EI Benefits | $383* | $1,430 |
| Social Assistance | -$692 | -$915 |
*The estimate is not statistically significant at the 95% confidence level
Social benefits of participation exceeded costs of investments for most interventions.
As shown in Table 6, social benefits to participation exceeded investment costs in a period ranging between the 2nd year of program participation to just over 6 years after participation.
| Training and Skills Development | Employer Wage Subsidy | Employment Assistance Services | |
|---|---|---|---|
| Active claimants | 5.1 | 5.1 | 3.4 |
| Former claimants | 6.3 | 2nd participation year | n/a |
4. Conclusions
Evaluation evidence presented and discussed in this report demonstrated that programs and services designed and delivered by New Brunswick under the LMDA are generally helping participants improve their labour market experience after participation. As such, evaluation evidence suggests that LMDA funded programming contributes to achieving New Brunswick’s strategic priorities.
Overall, incremental impacts demonstrate that LMDA programs and services are improving the labour market attachment of participants, including youth and older workers. As well, social benefits of participation exceeded the cost of investments for most interventions over time. Finally, providing Employment Assistance Services interventions earlier during an EI claim (first four weeks) produced larger impacts on earnings and employment and facilitated earlier return to work. This demonstrates the importance of targeting early participation of EI active claimants.
Key informants interviews with service providers and program managers as well as the documents reviewed and the questionnaires completed by New Brunswick representatives generated a few lessons about program design and delivery:
Training and Skills Development
- The Training and Skills Development application process aims to ensure that prospective participants are choosing a trade that will meet labour market demand.
- New Brunswick plans their training investment to target labour market trends which may contribute to Training and Skills Development effectiveness.
- According to the interviewed service providers and managers, the main challenges related to Training and Skills Development design and delivery included:
- The eligibility criteria exclude some individuals who could benefit from training and upskilling.
- The financial assistance for tuition is too limited in some situations.
- Barriers to employment or to accessing and completing training under Training and Skills Development included:
- Financial hardship;
- Access to childcare and transportation;
- Learning, mental or physical disabilities;
- Language barriers;
- Low education, literacy levels and lack of work experience;
- Having to complete high school upgrading to take training; and,
- Personal issues such as a criminal record.
Skills Development-Apprentices
- Existing literature showed that there is a fairly high non-completion rate among apprentices in Canada (40-50%)Footnote 11. Furthermore, subject matter literature revealed that despite the growth in apprenticeship registrations in Canada, there has not been a corresponding increase in completion ratesFootnote 12. While it is not possible with available data to generate a reliable estimation of the completion rate of Skills Development-Apprentices participants in New Brunswick, key informants involved in apprenticeship delivery confirmed the stagnation in completion rates.
- According to key informants, apprenticeship drop-out is due to factors such as lack of incentive to complete the training; a learning disability; lack of essential skills; and living a long distance away from the location of the training.
- Other challenges noted by key informants regarding the design and delivery of Skills Development-Apprentices included a lack of awareness about how the apprenticeship system works; lack of electronic application and funding supports system; delays in reimbursing the tuition rebate; and the level of funding is perceived to be insufficient, particularly the level of financial support for childcare and transportation.
Employer Wage Subsidy
- While evaluation results have demonstrated the effectiveness of Employer Wage Subsidy, its use has been falling in recent years. According to EI Monitoring and Assessment reports, the number of new interventions decreased from 3,109 in 2004 to 2005 to 1,632 in 2014 to 2015. According to key informants, the reasons for the decline included:
- Changes to the eligibility criteria reduced the number of participants who can benefit from the program.
- Significant outmigration of potential workers to Western Canada.
- Local economic conditions as some regions of New Brunswick have a high unemployment rate and the number of employers is decreasing.
Employment Assistance Services
- Key informants confirmed the need for labour market information to support program. However, they pointed out that the labour market information data was often out-of-date, inconsistent, and not specific or timely.
- Challenges with the design and delivery of Employment Assistance Services included:
- Access to services due to a lack of transportation and a lack of telephones.
- Service delivery has a substantial administrative burden.
- Lack of awareness about services.
5. Recommendations
A total of six recommendations emerged from the evaluation findings. They are as follows:
The study on the timing of Employment Assistance Services participation showed that receiving assistance early after starting an employment insurance claim can lead to better labour market impacts. However, key informants reported a lack of awareness about the program.
Recommendation 1: Consideration should be given to providing New Brunswick with timely access to data on new EI recipients to support targeting and increase awareness.
Key informants reported that low education, learning disabilities and literacy issues may be barriers to accessing and completing training.
Recommendation 2: Consideration should be given to removing barriers to accessing and completing training such as literacy/essential skills training and learning disability assessments. These measures would help individuals with multiple barriers prepare for vocational training and integrate into the labour market. These measures should be reported separately from other Skills Development interventions given their unique objectives.
Incremental impacts showed improvements in participant’s earnings and employment in the Employer Wage Subsidy program although its use has been declining in recent years. According to key informants, the decline may be related to the changes in the program’s eligibility criteria, outmigration of workers, lack of vacant positions and a decrease in potential employers.
Recommendation 3: New Brunswick should explore ways of removing barriers to employer participation in the Employer Wage Subsidy program.
Key informants interviewed in the evaluation confirmed the necessity of having labour market information to support the delivery of Training and Skills Development and Employment Assistance Services. They, however, pointed out that labour market information data was often out-of-date, inconsistent, and not specific or timely.
Recommendation 4: Consideration should be given to strengthening the production and availability of local labour market information to support program delivery.
The evaluation was not able to produce a conclusive assessment of Self-Employment effectiveness and efficiency since the data used to assess impacts on earnings may not be the best source of information available to reflect the financial wellbeing of the participants. As well, it is not clear whether the participant’s success in improving their labour market attachment through self-employment is more closely associated with their business idea and their entrepreneurship skills than the assistance provided under Self-Employment.
Recommendation 5: Consideration should be given to examine in more detail the design and delivery of Self-Employment and whether the performance indicators for this program are appropriate.
Overall, the LMDA evaluation was able to produce a sound assessment of EBSM effectiveness and efficiency because the team had access to rich data on EI claimants, EBSM participation data and Canada Revenue Agency taxation files. However, some data gaps limited the evaluation’s ability to assess how EBSMs operate.
Recommendation 6: Improvements in data collection is recommended to address key program and policy questions of interest to the federal and P/T governments. Specifically:
Collect data on whether participants are members of designated groups including Indigenous peoples, persons with disabilities and recent immigrants.
Collect data on the type of training funded under Training and Skills Development and the type of assistance provided under Employment Assistance Services. New Brunswick, ESDC and other P/Ts should work together to define common categories for both EBSMs.
Collect detailed data on the cost of interventions.
References
- Canada Employment Insurance Commission. Employment Insurance Monitoring and Assessment Reports. 2003-2004 to 2013-2014.
- Coe, Patrick. “Apprenticeship programme requirements and apprenticeship completion rates in Canada.” Journal of Vocational Education and Training. 2013. 65(4):575-605
- Employment and Social Development Canada. Analysis of Employment Benefits and Support Measures (EBSM) Profile, Outcomes and Incremental Impacts for 2006-2008 Participants in New Brunswick: Technical Report. Evaluation Directorate. February 4, 2015
- Employment and Social Development Canada. Analysis of Employment Benefits and Support Measures (EBSM) Profile, Outcomes and Incremental Impacts for the EI Claimant Category “Long-Tenured Workers”: Technical Report. Evaluation Directorate. February 17, 2016
- Employment and Social Development Canada. Cost-Benefit Analysis of Employment Benefits and Support Measures Delivered in New Brunswick: Technical Report. Evaluation Directorate. May 25, 2016
- Employment and Social Development Canada. Effects of the Timing of Participation in Employment Assistance Services: Report on National Results. Evaluation Directorate. November 13, 2014
- Employment and Social Development Canada. Profile, Outcomes and New Impacts of Employment Benefits and Support Measures (EBSM) Participants in New Brunswick: Technical Report. Evaluation Directorate. March 2014
- Employment and Social Development Canada. Stream 1 Study for 2013-2014: National Level Analysis of EBSM Incremental Impacts: Methodology Report. Evaluation Directorate. September 2013.
- Employment and Social Development Canada. Study on Employment Assistance Services New Brunswick: Technical Report. Evaluation Directorate. August 28, 2014
- Employment and Social Development Canada. Study on Skills Development – Apprenticeship in New Brunswick: Technical Report. Evaluation Directorate. June 10, 2016
- Employment and Social Development Canada. Study on Training and Skills Development in New Brunswick: Technical Report. Evaluation Directorate. May 5, 2016
- Employment and Social Development Canada. Study on Employer Wage Subsidies in New Brunswick: Technical Report. Evaluation Directorate. March 16, 2016
- Government of New Brunswick. Annual Annex 2: Canada-New Brunswick Labour Market Development Agreement. 2016-2017.
- Government of New Brunswick. Strategic Plan 2015-2018. Department of Post-Secondary Education, Training and Labour. April 2015.
- LaRochelle-Côté, Sébastien and Sharanjit Uppal, "The Financial Well-Being of the Self-Employed," Perspectives on Labour and Income, vol. 23, no. 4, Winter 2011.
- Red Seal. Apprenticeship Completion, Certification and Outcomes, Ottawa: Red Seal. 2014.
Acronyms
- EBSM Employment Benefits and Support Measures
- EI Employment Insurance
- ESDC Employment and Social Development Canada
- LMDA Labour Market Development Agreements
- P/T Province/Territory
Appendix A – Methodology
Qualitative data
Qualitative data reported in the Training and Skills Development (TSD), Training and Skills Development – Apprenticeship (TSD-A), Employer Wage Subsidy (EWS) and Employment Assistance Services (EAS) studies were collected from key informant interviews with managers and service providers and a document/literature review. As well, questionnaires were completed by provincial/territorial government representatives for the TSD, TSD-A and EWS studies. Table A1 provides the number of key informants interviewed.
Key informant interviews for the EAS study were conducted in 2013 while those for the TSD, SD-A and EWS studies were conducted in 2015.
| Studies | ||||
|---|---|---|---|---|
| TSD | SD-A | EWS | EAS | |
| Number of key informant interviews (Managers and service providers) | 4 | 3 | 5 | 11 |
Quantitative methods
All quantitative analyses were conducted using linked administrative data from EI Part I (EI claim), EI Part II (EBSM participation data) and T1 and T4 taxation files for 100% of the participants in New Brunswick.
Incremental impacts
The incremental impact analysis compared the labour market experience of participants before and after their participation with that of a comparison group. The goal was to determine the direct effect of program participation on key labour market indicators (see Figure 1).
For active claimants, incremental impacts were measured relative to a comparison group of active claimants who could have participated in the EBSMs but did not. Former claimants can be underemployed and unable to requalify for EI, out of the labour force for various reasons or on social assistance. Based on previous evaluation methodologies, on expert advice and given the difficulty in generating a suitable comparison for former claimants using administrative data alone, the comparison group for former claimants was created using individuals who participated in low-intensity Employment Assistance Services only during the reference period. This is a conservative approach given the fact that participation in Employment Assistance Services can lead to limited effects on labour market outcomes.
Participants and non-participants were matched based on a wide array of variables including age, sex, location, skill level required by the last occupation held prior to participation, reason for separation from employment, industry in which they were previously employed as well as employment earnings and use of EI and Social Assistance (SA) for each of the five years before participation.
All analyses were conducted using a unit of analysis called the Action Plan Equivalent, which combines all EBSMs given to an individual within no more than six months of each other. For reporting purposes, incremental impacts were attributed to the longest intervention of the Action Plan Equivalent when TSD, EWS or Self-Employment Benefit was the longest intervention. Impacts for EAS were calculated for Action Plan Equivalent that contained only EAS with no employment benefits.
The incremental impact estimates were produced using non-experimental methods, namely propensity score matching, using the Kernel Matching method, along with Difference-in-Differences method to estimate program impacts. Alternative matching techniques (that is, Nearest Neighbour and Inverse Propensity Weighting) were also used for validation purposes.
Incremental impacts were measured for the following indicators:
- Employment/self-employment earnings represent the total earnings an individual had from paid employment and/or self-employment. (This information is available by calendar year and was obtained from T1 and T4 tax return records).
- Incidence of employment/self-employment represents the incidence of having earnings from employment and/or self-employment.
- Amount of EI benefits received represents the average amount of EI benefits received.
- Weeks in receipt of EI benefits represents the average number of weeks during which EI benefits were received.
- SA benefits represent the average amount of SA benefits received. (This information is available by calendar year and is obtained from T1 tax return records.)
- Dependence on income support represents the ratio of participant’s income that came from EI and SA benefits (that is, EI benefits + SA benefits / (EI benefits + SA benefits + earnings from employment/self/employment)).
Incremental impacts were estimated for different cohorts of participants:
- All active and all former claimants as well as youth (under 30 years old) and older workers (55 years old and over) who started their EBSM participation between April 1, 2002 and March 31, 2005.
- All active and all former claimants who stated their EBSM participation between January 1, 2006 and March 31, 2008.
- Active and former claimants who were long-tenured workers and who started their EBSM participation between January 1, 2007 and December 31, 2009. The long-tenured workers covered in this study are individuals who have established an EI regular or fishing benefit claimants and who had paid at least 30% of the annual maximum employee EI premiums in seven of the ten years preceding their EI claim and who had collected 35 or fewer weeks of EI regular or fishing benefits in the five years preceding their claim. This definition is similar to the EI claimant category long-tenured workers introduced under Connecting Canadians with Available Jobs.
Cost-benefit analysis
The cost-benefit analysis compared how much it cost for individuals to participate in the programs and how much it costs the government to deliver those programs with the benefits both the participants and the government drew from those programs. The analysis was carried out from the society perspective which combines the costs and the benefits for both the participants and the government.
Costs and benefits included in the calculations were as follows:
- Program costs included the administration cost and the direct cost of the EBSMs. The cost for each EBSM was calculated at the Action Plan Equivalent level. The costs were determined based on the average composition of the Action Plan Equivalent.
- The Marginal Social Cost of Public Funds represented the loss incurred by society when raising additional revenues such as taxes to fund government spending. The value was estimated as 20% of the program cost, sales taxes, income taxes, impacts on EI and impacts on SA paid or collected by the government.
- Employment earnings consisted of incremental impacts on participants’ earnings during and after participation. The calculation accounts for the participant’s forgone earnings during participation (that is, opportunity cost). These are based on incremental impacts for the 2002 to 2005 participants.
- Fringe benefits included benefits such as employer-paid health and life insurance as well as pension contributions. The rate used to calculate the fringe benefits was 15% of the incremental impact on earnings.
The program effects on EI and SA use, and the sale and income tax revenues were not included in the calculations since these costs and benefits cancel each other out from the social perspective by definition. For example, while EI and SA are benefits received by participants, they represent a cost for the government. However, as indicated above, these effects are accounted for in the calculation of the Marginal Social Cost of Public Funds.
When producing the results, to bring all costs and benefits to a common base and to account for inflation and interest on foregone government investment, the estimates for the second year of participation and up to the sixth year post-program were discounted by 5% per year. As well, when the benefits were still lower than the costs six years after program end, the payback period was calculated by assuming that the average benefit or cost measured over the fifth and six year post-program would persist over time (discounted at a 5% annual rate).
Strengths and limitations from the studies
Overall, the number of key informants interviewed was relatively small in some studies. The key informants’ responses were representative of their own experience and their own region but it is unclear if they were fully representative of the entire province.
The matching process led to the creation of comparison groups closely matched to the LMDA participants in terms of their background characteristics. Results obtained with Kernel Matching were validated with the use of two other techniques (that is, Inverse Propensity Weighting and Nearest Neighbour), increasing the level of confidence in the results. However, readers should be aware that incremental impacts may be affected by factors not captured by the matching process. For example, the motivation to seek employment was not directly measured except to the extent it was captured in prior income and labour market attachment patterns.
Readers should also keep in mind that it is not possible to compare the results obtained for each claimant type since the results for active claimants represent the effects of the EBSMs relative to non-participation while the results for former claimants represents the Employment Benefits relative to a limited treatment (that is, EAS).
The definition for long-tenured workers differs from the definition used in the literature as it does not consider the number of years the worker remained employed with the same employer.
The cost-benefit analysis was limited in the sense that it only took into account the quantifiable benefits and costs that were directly linked to EBSM delivery and participation and that could be estimated using available administrative data and the EI Monitoring and Assessment Report. The analysis did not capture “intangible”, non-pecuniary and indirect benefits. It did not consider the multiplier effect that improving participant’s income may have on the economy and did not account for the effect of EI Part II investment on sustaining a service delivery infrastructure and creating jobs among the governmental program service providers. As well, this analysis did not consider the displacement effect where participants may take away jobs that would otherwise be filled by other unemployed individuals. Finally, this analysis did not consider the possible effect of EBSMs on increasing skill prices.
Appendix B – Detailed results Training and Skills Development regular
| Active claimants | Former claimants | |||
|---|---|---|---|---|
| 2002 to 2005 | 2006 to 2008 | 2002 to 2005 | 2006 to 2008 | |
| Number of observations | 9,030 | 4,528 | 1,887 | 1,285 |
| Gender | ||||
| Male | 63% | 47% | 49% | 39% |
| Female | 37% | 53% | 51% | 61% |
| Age | ||||
| Under 25 | 23% | 32% | 22% | 19% |
| 25 to 34 | 31% | 34% | 38% | 42% |
| 35 to 44 | 25% | 22% | 24% | 25% |
| 45 and over | 21% | 12% | 16% | 13% |
| Marital status | ||||
| Married or common-law | 44% | 37% | 37% | 38% |
| Widow/ divorced or separated | 11% | 9% | 14% | 14% |
| Single | 44% | 53% | 47% | 46% |
| Missing data / Unknown | 1% | 1% | 2% | 3% |
| Skills level related to National Occupation Code associated with the last EI claim opened before participation1 | ||||
| Managerial | 2% | 5% | 2% | 5% |
| University | 3% | 4% | 3% | 5% |
| College or apprenticeship training | 25% | 22% | 26% | 20% |
| Secondary or occupational training | 45% | 41% | 40% | 42% |
| On-the-job training | 25% | 28% | 29% | 28% |
| Key Labour Market indicators in the year preceding the start of participation | ||||
| Earnings2 | $16,633 | $14,8493 | $9,394 | $8,1713 |
| Proportion employed | 98% | 99% | 85% | 83% |
| Proportion on EI | 69% | 55% | 76% | 69% |
| Proportion on Social Assistance | 5% | 5% | 16% | 17% |
Proportions may not add up to 100% due to rounding.
1Skill level corresponds to the type and/or amount of training or education typically required to work in the last occupation participants had before opening the last EI claim they had before participating in EBSMs:
-Managerial: Management occupations
-University: Occupations usually requiring university education (that is, University degree at the bachelor's, master's or doctorate level)
-College or apprenticeship training: Occupations usually requiring college or vocational education or apprenticeship training such as 2 to 3 years of post-secondary education at a community college, institute of technology or CEGEP or 2 to 5 years of apprenticeship training or 3 to 4 years of secondary school and more than 2 years of on-the-job training, specialized training courses or specific work experience and/or occupations with supervisory responsibilities and occupations with significant health and safety responsibilities, such as firefighters, police officers and registered nursing assistants.
-Secondary or occupational training: Occupations usually requiring secondary school and/or occupation-specific training such as one to four years of secondary school education or up to 2 years of on-the-job training specialized training courses or specific work experience.
-On-the-job training: On-the-job training is usually provided for occupations (that is, short work demonstration or on-the-job training or no formal educational requirements).
2Average earnings for all individuals included in the studies. The average was calculated including participants who reported $0 earnings during that year.
3Earnings for 2006 to 2008 participants have been adjusted by the Consumer Price Index published by Statistics Canada, using 2002 as the base year.
| Indicators | In-program period | Post-program period | Total in- and post-program | ||||||
|---|---|---|---|---|---|---|---|---|---|
| Program start year | Additional year | 1st year | 2nd year | 3rd year | 4th year | 5th year | Total post | ||
| All active claimants | |||||||||
| 2002 to 2005 participants (n= 9,022) | |||||||||
| Employment earnings ($) | -$2,354*** | -$3,088*** | $592*** | $2,682*** | $3,963*** | $4,993*** | $5,673*** | $17,903*** | $12,462*** |
| Incidence of employment (percentage points) | -2*** | -2.4*** | 3.3*** | 4.5*** | 4.9*** | 5.1*** | 5.4*** | n/a | n/a |
| EI benefits ($) | $922*** | $5 | -$451*** | -$252*** | -$175*** | -$164*** | -$177*** | -$1,219*** | -$292 |
| EI weeks (weeks) | 3.6 *** | 0.3** | -1.4*** | -0.9*** | -0.6*** | -0.6*** | -0.5*** | -4*** | -0.1 |
| Social Assistance benefits ($) | -$9 | -$23 | -$23 | -$51*** | -$68*** | -$55*** | -$56*** | -$254*** | -$286*** |
| Dependence on income support (percentage points) | 11.4*** | 6.5*** | -2*** | -1.1*** | -1*** | -0.6* | -0.3 | n/a | n/a |
| 2006-2008 participants (n=4,528) | |||||||||
| Employment earnings ($) | -$4,503*** | -$6,409*** | $1,051 | $5,158*** | $7,120*** | -- | -- | $13,328*** | $2,411 |
| Incidence of employment (percentage points) | -3.1*** | -3.7*** | 9.4*** | 9.9*** | 11.9*** | -- | -- | n/a | n/a |
| EI benefits ($) | $2,289*** | $541*** | -$752*** | -$294 | $86 | -- | -- | -$960* | $1,870** |
| EI weeks (weeks) | 8.2*** | 2.9*** | -0.8 | 0.5 | 0.8 | -- | -- | 0.5 | 11.6*** |
| Social Assistance benefits ($) | -$37 | -$103** | -$71 | -$173*** | -$219*** | -- | -- | -$464*** | -$604*** |
| Dependence on income support (percentage points) | 21.7*** | 12.7*** | -2.5** | -2.0 | -1.7 | -- | -- | n/a | n/a |
| Sub-groups of active claimants | |||||||||
| Youth (below 30 years old) – 2002 to 2005 participants (n=3,659) | |||||||||
| Employment earnings ($) | -$2,520*** | -$4,105*** | $623*** | $3,513*** | $4,916*** | $5,827*** | $6,442*** | $21,319*** | $14,694*** |
| Incidence of employment (percentage points) | -2*** | -2.7*** | 3.7*** | 4.8*** | 4.4*** | 4.6*** | 4.6*** | n/a | n/a |
| EI benefits ($) | $1,174*** | $111 | -$660*** | -$366*** | -$283*** | -$167* | -$125 | -$1,601*** | -$316 |
| EI weeks (weeks) | 4.9*** | 1.2*** | -2*** | -1.1*** | -1*** | -0.6** | -0.4 | -5.1*** | 0.9 |
| Social Assistance benefits ($) | -$21 | -$49** | -$59** | -$96*** | -$114*** | -$106*** | -$100*** | -$476*** | -$545*** |
| Dependence on income support (percentage points) | 11.4*** | 7.3*** | -4.6*** | -3.6*** | -3.2*** | -2.6*** | -1.8*** | n/a | n/a |
| Older Workers (55 years old and over) - 2002 to 2005 participants (n=458) | |||||||||
| Employment earnings ($) | $404 | $664 | $1,481** | $1,200 | $1,957** | $2,958*** | $3,104*** | $10,699*** | $11,766*** |
| Incidence of employment (percentage points) | -0.3 | 6.4*** | 7.8*** | 10*** | 13.1*** | 10.9*** | 12*** | n/a | n/a |
| EI benefits ($) | $14 | $380* | $750*** | $713** | $805*** | $1,163*** | $509 | $3,940*** | $4,334*** |
| EI weeks (weeks) | 0.6 | 1.2* | 2.5*** | 2.6*** | 2.7*** | 3.5*** | 2** | 13.3*** | 15*** |
| Social Assistance benefits ($) | $20 | $15 | $23 | $19 | $1 | -$16 | $3 | $30 | $66 |
| Dependence on income support (percentage points) | -0.5 | 1.3 | 2.3* | 5.4*** | 2.3 | 6.5*** | 2.6 | n/a | n/a |
| Long-Tenured Workers - 2007-2009 participants (n=1,601) | |||||||||
| Employment earnings ($) | -$7,732*** | -$9,329*** | -$2,659*** | $1,087 | $2,301*** | -- | -- | $729 | -$16,333*** |
| Incidence of employment (percentage points) | -5.4*** | -7.0*** | 0.9 | 3.0*** | 4.3*** | -- | -- | n/a | n/a |
| EI benefits ($) | $3,212*** | $1,765*** | -$99 | -$119 | $198 | -- | -- | -$21 | $4,956 |
| EI weeks (weeks) | 8.2*** | 4.6*** | 0.2 | -0.1 | 0.4 | -- | -- | 0.5 | 13.4*** |
| Social Assistance benefits ($) | -$18** | -$17 | $12 | -$29 | -$63*** | -- | -- | -$80 | -$116* |
| Dependence on income support (percentage points) | 18.7*** | 13.1*** | 0.7 | -2.3*** | -0.3 | -- | -- | n/a | n/a |
Significance level *** 1%; ** 5%; * 10%
| Indicators | In-program period | Post-program period | Total in- and post-program | ||||||
|---|---|---|---|---|---|---|---|---|---|
| Program start year | Additional year | 1st year | 2nd year | 3rd year | 4th year | 5th year | Total post | ||
| All former claimants | |||||||||
| 2002 to 2005 participants (n= 1,887) | |||||||||
| Employment earnings ($) | -$1,909*** | -$3,494*** | -$615 | $1,727*** | $3,033*** | $4,035*** | $4,432*** | $12,612*** | $7,209*** |
| Incidence of employment (percentage points) | -11.3*** | -5.7*** | 1.3 | 4.2*** | 4.4*** | 4.5*** | 3.9*** | n/a | n/a |
| EI benefits ($) | $657*** | $266*** | -$35 | $128 | $68 | $82 | $141 | $383 | $1,306*** |
| EI weeks (weeks) | 3.1*** | 1.3*** | -0.3 | 0.5 | 0.3 | 0.3 | 0.4 | 1.2 | 5.6*** |
| Social Assistance benefits ($) | -$66 | -$44 | -$71 | -$117** | -$160*** | -$165*** | -$180*** | -$692*** | -$802** |
| Dependence on income support (percentage points) | 9.3*** | 4.4*** | -1.3 | -0.7 | -1.7* | -2.1** | -1.9** | n/a | n/a |
| 2006 to 2008 participants (n=1,285) | |||||||||
| Employment earnings ($) | -$5,527*** | -$8,357*** | -$1,341** | $1,612*** | $1,961*** | -- | -- | $2,235 | -$11,644*** |
| Incidence of employment (percentage points) | -18.6*** | -13.6*** | -0.9 | 4.2*** | 5.5*** | -- | -- | n/a | n/a |
| EI benefits ($) | $770*** | -$191 | -$1,024*** | -$220 | $82 | -- | -- | -$1,162*** | -$583 |
| EI weeks (weeks) | 3.2*** | -0.1 | -3.0*** | -0.5 | 0.5 | -- | -- | -3.0*** | 0.1 |
| Social Assistance benefits ($) | $3 | -$106 | -$159** | -$226*** | -$204*** | -- | -- | -$590*** | -$693** |
| Dependence on income support (percentage points) | 14.0*** | 3.3*** | -8.0*** | -4.6*** | -2.5** | -- | -- | n/a | n/a |
| Sub-groups of former claimants | |||||||||
| Youth (below 30 years old) – 2002 to 2005 participants (n=833) | |||||||||
| Employment earnings ($) | -$1,979*** | -$4,041*** | -$440 | $1,852*** | $2,500*** | $3,432*** | $4,052*** | $11,396*** | $5,376 |
| Incidence of employment (percentage points) | -7.1*** | -6.1*** | 2.2 | 4.8*** | 3.7** | 3.6* | 2.6 | n/a | n/a |
| EI benefits ($) | $971*** | $576*** | -$81 | $270* | $161 | $224 | $132 | $707 | $2,254*** |
| EI weeks (weeks) | 4.1*** | 2.5*** | -0.7 | 0.9 | 0.3 | 0.4 | 0.3 | 1.3 | 7.9*** |
| Social Assistance benefits ($) | $62 | $57 | -$11 | -$133 | -$239*** | -$298*** | -$277*** | $-959*** | -$839 |
| Dependence on income support (percentage points) | 8.7*** | 8*** | -3.5** | -2.4 | -2.7* | -4.1*** | -3.5** | n/a | n/a |
| Long-tenured workers – 2007 to 2009 participants (n=267) | |||||||||
| Employment earnings ($) | -$6,408*** | -$8,445*** | -$2,201 | -$742 | -$1,477 | -- | -- | -$4,420 | -$19,273* |
| Incidence of employment (percentage points) | -14.7*** | -5.9** | -2.3 | -2.0 | 0.2 | -- | -- | n/a | n/a |
| EI benefits ($) | $802* | $504 | -$263 | $731 | $493 | -- | -- | $961 | $2,267 |
| EI weeks (weeks) | 2.9*** | 1.4 | -0.9 | 1.7 | 1.2 | -- | -- | 2.0 | 6.3 |
| Social Assistance benefits ($) | -$72 | $8 | -$84 | -$111 | -$173* | -- | -- | -$368 | -$433 |
| Dependence on income support (percentage points) | 11.3*** | 3.9 | -5.0 | 0.9 | 0.3 | -- | -- | n/a | n/a |
Significance level *** 1%; ** 5%; * 10%
| Total costs and benefits over participation period (2 years) and 6 years post-program | Active claimants (n=9,022) | Former claimants (n=1,887) |
|---|---|---|
| Program cost | -$9,237 | -$9,470 |
| Marginal social costs of public funds | -$1,133 | -$1,525 |
| Employment earnings (including participant’s forgone earnings) | $13,335 | $8,398 |
| Fringe benefit | $2,000 | $1,260 |
| Net present value (By how much do the benefits exceed the costs 6 years after participation?) | $4,965 | -$1,337 |
| Cost-benefit ratio (How much does it cost in EI part II funds to achieve $1 in benefit 6 years after participation?) | $0.70 | $1.20 |
| Payback period (How many years after participation would it take for the benefits to recover the costs?) | 5.1 years after participation | 6.3 years after participation |
Appendix C – Detailed results Skills Development-Apprenticeship
| Active claimants | Former Claimants | ||
|---|---|---|---|
| 2003 to 2005 | 2013 to 2014 | 2003 to 2005 | |
| Number of observations | 1,230 | 347 | 98 |
| Gender | |||
| Male | 86% | 98% | 70% |
| Female | 14% | 2% | 30% |
| Age | |||
| Under 25 | 40% | 14% | 35% |
| 25 to 34 | 41% | 49% | 44% |
| 35 to 44 | 15% | 25% | 17% |
| 45 to 54 | 4% | 10% | 4% |
| 55 and over | 0% | 2% | 0% |
| Skills level related to National Occupation Code associated with the last EI claim opened before EBSM participation1 | |||
| Managerial | 1% | 1% | 0% |
| University | 2% | 0% | 3% |
| College or apprenticeship training | 65% | 86% | 46% |
| Secondary school or occupational training | 15% | 4% | 21% |
| On-the-job training | 17% | 9% | 30% |
| Key Labour Market indicators in the year preceding the start of participation | |||
| Earnings including $02 | $21,429 | $30,0043 | $16,113 |
| Proportion employed | 99% | 99% | 97% |
| Proportion on EI | 42% | 56% | 61% |
| EI benefits collected | $1,836 | $2,8483 | $2,608 |
| Proportion on SA | 3% | 0% | 11% |
| SA benefits collected | $2 | $33 | $613 |
Proportions may not add up to 100% due to rounding.
1Skill level corresponds to the type and/or amount of training or education typically required to work in the last occupation participants had before opening the last EI claim they had before participating in EBSMs:
-Managerial: Management occupations
-University: Occupations usually requiring university education (that is, University degree at the bachelor's, master's or doctorate level)
-College or apprenticeship training: Occupations usually requiring college or vocational education or apprenticeship training such as 2 to 3 years of post-secondary education at a community college, institute of technology or CEGEP or 2 to 5 years of apprenticeship training or 3 to 4 years of secondary school and more than 2 years of on-the-job training, specialized training courses or specific work experience and/or occupations with supervisory responsibilities and occupations with significant health and safety responsibilities, such as firefighters, police officers and registered nursing assistants.
-Secondary or occupational training: Occupations usually requiring secondary school and/or occupation-specific training such as one to four years of secondary school education or up to 2 years of on-the-job training specialized training courses or specific work experience.
-On-the-job training: On-the-job training is usually provided for occupations (that is, short work demonstration or on-the-job training or no formal educational requirements).
2Average earnings for all individuals included in the studies. The average was calculated including participants who reported $0 earnings during that year.
3Earnings for 2006 to 2008 participants have been adjusted by the Consumer Price Index published by Statistics Canada, using 2002 as the base year.
| Average outcomes | Pre-program period | After the program start year | |||||||||||
|---|---|---|---|---|---|---|---|---|---|---|---|---|---|
| 5 year pre | 4 year pre | 3 year pre | 2 year pre | 1 year pre | Program start year | 1 year | 2 year | 3 year | 4year | 5 year | 6 year | 7 year | |
| Earnings including $0 | $13,631 | $15,950 | $17,232 | $19,214 | $23,314 | $20,824 | $24,657 | $31,020 | $37,485 | $43,487 | $46,218 | $48,123 | $48,295 |
| Earnings excluding $01 | $14,307 | $16,647 | $17,853 | $19,675 | $23,481 | $21,038 | $25,383 | $31,869 | $38,642 | $45,504 | $49,167 | $50,891 | $51,021 |
| Proportion employed | 95% | 96% | 97% | 98% | 99% | 99% | 97% | 97% | 97% | 96% | 94% | 95% | 95% |
| Proportion on EI | 35% | 40% | 44% | 42% | 46% | 99% | 79% | 63% | 53% | 42% | 37% | 35% | 34% |
| EI benefits | $1,470 | $1,712 | $2,123 | $2,099 | $2,085 | $4,973 | $3,787 | $2,922 | $2,616 | $2,406 | $2,508 | $2,492 | $2,286 |
| Number of weeks on EI | 6.21 | 6.77 | 7.62 | 7.41 | 7.06 | 16.98 | 12.47 | 8.8 | 7.21 | 6.31 | 6.27 | 6.1 | 5.61 |
| Proportion on Social Assistance | 4% | 5% | 4% | 4% | 3% | 2% | 3% | 2% | 2% | 3% | 3% | 2% | 3% |
| Social Assistance benefits | $180 | $163 | $144 | $138 | $78 | $43 | $75 | $85 | $100 | $117 | $154 | $140 | $171 |
| Dependence on income support | 12% | 13% | 13% | 12% | 10% | 24% | 20% | 12% | 10% | 9% | 10% | 9% | 8% |
| Proportion self employed | 7% | 9% | 9% | 8% | 10% | 12% | 14% | 16% | 19% | 19% | 20% | 21% | 19% |
1Earnings outcomes excluding individuals who reported no earnings in a given year.
| Average outcomes | Pre-program period | After the program start year | |||||||||||
|---|---|---|---|---|---|---|---|---|---|---|---|---|---|
| 5 year pre | 4 year pre | 3 year pre | 2 year pre | 1 year pre | Program start year | 1 year | 2 year | 3 year | 4year | 5 year | 6 year | 7 year | |
| Earnings including $0 | $10,633 | $11,529 | $13,986 | $15,754 | $17,299 | $18,866 | $19,972 | $26,023 | $32,911 | $36,957 | $40,157 | $40,321 | $35,691 |
| Earnings excluding $01 | $12,131 | $12,649 | $14,163 | $16,583 | $17,982 | $19,105 | $21,286 | $28,133 | $34,210 | $38,378 | $40,678 | $41,978 | $36,861 |
| Proportion employed | 88% | 91% | 99% | 95% | 96% | 99% | 94% | 93% | 96% | 96% | 99% | 96% | 97% |
| Proportion on EI | 38% | 43% | 56% | 60% | 61% | 65% | 67% | 49% | 39% | 37% | 40% | 38% | 41% |
| EI benefits | $1,378 | $2,012 | $2,401 | $2,779 | $2,715 | $2,032 | $3,161 | $2,262 | $1,899 | $2,446 | $2,749 | $2,772 | $2,838 |
| Number of weeks on EI | 7.12 | 8.43 | 10.71 | 12.01 | 10.93 | 9.55 | 14.24 | 8.89 | 6.1 | 7.29 | 8.24 | 8.68 | 6.79 |
| Proportion on Social Assistance | 14% | 11% | 11% | 14% | 13% | 11% | 7% | 6% | 6% | 5% | 3% | 4% | 8% |
| Social Assistance benefits | $589 | $586 | $382 | $616 | $730 | $320 | $186 | $204 | $275 | $151 | $105 | $193 | $292 |
| Dependence on income support | 20% | 21% | 20% | 26% | 24% | 18% | 28% | 19% | 12% | 13% | 13% | 16% | 11% |
| Proportion self employed | 9% | 8% | 4% | 5% | 5% | 9% | 7% | 10% | 14% | 12% | 15% | 18% | 21% |
1Earnings outcomes excluding individuals who reported no earnings in a given year.
Appendix D- Detailed results Employer Wage Subsidy
| Active claimants | Former claimants | |||
|---|---|---|---|---|
| 2002 to 2005 | 2006 to 2008 | 2002 to 2005 | 2006 to 2008 | |
| Number of observations | 2,024 | 388 | 3,327 | 814 |
| Gender | ||||
| Male | 57% | 54% | 55% | 62% |
| Female | 43% | 46% | 45% | 38% |
| Age | ||||
| Under 25 | 13% | 13% | 19% | 17% |
| 25 to 34 | 26% | 24% | 32% | 34% |
| 35 to 44 | 31% | 27% | 26% | 21% |
| 45 and over | 30% | 36% | 23% | 28% |
| Marital status | ||||
| Married or common-law | 50% | 49% | 46% | 48% |
| Widow/ divorced or separated | 13% | 11% | 13% | 11% |
| Single | 35% | 39% | 39% | 38% |
| Missing data / Unknown | 2% | 2% | 2% | 2% |
| Skills level related to National Occupation Code associated with the last EI claim opened before participation1 | ||||
| Managerial | 3% | 6% | 3% | 4% |
| University | 3% | 3% | 5% | 7% |
| College or apprenticeship training | 29% | 35% | 27% | 36% |
| Secondary or occupational training | 35% | 32% | 36% | 31% |
| On-the-job training | 30% | 24% | 29% | 21% |
| Key Labour Market indicators in the year preceding the start of participation | ||||
| Earnings2 | $14,235 | $14,8953 | $11,534 | $12,1923 |
| Proportion employed | 99% | 99% | 91% | 89% |
| Proportion on EI | 75% | 68% | 73% | 63% |
| Proportion on Social Assistance | 5% | 2% | 7% | 6% |
Proportions may not add up to 100% due to rounding.
1Skill level corresponds to the type and/or amount of training or education typically required to work in the last occupation participants had before opening the last EI claim they had before participating in EBSMs:
-Managerial: Management occupations
-University: Occupations usually requiring university education (that is, University degree at the bachelor's, master's or doctorate level)
-College or apprenticeship training: Occupations usually requiring college or vocational education or apprenticeship training such as 2 to 3 years of post-secondary education at a community college, institute of technology or CEGEP or 2 to 5 years of apprenticeship training or 3 to 4 years of secondary school and more than 2 years of on-the-job training, specialized training courses or specific work experience and/or occupations with supervisory responsibilities and occupations with significant health and safety responsibilities, such as firefighters, police officers and registered nursing assistants.
-Secondary or occupational training: Occupations usually requiring secondary school and/or occupation-specific training such as one to four years of secondary school education or up to 2 years of on-the-job training specialized training courses or specific work experience.
-On-the-job training: On-the-job training is usually provided for occupations (that is, short work demonstration or on-the-job training or no formal educational requirements).
2Average earnings for all individuals included in the studies. The average was calculated including participants who reported $0 earnings during that year.
3Earnings for 2006 to 2008 participants have been adjusted by the Consumer Price Index published by Statistics Canada, using 2002 as the base year.
| Indicators | In-program period | Post-program period | Total in- and post-program | ||||||||||||||
|---|---|---|---|---|---|---|---|---|---|---|---|---|---|---|---|---|---|
| Program start year | Additional year | 1st year | 2nd year | 3rd year | 4th year | 5th year | Total post | ||||||||||
| Active claimants | |||||||||||||||||
| 2002 to 2005 participants (n=2,024) | |||||||||||||||||
| Employment earnings ($) | $488*** | $958*** | $898*** | $813** | $999*** | $1,283*** | $1,415*** | $5,408*** | $6,854*** | ||||||||
| Incidence of employment (percentage points) | 3.4*** | 4.5*** | 2.6*** | 2.3*** | 2.7*** | 2.4*** | 2.1** | n/a | n/a | ||||||||
| EI benefits ($) | -$739*** | -$405*** | -$347*** | -$297*** | -$218** | -$139 | -$119 | -$1,120*** | -$2,264*** | ||||||||
| EI weeks (weeks) | -2.5*** | -0.7** | -0.9** | -0.7* | -0.6 | -0.5 | -0.5 | -3** | -6.3*** | ||||||||
| Social Assistance benefits ($) | -$45 | -$77** | -$64 | -$29 | -$38 | -$7 | $0 | -$139 | -$261 | ||||||||
| Dependence on income support (percentage points) | -6.2*** | -3*** | -1.2* | -0.7 | -0.8 | -0.2 | -0.5 | n/a | n/a | ||||||||
| 2006 to 2008 participants (n=388) | |||||||||||||||||
| Employment earnings ($) | $163 | $2,094** | $1,998** | $1,276 | $1,777** | -- | -- | $5,051* | $7,308** | ||||||||
| Incidence of employment (percentage points) | 5.1*** | 7.5*** | 7.6*** | 6.0*** | 7.7*** | -- | -- | n/a | n/a | ||||||||
| EI benefits ($) | -$571** | -$49 | $441 | $802** | $720** | -- | -- | $1,964** | $1,344 | ||||||||
| EI weeks (weeks) | -1.0 | 0.8 | 2.0** | 2.9*** | 2.2** | -- | -- | 7.2*** | 6.9* | ||||||||
| Social Assistance benefits ($) | $9 | -$63 | -$62 | -$98 | -$65 | -- | -- | -$225 | -$278 | ||||||||
| Dependence on income support (percentage points) | -3.9** | -0.7 | 1.8 | 4.0** | 3.6* | -- | -- | n/a | n/a | ||||||||
| Sub-groups of active claimants | |||||||||||||||||
| Youth (below 30 years old) – 2002 to 2005 participants (n=524) | |||||||||||||||||
| Employment earnings ($) | $920*** | $1,245*** | $1,150** | $320 | $507 | $887 | $544 | $3,406 | $5,570 | ||||||||
| Incidence of employment (percentage points) | 3.7*** | 3.7*** | 3.4** | 2.2 | 2.5 | 1 | 0.3 | n/a | n/a | ||||||||
| EI benefits ($) | -$1,049*** | -$823*** | -$860*** | -$520*** | -$359* | -$322 | -$163 | -$2,224*** | -$4,096*** | ||||||||
| EI weeks (weeks) | -3.6*** | -1.9*** | -2.2*** | -1 | -0.8 | -0.8 | -0.2 | -5* | -10.5*** | ||||||||
| Social Assistance benefits ($) | $19 | -$14 | $49 | $80 | $16 | $137 | $106 | $389 | $394 | ||||||||
| Dependence on income support (percentage points) | -8.9*** | -5*** | -5*** | -0.8 | -0.8 | 1.2 | 1 | n/a | n/a | ||||||||
| Long-tenured workers - 2007 to 2009 participants (n=403) | |||||||||||||||||
| Employment earnings ($) | -$1,962*** | -$1,140 | -$2,189** | -$2,826*** | -$2,441** | -- | -- | -$7,456*** | -$10,559*** | ||||||||
| Incidence of employment (percentage points) | 2.0*** | 3.2** | 2.0 | 2.7 | 2.8 | -- | -- | n/a | n/a | ||||||||
| EI benefits ($) | $388 | $363 | $414 | $715** | $356 | -- | -- | $1,486** | $2,236** | ||||||||
| EI weeks (weeks) | 0.4 | 1.3* | 1.5** | 1.8** | 0.9 | -- | -- | 4.1** | 5.7** | ||||||||
| Social Assistance benefits ($) | -$26** | -$46*** | -$22 | -$46** | -$49** | -- | -- | -$117** | -$189*** | ||||||||
| Dependence on income support (percentage points) | -1.2 | -0.3 | 2.3 | 3.9** | 1.9 | -- | -- | n/a | n/a | ||||||||
Significance level *** 1%; ** 5%; * 10%
| Indicators | In-program period | Post-program period | Total in- and post-program | ||||||||
|---|---|---|---|---|---|---|---|---|---|---|---|
| Program start year | Additional year | 1st year | 2nd year | 3rd year | 4th year | 5th year | Total post | ||||
| Former claimants | |||||||||||
| 2002 to 2005 participants (n=3,325) | |||||||||||
| Employment earnings ($) | $3,204*** | $2,891*** | $1,523*** | $925** | $1,652*** | $1,601*** | $1,487*** | $7,188*** | $13,283*** | ||
| Incidence of employment (percentage points) | 9.6*** | 7*** | 4.9*** | 3.8*** | 3.5*** | 4.4*** | 4.4*** | n/a | n/a | ||
| EI benefits ($) | $214*** | $635*** | $492*** | $338*** | $107 | $280*** | $213** | $1,430*** | $2,279*** | ||
| EI weeks (weeks) | 0.3 | 1.9*** | 1.4 *** | 0.7* | 0 | 0.5 | 0.3 | 2.8** | 5.1*** | ||
| Social Assistance benefits ($) | -$442*** | -$407*** | -$250*** | -$175*** | -$165*** | -$171*** | -$155*** | -$915*** | -$1,765*** | ||
| Dependence on income support (percentage points) | -6.5*** | -0.7 | 0.7 | 0.6 | -1 | -0.9 | -1.2* | n/a | n/a | ||
| 2006 to 2008 participants (n=814) | |||||||||||
| Employment earnings ($) | $3,563*** | $3,981*** | $3,153*** | $2,997*** | $3,742*** | -- | -- | $9,893*** | $17,439*** | ||
| Incidence of employment (percentage points) | 5.9*** | 5.0*** | 5.9*** | 3.6*** | 6.5*** | -- | -- | n/a | n/a | ||
| EI benefits ($) | -$151 | -$295** | -$135 | -$197 | -$360** | -- | -- | -$692 | -$1,137* | ||
| EI weeks (weeks) | 0.2 | -0.2 | 0.2 | 0.6 | -0.1 | -- | -- | 0.7 | 0.8 | ||
| Social Assistance benefits ($) | -$236*** | -$231*** | -$165*** | -$118** | -$137** | -- | -- | -$420** | -$887*** | ||
| Dependence on income support (percentage points) | -7.2*** | -3.3*** | -2.4** | -2.4* | -4.6*** | -- | -- | n/a | n/a | ||
| Sub-groups of former claimants | |||||||||||
| Youth (below 30 years old) – 2002 to 2005 participants (n=1,234) | |||||||||||
| Employment earnings ($) | $2,304*** | $2,645*** | $1,737*** | $1,513** | $1,968*** | $2,325*** | $2,569*** | $10,112*** | $15,061*** | ||
| Incidence of employment (percentage points) | 7.3*** | 5.8*** | 5.1*** | 3.7*** | 3.3** | 5.9*** | 6.6*** | n/a | n/a | ||
| EI benefits ($) | $420*** | $399*** | $358*** | $349** | $26 | $260 | $59 | $1,052* | $1,871*** | ||
| EI weeks (weeks) | 1.2** | 1.2** | 1.2** | 1.1* | -0.1 | 0.6 | 0 | 2.8 | 5.2* | ||
| Social Assistance benefits ($) | -$293*** | -$347*** | -$236*** | -$212*** | -$178** | -$251*** | -$250*** | -$1,128*** | -$1,767*** | ||
| Dependence on income support (percentage points) | -6.6*** | -1.8 | -1.1 | -0.7 | -2.6** | -3 ** | -3.4** | n/a | n/a | ||
| Long-tenured workers – 2007 to 2009 participants (n=520) | |||||||||||
| Employment earnings ($) | $3,403*** | $3,442*** | $3,333* | $1,219 | $2,575 | -- | -- | $7,126 | $13,971* | ||
| Incidence of employment (percentage points) | 8.9*** | 7.4*** | 8.3*** | 5.3** | 8.4*** | -- | -- | n/a | n/a | ||
| EI benefits ($) | $37 | -$64 | $338 | $43 | $168 | -- | -- | $549 | $522 | ||
| EI weeks (weeks) | 1.7** | 0.4 | 1.4 | 0.2 | 0.6 | -- | -- | 2.2 | 4.3 | ||
| Social Assistance benefits ($) | -$305*** | -$257*** | -$184*** | -$230*** | -$260*** | -- | -- | -$675*** | -$1,237*** | ||
| Dependence on income support (percentage points) | -7.9*** | 0.7 | -0.2 | -3.4 | -4.4* | -- | -- | n/a | n/a | ||
Significance level *** 1%; ** 5%; * 10%
| Total costs and benefits over participation period (2 years) and 6 years post-program | Active claimants (n=2,024) | Former claimants (n=-3,325) |
|---|---|---|
| Program cost | -$6,316 | -$4,416 |
| Marginal social costs of public funds | -$512 | -$268 |
| Employment earnings (including participant’s forgone earnings) | $7,146 | $13,455 |
| Fringe benefit | $1,072 | $2,018 |
| Net present value (By how much do the benefits exceed the costs 6 years after participation?) | $1,390 | $10,789 |
| Cost-benefit ratio (How much does it cost in EI part II funds to achieve $1 in benefit 6 years after participation?) | $0.80 | $0.30 |
| Payback period (How many years after participation would it take for the benefits to recover the costs?) | 5.1 years after participation | 2nd participation year |
Appendix E- Detailed results Self-Employment Benefit
| Active claimants | Former claimants | |||
|---|---|---|---|---|
| 2002 to 2005 | 2006 to 2008 | 2002 to 2005 | 2006 to 2008 | |
| Number of observations | 716 | 628 | 301 | 281 |
| Gender | ||||
| Male | 66% | 68% | 52% | 48% |
| Female | 34% | 32% | 48% | 52% |
| Age | ||||
| Under 25 | 4% | 3% | 7% | 3% |
| 25 to 34 | 33% | 28% | 29% | 31% |
| 35 to 44 | 36% | 38% | 35% | 31% |
| 45 and over | 26% | 30% | 29% | 34% |
| Marital status | ||||
| Married or common-law | 67% | 66% | 61% | 63% |
| Widow/ divorced or separated | 12% | 10% | 14% | 10% |
| Single | 20% | 22% | 24% | 23% |
| Missing data / Unknown | 1% | 2% | 1% | 4% |
| Skills level related to National Occupation Code associated with the last EI claim opened before participation1 | ||||
| Managerial | 10% | 8% | 8% | 9% |
| University | 11% | 9% | 12% | 11% |
| College or apprenticeship training | 36% | 43% | 35% | 32% |
| Secondary or occupational training | 30% | 29% | 27% | 36% |
| On-the-job training | 13% | 11% | 18% | 12% |
| Key Labour Market indicators in the year preceding the start of participation | ||||
| Earnings2 | $23,343 | $23,0863 | $12,745 | $10,1273 |
| Proportion employed | 99% | 99% | 89% | 82% |
| Proportion on EI | 60% | 63% | 82% | 75% |
| Proportion on Social Assistance | 2% | 2% | 6% | 4% |
Proportions may not add up to 100% due to rounding.
1Skill level corresponds to the type and/or amount of training or education typically required to work in the last occupation participants had before opening the last EI claim they had before participating in EBSMs:
-Managerial: Management occupations
-University: Occupations usually requiring university education (that is, University degree at the bachelor's, master's or doctorate level)
-College or apprenticeship training: Occupations usually requiring college or vocational education or apprenticeship training such as 2 to 3 years of post-secondary education at a community college, institute of technology or CEGEP or 2 to 5 years of apprenticeship training or 3 to 4 years of secondary school and more than 2 years of on-the-job training, specialized training courses or specific work experience and/or occupations with supervisory responsibilities and occupations with significant health and safety responsibilities, such as firefighters, police officers and registered nursing assistants.
-Secondary or occupational training: Occupations usually requiring secondary school and/or occupation-specific training such as one to four years of secondary school education or up to 2 years of on-the-job training specialized training courses or specific work experience.
-On-the-job training: On-the-job training is usually provided for occupations (that is, short work demonstration or on-the-job training or no formal educational requirements).
2Average earnings for all individuals included in the studies. The average was calculated including participants who reported $0 earnings during that year.
3Earnings for 2006 to 2008 participants have been adjusted by the Consumer Price Index published by Statistics Canada, using 2002 as the base year.
| Indicators | In-program period | Post-program period | Total in- and post-program | ||||||
|---|---|---|---|---|---|---|---|---|---|
| Program start year | Additional year | 1st year | 2nd year | 3rd year | 4th year | 5th year | Total post | ||
| Active claimants | |||||||||
| 2002 to 2005 participants (n= 716) | |||||||||
| Employment earnings ($) | -$9,717*** | -$11,259*** | -$7,866*** | -$5,209*** | -$4,394*** | -$3,527*** | -$2,189* | -$23,186*** | -$44,161*** |
| Incidence of employment (percentage points) | -11.8*** | -25.2*** | -26*** | -20.8*** | -20 *** | -16 *** | -14.2*** | n/a | n/a |
| EI benefits ($) | $3,261*** | -$1,406*** | -$2,625*** | -$2,160*** | -$1,838*** | -$1,609*** | -$1,623*** | -$9,855*** | -$7,999*** |
| EI weeks (weeks) | 8.5*** | -5.1*** | -8.3*** | -6.4*** | -5.4*** | -4.5*** | -4.2*** | -28.9*** | -25.5*** |
| Social Assistance benefits ($) | -$26 | -$35 | -$78** | -$49 | -$80** | -$56 | -$77** | -$339* | -$401* |
| Dependence on income support (percentage points) | 24.9*** | 6*** | -12.2*** | -10.2*** | -7.9*** | -7.1*** | -6.8*** | n/a | n/a |
| 2006 to 2008 participants (n=628) | |||||||||
| Employment earnings ($) | -$9,554*** | -$12,554*** | -$9,224*** | -$8,154*** | -$7,771*** | -- | -- | -$25,149*** | -$47,257*** |
| Incidence of employment (percentage points) | -11.4*** | -21.5*** | -26.7*** | -26.1*** | -20.2*** | -- | -- | n/a | n/a |
| EI benefits ($) | $3,165*** | -$1,654*** | -$3,297*** | -$2,804*** | -$2,512*** | -- | -- | -$8,613*** | -$7,101*** |
| EI weeks (weeks) | 8.2*** | -4.5*** | -8.6*** | -7.0*** | -6.1*** | -- | -- | -21.7*** | -17.9*** |
| Social Assistance benefits ($) | -$50* | -$70** | -$89*** | -$90** | -$85** | -- | -- | -$265** | -$385*** |
| Dependence on income support (percentage points) | 23.4*** | 4.1** | -14.9*** | -11.7*** | -10.6*** | -- | -- | n/a | n/a |
Significance level *** 1%; ** 5%; * 10%
| Indicators | In-program period | Post-program period | Total in- and post-program | ||||||
|---|---|---|---|---|---|---|---|---|---|
| Program start year | Additional year | 1st year | 2nd year | 3rd year | 4th year | 5th year | Total post | ||
| Former claimants | |||||||||
| 2002 to 2005 participants (n=299) | |||||||||
| Employment earnings ($) | -$5,429*** | $-6,504*** | -$6,421*** | -$4,475*** | -$5,585*** | -$4,587*** | -$3,723** | -$24,790*** | -$36,724*** |
| Incidence of employment (percentage points) | -21.6*** | -23.1*** | -24.3 *** | -21.8*** | -19.6*** | -15.6*** | -12.4*** | n/a | n/a |
| EI benefits ($) | $1,662*** | -$1,441*** | -$1,442*** | -$1,276*** | -$893*** | -$648*** | -$858*** | -$5,117*** | -$4,896*** |
| EI weeks (weeks) | 4.4*** | -5.7*** | -5.2*** | -4.2*** | -3*** | -1.9** | -2.1** | -16.4*** | -17.7*** |
| Social Assistance benefits ($) | -$367*** | -$261*** | -$78 | -$64 | -$178** | -$208** | -$245*** | -$772** | -$1,400*** |
| Dependence on income support (percentage points) | 17.8*** | -11.8*** | -9.6*** | -6.5*** | -7.8*** | -4.2** | -5*** | n/a | n/a |
| 2006 to 2008 participants (n=281) | |||||||||
| Employment earnings ($) | -$8,349*** | -$9,998*** | -$10,449*** | -$9,031*** | -$9,059*** | -- | -- | -$28,537*** | -$46,882*** |
| Incidence of employment (percentage points) | -23.3*** | -23.0*** | -29.0*** | -24.1*** | -19.3*** | -- | -- | n/a | n/a |
| EI benefits ($) | $446 | -$1,861*** | -$1,861*** | -$1,269*** | -$1,016*** | -- | -- | -$4,146*** | -$5,561*** |
| EI weeks (weeks) | 2.0** | -5.5*** | -5.4*** | -4.1*** | -2.6*** | -- | -- | -12.1*** | -15.6*** |
| Social Assistance benefits ($) | -$277*** | -$201** | -$117 | -$139 | -$140 | -- | -- | -$397 | -$875*** |
| Dependence on income support (percentage points) | 13.1*** | -11.5*** | -8.8*** | -7.9*** | -5.4*** | -- | -- | n/a | n/a |
Significance level *** 1%; ** 5%; * 10%
Appendix F - Detailed results Employment Assistance Services
| Active claimants | Former claimants | |||
|---|---|---|---|---|
| 2002 to 2005 | 2006 to 2008 | 2002 to 2005 | 2006 to 2008 | |
| Number of observations | 9,729 | 12,841 | 5,607 | 8,183 |
| Gender | ||||
| Male | 57% | 64% | 54% | 58% |
| Female | 43% | 36% | 46% | 42% |
| Age | ||||
| Under 25 | 16% | 13% | 17% | 15% |
| 25 to 34 | 31% | 25% | 33% | 30% |
| 35 to 44 | 28% | 26% | 25% | 25% |
| 45 and over | 26% | 36% | 25% | 30% |
| Marital status | ||||
| Married or common-law | 44% | 46% | 34% | 37% |
| Widow/ divorced or separated | 14% | 12% | 16% | 14% |
| Single | 40% | 40% | 46% | 45% |
| Missing data / Unknown | 2% | 2% | 4% | 4% |
| Skills level related to National Occupation Code associated with the last EI claim opened before participation1 | ||||
| Managerial | 3% | 3% | 2% | 4% |
| University | 5% | 4% | 4% | 4% |
| College or apprenticeship training | 27% | 28% | 23% | 25% |
| Secondary or occupational training | 39% | 39% | 36% | 38% |
| On-the-job training | 26% | 26% | 35% | 30% |
| Key Labour Market indicators in the year preceding the start of participation | ||||
| Earnings2 | $16,504 | $16,2633 | $8,646 | $10,9343 |
| Proportion employed | 98% | 99% | 83% | 87% |
| Proportion on EI | 69% | 72% | 68% | 65% |
| Proportion on Social Assistance | 6% | 5% | 20% | 14% |
Proportions may not add up to 100% due to rounding.
1Skill level corresponds to the type and/or amount of training or education typically required to work in the last occupation participants had before opening the last EI claim they had before participating in EBSMs:
-Managerial: Management occupations
-University: Occupations usually requiring university education (that is, University degree at the bachelor's, master's or doctorate level)
-College or apprenticeship training: Occupations usually requiring college or vocational education or apprenticeship training such as 2 to 3 years of post-secondary education at a community college, institute of technology or CEGEP or 2 to 5 years of apprenticeship training or 3 to 4 years of secondary school and more than 2 years of on-the-job training, specialized training courses or specific work experience and/or occupations with supervisory responsibilities and occupations with significant health and safety responsibilities, such as firefighters, police officers and registered nursing assistants.
-Secondary or occupational training: Occupations usually requiring secondary school and/or occupation-specific training such as one to four years of secondary school education or up to 2 years of on-the-job training specialized training courses or specific work experience.
-On-the-job training: On-the-job training is usually provided for occupations (that is, short work demonstration or on-the-job training or no formal educational requirements).
2Average earnings for all individuals included in the studies. The average was calculated including participants who reported $0 earnings during that year.
3Earnings for 2006 to 2008 participants have been adjusted by the Consumer Price Index published by Statistics Canada, using 2002 as the base year.
| Indicators | In-program period | Post-program period | Total in- and post-program | |||||
|---|---|---|---|---|---|---|---|---|
| 1st year | 2nd year | 3rd year | 4th year | 5th year | Total post | |||
| Active claimants | ||||||||
| 2002 to 2005 participants (n=9,729) | ||||||||
| Employment earnings ($) | -$1,966*** | -$374** | $805*** | $1,736*** | $1,860*** | $2,154*** | $6,182*** | $4,216*** |
| Incidence of employment (percentage points) | -0.3 | 1.1*** | 1** | 1.4*** | 0.5 | 1** | n/a | n/a |
| EI benefits ($) | $476*** | -$419*** | -$423*** | -$399*** | -$374*** | -$290*** | -$1,905*** | -$1,430*** |
| EI weeks (weeks) | 1.8*** | -1.2*** | -1.3*** | -1.2*** | -1.1*** | -0.8*** | -5.5*** | -3.7*** |
| Social Assistance benefits ($) | -$9 | $9 | $13 | -$4 | -$14 | -$8 | -$4 | -$12 |
| Dependence on income support (percentage points) | 4.8*** | -1.2*** | -1.1*** | -1.3*** | -1.2*** | -0.6* | n/a | n/a |
| 2006 to 2008 participants (n=12,841) | ||||||||
| Employment earnings ($) | -$1,774*** | $1,636*** | $2,528*** | $2,668*** | -- | -- | $6,832*** | $5,059*** |
| Incidence of employment (percentage points) | 1.1** | 3.1*** | 3.7*** | 3.8*** | -- | -- | n/a | n/a |
| EI benefits ($) | $974*** | -$117 | $6 | $183* | -- | -- | $72 | $1,046*** |
| EI weeks (weeks) | 3.2*** | 0.0 | 0.5* | 1.0*** | -- | -- | 1.5** | 4.7*** |
| Social Assistance benefits ($) | $5 | $47** | -$6 | -$27 | -- | -- | $14 | $19 |
| Dependence on income support (percentage points) | 7.6*** | 1.1* | 0.8 | 1.6*** | -- | -- | n/a | n/a |
| Sub-groups of active claimants | ||||||||
| Youth (below 30 years old) – 2002 to 2005 participants (n=3,088) | ||||||||
| Employment earnings ($) | -$815*** | -$101 | $493 | $1,840*** | $1,855*** | $2,271*** | $6,358*** | $5,543*** |
| Incidence of employment (percentage points) | 0 | 0.7 | 0.7 | 1.6** | 0.2 | 1 | n/a | n/a |
| EI benefits ($) | $181** | -$487*** | -$399*** | -$454*** | -$359*** | -$348*** | -$2,047*** | -$1,866*** |
| EI weeks (weeks) | 0.9*** | -1.4*** | -1.1*** | -1.3*** | -1.1*** | -1.1*** | -5.9*** | -5*** |
| Social Assistance benefits ($) | $0 | $47* | $50* | $43 | $42 | $46 | $229* | $230 |
| Dependence on income support (percentage points) | 3.4*** | -1.6** | -1.2* | -1.4** | -1 | -0.9 | n/a | n/a |
| Older workers (55 years old and over) – 2002 to 2005 participants (n=647) | ||||||||
| Employment earnings ($) | -$2,028*** | $684 | $1,692*** | $2,435*** | $2,566*** | $2,083** | $9,460*** | $7,432** |
| Incidence of employment (percentage points) | 2.1 | 4.6*** | 4.6** | 6.1*** | 6.4*** | 3.7 | n/a | n/a |
| EI benefits ($) | $695*** | -$282 | $40 | $220 | $355 | $318 | $651 | $1,347 |
| EI weeks (weeks) | 2.5*** | -0.1 | 0.2 | 0.8 | 0.9 | 0.7 | 2.4 | 4.9 |
| Social Assistance benefits ($) | -$27 | $96* | $93 | $140** | $73 | $73 | $476* | $449 |
| Dependence on income support (percentage points) | 4.4*** | -0.7 | 2.9** | 4*** | 4.5*** | 5.1*** | n/a | n/a |
| Long-tenured workers- 2007 to 2009 participants (n=1,446) | ||||||||
| Employment earnings ($) | -$4,463*** | -$2,717*** | -$698 | $121 | -- | -- | -$3,294* | -$7,757*** |
| Incidence of employment (percentage points) | -0.9 | -0.4 | 0.8 | 1.4 | -- | -- | n/a | n/a |
| EI benefits ($) | $1,314*** | $67 | -$606*** | -$349** | -- | -- | -$889** | $424 |
| EI weeks (weeks) | 3.2*** | 0.2 | -1.4*** | -0.6 | -- | -- | -1.8** | 1.4 |
| Social Assistance benefits ($) | $20 | $53** | $80*** | $37 | -- | -- | $170** | $189*** |
| Dependence on income support (percentage points) | 7.2** | 1.6* | -1.2 | -0.3 | -- | -- | n/a | n/a |
Significance level *** 1%; ** 5%; * 10%
| Cohorts | n= | In-program | Post-program period | Total impact post-program | Total impact in- and post- program | ||||
|---|---|---|---|---|---|---|---|---|---|
| 1 year | 2 years | 3 years | 4 years | 5 years | |||||
| Employment earnings | |||||||||
| 1 to 4 weeks | 1,555 | $183 | $1,332*** | $2,569*** | $3,643*** | $3,893*** | $4,756*** | $16,193*** | $16,376*** |
| 5 to 8 weeks | 984 | -$984*** | $1,224*** | $2,304*** | $3,049*** | $3,342*** | $2,594*** | $12,513*** | $11,529*** |
| 9 to 12 weeks | 889 | -$1,331*** | -$481 | $651 | $1,403** | $1,319* | $2,519*** | $5,411** | $4,080 |
| 2nd quarter | 2,323 | -$2,747*** | -$481* | $322 | $1,284*** | $1,380*** | $1,735*** | $4,240*** | $1,493 |
| 3rd quarter | 1,593 | -$4,370*** | -$1,130*** | -$18 | $425 | $356 | $249 | -$118 | -$4,488** |
| 4th quarter | 988 | -$4,454*** | -$290 | -$180 | $817 | $1,184* | $926 | $2,457 | -$1,996 |
| Incidence of employment | |||||||||
| 1 to 4 weeks | 1,555 | 1.5pp** | 0.8pp | 1.8pp* | 2.4pp** | 0.3pp | 0.9pp | n/a | n/a |
| 5 to 8 weeks | 984 | 0.7pp | 1.8pp* | 2.4pp** | 2.5pp** | 0.8pp | -0.2pp | n/a | n/a |
| 9 to 12 weeks | 889 | 0.2pp | -0.1pp | -0.4pp | 0.3pp | -0.3pp | 0.3pp | n/a | n/a |
| 2nd quarter | 2,323 | -0.9pp | 0.8pp | 0.9pp | 0.6pp | 0.3pp | 0.2pp | n/a | n/a |
| 3rd quarter | 1,593 | -2.8pp*** | -1.7pp** | -2.1pp** | -1.5pp | -2.1pp** | -2.5pp** | n/a | n/a |
| 4th quarter | 988 | -3.2pp*** | 0.5pp | -1.1pp | -0.2pp | -0.0pp | 0.4pp | n/a | n/a |
| EI benefits | |||||||||
| 1 to 4 weeks | 1,555 | -$213* | -$347*** | -$462*** | -$450*** | -$438*** | -$338*** | -$2,036*** | -$2,249*** |
| 5 to 8 weeks | 984 | $470*** | -$530*** | -$479*** | -$475*** | -$465*** | -$219 | -$2,167*** | -$1,697*** |
| 9 to 12 weeks | 889 | $704*** | -$421*** | -$353*** | -$480*** | -$428*** | -$610*** | -$2,292*** | -$1,587*** |
| 2nd quarter | 2,323 | $1,092*** | -$535*** | -$278*** | -$202* | -$248** | -$169 | -$1,432*** | -$340 |
| 3rd quarter | 1,593 | $1,019*** | -$936*** | -$739*** | -$643*** | -$477*** | -$374*** | -$3,168*** | -$2,149*** |
| 4th quarter | 988 | $525*** | -$1,281*** | -$587*** | -$608*** | -$442*** | -$249 | -$3,167*** | -$2,641*** |
* Significant at 10%; ** significant at 5%; *** significant at 1%
n= refers to the number of participants. It corresponds to 100% of participants. pp= percentage points
Note: For the estimations we have selected a 50% random sample among comparison group in each cohort due to their large number. We used 100% of participants.
| Cohorts (start of EAS-only after start of an EI claim) | 1 to 4 weeks | 5 to 8 weeks | 9 to 12 weeks | 2nd quarter | 3rd quarter | 4th quarter |
|---|---|---|---|---|---|---|
| (N=1,555) | (N=984) | (N=889) | (N=2,323) | (N=1,593) | (N=988) | |
| Time of Return to employment | 3.5wks*** | -0.3wks | -0.8wks** | -2.9wks*** | -3.9wks*** | -3.6wks*** |
* Significant at 10%; ** significant at 5%; *** significant at 1%
Note that, for the estimations we have selected 50% random sample, in each cohort, among comparison group due to their large number. We used 100% of participants.
Note: The means of the standardized bias reduction after matching was calculated as suggested by Rosenbaum and Rubin (1985). The overall bias after matching lies between 3% and 15% which is generally considered as acceptable in empirical research papers.
| Total costs and benefits over participation period (1 year) and 6 years post-program | Active claimants (n=9,729) |
|---|---|
| Program cost | -$658 |
| Marginal social costs of public funds | $270 |
| Employment earnings (including participant’s forgone earnings) | $4,928 |
| Fringe benefit | $739 |
| Net present value (By how much do the benefits exceed the costs within 6 years after participation?) | $5,280 |
| Cost-benefit ratio (How much does it cost in EI part II funds to achieve $1 in benefit 6 years after participation?) | $0.10 |
| Payback period (How many years after participation would it take for the benefits to recover the costs?) | 3.4 years after participation |
Appendix G – List of nine studies included in the synthesis report
| Study | Evidence generated | Methods | Reference period | Observation period |
|---|---|---|---|---|
| Profile, Outcomes and Net Impacts of Employment Benefits and Support Measures (EBSM) Participants in New Brunswick (Completed in 2014) | - Incremental impacts for participants including youth and older workers - Profile and socio-demographic characteristics of participants | - Non-experimental method using propensity score matching in combination with Difference-in-Differences - Statistical profiling | 2002 to 2005 participants | 7 years between 2002 and 2011 (that is, 2 years in program and 5 years post-program) |
| Effects of the Timing of Participation in Employment Assistance Services in New Brunswick (Completed in 2014) | - Incremental impacts | - Non-experimental method using propensity score matching in combination with Difference-in-Differences - Statistical profiling | ||
| Cost-Benefit Analysis of Employment Benefits and Support Measures Delivered in New Brunswick (Completed in 2016) | - Cost-benefit analysis | - Non-experimental method using propensity score matching in combination with Difference-in-Differences - Cost analysis | 8 years between 2002 and 2013 (that is, 2 years in-program and 6 years post-program) | |
| Analysis of EBSMs Profile, Outcomes and Incremental Impacts for 2006 to 2008 Participants in New Brunswick (Completed in 2015) | - Incremental impacts - Profile and socio-demographic characteristics of participants | - Non-experimental method using propensity score matching in combination with Difference-in-Differences - Statistical profiling | 2006 to 2008 participants | 5 years between 2007 and 2012 (that is, 2 years in-program and 3 years post-program) |
| Analysis of EBSMs Profile, Outcomes, and Incremental Impacts for EI Claimants Category “Long-Tenured Workers” in New Brunswick (Completed in 2016) | - Incremental impacts - Profile and socio-demographic characteristics of participants | - Non-experimental method using propensity score matching in combination with Difference-in-Differences - Statistical profiling | 2007 to 2009 participants | 5 years between 2007 and 2013 (that is, 2 years in-program and 3 years post-program) |
| Study on Employment Assistance Services: New Brunswick (Completed in 2014) | - Program design and delivery - Challenges and lessons learned | - 11 key informants interviews - Literature and document review | Design and delivery at the time of the data collection (that is, 2013) | |
| Study on Employer Wage Subsidy (EWE) in New Brunswick (Completed in 2016) | - Program design and delivery - Challenges and lessons learned | - 5 key informants interviews - Literature and document review - Questionnaire completed by New Brunswick officials | Design and delivery at the time of the data collection (that is, 2015) | |
| Study on Training and Skills Development Program in New Brunswick (Completed in 2016) | - Program design and delivery - Challenges and lessons learned | - 4 key informants interviews - Literature and document review - Questionnaire completed by New Brunswick officials | ||
| Study on Skills Development – Apprenticeship in New Brunswick (Completed in 2016) | - Program design and delivery - Challenges and lessons learned | - 3 key informants interviews - Literature and document review - Questionnaire completed by New Brunswick officials | ||