
Evaluation of the Canada – Prince Edward Island Labour Market Development Agreement

Evaluation of the Canada – Prince Edward Island Labour Market Development Agreement Synthesis Report [PDF - 755 KB]
Large print, braille, MP3 (audio), e-text and DAISY formats are available on demand by ordering online or calling 1 800 O-Canada (1-800-622-6232). If you use a teletypewriter (TTY), call 1-800-926-9105.
Executive summary
Introduction
During the period between 2012 and 2017, Employment and Social Development Canada (ESDC) worked jointly with Prince Edward Island and 11 other Provinces and Territories (P/Ts) to carry out the second cycle of the Labour Market Development Agreement (LMDA) evaluation. The first cycle of LMDA evaluation was carried out between 1998 and 2012 and involved conducting bilateral formative and summative evaluations in all P/Ts. Under the second cycle, the evaluation work consisted of conducting two to three studies per year on the Employment Benefits and Support Measures (EBSMs) similar programming delivered under these agreements. The second cycle included a cohort of individuals who participated in programs and services between 2002 and 2005 and they were the subject of the main incremental impact study and the cost benefit analysis study. The studies generated evaluation evidence on the effectiveness, efficiency and design/delivery of EBSMs for Canada overall, for Prince Edward Island and for the 11 other P/Ts that opted for a joint evaluation process with Canada.
Under LMDAs, Canada transfers $2.14B in Employment Insurance (EI) Part II funds to the P/Ts for the design and delivery of programs and services to help unemployed individuals, mainly those eligible for EI, find and maintain employment.
Responsibility for the design and delivery of LMDA programs and services was devolved to Prince Edward Island in October 2009. Prior to that, programs and services were co-managed by Service Canada and the province.
Programs and services delivered by Prince Edward Island have to correspond to the EBSM categories defined under the EI Act. The following is a short description of the five categories of programs and services examined in the evaluation:
- Skills Development (Training PEI, including Apprentices) helps participants obtain employment skills by giving them financial assistance in order to attend classroom training.
- Targeted Wage Subsidies (Employ PEI) helps participants obtain on-the-job work experience by providing employers with a wage subsidy.
- Self-Employment (Self Employ PEI) provides financial assistance and business planning advice to participants to help them start their own business.
- Job Creation Partnerships (Work Experience PEI) provides participants with opportunities to gain work experience that will lead to ongoing employment. Employment opportunities are provided by projects that contribute to developing the community and the local economy.
- Employment Assistance Services helps participants with support for counselling, job search, planning for skills development, job placement services, and the provision of labour market information and case management.
Three additional programs and services are available under the LMDAs: Labour Market Partnerships, Research and Innovation, and Targeted Earnings Supplements. They were not evaluated as part of this evaluation. The Targeted Earnings Supplements program was not used in Prince Edward Island while the Labour Market Partnerships and Research and Innovation programs will be evaluated at a later stage.
Table i provides an overview of the share of funding allocated to the five EBSMs examined under the second cycle for LMDA evaluation in Prince Edward Island and the average cost per intervention.
Table i. Share of LMDA funding and average cost per intervention in Prince Edward Island
| Program and service | Share of funding 2014 to 2015 |
Average cost per intervention 2002 to 2005 |
|---|---|---|
| Training PEI (including Apprentices) | 53% | $8,242 |
| Employment Assistance Services | 18% | $947 |
| Employ PEI | 8% | $4,196 |
| Self Employ PEI | 6% | $5,486 |
| Work Experience PEI | 5.5% | $9,874 |
| Total | 90.5%* | – |
Sources: EI Monitoring and Assessment Reports 2002 to 2003 to 2014 to 2015.
*Investments in Labour Market Partnerships and Research and Innovation represented 9.5% of EBSM expenditures in 2014 to 2015.
This report presents a summary of the findings from six studies produced on Prince Edward Island LMDA interventions and participants. Results are presented for active and former EI claimants, as well as for youth (under 30 years old) and long-tenured workersFootnote 1 when the number of participants was sufficient to conduct quantitative analyses. Active EI claimants are classified as those who were receiving EI benefits at the time of their EBSM participation. Former EI claimants received EI up to three years before starting their EBSM participation.
Key findings
Overall, incremental impacts, cost-benefit analysis and labour market outcomes demonstrate that LMDA programs and services are generally helping participants to improve their labour market attachment after participation.
Incremental impacts demonstrate that active and former EI claimants who participated in Training PEI and Employ PEI had gains in earnings and incidence of employment when compared to similar non-participants. As well, active EI claimants who participated in Employ PEI and Employment Assistance Services had reductions in EI use after program participation. Former claimants who participated in Employ PEI reduced their use of social assistance. The social benefits of participation exceeded the cost of the interventions over time.
Labour market outcomes demonstrate that participants in the Work Experience PEI program showed higher average earnings and lower average proportions on EI and social assistance during the five years after program participation when compared to five years prior.
Effectiveness and efficiency for Training PEI, Employ PEI and Employment Assistance Services
Participants in Training PEI and Employ PEI have a higher probability of being employed than comparison group members
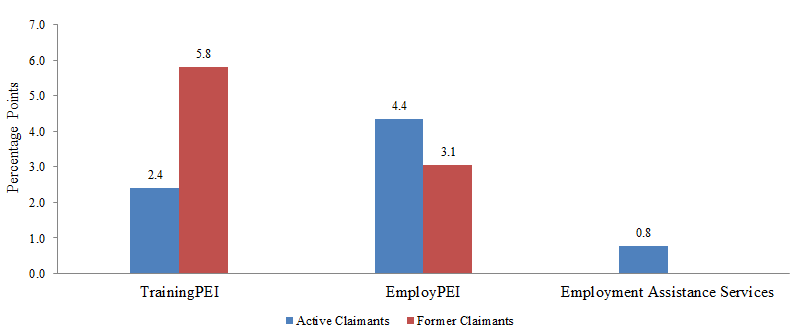
As shown in Figure i, active EI claimants who participated in Training PEI and Employ PEI had a higher probability of being employed (in other words, they increased their incidence of employment) compared to similar non-participants. As well, former EI claimants who participated in Training PEI had a higher probability of being employed compared to EI claimants who received low intensity interventions under Employment Assistance Services. Former EI claimants who participated in Employ EI had short-term increase in the probability of employment.
Active EI claimants who participated in Employment Assistance Services in 2002 to 2005 did not experience an increase probability of being employed compared to similar non-participants. However, participants in the 2007 to 2008 cohort did experience increased probability of employment compared to non-participants. It is noted that Employment Assistance Services are relatively modest activities such as counselling, job search assistance and case management. By themselves, they are not expected to lead to substantial effects on labour market outcomes.
Text description of Figure i
| Percentage points | ||
|---|---|---|
| Active Claimants | Former Claimants | |
| TrainingPEI | 2.4 | 5.8 |
| EmployPEI | 4.4 | 3.1* |
| Employment Assistance Services | 0.8* | |
* The estimates are not statistically significant at the 95% confidence level.
Note: outcomes for participants in Training-on-the-Job should be interpreted with caution given the small number of participants (62 for active claimants and 64 for former claimants).
Increased earnings for participants in Training PEI and Employ PEI compared to comparison group members
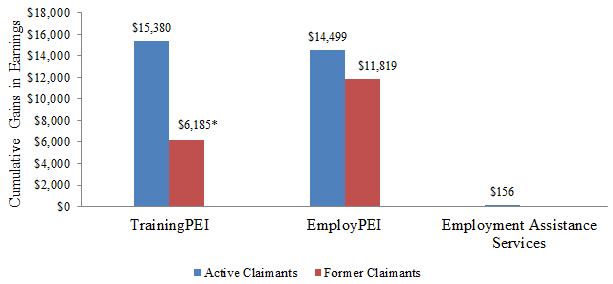
As shown in Figure ii, active EI claimants who participated in Training PEI and Employ PEI increased their employment earnings compared to similar non-participants. As well, former EI claimants who participated in Training PEI and Employ PEI increased their employment earnings compared to EI claimants who received Employment Assistance Services exclusively.
As previously indicated, Employment Assistance Services are relatively modest activities and, by themselves, are not expected to lead to substantial effects on labour market outcomes. In other words, these services aim to support the return to work of unemployed participants and not necessarily to secure a better paying job than pre-participation
Text description of Figure ii
| Cumulative Gains in Earnings | ||
|---|---|---|
| Active Claimants | Former Claimants | |
| TrainingPEI | $15,380 | $6,185* |
| EmployPEI | $14,499 | $11,819 |
| Employment Assistance Services | $156* | |
* The estimates are not statistically significant at the 95% confidence level. The estimate for former claimants who participated in Training PEI is statistically significant at the 90% confidence level only. However, these participants did experience statistically significant increases in earnings at the 95% confidence level in year 4 and 5 following participation.
Social benefits of participation exceeded costs of investments for all interventions.
As shown in Table ii, social benefits to participation exceeded investment costs in a period ranging between the first year after program participation to just over 11 years after participation.
| Training PEI | Employ PEI | Employment Assistance Services | |
|---|---|---|---|
| Active claimants | 5.1 | 3.9 | 8.9 |
| Former claimants | 11.5 | 1st year post-program | n/a |
Labour market outcomes for participants in Work Experience PEI
Active and former EI claimants who participated in Work Experience PEI in 2002 to 2005 had higher average earnings during the five years following participation when compared to five years prior. As well, the average proportion of participants on EI and social assistance is generally lower following participation. Finally, the average proportion of participants employed is lower following program participation. Possible explanations for the decrease in the proportion of participants employed may include retirement decisions, and the fact that some participants may not have benefitted from program participation while others simply left the labour force for various reasons. These labour market outcomes should be interpreted with caution given the small number of active (n=161) and former (n=86) EI claimants’ participants.
Main challenges about program design and delivery
Key informant interviews with service providers and program managers, as well as the reviewed documents and questionnaires completed by Prince Edward Island representatives, revealed few challenges about program design and delivery. Key challenges and barriers for Employ PEI and Employment Assistance Services are highlighted below.
Employ PEI
- Managing employers’ expectations of the participants and ensuring that the program is adequately explained and understood by employers
- Explaining to employers that well-trained and well-matched participants are more valuable to them than the subsidy
Employment Assistance Services
Key informants indicated that service providers are expected to use labour market information to support the programs and services. However, they also mentioned that available labour market information is limited, difficult to access, lacks local context, and is time consuming to obtain.
According to key informants, other challenges with respect to the design and delivery of Employment Assistance Services included:
- Lack of awareness about Employment Assistance Services among potential participants
- Service providers limit their hours of services and job coaching based on the amount of funding in the service contract
- Transportation is an issue in Prince Edward Island, especially in rural areas
- Lack of program flexibility to fund short-term job placements and to provide support for employed individuals working in low-paying jobs that are well below their skill set
Recommendations
A total of six recommendations emerge from the evaluation findings. They are as follows:
A study on the timing of participation in Employment Assistance Services at the national level revealed that receiving assistance early after starting an EI claim can lead to better labour market impacts. As well, key informants reported a lack of awareness about Employment Assistance Services in Prince Edward Island.
Recommendation 1: Consideration should be given to providing Prince Edward Island with timely access to data on new EI recipients for supporting targeting and increasing awareness.
According to key informants, the main labour market barriers experienced by LMDA participants are related to low educational attainment, skills mismatch, learning disabilities and literacy issues.
Recommendation 2: Literacy/essential skills training and learning disability assessments are essential steps in supporting individuals facing multiple barriers to prepare for vocational training and to reintegrate into the labour market. The measures should be reported separately from other Training PEI interventions given their unique objectives.
Key informants confirmed the necessity of having labour market information to support the delivery of Employment Assistance Services. They, however, pointed to the difficulty of accessing or producing labour market information at the regional/local level.
Recommendation 3: Consideration should be given to enhance the capacity of service providers to access or produce, when needed, relevant local labour market information.
The evaluation was not able to produce a conclusive assessment of Self Employ PEI effectiveness and efficiency since the income tax records used to assess impacts on earnings may not be the best source of information available to reflect the financial wellbeing of participants. As well, it is not clear whether participants’ success in improving their labour market attachment through self-employment is more closely associated with their business idea and their entrepreneurship skills or the assistance provided under Self Employ PEI.
Recommendation 4: Consideration should be given to examine in more detail the design and delivery of Self Employ PEI and whether the performance indicators for this program are appropriate
Labour market outcomes produced for Work Experience PEI participants showed a general improvement in their labour market attachment in terms of increased earnings and reduced use of EI and social assistance. However, the evaluation has not yet examined the design and delivery of the program. Therefore, a lot remains unknown about how this program operates and the factors that contribute to its effectiveness.
Recommendation 5: Consideration should be given to examine the design and delivery of the Work Experience PEI program to better understand how this program operates.
Overall, the LMDA evaluation was able to produce a sound assessment of EBSM effectiveness and efficiency because the team had access to rich data on EI claimants, EBSM participation data and Canada Revenue Agency taxation files. However, some data gaps limited the evaluation’s ability to assess how EBSMs operate.
Recommendation 6: Improvements in the data collection process are recommended to address key program and policy questions of interest to the federal and provincial/territorial governments.
Specifically:
- Collect data on whether participants are members of designated groups including Indigenous peoples, persons with disabilities and recent immigrants.
- Collect data on the type of training funded under Training PEI and the type of assistance provided under Employment Assistance Services. Prince Edward Island, ESDC and other P/Ts should work together to define common categories for both EBSMs.
Management response
The Department of Workforce and Advanced Learning accepts the evaluation recommendations and has responded to the following actions in relation to the conclusions of this evaluation:
Recommendation 1: Consideration should be given to providing Prince Edward Island with timely access to data on new EI recipients for supporting targeting and increasing awareness.
Response: Prince Edward Island is open to exploring the implementation of targeting and referral for targeted active EI applicants. However, this will require further analysis and discussion at the senior policy level. Furthermore, Prince Edward Island will need to assess the impact that this new requirement will have on its existing service delivery model.
Recommendation 2: Literacy/essential skills training and learning disability assessments are essential steps in supporting individuals facing multiple barriers to prepare for vocational training and to reintegrate into the labour market. The measures should be reported separately from other Training PEI interventions given their unique objectives.
Response: Prince Edward Island provides a wide range of programs and services in order to assist Islander’s in completing their high school education and upgrade or obtain credits required for post-secondary studies. The province absorbs the cost of tuition for adult education programs which ensures access for all Islanders. Prince Edward Island is currently in discussions with the federal government regarding the Performance Measurement Strategy under the Amended LMDA which will include various streams under skills development.
Recommendation 3: Consideration should be given to enhance the capacity of service providers to access or produce, when needed, relevant local labour market information.
Response: Prince Edward Island is an active member of the Labour Market Information Council’s Board of Directors. Prince Edward Island will work collaboratively with the FLMM and the Labour Market Information Council to ensure the direction and priorities of this new organization meet provincial needs to access relevant and timely labour market information. From a provincial perspective, the Department of Workforce and Advanced Learning assembles and provides local labour market information to its partners to ensure training institutions, students, service providers, employers and workers have access to relevant and timely labour market information to inform their decision making.
Recommendation 4: Consideration should be given to examine in more detail the design and delivery of Self Employ PEI and whether the performance indicators for this program are appropriate.
Response: Prince Edward Island consistently reviews the design and delivery of all its programs and services. In principle, Prince Edward Island has agreed to endorse the Performance Measurement Strategy that will be associated with the renewed labour market transfer agreements. With the implementation of the Performance Measurement Strategy, new indicators have been identified for all programs and services under the LMDA including Self Employment. Prince Edward Island is open to exploring the possibility of participating in a future study of Self Employ PEI.
Recommendation 5: Consideration should be given to examine the design and delivery of the Work Experience PEI program to better understand how this program operates.
Response: Prince Edward Island consistently reviews the design and delivery of all its programs and services. In principle, Prince Edward Island has agreed to endorse the Performance Measurement Strategy that will be associated with the renewed labour market transfer agreements. With the implementation of the PMS, new indicators have been identified for all programs and services under the LMDA including Work Experience PEI (Job Creation Partnership). Prince Edward Island is open to exploring the possibility of participating in a future study of Work Experience PEI.
Recommendation 6: Improvements in the data collection process are recommended to address key program and policy questions of interest to the federal and provincial/territorial governments.
Specifically:
- Collect data on whether participants are members of designated groups including Indigenous peoples, persons with disabilities and recent immigrants.
- Collect data on the type of training funded under Training PEI and the type of assistance provided under Employment Assistance Services. Prince Edward Island, ESDC and other P/Ts should work together to define common categories for both EBSMs.
Response: In principle, Prince Edward Island has agreed to endorse the Performance Measurement Strategy that will be associated with the renewed labour market transfer agreements. With the implementation of the new Performance Measurement Strategy, detailed performance indicator information identifies data collection methodologies, frequency of reporting, data sources and data elements for all programs and services as well as participant and employer indicators under the amended LMDA.
1. Introduction
During the period between 2012 and 2017, Employment and Social Development Canada (ESDC) worked jointly with Prince Edward Island and 11 other Provinces and Territories (P/Ts) to carry out the 2012 to 2017 second cycle of the Labour Market Development Agreement (LMDA) evaluations. The first cycle of the LMDA evaluation was carried out between 1998 and 2012 and involved the conduct of bilateral formative and summative evaluations in all P/Ts. Under the second cycle, the evaluation work consisted of conducting two to three studies per year on the Employment Benefits and Support Measures (EBSMs) similar programming delivered under these agreements. The second cycle included a cohort of individuals who participated in programs and services between 2002 and 2005 and they were the subject of the main incremental impact study and the cost benefit analysis study. The studies generated evaluation evidence on the effectiveness, efficiency and design/delivery of EBSMs for Canada overall, for Prince Edward Island, and for the 11 other P/Ts that opted for a joint evaluation process with the Government of Canada.
This report presents a summary of the findings from studies conducted for Prince Edward Island and it is organised as follows:
- Introduction with an overview of the studies summarized in this report including their scope and methodology, and contextual information on the LMDAs
- Findings section with a discussion around the rationale for investing in labour market programming and a summary of evaluation evidence
- Comparison of key findings by program type
- Conclusions and lessons learned
- Recommendations that emerged from the evaluation findings
1.1 Labour Market Development Agreement background
LMDAs are bilateral agreements between Canada and each P/T, and were established under Part II of the 1996 Employment Insurance (EI) Act. As part of these agreements, Canada transfers $2.14B annually in EI Part II funding to P/Ts in order to design and deliver programs and services to assist individuals to prepare for, obtain and maintain employment. Specifically, Prince Edward Island receives approximately $23.2M in EBSM funding each year.
The Canada-Prince Edward Island LMDA was signed on May 22, 2009. The agreement transferred responsibility for the design and delivery of programs and services to Prince Edward Island. Programs and services are classified under two categories: 1) Employment Benefits and 2) Support Measures. Prior to 2009, programs and services were co-managed by Service Canada and the province.
Employment benefits
Employment Benefits funded under the LMDAs are offered to unemployed individuals who 1) are actively on EI (active claimants); 2) ended their benefit period within three years before participating (former claimants); or 3) established a claim for maternity or parental benefits within the past five years and are returning to the labour force for the first time (former claimants)Footnote 2. Employment Benefits include the following categories:
- Skills Development (Training PEI, including Apprentices) helps participants obtain employment skills by giving them financial assistance that enables them to select, arrange and pay for classroom training.
- Targeted Wage Subsidies (Employ PEI) helps participants obtain on-the-job work experience by providing employers with financial assistance to help with the wages of participants.
- Self-Employment (Self Employ PEI) provides financial assistance and business planning advice to EI-eligible participants to help them start their own business. This financial assistance is intended to cover personal living expenses and other types of expenses during the initial stages of the business.
- Job Creation Partnerships (Work Experience PEI) provides participants with opportunities to gain work experience that will lead to ongoing employment. Employment opportunities are provided by projects that contribute to developing the community and the local economy.
- Targeted Earnings Supplements encourages unemployed persons to accept employment by offering them financial incentives. This program was not offered in Prince Edward Island and therefore not covered by the evaluation.
Support measures
Support Measures are available to all unemployed individuals including those not eligible to receive EI and include:
- Employment Assistance Services helps participants with support for individual counselling, action planning, help with job search, planning for skills development, job-finding clubs, job placement services, the provision of labour market information, and case management and follow-up.
- Labour Market Partnerships provides funding to help employers, employee and employer associations, and communities improve their capacity to deal with human resource requirements and implement labour force adjustments. These partnerships involve developing plans and strategies, and implementing labour force adjustment measures. This support measure was not covered by the evaluation.
- Research and Innovation supports activities that identify better ways of helping people prepare for or keep employment and be productive participants in the labour force. Funds are provided to eligible recipients to enable them to carry out demonstration projects and research for this purpose. This support measure was not covered by the evaluation.
Table 1 provides an overview of the share of funding allocated to the five EBSMs examined under the second cycle for LMDA evaluation in Prince Edward Island and the average cost per intervention. It is noted that the average cost per intervention was calculated based on the 2002 to 2005 data from the EI Monitoring and Assessment Reports. The 2002 to 2005 period corresponds to the cohort of participants selected for incremental impact and cost-benefit analysis in the LMDA evaluation.
Table 1. Share of LMDA funding and average cost per intervention in Prince Edward Island
| Program and service | Share of funding 2014 to 2015 |
Average cost per intervention 2002 to 2005 |
|---|---|---|
| Training PEI (including Apprentices) | 53% | $8,242 |
| Employment Assistance Services | 18% | $947 |
| Employ PEI | 8% | $4,196 |
| Self Employ PEI | 6% | $5,486 |
| Work Experience PEI | 5.5% | $9,874 |
| Total | 90.5%* | – |
Sources: EI Monitoring and Assessment Reports 2002-2003 to 2014-2015.
*Investments in Labour Market Partnerships and Research and Innovation represented 9.5% of EBSM expenditures in 2014-2015.
1.2 Methodology
This section presents key aspects of the quantitative analyses carried out as part of the LMDA studies, while a more detailed description of the methodology is provided in Appendix A.
All quantitative analyses were based on administrative data from the EI Part I (EI claim data) and Part II (EBSM participation data collected by Prince Edward Island and transferred to ESDC) databanks that were linked to T1 and T4 taxation files from the Canada Revenue Agency. Incremental impact analyses and cost-benefit analyses were based on 100% of participants in the reference period selected.
Incremental impacts analysis
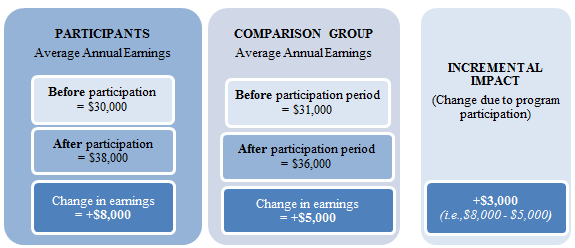
Four studies assessed program effectiveness by estimating incremental impacts from EBSM participation on participants’ labour market experience (including,earnings from employment/self-employment, incidence of employment, use of EI or social assistance and dependence on income support) after participation. The role of the incremental impact analysis is to isolate the effects of participation from other factors such as the economic cycle. In order to achieve this, the incremental impact analyses compared the labour market experience of participants before and after their participation with that of non-participants (see the Example of Incremental Impact Calculation in Figure 1).
Text description of Figure 1
| Participants | |||
|---|---|---|---|
| Average Annual Earnings | Before participation | After participation | Change in earnings |
| $30,000 | $38,000 | $8,000 | |
| Comparison Group | |||
| Average Annual Earnings | Before participation | After participation | Comparison Group |
| $31,000 | $36,000 | $5,000 | |
| Incremental Impact (Change due to program participation): + $3,000 (in other words, $8,000 - $5,000) | |||
The matching of participants and comparison group members used up to 75 socio-demographic and labour market variables observed over five years before participation. Two different comparison groups were used to measure impacts for active and former EI claimants. For active claimants, the incremental impacts were measured relative to a comparison group of active claimants who were eligible to participate in EBSMs but did not during the reference period.
Former claimants can be underemployed and unable to requalify for EI, out of the labour force for various reasons or on social assistance. Based on previous evaluation methodologies, on expert advice and given the difficulty in generating a suitable comparison for former claimants using administrative data alone, the comparison group for former claimants was created using individuals who participated in Employment Assistance Services only during the reference period. This is a conservative approach given the fact that participation in Employment Assistance Services can lead to limited effects on labour market outcomes. In other words, the experience of former claimants who received Employment Benefits (such as, Training PEI, Employ PEI, Self Employ PEI and Work Experience PEI) was compared to the experience of former claimants who received low intensity employment services (that is, Employment Assistance Services only). Due to this difference in measurement, incremental impacts estimated for active claimant participants should not be directly compared to those of former claimant participants.Footnote 3
The number of participants was sufficient in order to estimate the incremental impacts for active and former EI claimants who were youth (under 30 years old) and long-tenured workers. Long-tenured workers refer to individuals who had long-term attachment to the labour market but not necessarily a long tenure with the same employer.
Factors accounted for in the cost-benefit analysis
Program efficiency was assessed through a cost-benefit analysis which compared the cost of participating in the program for the participants and the cost of delivering the program for the government to the benefits generated by the program. Overall, this analysis provided insight on the extent to which the program is efficient for the society (that is, for both the participants and the government). The costs and benefits accounted for in the calculations were as follows (see detailed definitions in Appendix A):
- Program cost includes program and administration costs paid by the government
- Marginal social costs of public funds represent the loss incurred by society when raising additional revenues such as taxes to fund government programs
- Employment earnings consist of incremental impacts on participants’ earnings during and after participation. The calculation accounts for the participant’s forgone earnings during participation (in other words, the opportunity cost). Employment earnings were also increased by 15% to account for fringe benefits such as the employer-paid health, life insurance and pensions contributions.
Labour market outcomes
The analysis of outcomes provides descriptive statistics on the labour market experience of participants before, during and after participation. For example, it shows the average annual earnings of active claimants before, during and after participation, and presents what changes were observed from before to after participation. Overall, the analyses were conducted over a period of 9 to 12 years (five years before participation, one or two years during participation, and three or five years after participation).
The outcome analyses provide an assessment of how the labour market situation of participants evolved over time, but does not permit inference regarding the extent to which those changes were due to EBSM participation. For example, increases in employment earnings over the period examined could be partly due to inflation or normal wage increases.
The number of participants was sufficient in order to produce the labour market outcomes for active EI claimants who were youth (under 30 years old).
Strengths and limitations of the studies
One of the key strengths from the studies is that all quantitative analyses were based on administrative data rather than survey responses. Compared to survey data, administrative data are not subject to recall errors or response bias.
The propensity score models used to match participants and non-participants for the incremental impact analyses are judged to be robust in part because they were based on five years of pre-participation data and on a vast array of variables including socio-demographic characteristics, location, skills level related to last occupation and indicators of labour market attachment. Sensitivity analysis and the use of alternative estimation methods have increased confidence in the incremental impact estimates. However, one limitation with the propensity score matching techniques is that no one can be fully sure the impacts were not influenced by factors not captured in the data.
The cost-benefit analysis accounted for all quantifiable costs and benefits directly attributable to the EBSMs and could be estimated with the available administrative data. The analysis did not account for non-quantifiable benefits such as improvements in participant’s wellbeing or for the multiplier effect of increased spending on the economy.
It should be noted that it is not possible to produce incremental impacts for the participation in Training PEI - Apprentices. Assessing these impacts poses a methodological challenge because program participants are already employed and are expected to return to their employment after completing their training. Therefore, expected labour market impacts cannot be examined using a similar approach as for other EBSMs, which are expected to help participants return to employment. As well, the data available does not permit the identification of a proper comparison group since program participants alternate between work and training and no other potential counterfactuals have similar employment and training patterns. In this context, it is possible to provide an analysis of labour market outcomes associated with program participants but not possible to produce estimates of program effectiveness. While outcomes can provide some insights about the labour market experience of participants before and after participation, it is not possible to attribute the change observed in the outcomes to program participation. For example, a change in average annual earnings from before to after participation could be due to program participation or to other factors such as the maturation effect of youth, the economic cycle, lay off, etc.
When interpreting qualitative findings, readers should keep in mind that these are based on the perception of a small number of key informants who are directly involved in the design or delivery of the program. Their perception may be representative of their own region or community but not necessarily of the entire province. Since the number of key informants interviewed in each study is small (that is, ranging between 3 and 5), the number of informants who reported a specific finding is not indicated in the report. However, the report notes when there is a clear disagreement between key informants.
In the case of Prince Edward Island, we were not able to produce incremental impacts for active claimants who participated in the Self Employ PEI program because the balancing testsFootnote 4 properties were not satisfied. As well, incremental impacts for former claimants who participated in the Self Employ PEI program and for active and former claimants who participated in the Work Experience PEI program were not produced due to the small number of participants.
However, the report presents the labour market outcomes for the participation in the Self Employ PEI and Work Experience PEI programs over a twelve year period (that is, 5 years pre-program, 1 to 2 years in-program and 5 years post-program). Readers should be careful to note, when interpreting these outcomes, that changes may be due to external factors (for example inflation, youth maturation process, etc.) and not EBSM participation.
1.3 Overview of the studies summarized in this report
Findings presented in this report were drawn from six separate studies produced on Prince Edward Island LMDA interventions and participants. These studies examined issues related to EBSM effectiveness, efficiency, design/delivery and used a mix of qualitative and quantitative methods. Each study examined evaluation issues in relation to active and former EI claimants.
Table H1 in Appendix H presents an overview of these studies, including the type of evidence generated, the methods used, the reference period and the length of the post-program period over which program effects were observed.2. Evaluation findings
2.1 Rationale and Labour Market context
Active labour market programs are fairly similar across the Organization for Economic Co-operation and Development countries and consist of skills training in a classroom setting, work experience with employers (often subsidized) or in the public/non-profit sector, return-to-employment assistance and self-employment assistance. In Prince Edward Island, SkillsPEI, a Division within the Department of Workforce and Advanced Learning, administers a range of labour market programming. Programs and services offered to active and former EI claimants are primarily funded under the LMDA. The primary objective of SkillsPEI is to assist Islanders with programs and services to improve their labour force participation and to develop or enhance entrepreneurial skillsFootnote 5
In the 2016 Speech from the Throne, the Government of Prince Edward Island committed to place “Particular emphasis…on building job experience opportunities for young Islanders and new entrants to the labour marketFootnote 6 and to “provide active support for job placement and training, including young, first-time or returning workers who are seeking to establish themselves on Prince Edward Island.Footnote 7 Additionally, the 2016 provincial budget encouraged Islanders to “achieve success through education, training and employment.Footnote 8
Overall, incremental impacts and labour market outcomes reported in the LMDA evaluation and discussed in this report demonstrated that LMDA funded programs and services delivered in Prince Edward Island are generally helping participants to improve their labour market experience after participation and contribute to meeting the commitments of the Government of Prince Edward Island and SkillsPEI’s primary objective.
2.2 Training PEI
2.2.1 Program description and delivery
Based on a document review and on information available on the SkillsPEI website
Training PEI provides financial assistance to eligible individuals to help develop the skills required to obtain long-term meaningful employment. Up to 70% of tuition and basic living costs can be provided to eligible individuals engaged in skills-related training. Funding may also be available for travel and childcare costs. The level of financial support is determined through an assessment of the participant’s need.
Training PEI is delivered in partnership with external service providers. Case managers are responsible for completing a needs assessment to establish the appropriateness of the intervention. Case managers work with participants to develop a return to work action plan detailing the participant’s needs, activities to overcome these needs and the appropriate intervention(s) to address their employment barriers. The case manager also confirms the applicant’s eligibility for the program and determines the financial need.
After completing the program, case managers do follow-up with participants to ensure that they are successful in completing their action plan and in securing employment.
2.2.2 Profile of Training PEI participants
As shown in Table B1 in Appendix B, active claimants who started their Training PEI intervention in 2002 to 2005 or 2007 to 2008 were mostly male (56% and 55% respectively) with the majority of participants aged 34 years or younger (55% and 58% respectively). Participants in both cohorts most frequently held occupations requiring secondary or occupational training in the year prior to participation (36% for the 2002 to 2005 cohort and 39% for the 2007 to 2008 cohort).
Former claimants who started their Training PEI intervention in the 2002 to 2005 and 2007 to 2008 periods were predominately female (55% and 53% respectively). Most participants were 34 years of age or younger (60% and 57% respectively). Participants in the 2002 to 2005 cohort most frequently held positions requiring secondary or occupational training in their last job before participation (36%) while 2007 to 2008 participants were more equally split between jobs that required secondary or occupational training (32%), on-the-job training (32%), or college or apprenticeship training (30%).
2.2.3 Incremental impacts
Active claimants
As shown in Table B2 in Appendix B, active claimants who started their Training PEI participation between 2002 and 2005 had incremental gains in earnings and incidence of employment in each of the five years after participation. As shown in Figure 2, these gains in earnings increased over time and ranged between $1,110 and $4,042 annually in the five years following participation. Similarly, increases in incidence of employment ranged between 1.9 and 2.7 percentage points annually over the post-program period. Participants also decreased their use of EI by $183 in the third year after participation and reduced their level of dependence on income support between 1.4 and 2 percentage points between the second and fourth years following participation. Impacts on the use of social assistance were non-statistically significant.

Text description of Figure 2
| Gains in Earnings | ||
|---|---|---|
| Active Claimants | Former Claimants | |
| Year 1 Post-Program | $1,110 | $303* |
| Year 2 Post-Program | $2,773 | $498* |
| Year 3 Post-Program | $3,759 | $1,027* |
| Year 4 Post-Program | $4,042 | $3 645 |
| Year 5 Post-Program | $3,696 | $2,159 |
*The estimates are not statistically significant at the 95% confidence level.
Active claimants who started Training PEI participation in 2007 to 2008 had incremental gains in earnings (cumulative of $12,273) and incidence of employment (ranging between 1.7 and 3 percentage points) over the three years post-participation. Participants also decreased their use of EI by a cumulative of $1,038 and their dependence on government income support in the first two years following participation (2.3 and 3.3 percentage points respectively).
Overall, active claimants increased their labour market attachment through increases in earnings and incidence of employment and decreases in the level of dependence on government income support.
Youth (under 30 years old) who started Training PEI participation in the 2002 to 2005 period had incremental gains in earnings and incidence of employment in all years after participation. As well, they increased the use of EI by a cumulative of 4.6 weeks and their dependence on income support in the second and third post-program years. Impacts on the use of social assistance were not statistically significant.
Former claimants
As shown in Table B3 in Appendix B, former claimants who started Training PEI participation between 2002 and 2005 increased their incidence of employment in the first, second and fifth years post-program by 6.9, 7.4 and 6 percentage points respectively. They also had incremental gains in earnings in the fourth ($2,198) and fifth ($2,159) years after participation (see Figure 2). Incremental impacts for the use of EI, use of social assistance and dependence on income support were not statistically significant.
Overall, former claimants improved their labour market attachment through some increases in earnings and incidence of employment during the post-program period.
2.2.4 Cost-benefit results
As shown in Table B4 in Appendix B, for active claimants, the benefits of Training PEI for society matched the costs 5.1 years after participation. Six years after participation, the benefits exceeded the costs by $3,348. For former claimants, the benefits were still $6,465 lower than the costs six years after the end of participation. As such, the benefits matched the costs 11.5 years after participation.
2.3 Training PEI – Apprentices
2.3.1 Program description and delivery
Based on a document review and on information available on the SkillsPEI website
SkillsPEI provides eligible individuals with financial assistance during the in-class portion of their apprenticeship training. Apprentices only receive benefits during the in-school training period. Financial support is provided for tuition, basic living costs and other costs related to the training.
Eligible applicants must be at least 18 years old within the calendar year of registering as an apprentice, have a high school completion certificate or equivalent, and be working at a designated skilled trade with a suitable employer.
Apprentices are not required to have a return to work action plan nor are they case managed because they generally have an employer attachment prior and subsequent to their training. The apprentice enters into a training agreement with their employer and SkillsPEI agrees to provide the apprentice with workplace-based training in a trade, other occupation or skills set which is part of an approved apprenticeship program.
Training generally takes place at Holland College although some training may occur off-island. It typically takes 3 to 4 years to complete a program.
2.3.2 Profile of Training PEI – Apprentices participants
As shown in Table C1 in Appendix C, active claimants who started their Training PEI – Apprentices intervention in 2003 to 2005 were mostly male (94%) with the majority of participants aged 25 years or younger (52%). Participants most frequently held positions requiring college or apprenticeship training in the year prior to participation (70%).
The number of former claimants’ participants was too small to produce descriptive statistics.
2.3.3 Labour market outcomes
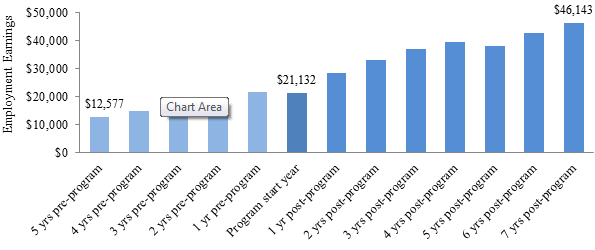
Labour market outcomes for active claimants who started Training PEI – Apprentices participation in the 2003 to 2005 period were produced and are reported in Table C2 in Appendix C. The analysis was conducted over a period of 12 years (five years before participation, two years during participation, and five years after participation).
Labour market outcomes provide descriptive statistics on the labour market experience (that is, average annual earnings) of participants before, during and after participation and present what changes were observed from before to after participation. The outcome analysis provides an assessment of how the labour market situation of participants evolved over time, but does not permit inference regarding the extent to which those changes were due to program participation. For example, increases in employment earnings over the period examined could be partly due to inflation or normal wage increases.
As shown in Figure 3 below, active claimants who started their program participation between 2003 and 2005 earned $24,609 more annually (on average) in the five years after participation compared to the five years before participation.
Text description of Figure 3
| 5 yrs pre-program | 4 yrs pre-program | 3 yrs pre-program | 2 yrs pre-program | 1 yr pre-program | Program start year | 1 yr post-program | 2 yrs post-program | 3 yrs post-program | 4 yrs post-program | 5 yrs post-program | 6 yrs post-program | 7 yrs post-program | |
|---|---|---|---|---|---|---|---|---|---|---|---|---|---|
| Employment Earnings | $12,577 | $14,787 | $17,142 | $19,044 | $21,387 | $21,132 | $28,286 | $32,899 | $36,988 | $39,606 | $38,105 | $42,531 | $46,143 |
Notes: Average earnings include participants with zero earnings in a specific year. As well, earnings were not adjusted for inflation.
The increase in earnings was accompanied by a 4 percentage points (nearly 7 participants) decrease in the proportion of participants employed. At 96%, the average proportion of active claimants employed is lower in the post-program period compared to the pre-program period (100%) but still substantial. Compared to the five years before the program period, the average annual proportion of participants claiming EI benefits decreased from 50% to 44% and the average proportion of participants on social assistance remained the same at 3% in both the pre- and post-program periods. Correspondingly, active claimants also exhibited a slight reduction in the dependence on income support in the 7 years observed following their program participation (from 12% to 11%).
2.4 Employ PEI
2.4.1 Program description
Based on a document review and 3 key informant interviews completed in summer 2015
Employ PEI was designed to encourage private sector employers to hire eligible individuals and provide them with an on-the-job work experience to enhance their skills and employability. Although the wage subsidy is temporary, it is expected to lead to a permanent position with the employer.
The maximum duration of the subsidy is 52 weeks and it covers 50% of the employee’s wage. The percentage of support granted to the employer is based on a set level; however, Employ PEI can provide financial supports to cover other costs related to the employment opportunity in exceptional circumstances. Eligible employers include registered private sector businesses, organizations, municipalities, Band/Tribal councils and public health/educational institutions.
Applications consist of a completed application form, a detailed job description including specific duties and a sustainability plan to maintain the new employee following the subsidy periodFootnote 10. Both the employer and the individual must apply to Employ PEI. As part of developing the return to work action plan, caseworkers assess the individual’s barriers to employment, education level, skills level and work experience. As well, external service providers can recommend an individual to Employ PEI and can provide the individual with a marketing letter to use when contacting prospective employers.
Aerospace (technicians, administration), information technology and construction/trades are examples of the industrial sectors most frequently covered by the subsidy in 2014 to 2015.
2.4.2 Program delivery
Based on a document review and 3 key informant interviews completed in summer 2015
Employ PEI is administered by SkillsPEI. External service providers and SkillsPEI offer case management support services and work with individuals to develop a return to work action plan. They also follow up with the client during the intervention and provide support to the client when necessary. SkillsPEI program officers assess the application, prepare a recommendation and provide a supporting rationale. Applications are approved by SkillsPEI managers.
2.4.3 Profile of Employ PEI participants
As shown in Table D1 in Appendix D, active claimants who started participation in 2002 to 2005 were nearly equally split between males (50%) and females (49%), while those who started in 2007 to 2008 were mostly males (59%). Those who participated in 2002 to 2005 were mainly distributed between the 25 to 34 (29%), 35 to 44 (28%) and 45 to 54 and over (29%) age groups, while 2007 to 2008 participants were more concentrated in the 35 years and older age group (69%). In their last job before participation, 34% of the 2002 to 2005 participants most frequently held occupations requiring secondary or occupational training prior to participation, while the 2007 to 2008 cohort were more likely to have held occupations requiring college or apprenticeship training (39%).
Former claimants who started their program participation in 2002 to 2005 were more often male (55%) compared to the 2007 to 2008 cohort which was primarily composed of females (53%). Slightly more than half of participants in the 2002 to 2005 cohort were 35 years of age and older (57%) while the majority of 2007 to 2008 participants were aged 25 to 44 (63%). Participants in both cohorts most frequently held occupations requiring college or apprenticeship training prior to participation (33% and 35% respectively).
2.4.4 Incremental impacts
Detailed incremental impact results for active and former claimants in the 2002 to 2005 cohort are presented in Tables D2 and D3 in Appendix D. Incremental impacts for the 2007 to 2008 cohort were not produced as the number of participants was too small.
Active claimants
Active claimants who started Employ PEI participation between 2002 and 2005 had incremental gains in earnings in all years after participation. Gains in earnings grew from $1,434 in the first year to $4,023 in the fifth year after participation (see Figure 4). Participants also experienced incremental increases in the incidence of employment ranging between 3.4 and 6.4 percentage points annually in four of the five years following participation. Participants reduced their use of EI by a cumulative of $3,572 or 7.4 weeks following participation. They also reduced their dependence on government income support in all 5 years following participation (ranging between 2.2 and 4.6 percentage points), as well as their use of social assistance in the first year after participation.
Overall, active claimants improved their labour market attachment through increases in earnings and incidence of employment, as well as reductions in EI use and dependence on income supports.
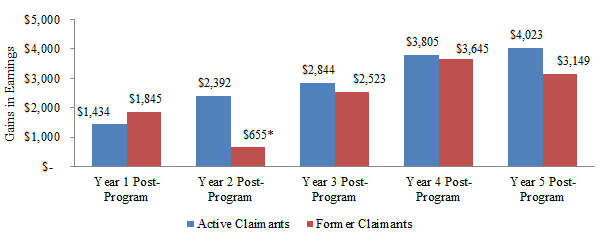
Text description of Figure 4
| Gains in Earnings | ||
|---|---|---|
| Active Claimants | Former Claimants | |
| Year 1 Post-Program | $1,434 | $1,845 |
| Year 2 Post-Program | $2,392 | $655* |
| Year 3 Post-Program | $2,844 | $2,523 |
| Year 4 Post-Program | $3,805 | $3 645 $ |
| Year 5 Post-Program | $4,023 | $3,149 |
*The estimate is not statistically significant at the 95% confidence level.
Former claimants
Employ PEI was also effective at improving the incremental earnings of former claimants’ participants. As shown in Figure 4, gains in earnings ranged between $1,845 and $3,645 annually in four of five post-participation years. They also increased their incidence of employment by 5.6 percentage points in the first year following participation. Their use of EI increased by $635 in the second year after participation, while their use of social assistance decreased by a cumulative of $1,163 post-participation. Results for dependence on income support were non-statistically significant.
The increase in EI in the second year following participation may indicate the inability of some former claimants to maintain the employment secured in the short-term. It can also be argued that the increase in EI use is an indication of an increase in labour market attachment for this client group since they did experience increases in employment earnings, as well as a decrease in the use of social assistance. As a reminder, former claimants are participants for whom the EI benefit period ended up to three years pre-participation.
2.4.5 Cost-benefit results
For active claimants, as shown in Table D4 in Appendix D, the benefits of Employ PEI from society’s perspective were $7,542 higher than the costs six years after participation. The benefits matched the costs 3.9 years after participation. For former claimants, the benefits were $13,229 higher than the costs six years after the end of participation and the benefits matched the costs within the first year after participation.
2.4.6 Challenges and lessons learned about Employ PEI design and delivery
Based on a document review and 3 key informant interviews completed in summer 2015
Key informants reported challenges with the design and delivery of Employ PEI which include:
- Managing the employer’s expectations and ensuring that the program is adequately explained and understood by employers.
- Explaining to employers that well-trained and well-matched participants are more valuable to them than the subsidy.
Key informants identified best practices and the lessons they learned in terms of the design and delivery of the program. These included:
- Maintaining relationships with employers for future funding opportunities.
- Following up with participants and employers by resolving issues as they arise during the subsidy period.
- Ensuring a proper match between the participant and the employer to increase the probability of success.
- Learning how best to help specific participant groups (for example, persons with disabilities) and having the flexibility to adjust the program to meet their needs such as adjusting the length of the subsidy and the requirement to work 35 hours per week.
- There is a need to accommodate seasonal employment in rural areas (on the condition that the job has a 6 month minimum duration).
2.5 Self Employ PEI
2.5.1 Program description and delivery
Based on information available on the SkillsPEI website
The Self Employ PEI program assists unemployed individuals create jobs for themselves by starting a new business. Financial support and business counseling is provided to unemployed individuals during the business’ first year of operation.
With the assistance of SkillsPEI staff, applicants complete a Self Employ Suitability Assessment, a return to work action plan and an Application for Funding. As well, the applicant must provide a detailed business plan, proof of investment or financing, a resume and a SkillsPEI consent form. The proposed business cannot begin operation until approval has been received from SkillsPEI.
Participants in Self Employ PEI are expected to devote a minimum of 35 hours per week to implement their business plan. Financial support may include a weekly living allowance or EI Part 1 benefits or a combination of both.
2.5.2 Profile of Self Employ PEI participants
As shown in Table E1 in Appendix E, active claimants who started participating in Self Employ PEI in 2002 to 2005 or 2007 to 2008 were primarily male (60% and 59% respectively). The majority of participants in the 2002 to 2005 cohort were between 25 and 44 years of age (70%) while the largest concentration of 2007 to 2008 participants fell in the 35 years old and over age group (63%). Prior to participation, both the 2002 to 2005 and 2007 to 2008 participants most frequently held positions requiring college or apprenticeship training (42% each).
Former claimants who started Self Employ PEI participation in 2002 to 2005 or 2007 to 2008 were mainly male (53% and 57% respectively) and few were under the age of 25 for both cohorts (7% and 2% respectively). The remaining participants were almost evenly distributed across the other age categories (that is, 25 to 34, 35 to 44, and 45 and over). Participants in both cohorts most frequently held occupations requiring college or apprenticeship training prior to participation (30% and 45% respectively).
2.5.3 Challenges in estimating Self Employ PEI incremental impacts and reporting on labour market outcomes
Incremental impacts for active claimants who participated in Self Employ PEI in the 2002 to 2005 period are not available because the balancing testFootnote 11 properties were not satisfied. As well, incremental impacts for former claimants’ participants in 2002 to 2005 and for active and former claimants’ participants in 2007 to 2008 were not produced given the small number of participants. Instead, the labour market outcomes for active and former claimants who participated in Self Employ PEI between 2002 and 2005 were produced and can be found in Tables E2 and E3 in Appendix E.
The outcomes presented in Appendix E are not discussed in the report since they may not provide an accurate depiction of the financial well-being of participants in the post-program period. Specifically, the earnings and the proportion of participants employed were produced using individual earnings reported in the T1 and T4 taxation files from Canada Revenue Agency.
According to a study from Statistics Canada, self-employed individuals in Canada have a lower average annual income than paid employees ($46,200 versus $52,400 in 2009), but the average net worth of their households is 2.7 times greater than that of the paid employee households, which indicates that some self-employed individuals may leave funds within their business for reinvestment purposesFootnote 12. Overall, this suggests that looking at individual earnings alone, without taking the net worth into consideration, may not provide a fair assessment of how well participants are doing financially after participation.
As well, little is known nationally about the design and delivery of this program. In particular, there is a lack of understanding around the role played by this program in helping future entrepreneurs to implement viable business plans and to develop their entrepreneurship skills. Overall, it is not clear whether participants’ success in improving their labour market attachment through self-employment is more closely associated with their business idea and their entrepreneurship skills or the assistance provided under the Self Employ PEI.
2.6 Work Experience PEI
2.6.1 Program description
Based on information provided by Prince Edward Island and available on the SkillsPEI website
Work Experience PEI is a short-term employment program providing participants with on-the-job work experience and the opportunity to develop new skills. The program is administered by SkillsPEI. External service providers and SkillsPEI offer case management support services and work with individuals to develop a return to work action plan. They also follow up with the client during the intervention and provide support to the client when necessary. SkillsPEI program officers assess the application, prepare a recommendation and provide a supporting rationale. Applications are approved by SkillsPEI managers.
2.6.2 Profile of Work Experience PEI participants
As shown in Table F1 in Appendix F, active claimants who started participating in Work Experience PEI in 2002 to 2005 or 2007 to 2008 were mostly male (60% and 63% respectively). Most participants were between the ages of 25 to 44 (58%) in the 2002 to 2005 cohort while in the more recent cohort, participants were more evenly distributed (with 27% being under 25 years or age, and 29% being 45 and over). Prior to participation, active claimants held occupations that required on-the-job training (34% of participants in each cohort), as well as occupations requiring secondary or occupational training (27% and 39% respectively).
Former claimants were more likely to be male (80% of 2002 to 2005 participants and 70% of 2007 to 2008 participants) and older since only 34% of participants in both cohorts were 45 years of age and over. Former claimants in both cohorts most frequently held occupations requiring on-the-job training (34% each) prior to participation.
2.6.3 Labour market outcomes
Incremental impacts for active and former claimants who participated in the program in 2002 to 2005 and 2007 to 2008 were not produced given the small number of participants. Labour market outcomes for the 2002 to 2005 cohort are reported in Tables F2 and F3 in Appendix F. The analysis was conducted over a period of 12 years (five years before participation, two years during participation, and five years after participation).
The outcome analysis provides an assessment of how the labour market situation of participants evolved over time, but does not permit inference regarding the extent to which those changes were due to program participation. For example, increases in employment earnings over the period examined could be partly due to inflation or normal wage increases.
Active claimants
As shown in Table F2 in Appendix F and illustrated in Figure 5 below, active claimants who started their program participation between 2002 and 2005 earned $8,453 more annually (on average) in the five years after participation compared to the five years before participation.
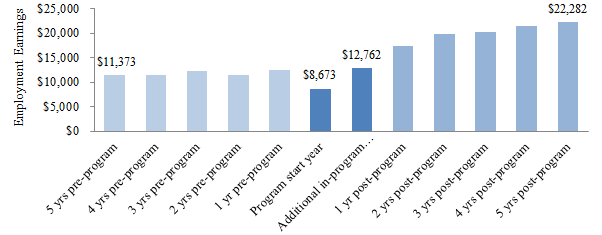
Text description of Figure 5
| 5 yrs pre-program | 4 yrs pre-program | 3 yrs pre-program | 2 yrs pre-program | 1 yr pre-program | Program start year | Additional in-program year | 1 yr post-program | 2 yrs post-program | 3 yrs post-program | 4 yrs post-program | 5 yrs post-program | |
|---|---|---|---|---|---|---|---|---|---|---|---|---|
| Employment Earnings | $11,373 | $11,367 | $12,289 | $11,366 | $12,548 | $8,673 | $12,762 | $17,437 | $19,786 | $20,264 | $21,434 | $22,282 |
Notes: Average earnings include participants with zero earnings in a specific year. As well, earnings were not adjusted for inflation.
The increase in earnings was accompanied by a 6 percentage points decrease in the proportion of participants employed. At 86%, the average proportion of active claimants employed is somewhat lower in the post-program period compared to the pre-program period (92%) but still substantial. With a total of 161 program participants in the 2002 to 2005 period, the 6 percentage-point decrease in the proportion of participants employed is equivalent to 10 participants. Possible explanations for the decrease in the proportion of participants employed may include retirement decisions (with 8% of participants aged 55 and over), and the fact that some participants may not have benefitted from program participation while others simply left the labour force for various reasons.
Compared to the five years before the program period, the average annual proportion of participants claiming EI benefits decreased from 62% to 55% and the average proportion of participants on social assistance decreased from 9% to 7% over the five years post-program. Correspondingly, active claimants also exhibited a slight reduction in the level of dependence on income support in the 5 years observed following their program participation (from 25% to 23%).
Former claimants
As shown in Table F3 in Appendix E and illustrated in Figure 6 below, former claimants who started Work Experience PEI between 2002 and 2005 earned $4,683 more annually (on average) in the five years after participation compared to the five years before participation.
As with active claimants, there was a 13 percentage points decrease in the proportion of participants employed between the pre- and post-program periods. At 79%, the average proportion of former claimants employed is lower in the post-program period compared to the pre-program period (92%). Again, possible explanations for the decrease in the proportion of participants employed may include retirement decisions (with 14% of participants aged 55 and over), and the fact that some participants may not have benefitted from program participation while others simply left the labour force for various reasons.

Text description of Figure 6
| 5 yrs pre-program | 4 yrs pre-program | 3 yrs pre-program | 2 yrs pre-program | 1 yr pre-program | Program start year | Additional in-program year | 1 yr post-program | 2 yrs post-program | 3 yrs post-program | 4 yrs post-program | 5 yrs post-program | |
|---|---|---|---|---|---|---|---|---|---|---|---|---|
| Employment Earnings | $7,766 | $8,499 | $9,330 | $10,490 | $7,123 | $6,176 | $9,070 | $12,136 | $13,542 | $14,448 | $13,503 | $12,990 |
Notes: Average earnings include participants with zero earnings in a specific year. As well, earnings were not adjusted for inflation.
Compared to the five years before program participation, the average annual proportion of participants claiming EI benefits decreased by 17 percentage points (from 70% to 53%) and the average proportion of participants on social assistance decreased from 16% to 13% over the five years post-program. Correspondingly, former claimants exhibited a slight reduction in the level of dependence on income support in the 5 years following program participation (from 33% to 31%).
2.7 Employment Assistance Services
2.7.1 Program description and delivery
Based on a document review and 5 key informant interviews completed in the summer of 2013
Employment Assistance Services provide financial support to organizations to help individuals throughout the province prepare for, obtain and maintain employment. Services are primarily delivered by third-party service providers and are accessible to all unemployed persons seeking employment related supports.
Key services and resources include:
- Case management
- Needs Assessment (part of the development of a return to work action plan)
- Employment counseling and career planning (provides advice on career decision making)
- Diagnostic assessment for learning disabilities
- Job search training
- Job coaching, marketing and interview skills
- Labour market information
- Workshops (jobs, interview skills)
- Services to employers (workshops, individual counselling) and support job-loss clients
- Job matching
- Employment workshops for immigrants
- Referrals to other service organizations
Key informants confirmed that labour market information products are being used to support the delivery of Employment Assistance Services. A vast amount of labour market information is available to Islanders; however, much of it lacks the required level of local context due to the relatively small sample sizes available to measure labour force activity by organizations such as Statistics Canada. They noted that Service Canada no longer provides information on occupations in Prince Edward Island. Managers also noted that service providers use the Working in Canada website.
Most service providers reported that they dedicate time and resources for labour market information collection; however it can be challenging to find time to undertake this work. They encourage participants to speak with employers directly.
2.7.2 Profile of Employment Assistance Services participants
The following presents the main socio-demographic characteristics of active and former claimants who participated exclusively in Employment Assistance Services without participating in any other Employment Benefits programs.
As shown in Table G1 in Appendix G, active claimants who participated exclusively in Employment Assistance Services in 2002 to 2005 were more often female than male (50% and 42% respectivelyFootnote 13), while the 2007 to 2008 cohort were slightly more likely to be male (54%). Fifty-six percent of 2002 to 2005 participants were between 25 and 44 years of age, while the majority (61%) of 2007 to 2008 participants were aged 35 and over. Prior to program participation, equal proportions of participants in both cohorts had positions that required secondary or occupational training (34%), though the 2002 to 2005 cohort was more likely than the 2007 to 2008 cohort to have had occupations that required on-the-job training (37% and 28% respectively).
Former claimants were predominately female in both the 2002 to 2005 and 2007 to 2008 periods (49% and 53% respectively). Participants in the 2002 to 2005 cohort were mainly aged 25 to 44 years old (56%) while most participants (54%) in the 2007 to 2008 cohort were 35 years old and over. The 2002 to 2005 participants most frequently held occupations requiring on-the-job training before participation (42%), while the 2007 to 2008 participants were more likely to have had positions that required secondary or occupational training (37%).
Labour market barriers faced by Employment Assistance Services participants
Based on a document review and 5 key informant interviews completed in the summer of 2013
According to key informants, the main labour market barriers experienced by Employment Assistance Services participants in Prince Edward Island are:
- Low educational attainment, low literacy and numeracy skills
- Lack of job search skills, work experience, networks and contacts
- Lack of available full time employment
- Lack of public transportation especially in rural areas
- Cost of childcare and transportation
- Mismatch of skills with what is required in the labour market
- Learning disabilities
- Addictions, alcohol abuse and criminal record
- Mental illness
- Lack of housing/homelessness
2.7.3 Incremental impacts
Incremental impacts were only produced for active claimants since former claimants who participated only in Employment Assistance Services were used as a comparison group for former claimants who participated in other EBSMs.
Results presented in Table G2 in Appendix G indicate that active claimants who participated exclusively in Employment Assistance Services between 2002 and 2005 decreased their use of EI by a cumulative of $2,848 or 7.4 weeks after participation. The incremental impacts on employment earnings, incidence of employment, use of social assistance and dependence on government income support were not statistically significant. While we cannot ascertain the effectiveness of the program, labour market outcomes for participants demonstrated that 89% of active claimants who participated exclusively in Employment Assistance Services in 2002 to 2005 were employed annually, on average, in the five years after program participation (see Table G4).
Active claimants who participated in Employment Assistance Services in 2007 to 2008 had incremental increases in earnings (cumulative of $2,386) and gains in incidence of employment in the first and second years (1.7 and 2 percentage points respectively) following participation. Participants decreased the use of EI by a cumulative of 3.6 weeks following participation. As well, their dependence on income support decreased by 1.8 percentage points in the first year post-program participation.
Overall, active claimants who participated in Employment Assistance Services in 2007 to 2008 improved their labour market attachment through gains in earnings and incidence of employment and reduction in the use of EI compared to similar non-participants. There are also indications that active claimants who participated in Employment Assistance Services in 2002 to 2005 maintained a high level of employment following participation.
The results varied for the sub-groups examined:
- Youth (under 30 years old) who started an Employment Assistance Services intervention between 2002 and 2005 decreased their use of EI by a cumulative of $2,340 in the five years after participation. Their use of social assistance increased in all post-program years (cumulative $969) and dependence on income support also increased in the fourth and fifth post-program years.
- Incremental impacts for long-tenured workers who participated in Employment Assistance Services in 2007 to 2009 were not statistically significant.
2.7.4 Cost-benefit results
As shown in Table G3 in Appendix G, the benefits were $1,946 lower than the program costs six years after participation from the social perspective. These benefits would have to be sustained for 8.9 years after participation in order to equal the costs.
2.7.5 Challenges and lessons learned about Employment Assistance Services design and delivery
Based on a document review and 5 key informant interviews completed in the summer of 2013
Key informants identified the following challenges related to Employment Assistance Services’ design and delivery:
- Lack of awareness of existing services
- Transportation
- Lack of program flexibility to fund short-term job placements and to provide support for employed individuals working in low-paying jobs that are well below their skill set
- Service providers limit their hours of services and job coaching based on the amount of funding in the service contract
- Employment Assistance Services eligibility is limited and services cannot be provided to employed people including those in low-paying jobs that are well below their skill set and knowledge level
Best practices and lessons learned related to the general design and delivery of the program included:
- Developing a good case management system using a client-centered approach
- Creating long-term action plans for participants
- Ensuring strong partnerships with third-party service providers and employers to be able to mobilize the service delivery network in cases of emerging labour market challenges (for example, major lay-offs, downturn, etc.) and organize job fairs and group workshops
- Sensitizing employers about diversity in the workplace, multiculturalism etc.
Best practices and lessons learned related to participants with multiple barriers to employment included:
- Providing a client-centered approach as there is no one-size-fits-all approach to assisting participants with multiple-barriers
- Having the flexibility and budget to shape an adequate action plan with detailed steps.
- Making good referrals to appropriate services
- Having positive relationships with other community service providers and being non-competitive is the best outcome for the client
- Having counsellors and career practitioners working together
- Attending job interviews with participants to help establish a good working relationship with the employer
- Volunteer experience is valuable for new immigrants that need to expand their networks and be exposed to the work environment. Employers also become more willing to work with immigrants
3. Comparison of key findings by program type
This section provides an overview of the key findings from the incremental impact analysis, cost benefit analysis, and labour market outcomes analysis for Training PEI, Employ PEI, Work Experience PEI and Employment Assistance Services for both active and former EI claimant participants who started participation in the 2002 to 2005 period.
Overall, incremental impacts, cost-benefit analysis and labour market outcomes demonstrate that LMDA programs and services are generally helping participants to improve their labour market attachment after participation.
Incremental impacts demonstrate that active and former EI claimants who participated in Training PEI and Employ PEI had gains in earnings and incidence of employment when compared to similar non-participants. As well, active EI claimants who participated in Employ PEI and Employment Assistance Services had reductions in EI use after program participation. Former claimants who participated in Employ PEI reduced their use of social assistance. The social benefits of participation exceeded the cost of the interventions over time.
Labour market outcomes demonstrate that participants in the Work Experience PEI program showed higher average earnings and lower average proportions on EI and social assistance during the five years after program participation when compared to five years prior.
3.1. Incremental impacts and cost-benefit analysis for Training PEI, Employ PEI and Employment Assistance Services
Participants in Training PEI and Employ PEI have a higher probability of being employed than comparison group members
As shown in Figure 7, active EI claimants who participated in Training PEI and Employ PEI had a higher probability of being employed (that is, they increased their incidence of employment) compared to similar non-participants. This is also true for active EI claimants who were youth and who participated in Training PEI. As well, former EI claimants who participated in Training PEI had a higher probability of being employed compared to EI claimants who received low intensity interventions under Employment Assistance Services. Former EI claimants who participated in Employ EI had short-term increase in the probability of employment.
Active EI claimants who participated in Employment Assistance Services in 2002 to 2005 did not experience an increase probability of being employed compared to similar non-participants. However, participants in the 2007 to 2008 cohort did experience increased probability of employment compared to non-participants. It is noted that Employment Assistance Services are relatively modest activities such as counselling, job search assistance and case management. By themselves, they are not expected to lead to substantial effects on labour market outcomes.
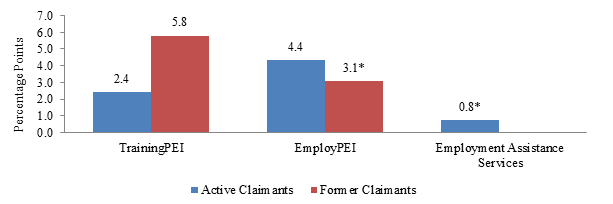
Text description of Figure 7
| Percentage points | ||
|---|---|---|
| Active Claimants | Former Claimants | |
| TrainingPEI | 2.4 | 5.8 |
| EmployPEI | 4.36 | 3.1* |
| Employment Assistance Services | 0.8* | |
* The estimates are not statistically significant at the 95% confidence level.
Note: The estimates in Figure 7 are arithmetic averages.
Increased earnings for participants in Training PEI and Employ PEI compared to comparison group members
As shown in Figure 8, active EI claimants who participated in Training PEI and Employ PEI increased their employment earnings compared to similar non-participants. This is also true for active youth EI claimants participating in Training PEI. As well, former EI claimants who participated in Training PEI and Employ PEI increased their employment earnings compared to EI claimants who received Employment Assistance Services exclusively.
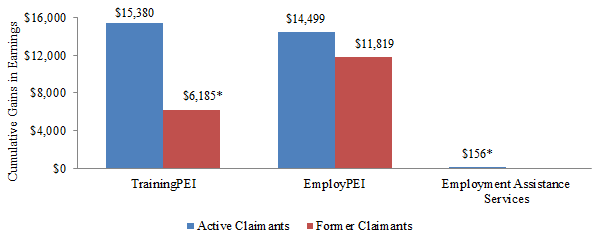
Text description of Figure 8
| Cumulative Gains in Earnings | ||
|---|---|---|
| Active Claimants | Former Claimants | |
| TrainingPEI | $15,380 | $6,185* |
| EmployPEI | $14,499 | $11,819 |
| Employment Assistance Services | $156* | |
* The estimates are not statistically significant at the 95% confidence level. The estimate for former claimants who participated in Training PEI is statistically significant at the 90% confidence level only. However, these participants did experience statistically significant increases in earnings at the 95% confidence level in year 4 and 5 following participation.
As previously indicated, Employment Assistance Services are relatively modest activities and, by themselves, are not expected to lead to substantial effects on labour market outcomes. In other words, these services aim to support the return to work of unemployed participants and not necessarily to secure a better paying job than pre-participation.
The use of EI is reduced for Active claimants who participated in Employ PEI and Employment Assistance Services. Former claimants who participated in Employ PEI reduced their use of social assistance and improved their labour market attachment through increases in earnings and a short-term increase in the incidence of employment.
As shown in Figure 9, active EI claimants who participated in Employ PEI and Employment Assistance Services decreased their use of EI compared to similar non-participants. All other impacts on EI and social assistance use for active claimants were not statistically significant.
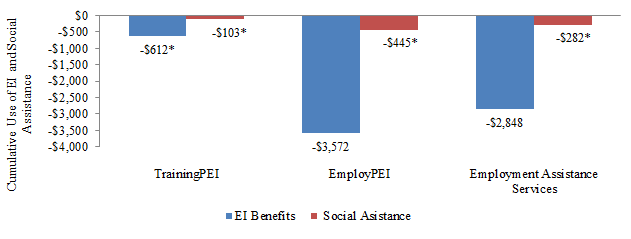
Text description of Figure 9
| Cumulative Use of EI and Social Assistance | ||
|---|---|---|
| EI Benefits | Social Assitance | |
| TrainingPEI | -$612* | -$103* |
| EmployPEI | -$3,572 | -$445* |
| Employment Assistance Services | -$2,848 | -$282* |
* Estimates are not statistically significant at the 95% confidence level.
As shown in Figure 10, former claimants who participated in Employ PEI between 2002 and 2005 decreased their use of social assistance following participation. With decrease in social assistance use, former EI claimants improved their labour market attachment given the increases in earnings and the short-term increase in the incidence of employment.
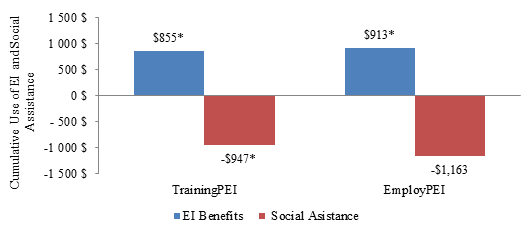
Text description of Figure 10
| Cumulative Use of EI and Social Assistance | ||
|---|---|---|
| EI Benefits | Social Assitance | |
| TrainingPEI | $855* | -$947* |
| EmployPEI | $913* | -$1,163 |
* Estimates are not statistically significant at the 95% confidence level.
Social benefits of participation exceeded costs of investments for all interventions.
As shown in Table 2, social benefits to participation exceeded investment costs in a period ranging between the first year after program participation to just over 11 years after participation.
Table 2 Number of years for the benefits to exceed program costs
| Training PEI | Employ PEI | Employment Assistance Services | |
|---|---|---|---|
| Active claimants | 5.1 | 3.9 | 8.9 |
| Former claimants | 11.5 | 1st year post-program | n/a |
3.2. Labour market outcomes for participants in Work Experience PEI
Participants have higher average earnings after Work Experience PEI participation
As shown in Figure 11, active and former EI claimants who participated in Work Experience PEI showed higher average employment earnings during the five years after their participation when compared to five years prior.
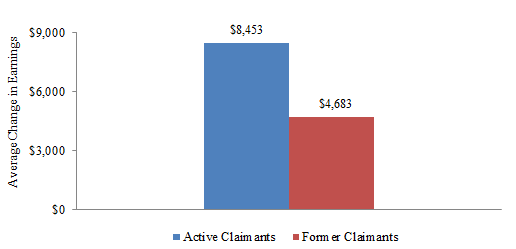
Text description of Figure 11
| Active Claimants | Former Claimants | |
|---|---|---|
| Average Change in Earnings | $8,453 | $4,683 |
Note: outcomes for former claimants who participated in Work Experience PEI should be interpreted with caution given the small number of participants (n=86).
The average proportion of participants on Employment Insurance and social assistance is generally lower after Work Experience PEI participation
As shown in Figure 12, the average proportion of participants who use EI and social assistance is shown to be lower in the post-participation period for active and former EI claimants who participated in Work Experience PEI.
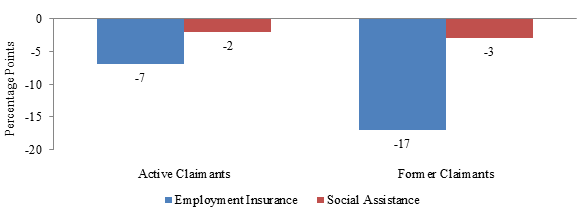
Text description of Figure 12
| Cumulative Use of EI and Social Assistance | ||
|---|---|---|
| Employment Insurance | Social Assistance | |
| Active Claimants | -7 | -2 |
| Former Claimants | -17 | -3 |
Note: outcomes for former claimants’ participants in Work Experience PEI should be interpreted with caution given the small number of participants (n=86).
The average proportion of participants employed is lower following program participation
Active claimants who participated in Work Experience PEI experienced a 6 percentage points decrease in the proportion of participants employed. At 86%, the average proportion of active claimants employed is somewhat lower in the post-program period compared to the pre-program period (92%) but still substantial. With a total of 161 program participants in the 2002 to 2005 period, the 6 percentage-point decrease in the proportion of participants employed is equivalent to 10 participants. Possible explanations for the decrease in the proportion of participants employed may include retirement decisions (with 8% of participants aged 55 and over), and the fact that some participants may not have benefitted from program participation while others simply left the labour force for various reasons.
Former claimants who participated in Work Experience PEI experienced a 13 percentage points decrease in the proportion of participants employed between the pre- and post-program periods. At 79%, the average proportion of former claimants employed is lower in the post-program period compared to the pre-program period (92%). With a total of 86 program participants in the 2002 to 2005 period, the 13 percentage-point decrease in the proportion of participants employed is equivalent to 11 participants. Again, possible explanations for the decrease in the proportion of participants employed may include retirement decisions (with 14% of participants aged 55 and over), and the fact that some participants may not have benefitted from program participation while others simply left the labour force for various reasons.
4. Conclusions
Overall, incremental impacts, cost-benefit analysis and labour market outcomes demonstrate that LMDA programs and services are generally helping participants to improve their labour market attachment after participation. As such, evaluation evidence suggests that LMDA funded programming contributes to contribute to meeting the commitments of the Government of Prince Edward Island and SkillsPEI’s primary objective.
Incremental impacts demonstrate that active and former EI claimants who participated in Training PEI and Employ PEI had gains in earnings and incidence of employment when compared to similar non-participants. As well, active EI claimants who participated in Employ PEI and Employment Assistance Services had reductions in EI use after program participation. Former claimants who participated in Employ PEI reduced their use of social assistance. The social benefits of participation exceeded the cost of the interventions over time.
Labour market outcomes demonstrate that participants in the Work Experience PEI program showed higher average earnings and lower average proportions on EI and social assistance during the five years after program participation when compared to five years prior.
Key informant interviews with service providers and program managers, as well as the reviewed documents and questionnaires completed by Prince Edward Island representatives, revealed few challenges about Employ PEI and Employment Assistance Services design and delivery. Key challenges and barriers are highlighted below.
Employ PEI
- Managing employers’ expectations of the participants and ensuring that the program is adequately explained and understood by employers
- Explaining to employers that well-trained and well-matched participants are more valuable to them than the subsidy
Employment Assistance Services
- Key informants indicated that service providers are expected to use labour market information to support the programs and services. However, they also mentioned that available labour market information is limited, difficult to access, lacks local context, and is time consuming to obtain.
- According to key informants, other challenges with respect to the design and delivery of Employment Assistance Services included:
- Lack of awareness about Employment Assistance Services among potential participants.
- Service providers limit their hours of services and job coaching based on the amount of funding in the service contract.
- Transportation is an issue in Prince Edward Island, especially in rural areas.
- Lack of program flexibility to fund short-term job placements and to provide support for employed individuals working in low-paying jobs that are well below their skill set.
5. Recommendations
A total of six recommendations emerge from the evaluation findings. They are as follows:
A study on the timing of participation in Employment Assistance Services at the national level revealed that receiving assistance early after starting an EI claim can lead to better labour market impacts. As well, key informants reported a lack of awareness about Employment Assistance Services in Prince Edward Island.
Recommendation 1: Consideration should be given to providing Prince Edward Island with timely access to data on new EI recipients for supporting targeting and increasing awareness.
According to key informants, the main labour market barriers experienced by LMDA participants are related to low educational attainment, skills mismatch, learning disabilities and literacy issues.
Recommendation 2: Literacy/essential skills training and learning disability assessments are essential steps in supporting individuals facing multiple barriers to prepare for vocational training and to reintegrate into the labour market. The measures should be reported separately from other Training PEI interventions given their unique objectives.
Key informants confirmed the necessity of having labour market information to support the delivery of Employment Assistance Services. They, however, pointed to the difficulty of accessing or producing labour market information at the regional/local level.
Recommendation 3: Consideration should be given to enhance the capacity of service providers to access or produce, when needed, relevant local labour market information.
The evaluation was not able to produce a conclusive assessment of Self Employ PEI effectiveness and efficiency since the income tax records used to assess impacts on earnings may not be the best source of information available to reflect the financial wellbeing of participants. As well, it is not clear whether participants’ success in improving their labour market attachment through self-employment is more closely associated with their business idea and their entrepreneurship skills or the assistance provided under Self Employ PEI.
Recommendation 4: Consideration should be given to examine in more detail the design and delivery of Self Employ PEI and whether the performance indicators for this program are appropriate.
Labour market outcomes produced for Work Experience PEI participants showed a general improvement in their labour market attachment in terms of increased earnings and reduced use of EI and social assistance. However, the evaluation has not yet examined the design and delivery of the program. Therefore, a lot remains unknown about how this program operates and the factors that contribute to its effectiveness.
Recommendation 5: Consideration should be given to examine the design and delivery of the Work Experience PEI program to better understand how this program operates.
Overall, the LMDA evaluation was able to produce a sound assessment of EBSM effectiveness and efficiency because the team had access to rich data on EI claimants, EBSM participation data and Canada Revenue Agency taxation files. However, some data gaps limited the evaluation’s ability to assess how EBSMs operate.
Recommendation 6: Improvements in the data collection process are recommended to address key program and policy questions of interest to the federal and provincial/territorial governments. Specifically:
- Collect data on whether participants are members of designated groups including Indigenous peoples, persons with disabilities and recent immigrants.
- Collect data on the type of training funded under Training PEI and the type of assistance provided under Employment Assistance Services. Prince Edward Island, ESDC and other P/Ts should work together to define common categories for both EBSMs.
References
Canada Employment Insurance Commission. Employment Insurance Monitoring and Assessment Reports. 2003 to 2004 to 2013 to 2014.
Coe, Patrick. “Apprenticeship programme requirements and apprenticeship completion rates in Canada.” Journal of Vocational Education and Training. 2013. 65(4):575 to 605
Employment and Social Development Canada. Analysis of Employment Benefits and Support Measures (EBSM) Profile, Outcomes and Incremental Impacts for 2007 to 2008 Participants in Prince Edward Island: Technical Report. Evaluation Directorate. February 18, 2015
Employment and Social Development Canada. Analysis of Employment Benefits and Support Measures (EBSM) Profile, Outcomes and Incremental Impacts for the EI Claimant Category “Long-Tenured Workers” in Prince Edward Island: Technical Report. Evaluation Directorate. March 9, 2016
Employment and Social Development Canada. Cost-Benefit Analysis of Employment Benefits and Support Measures Delivered in Prince Edward Island: Technical Report. Evaluation Directorate. December 23, 2015
Employment and Social Development Canada. Profile, Outcomes and Net Impacts of Employment Benefits and Support Measures (EBSM) Participants in Prince Edward Island: Technical Report. Evaluation Directorate. March 2014
Employment and Social Development Canada. Study on Employ PEI: Technical Report. Evaluation Directorate. March 15, 2016
Government of Prince Edward Island. Budget Address. Ministry of Finance. April 19, 2016
Government of Prince Edward Island. Canada-Prince Edward Island Labour Market Development Agreement (LMDA) Annual Plan 2014-15. SkillsPEI. 2014
Government of Prince Edward Island. Speech from the Throne. Author: April 5, 2016.
LaRochelle-Côté, Sébastien and Sharanjit Uppal, "The Financial Well-Being of the Self-Employed," Perspectives on Labour and Income, vol. 23, no. 4, Winter 2011.
Red Seal. Apprenticeship Completion, Certification and Outcomes, Ottawa: Red Seal. 2014.
Acronyms
EBSM Employment Benefits and Support Measures
EI Employment Insurance
ESDC Employment and Social Development Canada
LMDA Labour Market Development Agreements
PEI Prince Edward Island
P/Ts Provinces and Territories
Appendix A - Methodology
Qualitative data
Qualitative data reported in the Employ PEI and Employment Assistance Services studies were collected from key informant interviews with managers and service providers and a document/ literature review. As well, a questionnaire was completed by provincial government representatives for the Employ PEI study. Table A1 provides the number of key informants interviewed.
Key informant interviews for the Employment Assistance Services study were conducted in 2013 while those for the Employ PEI study were conducted in 2015.
Table A1. Number of key informants interviewed
| Number of key informant interviews | Studies | |
|---|---|---|
| Employ PEI | Employment Assistance Services | |
| Managers | 3 | 2 |
| Service providers | 3 | |
Quantitative methods
All quantitative analyses were conducted using linked administrative data from EI Part I (EI claim), EI Part II (EBSM participation data) and T1 and T4 taxation files on up to 100% of the participants in Prince Edward Island.
Incremental impacts
The incremental impact analysis compared the labour market experience of participants before and after their participation with that of a comparison group. The goal was to determine the direct effect of program participation on key labour market indicators (see Figure 1 in the introduction section).
For active claimants, incremental impacts were measured relative to a comparison group of active claimants who could have participated in the EBSMs but did not. Former claimants can be underemployed and unable to requalify for EI, out of the labour force for various reasons or on social assistance. Based on previous evaluation methodologies, on expert advice and given the difficulty in generating a suitable comparison for former claimants using administrative data alone, the comparison group for former claimants was created using individuals who participated in low-intensity Employment Assistance Services only during the reference period. This is a conservative approach given the fact that participation in Employment Assistance Services can lead to some, but limited, effects on labour market outcomes.
Participants and non-participants were matched based on a wide array of variables including age, sex, location, skill level required by the last occupation held prior to participation, reason for separation from employment, industry in which they were previously employed as well as employment earnings and use of EI and social assistance for each of the five years before participation.
All analyses were conducted using a unit of analysis called the Action Plan Equivalent, which combines all EBSMs given to an individual within no more than six months of each other. For reporting purposes, incremental impacts were attributed to the longest intervention of the Action Plan Equivalent when Training PEI, Employ PEI, Work Experience PEI or Self Employ PEI was the longest intervention. Impacts for Employment Assistance Services were calculated for Action Plan Equivalent that contained only Employment Assistance Service with no employment benefits.
The incremental impact estimates were produced using non-experimental methods, namely propensity score matching, using the Kernel Matching method, along with Difference-in-Differences method to estimate program impacts. Alternative matching techniques (such as the Nearest Neighbour and the Inverse Propensity Weighting) were also used for validation purposes.
Incremental impacts and outcomes were measured for the following indicators:
- Employment/self-employment earnings represent the total earnings an individual had from paid employment and/or self-employment. (This information is available by calendar year and was obtained from T1 and T4 tax return records.)
- Incidence of employment/self-employment represents the incidence of having earnings from employment and/or self-employment.
- Amount of EI benefits received represents the average amount of EI benefits received.
- Weeks in receipt of EI benefits represent the average number of weeks during which EI benefits were received.
- Social assistance benefits represent the average amount of social assistance benefits received. (This information is available by calendar year and was obtained from T1 tax return records.)
- Dependence on income support represents the ratio of participant’s income that came from EI and social assistance benefits (that is, EI benefits + social assistance benefits / (EI benefits + social assistance benefits + earnings from employment/self/employment)).
Incremental impacts were estimated for different cohorts of participants:
- Active and former claimants as well as youth (under 30 years old) who started their EBSM participation between April 1, 2002 and March 31, 2005.
- Active and former claimants who started their EBSM participation between January 1, 2007 and March 31, 2008.
- Active and former claimants who were long-tenured workers and who started their EBSM participation between January 1, 2007 and December 31, 2009. The long-tenured workers covered in this study are individuals who have established an EI regular or fishing benefit claimants and who had paid at least 30% of the annual maximum employee EI premiums in seven of the ten years preceding their EI claim and who had collected 35 or fewer weeks of EI regular or fishing benefits in the five years preceding their claim. This definition is similar to the EI claimant category long-tenured workers introduced under Connecting Canadians with Available Jobs.
Cost-benefit analysis
The cost-benefit analysis compared how much it cost for individuals to participate in the programs and how much it costs the government to deliver those programs with the benefits both the participants and the government drew from those programs. The analysis was carried out from the society perspective which combines the costs and the benefits for both the participants and the government.
Costs and benefits included in the calculations were as follows:
- Program costs included the administration cost and the direct cost of the EBSMs. The cost for each EBSM was calculated at the Action Plan Equivalent level. The costs were determined based on the average composition of the Action Plan Equivalent.
- The Marginal Social Cost of Public Funds represented the loss incurred by society when raising additional revenues such as taxes to fund government spending. The value was estimated as 20% of the program cost, sales taxes, income taxes, impacts on EI and impacts on social assistance paid or collected by the government.
- Employment earnings consisted of incremental impacts on participants’ earnings during and after participation. The calculation accounts for the participant’s forgone earnings during participation (in other words, the opportunity cost). These are based on incremental impacts for the 2002 to 2005 participants.
- Fringe benefits included benefits such as employer-paid health and life insurance as well as pension contributions. The rate used to calculate the fringe benefits was 15% of the incremental impact on earnings.
The program effects on EI and social assistance use, and the sale and income tax revenues were not included in the calculations since these costs and benefits cancel each other out from the social perspective by definition. For example, while EI and social assistance are benefits received by participants, they represent a cost for the government. However, as indicated above, these effects are accounted for in the calculation of the Marginal Social Cost of Public Funds.
When producing the results, to bring all costs and benefits to a common base and to account for inflation and interest on foregone government investment, the estimates for the second year of participation and up to the sixth year post-program were discounted by 5% per year. As well, when the benefits were still lower than the costs six years after program end, the payback period was calculated by assuming that the average benefit or cost measured over the fifth and six year post-program would persist over time (discounted at a 5% annual rate).
Labour market outcomes
The analysis of outcomes provides descriptive statistics on the labour market experience of participants before, during and after participation. For example, it shows the average annual earnings of active claimants before, during and after participation, and presents what changes were observed from before to after participation. Overall, the analyses were conducted over a period of 9 to 12 years (five years before participation, one or two years during participation, and three or five years after participation).
The outcome analyses provide an assessment of how the labour market situation of participants evolved over time, but does not permit inference regarding the extent to which those changes were due to EBSM participation. For example, increases in employment earnings over the period examined could be partly due to inflation or normal wage increases.
When the number of participants was sufficient, outcomes were also examined for active EI claimants who were youth (under 30 years old).
Strengths and limitations from the studies
Overall, the number of key informants interviewed was relatively small in some studies. The key informants’ responses were representative of their own experience and their own region but it is unclear if they were fully representative of the entire province.
The matching process led to the creation of comparison groups closely matched to the LMDA participants in terms of their background characteristics. Results obtained with Kernel Matching were validated with the use of two other techniques (that is, Inverse Propensity Weighting and Nearest Neighbour), increasing the level of confidence in the results. However, readers should be aware that incremental impacts may be affected by factors not captured by the matching process. For example, the motivation to seek employment was not directly measured except to the extent it was captured in prior income and labour market attachment patterns.
Readers should also keep in mind that it is not possible to compare the results obtained for each claimant type since the results for active claimants represent the effects of the EBSMs relative to non-participation while the results for former claimants represents the Employment Benefits relative to a limited treatment (that is, Employment Assistance Services).
The definition of long tenured workers differs from the definition used in the literature as it does not consider the number of years the worker remained employed with the same employer.
The cost-benefit analysis was limited in the sense that it only took into account the quantifiable benefits and costs that were directly linked to EBSM delivery and participation and that could be estimated using available administrative data and the EI Monitoring and Assessment Report. The analysis did not capture “intangible”, non-pecuniary and indirect benefits. It did not consider the multiplier effect that improving participant’s income may have on the economy and did not account for the effect of EI Part II investment on sustaining a service delivery infrastructure and creating jobs among the governmental program service providers. As well, this analysis did not consider the displacement effect where participants may take away jobs that would otherwise be filled by other unemployed individuals. Finally, this analysis did not consider the possible effect of EBSMs on increasing skill prices.
Appendix B - Detailed results Training PEI
Table B1. Socio-demographic and labour market characteristics of Training PEI participants
| Active claimants | Former claimants | |||
|---|---|---|---|---|
| 2002 to 2005 | 2007 to 2008 | 2002 to 2005 | 2007 to 2008 | |
| Number of observations | 3,668 | 1,516 | 433 | 257 |
| Gender | ||||
| Male | 56% | 55% | 43% | 47% |
| Female | 43% | 45% | 55% | 53% |
| Age | ||||
| Under 25 | 26% | 27% | 24% | 30% |
| 25 to 34 | 29% | 31% | 36% | 27% |
| 35 to 44 | 24% | 20% | 20% | 21% |
| 45 to 54 | 16% | 17% | 15% | 17% |
| 55 and over | 5% | 6% | 5% | 6% |
| Marital status | ||||
| Married or common-law | 43% | 40% | 39% | 39% |
| Widow/ divorced or separated | 11% | 10% | 13% | 12% |
| Single | 45% | 49% | 47% | 49% |
| Missing data / Unknown | 1% | 1% | 1% | 1% |
| Skills level related to National Occupation Code associated with the last EI claim opened before Training PEI participation1 | ||||
| Managerial | 3% | 5% | 3% | 5% |
| University | 2% | 3% | 4% | 1% |
| College or apprenticeship training | 32% | 26% | 24% | 30% |
| Secondary or occupational training | 36% | 39% | 36% | 32% |
| On-the-job training | 27% | 28% | 34% | 32% |
| Key Labour Market indicators in the year preceding the start of participation | ||||
| Earnings2 | $15,015 | $16,3413 | $8,284 | $9,5693 |
| Proportion Employed | 99% | 100% | 92% | 91% |
| Proportion on Employment Insurance | 74% | 71% | 83% | 75% |
| Proportion on Social Assistance | 7% | 4% | 17% | 10% |
| Proportions may not add up to 100% due to rounding 1Skill level corresponds to the type and/or amount of training or education typically required to work in the last occupation participants had before opening the last EI claim they had before participating in EBSMs: -Managerial: Management occupations -University: Occupations usually requiring university education (that is, University degree at the bachelor's, master's or doctorate level) -College or apprenticeship training: Occupations usually requiring college or vocational education or apprenticeship training such as 2 to 3 years of post-secondary education at a community college, institute of technology or CEGEP or 2 to 5 years of apprenticeship training or 3 to 4 years of secondary school and more than 2 years of on-the-job training, specialized training courses or specific work experience and/or occupations with supervisory responsibilities and occupations with significant health and safety responsibilities, such as firefighters, police officers and registered nursing assistants. - Secondary or occupational training: Occupations usually requiring secondary school and/or occupation-specific training such as one to four years of secondary school education or up to 2 years of on-the-job training specialized training courses or specific work experience. -On-the-job training: On-the-job training is usually provided for occupations (that is, short work demonstration or on-the-job training or no formal educational requirements). 2Average earnings for all individuals included in the study. The average was calculated including participants who reported $0 earnings during that year. 3Earnings for 2007 to 2008 participants have been adjusted by the Consumer Price Index published by Statistics Canada, using 2002 as the base year. |
||||
Table B2. Incremental impacts for Training PEI – active claimants
| Indicators | In-program period | Post-program period | Total in- and post-program | ||||||
|---|---|---|---|---|---|---|---|---|---|
| Program start year | Additional year | 1st year | 2nd year | 3rd year | 4th year | 5th year | Total post | ||
| All active claimants | |||||||||
| 2002 to 2005 participants (n= 3,654) | |||||||||
| Employment earnings ($) | -1,534*** | -1,583*** | 1,110*** | 2,773*** | 3,759*** | 4,042*** | 3,696*** | 15,380*** | 12,263*** |
| Incidence of employment (percentage points) |
-0.1 | 1.2** | 2.7*** | 2.3*** | 2.7*** | 2.4*** | 1.9*** | n/a | n/a |
| EI benefits ($) | 1,193*** | 797*** | -74 | -161* | -183** | -131 | -65 | -612 | 1,378*** |
| EI weeks (weeks) | 5.3*** | 4.1*** | 0.4 | -0.1 | -0.1 | 0.2 | 0.4 | 0.7 | 10*** |
| Social Assistance benefits ($) | 21 | 31 | -2 | -15 | -26 | -43 | -17 | -103 | -52 |
| Dependence on income support (percentage points) | 8.8*** | 7.1*** | -0.8 | -1.4*** | -2.0*** | -1.8*** | -0.6 | n/a | n/a |
| 2007 to 2008 participants (n=1,516) | |||||||||
| Employment earnings ($) | -2,459*** | -596 | 2,635*** | 4,591*** | 5,054*** | -- | -- | 12,273*** | 9,213*** |
| Incidence of employment (percentage points) |
-1.9** | -0.4 | 1.7** | 3.0*** | 2.6*** | -- | -- | n/a | n/a |
| EI benefits ($) | 1,050*** | -251 | -477*** | -393*** | -168 | -- | -- | -1,038*** | -239 |
| EI weeks (weeks) | 3.2*** | -0.2 | -1.1*** | -1.1** | -0.7 | -- | -- | -2.9*** | 0.0 |
| Social Assistance benefits ($) | 8 | -25 | -26 | -3 | -74 | -- | -- | -103 | -121 |
| Dependence on income support (percentage points) | 7.6*** | 2.2** | -2.3*** | -3.3*** | -1.6* | -- | -- | n/a | n/a |
| Sub-groups of active claimants | |||||||||
| Youth (below 30 years old) – 2002 to 2005 participants (n=1,553) | |||||||||
| Employment earnings ($) | -1,759** | -2,238** | 1,023*** | 2,803*** | 4,410*** | 4,500*** | 4,421*** | 17,157*** | 13,160*** |
| Incidence of employment (percentage points) |
3.3*** | 4.5*** | 5.9*** | 4.7*** | 4.5*** | 4.3*** | 4.0*** | n/a | n/a |
| EI benefits ($) | 1,280*** | 890*** | -108 | -241** | -294** | 23 | 92 | -527 | 1,643*** |
| EI weeks (weeks) | 7.1*** | 5.9*** | 1.3*** | 0.5 | 0.2 | 1.3*** | 1.3*** | 4.6*** | 17.7*** |
| Social Assistance benefits ($) | 69** | 23 | -26 | -33 | 8 | -46 | -6 | -102 | -10 |
| Dependence on income support (percentage points) | 9.6*** | 8.6*** | -1.5* | -1.9** | -2.3*** | -0.9 | -0.3 | n/a | n/a |
Significance level *** 1%; ** 5%; * 10%
Table B3. Incremental impacts for Training PEI – former claimants
| Indicators | In-program period | Post-program period | Total in- and post-program | ||||||
|---|---|---|---|---|---|---|---|---|---|
| Program start year | Additional year | 1st year | 2nd year | 3rd year | 4th year | 5th year | Total post | ||
| All former claimants | |||||||||
| 2002 to 2005 participants (n=433) | |||||||||
| Employment earnings ($) | -434 | -690 | 303 | 498 | 1,027 | 2,198** | 2,159** | 6,185* | 5,062 |
| Incidence of employment (percentage points) |
-0.5 | 5.2** | 6.9*** | 7.4*** | 4.4* | 4.3 | 6.0** | n/a | n/a |
| EI benefits ($) | 529** | 130 | 246 | 404 | 104 | 52 | 48 | 855 | 1,513 |
| EI weeks (weeks) | 1.6* | 0.4 | 1.2 | 1.2 | -0.2 | -0.3 | -0.6 | 1.3 | 3.3 |
| Social Assistance benefits ($) | -338** | -246* | -239* | -160 | -177 | -233 | -138 | -947 | -1,531* |
| Dependence on income support (percentage points) | 1.5 | -1.9 | -2.7 | -1.4 | -2.5 | -2.8 | -3.5* | n/a | n/a |
Significance level *** 1%; ** 5%; * 10%
Table B4. Cost-benefit results from the social perspective for Training PEI
| Total costs and benefits over participation (1 to 2 years) and 6 years post-program | Active claimants (n=3,654) |
Former claimants (n=433) |
|---|---|---|
| Program cost | -$9,345 | -$9,918 |
| Marginal social costs of public funds | -$1,613 | -$1,764 |
| Employment earnings (including participant’s forgone earnings) | $12,440 | $4,536 |
| Fringe benefit | $1,866 | $680 |
| Net present value (By how much do the benefits exceed the costs 6 years after participation?) |
$3,348 | -$6,465 |
| Cost-benefit ratio (How much does it cost in EI part II funds to achieve $1 in benefit 6 years after participation?) |
$0.70 | $2.90 |
| Payback period (How many years after participation would it take for the benefits to recover the costs?) |
5.1 years after participation | 11.5 years after participation |
Appendix C - Detailed results Training PEI – Apprentices
Table C1. Outcomes for active Training PEI – Apprentices in 2003 to 2005
| Active claimants | |
|---|---|
| 2003 to 2005 | |
| Number of observations | 216 |
| Gender | |
| Male | 94% |
| Female | 6% |
| Age | |
| Under 25 | 52% |
| 25 to 34 | 26% |
| 35 to 44 | 13% |
| 45 to 54 | 8% |
| 55 and over | 1% |
| Marital status | |
| Married or common-law | 33% |
| Widow/ divorced or separated | 6% |
| Single | 60% |
| Missing data / Unknown | 1% |
| Skills level related to National Occupation Code associated with the last EI claim opened before Training PEI – Apprentices participation1 | |
| Managerial | 0% |
| University | 0% |
| College or apprenticeship training | 70% |
| Secondary or occupational training | 5% |
| On-the-job training | 25% |
| Key Labour Market indicators in the year preceding the start of participation | |
| Earnings2 | $19,531 |
| Proportion Employed | 100% |
| Proportion on Employment Insurance | 44% |
| Proportion on Social Assistance | 2% |
| Proportions may not add up to 100% due to rounding. 1Skill level corresponds to the type and/or amount of training or education typically required to work in the last occupation participants had before opening the last EI claim they had before participating in EBSMs. 2 Average earnings for all individuals included in the study. The average was calculated including participants who reported $0 earnings during that year. 3Earnings for 2007 to 2008 participants have been adjusted by the Consumer Price Index published by Statistics Canada, using 2002 as the base year. |
|
Table C2. Outcomes for active Training PEI – Apprentices in 2003 to 2005
| Average outcomes | Pre-program period | Program period | Post-program period | Average annual outcomes pre-1 | Average annual outcomes post-2 | Change3 | ||||||||||
|---|---|---|---|---|---|---|---|---|---|---|---|---|---|---|---|---|
| 5 yrs pre | 4 yrs pre | 3 yrs pre | 2 yrs pre | 1 yr pre | Program start year | 1 yr year | 2 yrs post | 3 yrs post | 4yrs post | 5 yrs post | 6 yrs post | 7 yrs post | ||||
| All active claimants (n=170 ) | ||||||||||||||||
| Earnings including $04 | $12,577 | $14,787 | $17,142 | $19,044 | $21,387 | $21,132 | $28,286 | $32,899 | $36,988 | $39,606 | $38,105 | $42,531 | $46,143 | $16,987 | $41,596 | $24,609 |
| Earnings excluding $05 | $12,653 | $14,787 | $17,142 | $19,044 | $21,387 | $21,258 | $28,626 | $32,899 | $38,850 | $41,328 | $39,804 | $44,671 | $47,124 | $17,003 | $43,232 | $26,229 |
| Proportion employed | 99% | 100% | 100% | 100% | 100% | 99% | 99% | 100% | 95% | 96% | 96% | 95% | 98% | 100% | 96% | -4pp |
| Proportion on EI | 42% | 48% | 52% | 57% | 52% | 100% | 71% | 65% | 53% | 44% | 45% | 40% | 46% | 50% | 44% | -6pp |
| EI benefits | $1,944 | $2,356 | $2,430 | $2,863 | $2,341 | $4,215 | $3,246 | $3,361 | $3,439 | $3,021 | $3,452 | $2,485 | $3,791 | $2,387 | $3,187 | $800 |
| Number of weeks on EI | 7.32 | 8.51 | 8.34 | 9.26 | 8.06 | 13.7 | 9.98 | 9.02 | 8.76 | 7.58 | 8.17 | 5.99 | 7.05 | 8.3 | 7.2 | -1.1 |
| Proportion on SA | 4% | 4% | 2% | 3% | 3% | 5% | 3% | 2% | 2% | 4% | 3% | 4% | 0% | 3% | 3% | 0pp |
| SA benefits | $185 | $128 | $109 | $134 | $180 | $132 | $85 | $44 | $88 | $79 | $66 | $89 | $0 | $147 | $59 | -$89 |
| Dependence on income support | 12% | 13% | 12% | 13% | 12% | 19% | 13% | 12% | 13% | 11% | 12% | 8% | 12% | 12% | 11% | -1pp |
| Proportion self employed | 10% | 10% | 10% | 16% | 15% | 15% | 13% | 16% | 14% | 13% | 13% | 16% | 16% | 12% | 14% | 2pp |
1Average annual outcome pre-: Represents the average annual outcomes over the pre-participation period
2Average annual outcome post-: Represents the average annual outcomes over the post-participation period
3Change between pre- and post-: Represents the difference between the average annual outcome calculated over the pre-participation period and the average annual outcome calculated over the post-participation period.
4Earnings outcome for all individuals covered by the study.
5Earnings outcomes excluding individuals who reported no earnings in a given year.
SA: Social Assistance; pp: Percentage Points.
Appendix D - Detailed results Employ PEI
Table D1. Socio-demographic and labour market characteristics of Employ PEI participants
| Active claimants | Former claimants | |||
|---|---|---|---|---|
| 2002 to 2005 | 2007 to 2008 | 2002 to 2005 | 2007 to 2008 | |
| Number of observations | 373 | 80 | 654 | 101 |
| Gender | ||||
| Male | 50% | 59% | 55% | 47% |
| Female | 49% | 41% | 44% | 53% |
| Age | ||||
| Under 25 | 15% | 6% | 14% | 10% |
| 25 to 34 | 29% | 25% | 28% | 35% |
| 35 to 44 | 28% | 34% | 25% | 28% |
| 45 to 54 | 23% | 25% | 20% | 14% |
| 55 and over | 6% | 10% | 12% | 14% |
| Marital status | ||||
| Married or common-law | 51% | 53% | 54% | 43% |
| Widow/ divorced or separated | 16% | 11% | 11% | 9% |
| Single | 32% | 35% | 33% | 46% |
| Missing data / Unknown | 1% | 1% | 1% | 3% |
| Skills level related to National Occupation Code associated with the last EI claim opened before Employ PEI participation1 | ||||
| Managerial | 7% | 14% | 7% | 8% |
| University | 3% | 6% | 4% | 5% |
| College or apprenticeship training | 28% | 39% | 33% | 35% |
| Secondary or occupational training | 34% | 21% | 31% | 32% |
| On-the-job training | 28% | 20% | 25% | 21% |
| Key Labour Market indicators in the year preceding the start of participation | ||||
| Earnings2 | $14,969 | $17,6153 | $13,200 | $12,1043; |
| Proportion Employed | 99% | 97% | 96% | 97% |
| Proportion on Employment Insurance | 83% | 66% | 86% | 73% |
| Proportion on Social Assistance | 6% | 8% | 6% | 6% |
| Proportions may not add up to 100% due to rounding 1Skill level corresponds to the type and/or amount of training or education typically required to work in the last occupation participants had before opening the last EI claim they had before participating in EBSMs. A detailed definition is provided in Table B1. 2 Average earnings for all individuals included in the study. The average was calculated including participants who reported $0 earnings during that year. 3Earnings for 2007 to 2008 participants have been adjusted by the Consumer Price Index published by Statistics Canada, using 2002 as the base year. |
||||
Table D2. Incremental impacts for Employ PEI – active claimants
| Indicators | In-program period | Post-program period | Total in- and post-program | ||||||
|---|---|---|---|---|---|---|---|---|---|
| Program start year | Additional year | 1st year | 2nd year | 3rd year | 4th year | 5th year | Total post | ||
| Active claimants | |||||||||
| 2002 to 2005 participants (n=373) | |||||||||
| Employment earnings ($) | -283 | 1,011* | 1,434*** | 2,392*** | 2,844*** | 3,805*** | 4,023*** | 14,499*** | 15,227*** |
| Incidence of employment (percentage points) |
3** | 4.2** | 1.8 | 3.4** | 5.7*** | 4.5** | 6.4*** | n/a | n/a |
| EI benefits ($) | 88 | -759*** | -1,043*** | -869*** | -780*** | -300 | -580** | -3,572*** | -4,243*** |
| EI weeks (weeks) | 1.1 | -1.3 | -2.0** | -1.6* | -1.7** | -0.8 | -1.3 | -7.4*** | -7.7 |
| Social Assistance benefits ($) | -125** | -121* | -114*** | -88 | -63 | -97 | -83 | -445 | -691* |
| Dependence on income support (percentage points) | -3.0** | -4.6*** | -3.9*** | -4.2*** | -3.8*** | -2.2*** | -4.6*** | n/a | n/a |
Table D3. Incremental impacts for Training PEI – former claimants
| Indicators | In-program period | Post-program period | Total in- and post-program | ||||||
|---|---|---|---|---|---|---|---|---|---|
| Program start year | Additional year | 1st year | 2nd year | 3rd year | 4th year | 5th year | Total post | ||
| Former claimants | |||||||||
| 2002 to 2005 participants (n=654) | |||||||||
| Employment earnings ($) | 1,326*** | 2,928*** | 1,845*** | 655 | 2,523*** | 3,645*** | 3,149*** | 11,819*** | 16,073*** |
| Incidence of employment (percentage points) |
7.2*** | 5.4*** | 5.6*** | 3.6 | 3.3 | 1.7 | 1.1 | n/a | n/a |
| EI benefits ($) | 1,806*** | 551*** | 318 | 635*** | 107 | 3 | -150 | 913 | 3,270*** |
| EI weeks (weeks) | 3.7*** | 0.6 | 0.9 | 1.8** | -0.4 | -1.0 | -1.6* | -0.3 | 4 |
| Social Assistance benefits ($) | -521*** | -479*** | -317*** | -293*** | -196 | -205* | -152 | -1,163** | -2,163*** |
| Dependence on income support (percentage points) | -9.4*** | -5.4** | -0.5 | 1.2 | -4.1 | -5.0* | -5.6* | n/a | n/a |
Significance level *** 1%; ** 5%; * 10%
Table D4. Cost-benefit results from the social perspective for Employ PEI
| Total costs and benefits over participation (1 to 2 years) and 6 years post-program | Active claimants (n=373) |
Former claimants (n=654) |
|---|---|---|
| Program cost | -$9,355 | -$4,510 |
| Marginal social costs of public funds | -$493 | -$229 |
| Employment earnings (including participant’s forgone earnings) | $15,122 | $15,624 |
| Fringe benefit | $2,268 | $2,344 |
| Net present value (By how much do the benefits exceed the costs 6 years after participation?) |
$7,542 | $13,229 |
| Cost-benefit ratio (How much does it cost in EI part II funds to achieve $1 in benefit 6 years after participation?) |
$0.60 | $0.30 |
| Payback period (How many years after participation would it take for the benefits to recover the costs?) |
3.9 years after participation | Within the first year post-program |
Appendix E - Detailed results Self Employ PEI
Table E1. Socio-demographic and labour market characteristics of Self Employ PEI participants
| Active Claimants | Former Claimants | |||
|---|---|---|---|---|
| 2002-2005 | 2007-2008 | 2002-2005 | 2007-2008 | |
| Number of observations | 399 | 162 | 94 | 44 |
| Gender | ||||
| Male | 60% | 59% | 53% | 57% |
| Female | 39% | 41% | 46% | 43% |
| Age | ||||
| Under 25 | 3% | 6% | 7% | 2% |
| 25-34 | 32% | 27% | 30% | 34% |
| 35-44 | 38% | 33% | 32% | 34% |
| 45-54 | 20% | 23% | 23% | 27% |
| 55 and over | 8% | 7% | 7% | 2% |
| Marital status | ||||
| Married or common-law | 61% | 62% | 57% | 75% |
| Widow/ divorced or separated | 14% | 12% | 12% | 5% |
| Single | 23% | 23% | 27% | 18% |
| Missing data / Unknown | 2% | 2% | 4% | 2% |
| Skills level related to National Occupation Code associated with the last EI claim opened before Self Employ PEI participation1 | ||||
| Managerial | 8% | 12% | 7% | 5% |
| University | 7% | 8% | 15% | 5% |
| College or apprenticeship training | 42% | 42% | 30% | 45% |
| Secondary or occupational training | 31% | 23% | 27% | 16% |
| On-the-job training | 12% | 15% | 21% | 30% |
| Key Labour Market Indicators In the Year Preceding the Start of Participation | ||||
| Earnings2 | $19,881 | $19,2313 | $10,696 | $8,8053 |
| Proportion Employed | 98% | 99% | 89% | 89% |
| Proportion on Employment Insurance | 68% | 67% | 88% | 82% |
| Proportion on Social Assistance | 5% | 1% | 5% | 9% |
| Proportions may not add up to 100% due to rounding 1Skill level corresponds to the type and/or amount of training or education typically required to work in the last occupation participants had before opening the last EI claim they had before participating in EBSMs. A detailed definition is provided in Table B1. 2 Average earnings for all individuals included in the study. The average was calculated including participants who reported $0 earnings during that year. 3Earnings for 2007-2008 participants have been adjusted by the Consumer Price Index published by Statistics Canada, using 2002 as the base year. |
||||
Table E2. Outcomes for active claimants in Self Employ PEI in 2002 to 2005
| Average outcomes | Pre-program period | Program period | Post-program period | Average annual outcomes pre-1 | Average annual outcomes post-2 | Change3 | |||||||||||||||||||||||||
|---|---|---|---|---|---|---|---|---|---|---|---|---|---|---|---|---|---|---|---|---|---|---|---|---|---|---|---|---|---|---|---|
| 5 yrs pre | 4 yrs pre | 3 yrs pre | 2 yrs pre | 1 yr pre | Program start year | 1 yr post start year | 1 yr post | 2 yrs post | 3 yrs post | 4 yrs post | 5 yrs post | ||||||||||||||||||||
| All active claimants (n=399) | |||||||||||||||||||||||||||||||
| Earnings including $04 | $14,017 | $15,333 | $17,906 | $19,273 | $19,881 | $9,538 | $8,612 | $13,023 | $15,675 | $17,444 | $18,369 | $19,287 | $17,282 | $16,759 | -$523 | ||||||||||||||||
| Earnings excluding $05 | $15,991 | $16,999 | $19,209 | $20,081 | $20,236 | $11,227 | $13,800 | $19,033 | $22,022 | $25,588 | $27,450 | $29,371 | $18,503 | $24,693 | $6,190 | ||||||||||||||||
| Proportion employed | 87% | 90% | 93% | 96% | 98% | 85% | 62% | 68% | 71% | 68% | 67% | 66% | 93% | 68% | -25pp | ||||||||||||||||
| Proportion on EI | 45% | 46% | 48% | 53% | 68% | 100% | 72% | 33% | 34% | 32% | 31% | 30% | 52% | 32% | -20pp | ||||||||||||||||
| EI benefits | $2,540 | $2,526 | $2,524 | $2,883 | $3,505 | $8,807 | $4,899 | $1,944 | $2,315 | $2,260 | $2,256 | $2,367 | $2,796 | $2,229 | -$567 | ||||||||||||||||
| Number of weeks on EI | 9.6 | 9.7 | 9.5 | 10.3 | 12.2 | 29.4 | 16.8 | 6.6 | 7.2 | 6.7 | 6.7 | 6.8 | 10.2 | 6.8 | -3.4 | ||||||||||||||||
1Average annual outcome pre-: Represents the average annual outcomes over the pre-participation period
2Average annual outcome post-: Represents the average annual outcomes over the post-participation period
3Change between pre- and post-: Represents the difference between the average annual outcome calculated over the pre-participation period and the average annual outcome calculated over the post-participation period.
4Earnings outcome for all individuals covered by the study.
5Earnings outcomes excluding individuals who reported no earnings in a given year.
SA: Social Assistance; pp: Percentage Points.
Table E3. Outcomes for former claimants in Self Employ PEI in 2002 to 2005
| Average outcomes | Pre-program period | Program period | Post-program period | Average annual outcomes pre-1 | Average annual outcomes post-2 | Change3 | |||||||||
|---|---|---|---|---|---|---|---|---|---|---|---|---|---|---|---|
| 5 yrs pre | 4 yrs pre | 3 yrs pre | 2 yrs pre | 1 yr pre | Program start year | 1 yr post start year | 1 yr post | 2 yrs post | 3 yrs post | 4 yrs post | 5 yrs post | ||||
| All former claimants (n=94) | |||||||||||||||
| Earnings including $04 | $12,858 | $13,409 | $15,442 | $15,103 | $10,696 | $4,510 | $8,763 | $11,994 | $13,381 | $13,669 | $12,894 | $17,380 | $13,502 | $13,864 | $362 |
| Earnings excluding $05 | $14,763 | $14,488 | $16,495 | $15,601 | $11,969 | $7,066 | $11,767 | $17,083 | $20,287 | $21,064 | $20,898 | $27,691 | $14,663 | $21,404 | $6,741 |
| Proportion employed | 86% | 93% | 94% | 97% | 89% | 64% | 75% | 70% | 66% | 65% | 62% | 63% | 92% | 65% | -27pp |
| Proportion on EI | 50% | 50% | 57% | 63% | 88% | 65% | 20% | 29% | 36% | 38% | 39% | 35% | 62% | 36% | -26pp |
| EI benefits | $2,581 | $2,973 | $3,187 | $3,673 | $6,200 | $3,750 | $1,021 | $1,629 | $2,603 | $2,467 | $3,027 | $2,360 | $3,723 | $2,417 | -$1,306 |
| Number of weeks on EI | 10.3 | 11.5 | 12.6 | 13.6 | 21.7 | 13.4 | 3.8 | 5.6 | 8.3 | 8.3 | 9.1 | 7.1 | 13.9 | 7.7 | -6.2 |
| Proportion on SA | 10% | 6% | 5% | 7% | 5% | 10% | 7% | 9% | 10% | 5% | 6% | 6% | 7% | 7% | 0pp |
| SA benefits | $304 | $389 | $226 | $310 | $267 | $274 | $296 | $432 | $201 | $164 | $257 | $417 | $299 | $294 | -$5 |
| Dependence on income support | 22% | 21% | 22% | 24% | 43% | 52% | 11% | 16% | 20% | 17% | 21% | 17% | 26% | 18% | -8pp |
1Average annual outcome pre-: Represents the average annual outcomes over the pre-participation period
2Average annual outcome post-: Represents the average annual outcomes over the post-participation period
3Change between pre- and post-: Represents the difference between the average annual outcome calculated over the pre-participation period and the average annual outcome calculated over the post-participation period.
4Earnings outcome for all individuals covered by the study.
5Earnings outcomes excluding individuals who reported no earnings in a given year.
SA: Social Assistance; pp: Percentage Points.
Appendix F - Detailed results Work Experience PEI
Table F1. Socio-demographic and labour market characteristics of Work Experience PEI participants
| Active claimants | Former claimants | |||
|---|---|---|---|---|
| 2002 to 2005 | 2007 to 2008 | 2002 to 2005 | 2007 to 2008 | |
| Number of observations | 161 | 137 | 86 | 128 |
| Gender | ||||
| Male | 60% | 63% | 80% | 70% |
| Female | 40% | 37% | 17% | 30% |
| Age | ||||
| Under 25 | 16% | 27% | 14% | 14% |
| 25 to 34 | 31% | 23% | 30% | 28% |
| 35 to 44 | 27% | 20% | 22% | 23% |
| 45 to 54 | 18% | 17% | 20% | 21% |
| 55 and over | 8% | 12% | 14% | 13% |
| Marital status | ||||
| Married or common law | 47% | 37% | 41% | 35% |
| Widow/ divorced or separated | 12% | 11% | 5% | 16% |
| Single | 40% | 48% | 47% | 45% |
| Missing data / Unknown | 1% | 4% | 8% | 3% |
| Skills level related to National Occupation Code associated with the last EI claim opened before Work Experience PEI participation1 | ||||
| Managerial | 4% | 4% | 2% | 3% |
| University | 9% | 4% | 7% | 5% |
| College or apprenticeship training | 26% | 20% | 31% | 27% |
| Secondary or occupational training | 27% | 39% | 26% | 32% |
| On-the-job training | 34% | 34% | 34% | 34% |
| Key Labour Market indicators in the year preceding the start of participation | ||||
| Earnings2 | $12,548 | $10,8823 | $7,123 | $6,7363 |
| Proportion employed | 99% | 99% | 93% | 84% |
| Proportion on Employment Insurance | 79% | 78% | 84% | 78% |
| Proportion on Social Assistance | 13% | 7% | 14% | 12% |
| Proportions may not add up to 100% due to rounding 1Skill level corresponds to the type and/or amount of training or education typically required to work in the last occupation participants had before opening the last EI claim they had before participating in EBSMs. A detailed definition is provided in Table B1. 2 Average earnings for all individuals included in the study. The average was calculated including participants who reported $0 earnings during that year. 3Earnings for 2007 to 2008 participants have been adjusted by the Consumer Price Index published by Statistics Canada, using 2002 as the base year. |
||||
Table F2. Outcomes for active claimants in Work Experience PEI in 2002 to 2005
| Average outcomes | Pre-program period | Program period | Post-program period | Average annual outcomes pre-1 | Average annual outcomes post-2 | Change3 | |||||||||
|---|---|---|---|---|---|---|---|---|---|---|---|---|---|---|---|
| 5 yrs pre | 4 yrs pre | 3 yrs pre | 2 yrs pre | 1 yr pre | Program start year | 1 yr post start year | 1 yr post | 2 yrs post | 3 yrs post | 4 yrs post | 5 yrs post | ||||
| All active claimants (n=161) | |||||||||||||||
| Earnings including $04 | $11,373 | $11,367 | $12,289 | $11,366 | $12,548 | $8,673 | $12,762 | $17,437 | $19,786 | $20,264 | $21,434 | $22,282 | $11,788 | $20,241 | $8,453 |
| Earnings excluding $05 | $12,369 | $12,472 | $13,113 | $11,889 | $12,706 | $9,248 | $14,782 | $19,770 | $21,969 | $22,975 | $25,562 | $28,027 | $12,510 | $23,661 | $11,151 |
| Proportion employed | 85% | 89% | 93% | 96% | 99% | 88% | 90% | 88% | 84% | 80% | 92% | 86% | -6pp | ||
| Proportion on EI | 49% | 53% | 60% | 68% | 79% | 100% | 78% | 64% | 61% | 56% | 45% | 48% | 62% | 55% | -7pp |
| EI benefits | $2,764 | $3,045 | $3,042 | $4,097 | $4,015 | $7,737 | $4,994 | $3,991 | $3,723 | $3,795 | $3,585 | $3,759 | $3,393 | $3,771 | $378 |
| Number of weeks on EI | 11.4 | 12.4 | 12.8 | 16.1 | 16.1 | 27.1 | 17.1 | 14.3 | 12.9 | 12 | 10.9 | 10.8 | 13.8 | 12.2 | -1.6 |
| Proportion on SA | 8% | 8% | 8% | 7% | 13% | 9% | 11% | 9% | 8% | 8% | 4% | 4% | 9% | 7% | -2pp |
| SA benefits | $240 | $173 | $204 | $178 | $312 | $326 | $346 | $220 | $220 | $154 | $179 | $185 | $222 | $192 | -$30 |
| Dependence on income support | 21% | 24% | 23% | 29% | 28% | 52% | 38% | 26% | 23% | 23% | 22% | 22% | 25% | 23% | -2pp |
1Average annual outcome pre-: Represents the average annual outcomes over the pre-participation period
2Average annual outcome post-: Represents the average annual outcomes over the post-participation period
3Change between pre- and post-: Represents the difference between the average annual outcome calculated over the pre-participation period and the average annual outcome calculated over the post-participation period.
4Earnings outcome for all individuals covered by the study.
5Earnings outcomes excluding individuals who reported no earnings in a given year.
SA: Social Assistance; pp: Percentage Points.
Table F3. Outcomes for former claimants in Work Experience PEI in 2002 to 2005
| Average outcomes | Pre-program period | Program period | Post-program period | Average annual outcomes pre-1 | Average annual outcomes post-2 | Change3 | |||||||||
|---|---|---|---|---|---|---|---|---|---|---|---|---|---|---|---|
| 5 yrs pre | 4 yrs pre | 3 yrs pre | 2 yrs pre | 1 yr pre | Program start year | 1 yr post start year | 1 yr post | 2 yrs post | 3 yrs post | 4 yrs post | 5 yrs post | ||||
| All former claimants (n=86) | |||||||||||||||
| Earnings including $04 | $7,766 | $8,499 | $9,330 | $10,490 | $7,123 | $6,176 | $9,070 | $12,136 | $13,542 | $14,448 | $13,503 | $12,990 | $8,641 | $13,324 | $4,683 |
| Earnings excluding $05 | $8,379 | $9,519 | $9,554 | $11,008 | $7,657 | $7,588 | $11,143 | $14,495 | $16,637 | $17,257 | $17,333 | $18,619 | $9,223 | $16,868 | $7,645 |
| Proportion employed | 88% | 87% | 97% | 95% | 93% | 84% | 81% | 84% | 78% | 70% | 92% | 79% | -13pp | ||
| Proportion on EI | 56% | 62% | 70% | 78% | 84% | 72% | 47% | 52% | 50% | 56% | 56% | 50% | 70% | 53% | -17pp |
| EI benefits | $2,842 | $3,011 | $3,270 | $4,084 | $4,723 | $3,533 | $2,458 | $3,540 | $3,948 | $4,538 | $4,774 | $4,547 | $3,586 | $4,269 | $683 |
| Number of weeks on EI | 12.6 | 13.9 | 14.6 | 16.4 | 19.4 | 14.1 | 9 | 11.6 | 12.4 | 13.9 | 14.3 | 13.3 | 15.4 | 13.1 | -2.3 |
| Proportion on SA | 19% | 19% | 15% | 13% | 14% | 22% | 21% | 11% | 11% | 15% | 16% | 14% | 16% | 13% | -3pp |
| SA benefits | $738 | $700 | $504 | $519 | $563 | $692 | $737 | $677 | $710 | $767 | $810 | $651 | $605 | $723 | $118 |
| Dependence on income support | 31% | 29% | 31% | 33% | 43% | 40% | 30% | 26% | 27% | 32% | 35% | 36% | 33% | 31% | -2pp |
1Average annual outcome pre-: Represents the average annual outcomes over the pre-participation period
2Average annual outcome post-: Represents the average annual outcomes over the post-participation period
3Change between pre- and post-: Represents the difference between the average annual outcome calculated over the pre-participation period and the average annual outcome calculated over the post-participation period.
4Earnings outcome for all individuals covered by the study.
5Earnings outcomes excluding individuals who reported no earnings in a given year.
SA: Social Assistance; pp: Percentage Points.
Appendix G - Detailed results Employment Assistance Services
Table G1. Socio-demographic and labour market characteristics of Employment Assistance Services
| Active claimants | Former claimants | |||||
|---|---|---|---|---|---|---|
| 2002 to 2005 | 2007 to 2008 | 2002 to 2005 | 2007 to 2008 | |||
| Number of observations | 1,667 | 1,635 | 1,068 | 904 | ||
| Gender | ||||||
| Male | 42% | 54% | 46% | 47% | ||
| Female | 50% | 46% | 49% | 53% | ||
| Age | ||||||
| Under 25 | 17% | 15% | 20% | 18% | ||
| 25 to 34 | 31% | 24% | 32% | 29% | ||
| 35 to 44 | 25% | 26% | 24% | 23% | ||
| 45 to 54 | 20% | 24% | 18% | 20% | ||
| 55 and over | 7% | 11% | 6% | 11% | ||
| Marital status | ||||||
| Married or common-law | 42% | 47% | 32% | 35% | ||
| Widow/ divorced or separated | 16% | 13% | 16% | 16% | ||
| Single | 40% | 37% | 49% | 45% | ||
| Missing data / Unknown | 2% | 3% | 3% | 5% | ||
| Skills level related to National Occupation Code associated with the last EI claim opened before Employment Assistance Services participation1 | ||||||
| Managerial | 4% | 6% | 3% | 5% | ||
| University | 3% | 3% | 4% | 4% | ||
| College or apprenticeship training | 21% | 29% | 20% | 22% | ||
| Secondary or occupational training | 34% | 34% | 32% | 37% | ||
| On-the-job training | 37% | 28% | 42% | 32% | ||
| Key Labour Market indicators in the year preceding the start of participation | ||||||
| Earnings2 | $12,938 | $16,3143 | $7,095 | $9,7803 | ||
| Proportion employed | 98% | 99% | 88% | 87% | ||
| Proportion on Employment Insurance | 77% | 72% | 75% | 66% | ||
| Proportion on Social Assistance | 13% | 7% | 29% | 19% | ||
| Proportions may not add up to 100% due to rounding 1Skill level corresponds to the type and/or amount of training or education typically required to work in the last occupation participants had before opening the last EI claim they had before participating in EBSMs. A detailed definition is provided in Table B1. 2 Average earnings for all individuals included in the study. The average was calculated including participants who reported $0 earnings during that year. 3Earnings for 2007 to 2008 participants have been adjusted by the Consumer Price Index published by Statistics Canada, using 2002 as the base year. |
||||||
Table G2. Incremental impacts for Employment Assistance Services
| Indicators | In-program period | Post-program period | Total in- and post-program | ||||||
|---|---|---|---|---|---|---|---|---|---|
| 1st year | 2nd year | 3rd year | 4th year | 5th year | Total post | ||||
| Active claimants | |||||||||
| 2002 to 2005 participants (n=1,665) | |||||||||
| Employment earnings ($) | -1,737*** | -528 | -196 | 122 | 159 | 599 | 156 | -1,581 | |
| Incidence of employment (percentage points) |
0.8 | 1.4 | 0.4 | 0.4 | -0.1 | 1.7 | n/a | n/a | |
| EI benefits ($) | 182 | -605*** | -580*** | -556*** | -560*** | -547*** | -2,848*** | -2,667*** | |
| EI weeks (weeks) | 1** | -1.7*** | -1.6*** | -1.4*** | -1.4*** | -1.3*** | -7.4*** | -6.5*** | |
| SA benefits ($) | -19 | -27 | -94 | -49 | -51 | -62 | -282 | -301 | |
| Dependence on income support (percentage points) | 6.9*** | 0.1 | -0.7 | -0.6 | 0 | -1.6* | n/a | n/a | |
| 2007 to 2008 participants (n=1,635) | |||||||||
| Employment earnings ($) | -1,480*** | 426*** | $870 | 1,089** | -- | -- | 2,386** | 906 | |
| Incidence of employment (percentage points) |
-0.4 | 1.7** | 2.0** | 1.0 | -- | -- | n/a | n/a | |
| EI benefits ($) | 410*** | -645*** | -330** | -506 | -- | -- | -1,481* | -1,070*** | |
| EI weeks (weeks) | 1.2*** | -1.8*** | -0.6 | -1.2*** | -- | -- | -3.6*** | -2.5** | |
| SA benefits ($) | -2 | 54 | 30 | 32 | -- | -- | 116 | 114 | |
| Dependence on income support (percentage points) | 5.4 | -1.8** | -0.5 | -0.7 | -- | -- | n/a | n/a | |
| Sub-groups of active claimants | |||||||||
| Youth (below 30 years old) – 2002 to 2005 participants (n=582) | |||||||||
| Employment earnings ($) | -1,172*** | -84 | -201 | -535 | -1,409 | -1,666* | -3,894 | -5,066 | |
| Incidence of employment (percentage points) |
2.3* | 1.5 | 0.7 | -1.5 | -3.5** | -2.5 | n/a | n/a | |
| EI benefits ($) | -152 | -788*** | -620*** | -355* | -298 | -279 | -2,340*** | -2,491*** | |
| EI weeks (weeks) | 1.3** | -1.6** | -1.2* | -0.1 | 0 | 0.1 | -2.9 | -1.6 | |
| SA benefits ($) | 92 | 163** | 164** | 257*** | 189** | 195** | 969*** | 1,061*** | |
| Dependence on income support (percentage points) | 5.1*** | 0.7 | 0.6 | 2.7 | 4.0*** | 3.5** | N/a | N/a | |
| Long-Tenured workers- 2007 to 2009 participants (n=302) | |||||||||
| Employment earnings ($) | -2,464*** | -379 | 244 | 137 | -- | -- | 2 | -2,462 | |
| Incidence of employment (percentage points) |
0 | 1.6 | 1.6 | 0.7 | -- | -- | n/a | n/a | |
| EI benefits ($) | 630* | -177 | 159 | 425 | -- | -- | 407 | 1,036 | |
| EI weeks (weeks) | 1.5* | 0.0 | 0.9 | 0.7 | -- | -- | 1.5 | 3.0 | |
| SA benefits ($) | 16 | 20 | 77 | 51 | -- | -- | 148 | 164 | |
| Dependence on income support (percentage points) | 3.3* | -0.7 | 3.7 | 3.6 | -- | -- | n/a | n/a | |
Table G3. Cost-benefit results from the social perspective for Employment Assistance Service
| Total costs and benefits over participation (1 to 2 years) and 6 years post-program | Active claimants (n=1,665) |
||||||||
|---|---|---|---|---|---|---|---|---|---|
| Program cost | -$947 | ||||||||
| Marginal social costs of public funds | $211 | ||||||||
| Employment earnings (including participant’s forgone earnings) | -$1,052 | ||||||||
| Fringe benefit | -$158 | ||||||||
| Net present value (By how much do the benefits exceed the costs within 6 years after participation?) |
-$1,946 | ||||||||
| Cost-benefit ratio (How much does it cost in EI part II funds to achieve $1 in benefit 6 years after participation?) |
Negative benefits | ||||||||
| Payback period (How many years after participation would it take for the benefits to recover the costs?) | 8.9 years after participation | ||||||||
Table G4. Labour market outcomes for Employment Assistance Services – active claimants
| Average outcomes | Pre-program period | Program start year | Post-program period | Average annual outcomes pre-1 | Average annual outcomes post-2 | Change3 | ||||||||
|---|---|---|---|---|---|---|---|---|---|---|---|---|---|---|
| 5 yrs pre | 4 yrs pre | 3 yrs pre | 2 yrs pre | 1 yr pre | 1 yr post start year | 2 yrs post start year | 3 yrs post start year | 4 yrs post start year | 5 yrs post start year | |||||
| All active claimants (n=1,665) | ||||||||||||||
| Earnings including $04 | $10,248 | $10,840 | $11,629 | $12,709 | $12,938 | $9,867 | $12,510 | $14,588 | $16,532 | $17,820 | $18,480 | $11,673 | $14,966 | $3,293 |
| Earnings excluding $05 | $11,474 | $11,812 | $12,531 | $13,299 | $13,216 | $10,378 | $13,667 | $16,367 | $18,866 | $20,821 | $22,025 | $12,466 | $17,021 | $4,555 |
| Proportion employed | 82% | 87% | 91% | 95% | 98% | 95% | 92% | 89% | 88% | 86% | 84% | 90% | 89% | -1pp |
| Proportion on EI | 49% | 53% | 56% | 62% | 77% | 99% | 74% | 60% | 57% | 52% | 52% | 59% | 66% | 7pp |
| EI benefits | $2,393 | $2,687 | $2,855 | $3,133 | $3,993 | $5,898 | $4,106 | $3,888 | $3,793 | $3,719 | $3,772 | $3,012 | $4,196 | $1,184 |
| Number of weeks on EI | 11 | 12.1 | 12.3 | 13.2 | 16.4 | 24.3 | 16.4 | 14.2 | 13.2 | 12.3wk | 12 | 13 | 15.4 | 2.4 |
| Proportion on SA | 12% | 12% | 12% | 13% | 13% | 14% | 14% | 12% | 12% | 11% | 10% | 12% | 12% | 0pp |
| SA benefits | $664 | $615 | $570 | $523 | $413 | $390 | $512 | $489 | $492 | $475 | $462 | $557 | $470 | -$87 |
| Dependence on income support | 24% | 25% | 25% | 26% | 28% | 44% | 33% | 28% | 27% | 26% | 25% | 26% | 31% | 5pp |
Appendix H. List of six studies included in the Prince Edward Island Synthesis report
Table H1. Overview of studies included in this summary
| Study | Evidence included in this summary report | Methods | Reference period | Observation period |
|---|---|---|---|---|
| Profile, Outcomes and Net Impacts of Employment Benefits and Support Measures (EBSM) Participants in PEI (Completed in March 2014) | - Incremental impacts for participants including youth and older workers - Profile and socio-demographic characteristics of participants |
- Non-experimental method using propensity score matching in combination with Difference-in-Differences - Statistical profiling |
2002 to 2005 participants | 11 to 12 consecutive years between 1997 and 2011 (that is, 5 years pre-program, 1 to 2 years in-program and 5 years post-program) |
| Cost-Benefit Analysis of Employment Benefits and Support Measures Delivered in PEI (Completed in May 26, 2016) | - Cost-benefit analysis | - Non-experimental method using propensity score matching in combination with Difference-in-Differences - Cost analysis |
8 years between 2002 and 2013 (that is, 2 years in-program and 6 years post-program) |
|
| Analysis of EBSM Profile, Outcomes and Incremental Impacts for 2007 to 2008 Participants in PEI (Completed in February 16, 2015) | - Incremental impacts - Profile and socio-demographic characteristics of participants |
- Non-experimental method using propensity score matching in combination with Difference-in-Differences - Statistical profiling |
2007 to 2008 participants | 9 to 10 consecutive years between 2002 and 2012 (that is, 5 years pre-program, 1 to 2 years in-program and 3 years post-program) |
| Analysis of EBSMs Profile, Outcomes, and Incremental Impacts for EI Claimants Category “Long-Tenured Workers” in PEI (Completed in February 2016) | - Incremental impacts - Profile and socio-demographic characteristics of participants |
- Non-experimental method using propensity score matching in combination with Difference-in-Differences - Statistical profiling |
2007 to 2009 participants | 9 to 10 consecutive years between 2002 and 2013 (that is, 5 years pre-program, 1 to 2 years in-program and 3 years post-program) |
| Study on Employment Assistance Services: PEI (Completed in July 2014) | - Program design and delivery - Challenges and lessons learned |
- 5 key informants interviews - Literature and document review |
Design and delivery at the time of the data collection (that is, 2013) | |
| Study on Employ PEI (Completed in March 15,2016) | - Program design and delivery - Challenges and lessons learned |
- 3 key informants interviews - Literature and document review - Questionnaire completed by PEI officials |
Design and delivery at the time of the data collection (that is, 2015) | |