
Evaluation of the Labour Standards Program, 2026
On this page
Alternate formats

Evaluation of the Labour Standards Program, 2026 [PDF - 4,84 KB]
Large print, braille, MP3 (audio), e-text and DAISY formats are available on demand by ordering online or calling 1 800 O-Canada (1-800-622-6232). If you use a teletypewriter (TTY), call 1-800-926-9105.
List of figures
- Figure 1: Number of complaints and contraventions (monetary and non-monetary)
- Figure 2: Compliance and enforcement tools
- Figure 3: Monies assessed and collected (in $ million) and percentage of money recovered
- Figure 4: Percentage of complaints finalized within 180 days by fiscal year
- Figure 5: Average hours to finalize cases
- Figure 6: Number of open cases
- Figure 7: Complainants' perception on the quality of service received from the Program (%)
- Figure 8: Total hours spent on proactive activities
- Figure 9: Labour standards program logic model
List of tables
- Table 1: Management Action Plan- Recommendation 1
- Table 2: Management Action Plan- Recommendation 2
- Table 3: Management Action Plan- Recommendation 3
- Table 4: Program expenditures and human resources (full-time equivalents), from 2016-2017 to 2023-2024
- Table 5: Percentage of employees who indicated that their employer offered the leave, by leave type
- Table 6: Availability of flexible work arrangements by sector
- Table 7: Employees satisfaction with various work aspects
- Table 8: Percentage of surveyed employees who indicated that their employer followed the labour standards provisions
- Table 9: Number of complaints received, initiated and investigated, 2016-2017 to 2023-2024
- Table 10: Number of complaints investigated per type
- Table 11: Distribution of founded contraventions and complaints by sector (%)
- Table 12: Number of contraventions per 1,000 employees and three-year average
- Table 13: Distribution of contraventions per highest level of enforcement action used
- Table 14: Percentage of employers who have had a monetary contravention in the past three fiscal years
- Table 15: Percentage of inquiries returned within 24 hours
- Table 16: Initiated, finalized, and percentage of monetary complaints finalized
- Table 17: Distribution of proactive activities, contraventions and complaints among sectors (%) (Annual average, from 2016 to 2024)
- Table 18: Number of proactive inspections, contraventions detected through proactive activities, employers and workplaces inspected, by fiscal year
- Table 19:Total hours spent on education activities and number of hours per 1,000 employees
- Table 20: Employee awareness of labour standards (%)
Executive summary
The Labour Standards Program (hereafter referred to as "the Program") promotes fair and equitable workplaces within the federal jurisdiction by administering Part III of the Canada Labour Code (the Code). Part III of the Code outlines the minimum employment conditions for wages and other entitlements in federally regulated industries.
The Program supports and encourages employer compliance with the Code through awareness and education activities. The Program is also legally required to investigate all admissible complaints received under Part III of the Code (except for certain union-related or inadmissible cases).
The Program then applies escalating measures, as appropriate, in response to non-compliance. These measures include administrative monetary penalties, a financial deterrent to non-compliance introduced in January 2021.
The evaluation assessed the Program's performance from April 2016 to March 2024. During this period, the Program's spending increased, from $14.57 million in 2016-2017 to $31.3 million in 2023-2024, primarily due to the implementation of several important legislative and regulatory changes.
The evaluation employed a mixed-methods approach, integrating both qualitative and quantitative evidence to assess the Program's effectiveness and achievement of outcomes. The evaluation was conducted in alignment with departmental priorities.
Key findings
Finding 1: Evidence from surveys indicates that core leaves such as vacation and sick leave are available to most federally regulated employees. Satisfaction levels are high for flexible work arrangements (79%) and overtime compensation (74%). Stakeholders noted the benefits of the new provisions for work-life balance and inclusion. They also highlighted challenges related to administrative complexity, enforcement, and sector-specific application.
Finding 2: Complaints related to labour standards have significantly increased in 2022-2023 and 2023-2024, following the legislative and regulatory changes that expanded leaves and strengthened rights for employees, along with the expansion of the road transportation sector. Nonetheless, the Program has consistently met its target of maintaining fewer than three founded contraventions per 1,000 employees.
Finding 3: The Program primarily uses administrative and financial tools to encourage compliance with the Code. However, enforcement efforts have not been fully effective in correcting or deterring non-compliance, especially repeat contraventions. The Program did not meet its target of recovering 75% of wages and other monies owed to workers.
Finding 4: The Program has not met its service standards for responding to inquiries and resolving complaints for several years pointing to resource constraints and limited capacity. Complaints and complaint backlogs have grown steadily, with notable increase in 2022-2023 and 2023-2024.
Finding 5: The Program has increased its proactive activities to encourage employer compliance with labour standards. However, targeting high-risk sectors, those with a higher likelihood of contraventions under Part III of the Code, and the effectiveness of proactive inspections remain limited. Operational challenges also continue to constrain the reach and impact of proactive efforts.
Finding 6: The Program uses multiple communication channels and has substantially increased educational efforts. However, communication tools are perceived as difficult to navigate, locate, interpret, and as overly legalistic. Stakeholders also reported communication gaps and a lack of inclusive materials.
Finding 7: The Program collects extensive data and reports on a broad range of indicators. However, data gaps, limited analytical capacity, and weak integration of internal data to inform operational and program decisions limit the effective use of administrative data for enforcement.
Recommendations and observations
Recommendation 1: Recognizing the program's operational context, continue to advance efforts to improve timeliness in complaint resolution and reduce complaint backlogs.
Recommendation 2: Explore ways to enhance data integration within the operating system and analytical capacity to better support evidence-based planning, effectively monitor compliance outcomes and to enable analysis of impacted employees where possible.
Recommendation 3: Refine targeting and resource allocation to high-risk sectors to improve the reach and impact of proactive inspections and outreach activities.
Observation: There is an opportunity to revisit how new enforcement measures, such as Administrative Monetary Penalties (AMPs) and compliance orders, are applied by program officials to enhance the Program's response to non-compliance.
Management response and action plan
Overall management response
The Labour Program's Compliance, Operations, and Program Development (COPD) Branch would like to thank the Evaluation Directorate for conducting this evaluation of the Labour Standards Program (the Program). COPD would also like to acknowledge the contributions of all key informants who participated in interviews whose expertise and candour helped illustrate how labour standards are applied and enforced in practice in federally regulated workplaces.
This evaluation is a valuable and detailed examination of federal labour standards and the challenges and successes of the compliance and enforcement regime. It is also timely. While the Program is pleased with the successes outlined in the evaluation, it is taking steps to address many of the concerns related to compliance, enforcement, and service delivery that are outlined in the recommendations, observations, and findings.
Covering the period from April 2016 to March 2024, the evaluation reflects a time of significant transformation for federal labour standards. During this period, the Program implemented an exceptional volume of major legislative and regulatory changes, which in turn increased both complexity and the number of complaints. A new internal data management system was also deployed and the COVID‑19 pandemic created unprecedented challenges that required rapid adaptation, new considerations, and revised operational procedures.
The evaluation identified three recommendations for improving federal labour standards. COPD concurs with these recommendations and outlines proactive steps already underway to begin addressing them below. Nonetheless, as there is a chronic gap between the volume of complaints received and available resources to process them, it will be challenging to significantly decrease the inventory and improve service delivery without increasing capacity. As such, with current resourcing levels, the Program may not be in a position to fully address the recommendations.
Recommendation #1
Recognizing the program's operational context, continue to advance efforts to improve timeliness in complaint resolution and reduce complaint backlogs.
Management Response
The Labour Program agrees with this recommendation. However, given current resourcing levels, the Program's ability to advance timeliness and reduce backlogs will be limited.
The Program is concentrating its efforts on improving processing times, collection of amounts owed and employer compliance. Ongoing and upcoming initiatives are part of the Labour Standards Backlog Action Plan and aim to reduce the backlog by pursuing efficiencies in our business model that include reallocation of resources and technological innovation. A Strategic Initiatives Roadmap outlines all current and upcoming initiatives, categorized into pre-complaint, complaint entry, and complaint processing.
These initiatives all share a common goal: reduce the average time required to finalize cases. Thus far, initiatives have led to an 18% increase in case closures last fiscal year (from 3,500 on average to 4,141 cases completed).
Furthermore, a Quality Management System (QMS) has been introduced. An upcoming key initiative of QMS will focus on establishing a national approach for quality control and quality assurance of cases. An important aspect of quality will include timeliness of actions taken on cases. The Labour Program anticipates that the implementation of rigorous quality measures will lead to improved service standards over time.
However, there is still an ongoing disparity between the number of labour standards complaints and resources at hand, which constrains the Program's ability to enhance response times and decrease complaint backlogs without an increase in resources. Newly identified government priorities related to the transportation sector requiring a re-deployment of resources may also impact capacity and timelines to address complaints. The Program also acknowledges that the government's Comprehensive Expenditure Review may further this challenge and influence the prioritization and sequencing of future actions.
| Management action plan | Planned completion date | Action status | Accountable lead(s) |
|---|---|---|---|
| 1. Finalize the Labour Standards Backlog Action Plan for the 2026-27 fiscal year with measures to stabilize the backlog and shorten case-finalization timelines within the limitations of the current operational context. | 2027 March | In progress | Director General of Regional Operations and Compliance |
| 2. Launch key activities of the Quality Management System (QMS) focused on quality assurance and quality control, which will include timely actions taken on cases. | 2026 December | In progress | Director General of Regional Operations and Compliance |
| 3. Explore and implement digital solutions, as financially feasible, that streamline Labour Standards complaint processing, improve efficiency and transparency, and more effectively integrate complaint management with existing program systems. | 2027 September | In progress | Director General of Workplace Directorate |
Recommendation #2
Explore ways to enhance data integration within the operating system and analytical capacity to better support evidence-based planning, effectively monitor compliance outcomes and to enable analysis of impacted employees where possible.
Management Response
The Labour Program agrees with this recommendation.
The Program is taking action to strengthen data availability, data integrity, and analytical capacity to enhance support to evidence-based planning and monitoring of compliance outcomes and impacts. These actions will align with the Treasury Board Policy on Results and ESDC and Labour Program guidelines and practices.
Key initiatives include developing a data strategy to support operational planning and performance tracking; implementing digital solutions to enhance data integration and integrity; and strengthening support to Labour Affairs Officers (officers) through enhanced data tools, data usage guidelines, and training. Given that the caseloads of officers and their managers are already at their maximum capacity, these changes are designed to be sensitive to their workloads. Instead of imposing new responsibilities, we are providing tools that will help them manage caseloads more effectively.
Recent Program efforts have resulted in the implementation in December 2025 of a major update of the Program's primary administrative system as well as the initiation of a project in May 2026 for an online portal to support complaint entry and improved data quality. Other projects to further enhance data quality are being actively explored and are dependant on incremental funding.
| Management action plan | Planned completion date | Action status | Accountable lead(s) |
|---|---|---|---|
| 1. Develop a comprehensive data strategy to define and prioritize the administrative data required to enable Labour Standards operations planning, monitor key performance indicators, and support accurate reporting to enable data-driven decisions, outcomes, and analysis. | 2027 March | Yet to commence | Director General of Workplace Directorate Director General of Regional Operations and Compliance Directorate Support: Innovation, Information and Technology Branch Chief Data Officer Branch |
| 2. Explore, design, and implement, as financially feasible, digital solutions to enhance data integration, ensure high quality data, and improve accessibility. | 2027 September | In progress | Director General of Workplace Directorate Support: Innovation, Information and Technology Branch |
| 3. Strengthen data management practices by refining data tools, updating data usage guidelines, and delivering targeted training programs. | 2027 September | In progress | Director General of Regional Operations and Compliance Directorate Support: Director General of Workplace Directorate Support: Chief Data Officer Branch |
Recommendation #3
Refine targeting and resource allocation to high-risk sectors to improve the reach and impact of proactive inspections and outreach activities.
Management Response
The Labour Program agrees with this recommendation. However, the scope for additional proactive efforts is limited due to significant workload pressures faced by the Program.
The following actions are already underway to refine targeting and resource allocation towards high-risk sectors like road transportation.
Road transportation is the highest risk sector in the federally regulated private sector. Over half of all Labour Standards complaints originate from that sector, with many stemming from the misclassification of employees. A national misclassification team with funding of $26.3 million was established in 2023-2024 and is on track to meet its goal of 1,600 inspections over the 5-year funding period. The misclassification team's compliance strategy also includes enhanced outreach to employers, improved communications, and increased engagement with the sector. The Program has created a range of resources and toolkits designed for both employees and employers. Additionally, the Program has participated in job fairs and engaged in comprehensive outreach efforts with national and provincial trucking stakeholders, delivering presentations to associations such as Trucking HR Canada. However, as funding for the national misclassification team is temporary (ending in 2027-28), achievements may be at risk without sustained funding.
The Program is also seeking to leverage tools such as information sharing agreements and memorandums of understanding to support planning proactive work and the carrying out of enforcement activities related to misclassification. Two such agreements, with the Canada Revenue Agency and ESDC's Temporary Foreign Worker Program, were established in 2025-26. The Program will continue to explore information sharing with provinces and territories and other government organizations, like Workers' Compensation Boards. Furthermore, the Program will develop a risk assessment matrix to further refine and identify the sectors and individual employers at highest risk of non-compliance. This will be used to effectively plan outreach and proactive activities for optimal results in the future. However, the volume of additional proactive activities, such as outreach and inspections, is constrained by the excessive workloads of the officers.
| Management action plan | Planned completion date | Action status | Accountable lead(s) |
|---|---|---|---|
| 1. Develop reporting tools to track high risk sectors and employers based on contraventions, as well as to track and compare with proactive work completed. | 2026 September | Yet to commence | Director General of Regional Operations and Compliance |
| 2. Revise proactive work planning to leverage reporting tools (as outlined in point #1), in order to support meaningful proactive activities in high-risk sectors. | 2026 December | Yet to commence | Director General of Regional Operations and Compliance |
| 3. Finalize our approach to collaborating with provincial and federal partners to enhance the effectiveness of ongoing outreach activities (For example: information sharing agreements). | 2026 December | In progress | Director General, Regional Operations and Compliance |
Introduction
The Labour Standards Program (hereafter referred to as "the Program") promotes fair and equitable workplaces within the federal jurisdiction by administering Part III of the Canada Labour Code (the Code). Part III of the Code outlines the minimum employment conditions for wages and other entitlements in federally regulated industries.
The Program supports and encourages employer compliance with the Code through awareness and education activities. The Program is also legally required to investigate all admissible complaints received under Part III of the Code (except for certain union-related or inadmissible cases). The Program then applies escalating measures, as appropriate, in response to non-compliance. These measures include administrative monetary penalties, a financial deterrent to non-compliance introduced in January 2021.
The evaluation assessed the Program's effectiveness in achieving its immediate and intermediate outcomes between April 2016 and March 2024, as outlined in the logic model provided in Annex A. Specifically, the evaluation covered the following key areas:
- Legislative and regulatory changes
- Compliance and enforcement measures (reactive activities)
- Program timeliness in responding to complaints and inquiries
- Proactive activities in encouraging employer compliance
- Use of program administrative data for strategic enforcement
A mixed-methods approach was used, drawing on multiple lines of evidence. These included document and literature reviews, key informant interviews with various stakeholders, surveys of employers and employees, and an analysis of administrative data.
Further details on the evaluation methodology and its limitations are provided in Annex B.
Program description
Background
The Program aims to support fair and equitable workplaces by administering Part III of the Canada Labour Code in sectors under federal jurisdiction. The Code sets the minimum conditions of employment for employees in federally regulated sectors.
In 2023, Part III of the Code covered an estimated 1,020,000 employees (5.8% of all employees in Canada) and 19,150 employers (1.4% of all employers in Canada), representing a 12.3% increase from approximately 908,000 employees in 2016.
These federally regulated organizations are primarily in the private sector, which includes industries such as banking, telecommunications, transportation, and postal and courier services. Part III of the Code also applies to most federal Crown corporations, as well as certain activities of Indigenous governments on First Nations territories. However, it does not cover federal public service employees, and employers and employees under provincial and territorial jurisdictions.
Annex C provides a list of industries covered under Part III.
Federal labour standards include, but are not limited to, provisions related to:
- Hours of work and overtime
- Payment of wages
- Flexible work arrangementsFootnote 1
- Termination of employment
- Annual vacations and general holidays
- Various types of protected leave
The Program undertakes a variety of proactive and reactive activities to encourage compliance with Part III of the Code.
Proactive activities
Proactive activities encompass actions undertaken by Labour Standards officers to prevent non-compliance by promoting awareness and understanding of labour standards through education, outreach, and inspections. These activities are not initiated in response to a complaint.
Education activities include providing counselling, conducting promotional campaigns, and hosting seminars to inform both employers and employees of their rights and responsibilities. The Program also produces informational materials, such as pamphlets and guidance documents, which are posted online or shared directly with stakeholders.
Proactive inspections, whether routine or targeted, enable officers to assess compliance and detect potential contraventions before they escalate.
Reactive activities
In contrast, reactive activities are initiated in response to specific complaints or incidents. These include investigations into monetary and non-monetary complaints, as well as unjust dismissal cases. Reactive investigations are conducted when there is a suspected contravention or a formal complaint, enabling Labour Standards officers to address issues as they ariseFootnote 2.
The Program applies appropriate compliance and escalating enforcement measures, including letters of evaluation, assurances of voluntary compliance and compliance orders, payment orders, filings in federal court, and administrative monetary penalties. The Program can also initiate prosecutions in response to complaints of non-compliance; however, this approach is not frequently pursued. See Annex D for more details on compliance and enforcement measures.
Policy work
The Program undertakes policy work to inform legislative and regulatory changes, monitors and analyzes workplace changes, and engages with various internal and external stakeholders to strengthen labour standards, improve workplace relations, and encourage compliance in federally regulated sectors.
Program governance
Three (3) directorates within the Labour Program administer the Program:
- Workplace Directorate leads program design, delivery, guidance, and policy interpretation. Develops supporting regulations and manages appeals of decisions made by the Regional Operations and Compliance Directorate.
- Regional Operations and Compliance Directorate ensures consistent implementation of compliance strategies and quality services to clients in federally regulated workplaces. Provides information to various stakeholders on provisions of the Code and investigates complaints.
- Strategic Policy, Analysis and Workplace Information Directorate undertakes policy analysis, research, and development on labour standards issues and legislative reform initiatives to support the Program.
Program expenditure
Actual Program spending increased during the evaluation period, rising from $14.57 million in 2016-2017 to $31.3 million in 2023-2024.
This increase in funding mainly stemmed from the implementation of changes to the Code and efforts to strengthen compliance and enforcement measures. The Fall Economic Statement 2018 announced $199 million for the modernization of Federal Labour Standards and amendments to the Wage Earner Protection Program. The Labour Program received $50.7 million from fiscal years 2019-2020 to 2022-2023 for the modernization of the federal labour standards and innovative compliance.
Commensurate with the increase in actual Program spending, the number of Full-Time Equivalents (FTEs) also increased over the evaluation period. In 2016-2017, the program operated with 176 FTEs. By 2023-2024, this number had risen to 291 FTEs.
| Fiscal year | Planned spending (million $) | Actual spending (million $) | Number of full-time equivalents (FTEs) |
|---|---|---|---|
| 2016-2017 | 13.05 | 14.57 | 176 |
| 2017-2018 | 16.42 | 17.32 | 195 |
| 2018-2019 | 17.48 | 20.29 | 199 |
| 2019-2020 | 17.50 | 23.24 | 219 |
| 2020-2021 | 29.78 | 29.73 | 266 |
| 2021-2022 | 32.31 | 32.40 | 265 |
| 2022-2023 | 31.53 | 31.23 | 275 |
| 2023-2024 | 36.56 | 31.30 | 291 |
- Source: Program documentation and Chief Financial Officer Branch
- Note: Budget figures and FTE counts are not solely allocated to the Labour Standards Program, particularly for front-line compliance and enforcement in the regions. A number of positions and their associated funding are dedicated in whole or in part to other Labour Program initiatives.
Key legislative and regulatory changes
From April 2016 to March 2024, the federal government implemented a series of legislative and regulatory reforms aimed at strengthening protections for workers in federally regulated sectors.
The review of new or updated provisions in the Code, along with changes to regulations and supporting documents such as backgrounders, explanatory notes, policy papers, and Regulatory Impact Assessments (RIAs), provided greater clarity on the objectives and intent behind each legislative or regulatory change. Evidence indicates that these changes align with the overarching goal of the Labour Standards Program: promoting fair and equitable workplaces.
New provisions related to flexible work arrangements and modernized labour standards (introduced through former Bill C-63 and former Bill C-86 in 2019) aimed to promote work-life balance, improve access to entitlements, ensure fair treatment for precarious workers such as temporary and part-time employment, and provide adequate notice and compensation in cases of job termination.
Other updates to labour standards expanded leaves and protections for employees under federal jurisdiction, including parental leave (Bill C-44 in 2017 and Bill C-86 in 2019), unpaid medical leave (Bill C-30 in 2022), medical leave with pay (Bill C-3 in 2022), protections for interns (Bill C-63 in 2020), and safeguards against employee misclassification (Bill C-86 in 2021).
From a compliance and enforcement perspective, amendments included the transfer of compliance functions to a new Head of Compliance and Enforcement, and the implementation of an administrative monetary penalties system (former Bill C-44) in January 2021. These amendments aimed to streamline complaint processing and strengthen the Program's response to non-compliance. Other changes to labour standards included COVID-19 temporary measures that supported workers through leave provisions and extended layoff periods.
A complete list of these legislative and regulatory changes during the evaluation period is available in Annex E.
Key findings
Legislative and regulatory changes
The evaluation focused on the availability of leaves, flexible work arrangements, and overtime pay for federally regulated employees, particularly the new or updated labour standards introduced between 2016 and 2024.
Surveys of employees provided insights on workplace practices regarding leaves and other minimum employment conditions, as well as satisfaction with entitlements.
Interviews with various stakeholders, including employer and employee representatives, highlighted both the benefits of the legislative reforms and the practical challenges associated with their effective application and enforcement.
Examples of labour standards covered
- Genetic Testing: Right to refuse and not disclose genetic testing results (effective since May 4, 2017).
- Parental Leave: Up to 63 weeks (effective since December 3, 2017).
- Hours of Work: Overall, employers are subject to new rules concerning scheduling, rest periods and overtime. For instance, employers must provide a written work schedule at least 96 hours before the start of the first shift (effective since September 1, 2019).
- Federal Minimum Wage: Increased to $15 in 2021, $15.55 in 2022, and $16.65 in 2023Footnote 3.
- Payment of Wages and Overtime: Overtime must be paid at a minimum rate of 1.5 times the regular hourly wage.
- Vacation Entitlements: Employees are entitled to two weeks of vacation annually after completing one year of employment with the same employer; three weeks of vacation (6% of earnings) after five consecutive years with the same employer, and four weeks of vacation (8% of earnings) after ten consecutive years with the same employer) (effective since September 1, 2019).
- General Holidays: Ten paid general holidays per year
- Termination of Employment: At least two weeks' written notice or pay in lieu for employees with at least three months of continuous service, increasing to up to eight weeks' notice after eight years, except if termination is for cause.
- Severance Pay: Two days' wages per year of employment (minimum of five days' wages) for employees with at least 12 months of continuous employment.
- Flexible Work Arrangements: Right to request flexible work (effective since September 1, 2019).
- Overtime Refusal: Right to refuse overtime for family obligations, except in cases of unforeseeable emergency (effective since September 1, 2019).
- Court or Jury Duty Leave: Protected leave to attend court as a witness or juror (effective since September 1, 2019).
- Personal Leave: 5 days per calendar year, with three paid days after three months of continuous employment to carry out certain family responsibilities or attend the employee's citizenship ceremony (effective since September 1, 2019).
- Leave for Aboriginal Practices: Every employee who is an Aboriginal person and who has completed three consecutive months of continuous employment with an employer is entitled to and shall be granted a leave of absence from employment of up to five days in every calendar year, in order to enable the employee to engage in traditional Aboriginal practices (effective since September 1, 2019).
- Internships: Interns in general are entitled to the same labour standards rights and entitlements as employees, student interns participating in an internship to fulfill educational program requirements are covered by specified labour standards (effective since September 1, 2020).
- Misclassification: Employers are prohibited from treating an employee as if they were not their employee (effective since January 1, 2021).
- Paid Sick Leave (Medical Leave with Pay): Up to 10 days per year (effective since December 1, 2022).
Finding 1
Evidence from surveys indicates that core leaves, such as vacation and sick leave, are available to most federally regulated employees. Satisfaction levels are high for flexible work arrangements (79%) and overtime compensation (74%) among employees. Stakeholders noted the benefits of the new provisions for work-life balance and inclusion. They also highlighted challenges related to administrative complexity, enforcement, and sector-specific application.
Leaves, flexible work arrangements, and overtime across federal jurisdiction, Insights from the Survey of employees under federal jurisdiction (SEFJ)
The 2022 Statistics Canada Survey of Employees under Federal Jurisdiction (SEFJ) provided a representative snapshot of the federally regulated private sector, offering useful information on broader workplace practices, such as flexible work arrangements, types of leave offered, and overtime compensation across eight major industriesFootnote 4.
Table 5 presents SEFJ results on the availability of various types of leave. Most employees indicated that their employer offeredFootnote 5: vacation leave (90.8%), sick leave (83.6%), maternity leave (77.3%), and leave for work-related illness or injury (75.4%). Only a small proportion (3-7%) indicated that their employer did not offer these leaves, while between 6.2% and 21% were unaware of their availability.
Core leaves were mostly available among employees from the banking and telecommunications sectors, with over 95% of employees reporting that their employer offered vacation and sick leave, and more than 80% reported their employer offered parental leave. In contrast, employees in transportation sectors (air, rail, maritime, and road) reported lower availability of these core leaves.
A majority of employees reported that their employer provided bereavement leave (72.7%), personal leave days (70.9%) and leave to attend court (56.5%). However, a substantial portion, between 20% and 40%, did not know whether these types of leave were offered by their employer.
Over half of employees were unaware whether leave for critical illness of a child (54.6%), death or disappearance of a child (54.9%), or leave for victims of family violence (72%) was available.
| Type of leave provision offered | Yes (%) | No (%) | Don't know (%) |
|---|---|---|---|
| Vacation leave | 90.8 | 3 | 6.2 |
| Sick leave | 83.6 | 7 | 9.4 |
| Maternity leave | 77.3 | 3 | 19.7 |
| Work-related illness or injury leave | 75.4 | 3.6 | 21.1 |
| Bereavement leave | 72.7 | 2.8 | 24.4 |
| Personal leave days | 70.9 | 9.3 | 19.8 |
| Parental leave | 67.5 | 3.7 | 28.9 |
| Leave to attend court | 56.5 | 3.4 | 40.1 |
| Compassionate care leave | 46.7 | 6.2 | 47.1 |
| Critical illness leave (adult) | 44.2 | 4.7 | 51.1 |
| Critical illness leave (child) | 41 | 4.4 | 54.6 |
| Death or disappearance leave | 41 | 4.1 | 54.9 |
| Leave for victims of family violence | 22.3 | 5.7 | 72 |
| Reservist leave | 18 | 6 | 76 |
| Other leave | 2.5 | 13.4 | 84 |
- Source: 2022 SEFJ conducted by Statistics Canada on behalf of ESDC's Labour Program
At least one type of flexible work arrangement was available to half of employees. Approximately one in four employees indicated that flexible work arrangements were not offered by their employer.Footnote 6
Though not specific to the entitlement or right under Part III of the Code, results from the SEFJ indicate that at least one type of flexible work arrangement was available to over half of employees (51.8%). The two most common flexible work arrangements were telework (29.3%) and variable work schedule (27.4%).
More than one-quarter of employees (26.8%) indicated that they were not offered any type of flexible work arrangements, while 21.4% stated that they did not know if their employer offered any of the specified work arrangements.
The prevalence of flexible work arrangements available to employees varied significantly by sector, telecommunications and banking had the highest levels (with 69.9% and 61.5% of employees reporting availability respectively), while rail transportation had the lowest percentage of employees (34.7%) reporting that their employer offered any of the specified work arrangements.
| Sector | At least one arrangement (%) | None (%) | Don't know (%) |
|---|---|---|---|
| All sectors | 51.8 | 26.8 | 21.4 |
| Air transportation | 45.9 | 32.5 | 21.6 |
| Rail transportation | 34.7 | 43.1 | 22.2 |
| Road transportation | 40.4 | 36.8 | 22.8 |
| Maritime transportation | 44.0 | 35.4 | 20.6 |
| Courier and pipelines | 37.6 | 32.5 | 29.9 |
| Banks | 61.5 | 17.0 | 21.5 |
| Feed, flour, seed and grain | 40.0 | 37.1 | 22.9 |
| Telecommunications and broadcasting | 69.9 | 16.3 | 13.8 |
Over one in four employees are not compensated at the minimum rate of 1.5 times their regular hourly wage for overtime working hours.
When asked about the number of hours of paid or unpaid overtime they work in a typical week, a large majority of employees indicated that they do not work paid (73.6%) or unpaid (69.8%) overtime hours. Approximately 26.4% of employees indicated that they worked some hours of unpaid overtime, with an average of 2.7 hours per week.
Meanwhile, 32.5% indicated that they usually worked paid overtime weekly, with a large majority (72.8%) being paid an overtime rate for those hours. Another 18.6% of employees were paid regular or straight pay, 14.8% were compensated by receiving time in lieu, and 0.9% received another type of compensation. About 6.8% of employees asserted that their paid overtime hours were "not compensated".
The application of overtime provisions may require closer examination. SEFJ results show that a significant proportion of employees who work overtime are not compensated at the 1.5 hourly rate required under Section 174 of the Canada Labour Code, which may indicate non-compliance with hours of work provisions.
However, without further context, these results only offer limited insight. Some employees may belong to categories that are exempt from certain overtime provisions, such as managers, regulated professionals, or work in industries under special rules such as road transportation, railway running trades, or shipping. Additionally, the results may reflect varying levels of employee understanding regarding when overtime pay applies, including whether the hours were requested by the employer, whether they were reported properly.
Employee satisfaction with entitlements and pay
Most employees were satisfied or very satisfied with flexible work arrangements (79%) and overtime compensation (74%). A majority (65%) were satisfied with the ability to meet family needs with their work schedules and 58% were satisfied with the notice provided about work schedules.
Compared to other sectors, employees working in rail transportation were most likely to express dissatisfaction across most indicators, including their ability to meet family needs with work schedules (30.5%), flexible work arrangements (19.4%), and advance notice of work schedules (34%). Similarly, employees in air transportation showed high levels of dissatisfaction regarding work-life balance (17.8%), flexible work arrangements (9.7%), and overtime compensation (14%) compared to other sectors.
Regarding pay, over half of employees (55.1%) felt their rate of pay or salary was fair. Among those who did not, the most common reasons were that pay did not reflect their experience, skills, or effort (a majority, 62.7%), that their workload was too heavy, or that their pay was below the standard for their industry or occupation (some, 36.9%)
| Work aspects | Very satisfied | Satisfied | Neither satisfied nor dissatisfied | Dissatisfied | Very dissatisfied | Not applicable |
|---|---|---|---|---|---|---|
| Satisfaction with ability to meet family needs with work schedule | 21.4 | 43.3 | 19.3 | 9.4 | 4.5 | 2.1 |
| Satisfaction with Flexible Work Arrangement | 34.6 | 44.3 | 15.6 | 5.6 | 0 | 0 |
| Satisfaction with the amount of notice received about work schedule | 20 | 38.5 | 22.8 | 9 | 4.3 | 5.4 |
| Satisfaction with the way overtime was compensated | 23.6 | 50.8 | 15.5 | 7.8 | 2.3 | 0 |
- Source: 2022 SEFJ conducted by Statistics Canada on behalf of ESDC's Labour Program
Given the sectoral differences identified in SEFJ results and recognizing that the survey did not specifically address the recent entitlements under the Code, the evaluation incorporated a survey to gather some evidence on the extent to which newly introduced and updated provisions are applied in sectors with historically high rates of non-compliance, such as road transportation.
Perceptions of a sample of employees on employer adherence to labour standards provisions
The survey of employees who had filed complaints or contacted the Labour Program for information between April 2016 and March 2024 provided some insights on the application of new and updated labour standards in sectors with high rates of non-compliance.Footnote 7
When asked which labour standards provisions their employer followed, over half of respondents identified annual vacations and the 10 paid general holidays. Additionally, 49% reported that their employer applied minimum wage and overtime pay provisions, while 45% noted compliance with the advance notice of work schedule requirement.
Regarding more recent entitlements under the Code, 33% of employees indicated that their employer provided up to 10 days of paid medical leave, 32% reported access to five days of personal leave, and 30% cited compliance with employment termination notice provisions. However, only 15% of respondents said their employer respected the right to refuse overtime for family obligations, and just 19% reported being able to request flexible work arrangements.
| Labour standards | Percent |
|---|---|
| Holidays: 10 paid general holidays | 56.9 |
| Vacation: 3 weeks of vacation (equivalent of 6% of earnings) after 5 consecutive years of employment with the same employer (effective since September 1, 2019) | 51.0 |
| Minimum Wage: Increased to $15 in 2021; $15.55 in 2022; and to $16.65 in 2023 | 48.9 |
| Payment of Wages and Overtime: Overtime pays at a minimum rate of 1.5 times the regular hourly wage | 48.9 |
| Hours of Work: Provide a work schedule in writing at least 96 hours before the start of the first work period or shift under that schedule (effective since September 1,2019) | 45.0 |
| Medical Leave: Up to 10 days of paid medical leave (effective since December 1, 2022) | 32.8 |
| Personal Leave: 5 days of personal leave each calendar year, with the first 3 days paid after 3 consecutive months of continuous employment (effective since September 1, 2019) | 31.7 |
| Termination of Employment: At least two weeks' written notice or pay for termination of employment by employer, excluding termination for cause | 29.8 |
| Flexible Work Arrangement: Right to request flexible work arrangements (effective since September 1, 2019) | 18.9 |
| Flexible Work Arrangement and Family-Related Rights: Right to refuse overtime for family obligations (effective since September 1, 2019) | 15.0 |
- Source: 2025 Evaluation Survey of Employees who filed a complaint or asked for information
Stakeholder experiences and perceptions on Labour Standards reforms
Key informant interviews with employee and employer representatives, as well as program officials, provided qualitative evidence on how labour standards reforms are being experienced. These interviews highlighted both the benefits of the reforms and the practical challenges in applying and enforcing them effectively. Employer and employee representatives were from key associations and unions covering a broad range of sectors and industries from the federally regulated private sector.
New and updated leaves
A majority of employee representatives (5 out of 9) and program officials (4 out of 7) highlighted the value of new leave provisions, noting their positive effects on work-life balance and inclusion. They noted that enhanced parental, maternity, and personal leave provisions have been particularly beneficial for underrepresented groups, including women and younger workers in male-dominated sectors. These measures were viewed as important steps toward fostering greater gender balance and supporting the Labour Program's broader Gender-Based Analysis Plus (GBA+) objectives.
However, some key informants (12 out of 27), including employee and employer representatives and program officials reported inconsistent enforcement of labour standards. Similarly, a majority of employee representatives (5 out of 9) and program officials (4 out of 7) noted employer resistance, including reluctance to implement measures such as paid sick leave and work scheduling requirements, or attempts to avoid compliance by closing, rebranding, or concealing operations.
In addition, some key informants (11 out of 27), including employee and employer representatives and program officials identified confusion arising from misalignment between the Canada Labour Code, Employment Insurance eligibility, provincial holidays, and collective agreements.
"There should have been a clearer recognition of what's already provided in collective agreements and more explicit language preventing stacking of benefits."
"We get questions from employees in Quebec asking why they're not getting June 24th paid… it's not a federal holiday."
In contrast, a majority of employer representatives (6 out of 11) and some program officials (4 out of 11) spoke to the administrative complexity of implementing some types of leaves such as the medical leave with pay of up to 10 days per year, the potential for misuse, and conflicts with existing collective agreements.
Some key informants (10 out of 27), including employee and employer representatives and program officials also highlighted difficulties in applying hours of work reforms in continuous operations such as trucking, aviation, and marine sectors.
Perspectives of employer and employee representatives on the paid medical leave of up to 10 days per year (in force since December 1, 2022)
In interviews, a majority of employer representatives (6 out of 11) consistently described the measure as creating a significant administrative and compliance burden. They highlighted difficulties in calculating entitlements for employees with non-standard or variable earnings, as well as challenges linked to the timing of the rollout, which came into force in December 2022 and coincided with holiday periods. Small businesses and sectors operating on tight margins reported being particularly affected by the added complexity and costs.
Another concern was the overlap with existing leave provisions. Some employers already offered personal or sick leave, yet the new entitlement was often interpreted by employees as additional rather than integrated with existing benefits. This "stacking effect" created both confusion and resistance, particularly in unionized environments.
Employers also emphasized the increased costs and operational challenges associated with the policy. They reported that the requirement to provide additional paid leave not only increased direct labour costs but also created difficulties in maintaining productivity, especially in continuous-operation sectors such as trucking, marine transport, and air navigation.
It was also reported that the new entitlement contributed to higher levels of absenteeism and, in some cases, potential misuse. Employees were perceived to be treating the new entitlement as a guaranteed benefit rather than a contingency for illness, with some employers (4 out of 11) noting patterns of sick days being taken immediately before or after vacations.
"The mandated increase to 10 paid medical days created a windfall for employees and has contributed to increased absenteeism."
In interviews, employee representatives generally viewed the introduction of the 10 days of paid sick leave as a positive reform that strengthened worker protections and improved minimum employment conditions, particularly in the wake of COVID-19. A few employee representatives (2 out of 9) noted that this policy represented one of the most significant long-term improvements to employee well-being and workplace fairness.
However, concerns were raised about the accrual model used to calculate entitlements. A few employee representatives (22%, 2 out of 9) explained that allowing employees to earn one sick day per month after the initial three often left workers without adequate coverage during peak illness periods, such as in winter. As one participant explained, employees who fall ill early in the year may have "only one or two sick days allotted."
To address this limitation, one employee representative suggested granting all ten days of medical leave upfront each year to better align with the seasonal nature of illness and ensure equitable access.
"It would probably be better if they just got 10 per year, regardless of the month, because… people get sick in the winter, primarily not in the summer."
Misclassification of workers
In interviews, the misclassification of workers, especially in the road transportation/trucking sector was frequently identified as a persistent challenge that undermines access to basic protections. Some key informants (11 out of 27), including employee and employer representatives and program officials, emphasized that misclassification disproportionately affects underrepresented groups such as newcomers, immigrants, and non-standard workers.
These workers often appear to be hired in non-permanent, casual, part-time, temporary, or term-contract arrangements, which makes it easier for employers to classify them as independent contractors rather than employees, thereby limiting their access to entitlements and protections under the Code.
One employer representative (1 out of 11) also noted that misclassification can be complex in practice, as some workers prefer independent arrangements, even though current legal definitions can restrict employers' ability to accommodate such preferences.
" Some workers want to be their own person and choose independent arrangements, but the law can limit how much employers can accommodate that preference."
Right to request flexible work arrangements
Right to request flexible work arrangements was viewed positively by some key informants (11 out of 27), including employee and employer representatives and program officials, particularly in administrative contexts. Interviewees noted that these provisions help employees better balance work and family responsibilities, reduce stress, and improve overall job satisfaction and retention.
Flexible work arrangements and legislated breaks were seen as beneficial in ensuring that employees take necessary pauses, especially for those managing childcare responsibilities or coordinating schedules with their partners.
However, broader adoption was deemed impractical in unionized or operationally rigid environments due to structural constraints and cultural resistance. For instance, flexible work arrangements were largely ineffective or symbolic in sectors like marine transportation and longshoring, where the right to request flexibility did not guarantee approval, the occupations may be ill-suited or impractical for flexible work, and enforcement mechanisms were weak.
Note that according to program officials, while procedural safeguards (such as timelines for employer responses and reprisal protections) exist, there was little evidence of their frequent use or need for enforcement. However, since some interviewees described enforcement as weak, this suggests that the intent and application of these provisions may not be fully clear to stakeholders.
Weakness of enforcement
Some key informants (11 out of 35), including employee and employer representatives and program officials, also criticized the weakness of enforcement mechanisms. They noted that low penalties and limited use of tools such as administrative monetary penalties reduce the incentive for compliance.
"Small fines of $500 to $1,000 are considered just a cost of doing business for many employers."
Compliance and enforcement measures
Employees working in the federally regulated sector may file a complaint with the Labour Program if they believe their employer has contravened Part III of the Code. There are four types of complaints that can be submitted to the Labour Program:
- Monetary complaints (for example, unpaid wages, overtime)
- Non-monetary complaints (for example, hours of work, leave entitlements)
- Unjust dismissal
- Genetic testing discrimination
Illustrative cases of monetary and non-monetary complaints
a. Air transportation sector - Flexible work arrangement denied (non-monetary complaint)
Case: Clara (not the real name)
Clara works in the air transportation sector. She submitted a formal request to her employer to modify her work schedule in order to care for a family member with a medical condition. Despite meeting the eligibility criteria under the Code, her employer denied the request without providing a valid reason or engaging in meaningful dialogue.
Clara filed a non-monetary complaint with the Labour Program, asserting that her right to request flexible work arrangements had been violated.
b. Banking sector - Unpaid internship (monetary and non-monetary complaint)
Case: Daniel (not the real name)
Daniel completed a four-month internship at a federally regulated bank. Although he performed regular duties similar to paid employees and worked full-time hours, he was not compensated. The employer also did not provide a written internship agreement or defined learning objectives, requirements that apply when an intern is classified as an unpaid "student intern" under the recent intern protection provisions.
Daniel filed both a monetary complaint (for unpaid wages) and a non-monetary complaint (for non-compliance with intern protection provisions).
c. Road transportation sector - Worker misclassification (monetary complaint and non-monetary complaint)
Case: Amina (not the real name)
Amina works as a long-haul truck driver for a logistics company. Although she performs duties similar to full-time employees and is subject to company control over routes and schedules, she is classified as an independent contractor. As a result, she does not receive overtime pay, vacation, or paid leave.
Amina filed a monetary and non-monetary complaint with the Labour Program, arguing that she has been misclassified and is being denied entitlements under the Code.
The Program undertakes the following activities in response to complaints and instances of non-compliance:
- Examines monetary and non-monetary complaints, as well as those related to unjust dismissal and genetic discrimination, under Part III of the CodeFootnote 8.
- Applies appropriate compliance and enforcement measures/actions, including administrative monetary penalties introduced under Part IV of the Code in January 2021.
The effectiveness of the Labour Program's compliance and enforcement activities, particularly its reactive measures in response to complaints, is assessed using three key performance indicators, as outlined in the 2018 performance information profile.
- Rate of contraventions:
The Program aims to maintain the three-year average number of contraventions to the Code at or below three contraventions per 1,000 employees. This indicator reflects the overall level of employer compliance across federally regulated sectors. - Repeat contraventions:
The Program has "the percentage of employers who commit repeat contraventions of the same type within a three-year period" as a performance indicator to inform the deterrent effect of enforcement actions over time. The target is to keep this rate at 20% or lower. - Recovery of assessed monies:
The Program's ability to recover at least 75% of all monies assessed each year in response to monetary complaints informs the Program's effectiveness in correcting monetary contraventions. The indicator reflects both the timeliness and impact of enforcement measures in securing owed wages for employees.
Finding 2
Complaints related to labour standards have significantly increased in 2022-2023 and 2023-2024, following the legislative and regulatory changes that expanded leaves and strengthened rights for employees, along with the expansion of the road transportation sector. Nonetheless, the Program has consistently met its target of maintaining fewer than three founded contraventions per 1,000 employees.
The number of complaints received reached a high of 5,838 in 2023-2024, representing a 45.4% increase from 2016-2017.
As shown in Table 9, the Program received 4,016 complaints in 2016-2017, with volumes gradually declining until 2018-2019. The COVID-19 pandemic had a temporary dampening effect on complaint volumes in 2020-2021, likely due to reduced business activity and public health restrictions. Following this decline, complaint volumes began to rise again, reaching a high of 5,838 complaints in 2023-2024. This represents a 45.4% increase relative to 2016-2017 and a significant difference compared to the average of 3,811 complaints received annually between 2016-2017 and 2021-2022.
The increase in complaints since 2019-2020 was driven by several factors including:
- the numerous legislative and regulatory changes that came into effect during that periodFootnote 9;
- a higher incidence of complaints within high-risk sectors; and
- the growth of the workforce in road transportationFootnote 10.
On average, the Program initiates the processing of approximately 90.5% of the complaints it receives annually. In 2023-2024, this rate rose to 93.3%, indicating a strong alignment between intake and action. It should be noted that not all initiated complaints proceed to investigation. A significant proportion, about 23% each year, are withdrawn or cancelled, while the remaining 77% advance to investigation. Of the 5,838 complaints received in 2023-2024, 4,077 initiated complaints were investigated/to be investigated by the Labour Program.
| Fiscal Year | Complaints received | Complaints initiated/opened | Complaints that are withdrawn or cancelled (cases initiated) | Complaints investigated/to be investigated (cases initiated) |
|---|---|---|---|---|
| 2016/2017 | 4,016 | 3,936 | 751 | 3,185 |
| 2017/2018 | 3,707 | 3,871 | 771 | 3,100 |
| 2018/2019 | 3,442 | 3,422 | 594 | 2,828 |
| 2019/2020 | 4,245 | 4,203 | 962 | 3,241 |
| 2020/2021 | 3,717 | 3,770 | 989 | 2,781 |
| 2021/2022 | 3,743 | 3,672 | 991 | 2,681 |
| 2022/2023 | 4,421 | 4,026 | 1,040 | 2,986 |
| 2023/2024 | 5,838 | 5,445 | 1,368 | 4,077 |
- Source: Administrative Data, ILS
Monetary complaints represent the largest share of complaints investigated by the Labour Program.
Monetary complaints consistently represent the largest share of complaints investigated, with 2,536 cases in 2023-2024, an increase from 1,995 in 2016-2017 (Table 10). Although fewer in number, non-monetary complaints have increased substantially, from just 67 in 2016-2017 to 442 in 2023-2024, representing more than a sixfold rise, possibly reflecting greater awareness of workplace rights and expanded protections. Unjust dismissal complaints have fluctuated over the years but continue to represent a significant portion of the caseload, with 1,099 cases in 2023-2024.
| Fiscal Year | Monetary complaints | Non-monetary complaints | Unjust dismissal complaints | All complaints investigated/ to be investigated |
|---|---|---|---|---|
| 2016/2017 | 1,995 | 67 | 1,123 | 3,185 |
| 2017/2018 | 1,949 | 95 | 1,056 | 3,100 |
| 2018/2019 | 1,753 | 116 | 959 | 2,828 |
| 2019/2020 | 2,021 | 130 | 1,090 | 3,241 |
| 2020/2021 | 1,637 | 174 | 970 | 2,781 |
| 2021/2022 | 1,740 | 153 | 788 | 2,681 |
| 2022/2023 | 1,875 | 287 | 824 | 2,986 |
| 2023/2024 | 2,536 | 442 | 1,099 | 4,077 |
| All Years | 15,506 | 1,464 | 7,909 | 24,879 |
- Source: Administrative Data, ILS
The number of founded contraventions has also increased in recent years, driven by complaints from employees working in the road transportation sector.
Founded contraventions closely follow the trend in monetary and non-monetary complaints, increasing by 23% from 2,254 in 2020-2021 to 2,774 in 2022-2023.
During the evaluation period, key contraventions to the Code were related to annual vacations (30.6%), payment of wages (27.8%), and general holidays (13.2%). Other key contraventions include individual termination of employment (7.1%), administration (7.5%), standards of hours (4.3%), and severance pay (3.4%).
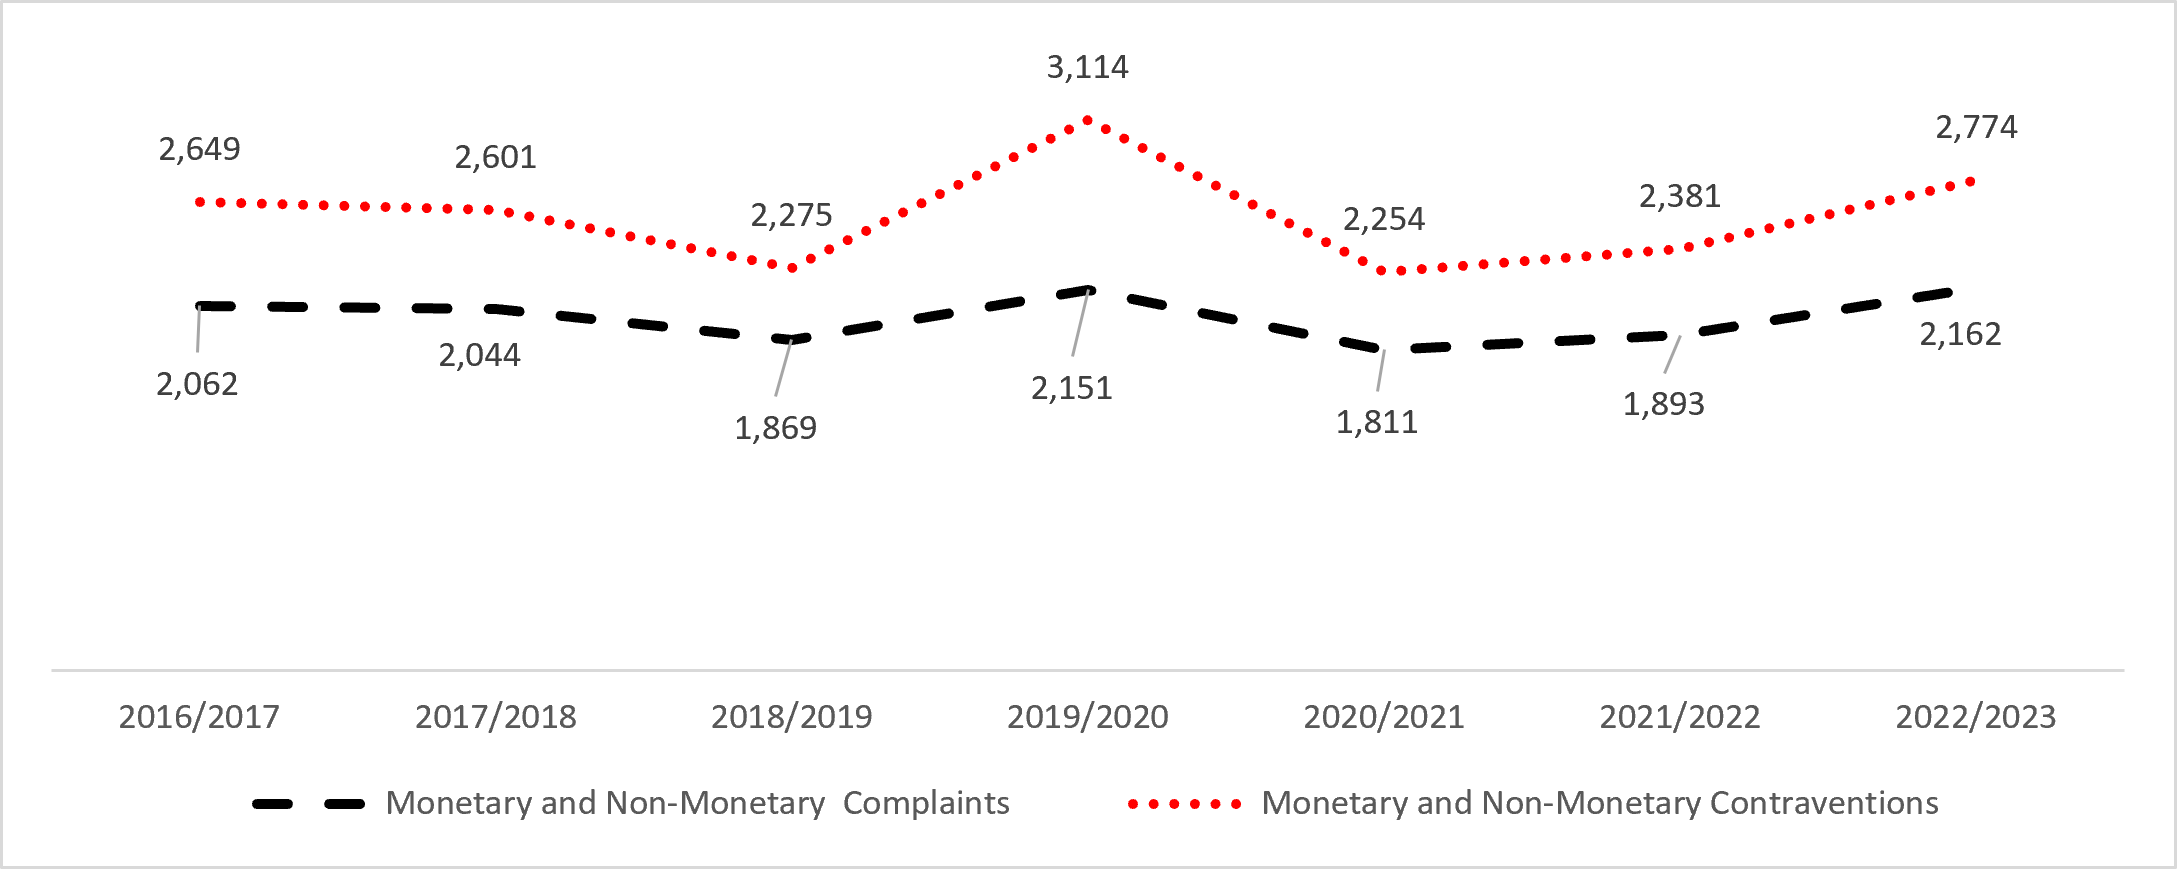
- Source: Administrative Data, ILS
- Note: The number of complaints and contraventions reflects only those cases that were initiated in the system during a given fiscal year. Only complaints that were investigated or are pending investigation are included in the counts. Cases that were abandoned, withdrawn, or cancelled are excluded. For contraventions, the counts from fiscal years 2016-2017 to 2021-2022 include only finalized cases where the allegation was deemed founded. Given that some cases initiated in 2022-2023 were not finalized, the count of contraventions from 2022-2023 was estimated by adding up the number of founded contraventions from finalized cases and that of all allegations from open cases for which an allegation-related subject matter was reported.
Text description of figure 1
| Fiscal Year | Monetary and Non-Monetary Complaints | Monetary and Non-Monetary Contraventions |
|---|---|---|
| 2016/2017 | 2,062 | 2,649 |
| 2017/2018 | 2,044 | 2,601 |
| 2018/2019 | 1,869 | 2,275 |
| 2019/2020 | 2,151 | 3,114 |
| 2020/2021 | 1,811 | 2,254 |
| 2021/2022 | 1,893 | 2,381 |
| 2022/2023 | 2,162 | 2,774 |
As shown in Table 11, a large proportion of complaints (67.9%) and founded contraventions (87.4%) under the Code are concentrated in the road transportation sector, suggesting persistent challenges for workers in accessing fair and equitable working conditions. Road transportation is the second-largest sector in the federally regulated private sector, following banking. This sector experienced a significant expansion of approximately 22% more workers from 2015 to 2023, particularly in recent years, which has contributed, in part, to the rise in complaints observed in recent years (2022-2023 and 2023-2024).
| Industry/Sector | Contraventions | Complaints |
|---|---|---|
| Road transportation | 87.4 | 67.9 |
| Air transportation | 3.3 | 5.1 |
| Other industries | 2.9 | 13.5 |
| Indigenous/ Aboriginal | 2.5 | 3.9 |
| Communications | 1.9 | 2.6 |
| Rail transportation | 1.3 | 4.4 |
| Banking / Banks | 0.7 | 2.7 |
- Source: Administrative Data, ILS
The distribution of contraventions by region shows that Ontario and the North-West Pacific have the highest shares of founded contraventions, at 34.5% and 25.8%, respectively. Quebec represents 20.9%, the Central region accounts for 14.2%, and 4.5% of contraventions are from employees in the Atlantic region. This distribution generally reflects the proportion of employees under federal jurisdiction across these regions.
The three-year average of contraventions per 1,000 employees has remained within an acceptable threshold. The Program has met its target for all the years (2016-2017 to 2023-2024).
The analysis of contraventions per 1,000 federally regulated employees offers a consistent and comparable measure of employer compliance over time, independent of workplace size fluctuations covered under Part III of the Code. This rate decreased from 2016-2017 to 2018-2019, prior to the implementation of key labour standards reforms, but increased in recent years (2021-2022 and 2022-2023), following the introduction of numerous legislative changes.
Despite the recent increases, the three-year average number of founded contraventions remained within an acceptable threshold throughout the evaluation period. Since 2020-2021, the Program has continued to meet its target of maintaining fewer than three founded contraventions per 1,000 employees.
| Fiscal Year | Number of contraventions per 1000 employees | Three year moving average | Target for the 3-year average |
|---|---|---|---|
| 2016/2017 | 2.92 | 2.55 | 5 |
| 2017/2018 | 2.80 | 2.70 | 5 |
| 2018/2019 | 2.43 | 2.72 | 5 |
| 2019/2020 | 3.26 | 2.83 | 4 |
| 2020/2021 | 2.36 | 2.68 | 3 |
| 2021/2022 | 2.52 | 2.71 | 3 |
| 2022/2023 | 2.80 | 2.56 | 3 |
- Source: Administrative Data, ILS
Finding 3
The Program primarily uses administrative and financial tools to encourage compliance with the Code; however, enforcement efforts have not been fully effective in correcting or deterring non-compliance, especially repeat contraventions. The Program did not meet its target of recovering 75% of wages and other monies owed to workers.
The Program has a comprehensive set of compliance and enforcement tools in place to encourage compliance; however, it relies primarily on administrative resolutions.
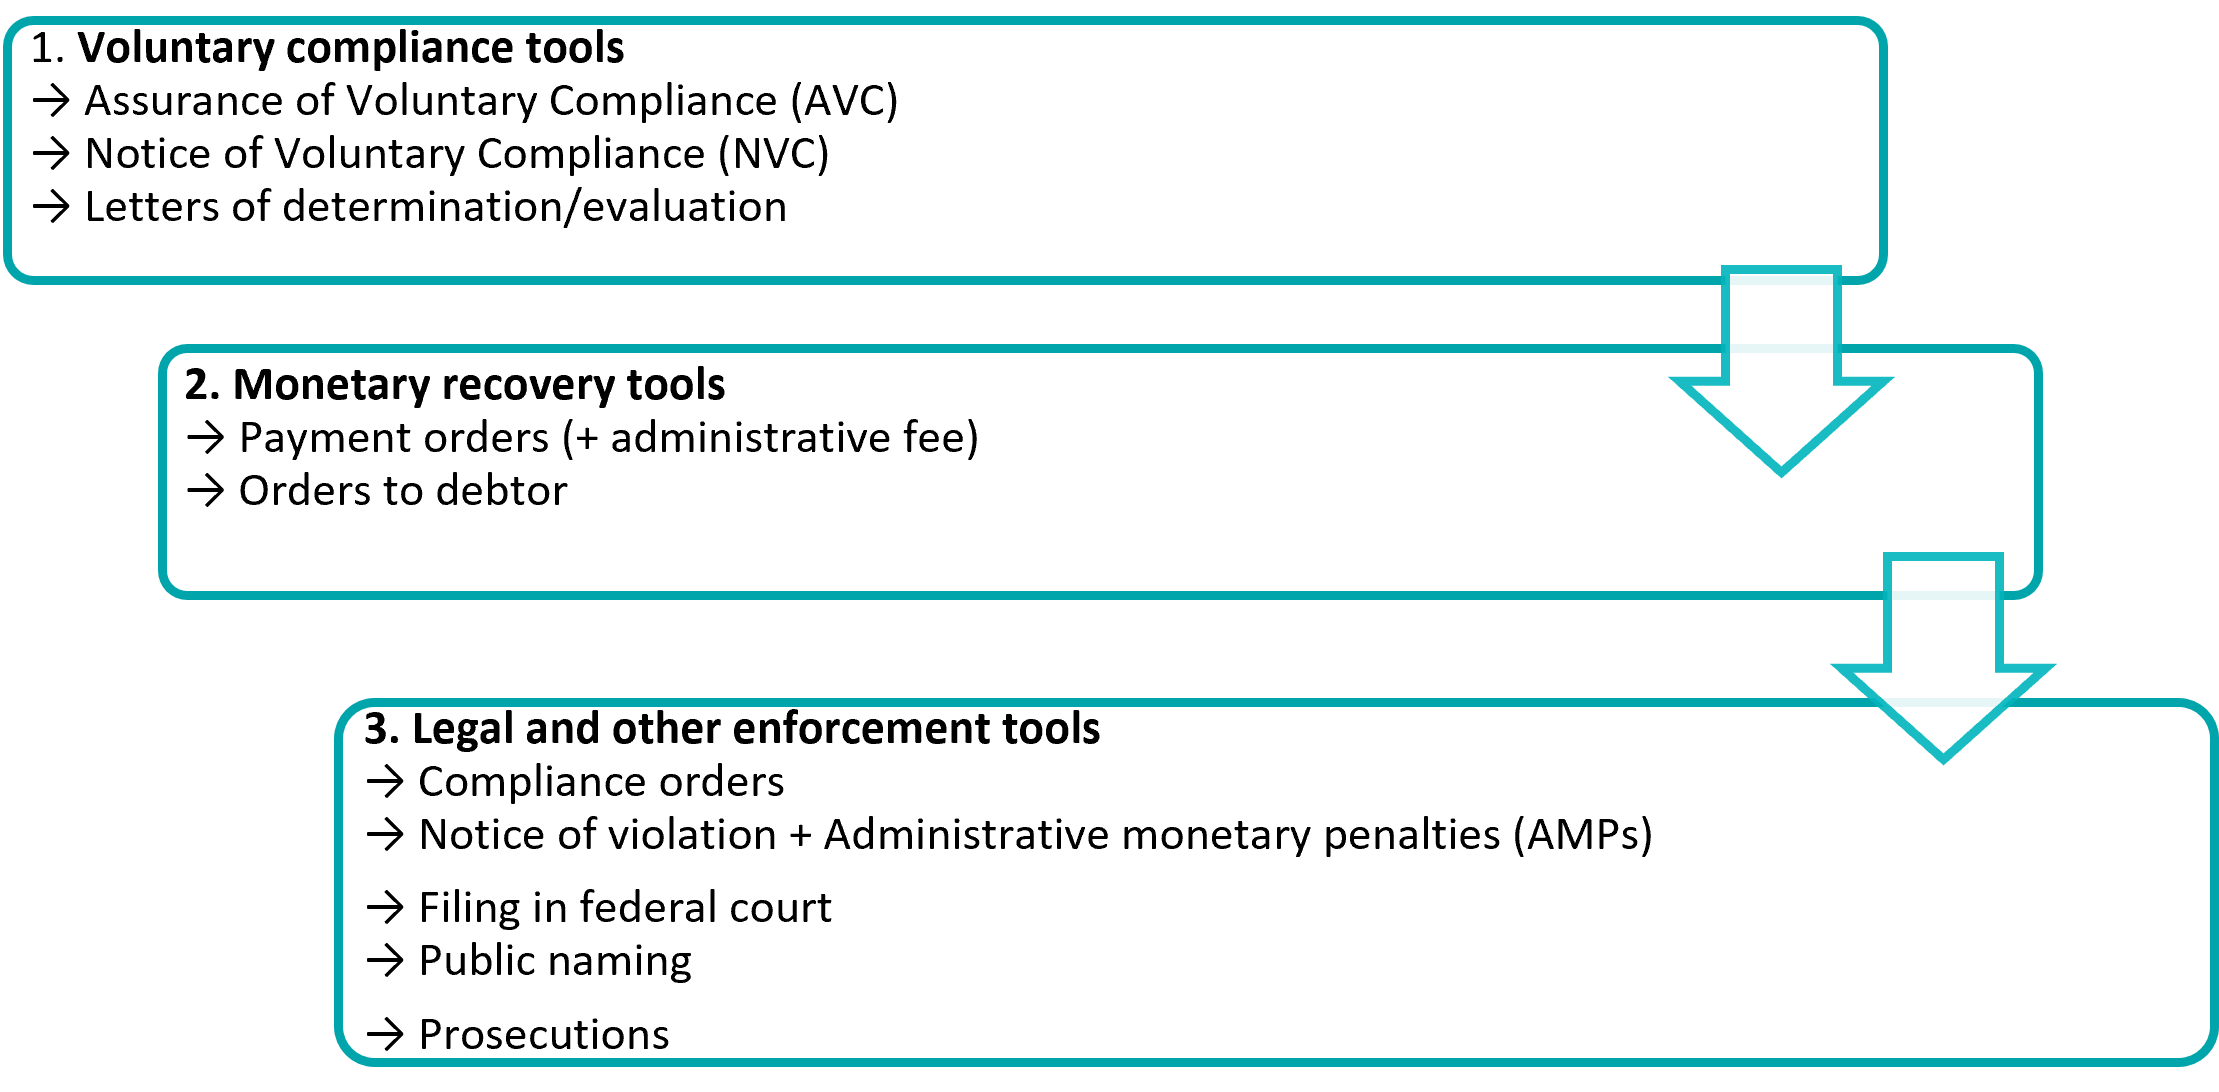
The Labour Program responds to non-compliance with the Code through a graduated system of enforcement (Figure 2). Initial steps focus on voluntary compliance, using tools such as Assurance of Voluntary Compliance (AVC) and letters of determination.
If the employer fails to comply or the contravention is more serious, the Program escalates its response through monetary recovery tools (for example, payment orders, orders to debtor), legal enforcement actions (for example, compliance orders, administrative monetary penalties that may include public naming, and federal court filings).
In severe or repeated cases, prosecutions may also be pursued, though this is rare. This graduated approach is designed to correct contraventions, deter future non-compliance, and promote fair and equitable workplaces.
Text Description of figure 2
Figure 2 presents a structured list of compliance and enforcement tools organized into three numbered categories.
The first category is "Voluntary compliance tools." This category includes three items: Assurance of Voluntary Compliance (AVC), Notice of Voluntary Compliance (NVC), and letters of determination or evaluation.
The second category is "Monetary recovery tools." This category includes payment orders, which may include an administrative fee, and orders to debtor.
The third category is "Legal and other enforcement tools." This category includes compliance orders, notices of violation with administrative monetary penalties (AMPs), filing in federal court, public naming, and prosecutions.
Available data from 2016-2017 to 2019-2020 from the former operating system (Labour Applications 2000) show that most contraventions were resolved at the early stages of enforcementFootnote 11. On average, only 5.0 % of contraventions were addressed through assurance of voluntary compliance (AVC). Letters of determination consistently represented the most frequently used compliance tool, accounting for 46.7% of all contraventions from the period 2016-2017 to 2019-2020 (Table 13). This suggests that a significant proportion of cases were resolved through early-stage administrative engagement.
| Fiscal Year | Statistics | AVC | Letter of Determination | Payment Order | Order to Debtor | Filing in Federal Court | Other | All founded contraventions |
| 2016/2017 | N | 161 | 1,335 | 596 | 291 | 262 | 24 | 2,669 |
| % | 6.0 | 50.0 | 22.3 | 10.9 | 9.8 | 0.9 | 100 | |
| 2017/2018 | N | 111 | 1,141 | 680 | 358 | 307 | 14 | 2,611 |
| % | 4.3 | 43.7 | 26.0 | 13.7 | 11.8 | 0.5 | 100 | |
| 2018/2019 | N | 100 | 1,120 | 529 | 273 | 241 | 8 | 2,271 |
| % | 4.4 | 49.3 | 23.3 | 12.0 | 10.6 | 0.4 | 100 | |
| 2019/2020 | N | 154 | 1,357 | 684 | 430 | 413 | 6 | 3,044 |
| % | 5.1 | 44.6 | 22.5 | 14.1 | 13.6 | 0.2 | 100 | |
| All Years | N | 526 | 4,953 | 2,489 | 1,352 | 1,223 | 52 | 10,595 |
| % | 5.0 | 46.7 | 23.5 | 12.8 | 11.5 | 0.5 | 100 |
- Source: Administrative data, LA2000
Payment orders and orders to debtor were used for 23.5 % and 12.8% of contraventions, respectively, reflecting the preponderance of monetary versus non-monetary complaints among cases that were investigated.
From 2016-2017 to 2019-2020, filings in Federal Court were used, on average for 11.5% of contraventions. The option to file a payment order in Federal Court is given to the complainant if/when the Labour Program cannot fully recover the amounts owing. The number of filings in federal court range from a low of 262 in 2016-2017 and a high of 413 in 2019-2020, which might indicate either a reduced rate of recovery by the Program and/or potentially an increased willingness by complainants to take further actions.
Following the legislative changes in 2021, the enforcement framework was broadened with the introduction of administrative monetary penalties (AMPs) and compliance orders, expanding the range of high-severity tools available to the Program. Despite this expansion, their use remained limited.
From January 2021 to March 2024, only 12 AMPs were issued, and 12 compliance orders were applied in relation to monetary and non-monetary complaints, along with 22 compliance orders following proactive inspections. Additionally, no prosecutions were pursued during the evaluation period, reinforcing the observation that enforcement continues to rely primarily on administrative and financial mechanisms rather than judicial proceedings.
According to program officials, no prosecutions have been pursued since 2011, largely because the Public Prosecution Service must assess the cost-benefit of allocating legal resources, against the anticipated outcomes, an assessment that may not consistently support proceeding with such cases given the very high threshold of evidence required, among other factors.
Compliance and enforcement actions have shown limited effectiveness in deterring repeat contraventions. Notably, one in four employers who commit a monetary contravention have had monetary contravention(s) in the past three years.
The percentage of employers who commit a monetary contravention of the same type within three years of the initial contravention is used to assess the effectiveness of the Program's compliance and enforcement actions in deterring contraventions in the medium term. On average, from 2016-2017 to 2022-2023, 81.2% of employers who commit contravention(s) were found non-compliant with core monetary provisions, especially annual vacations, payment of wages, or general holidays. These represent the three most common types of monetary contraventions to Part III of the Code (Table 14).
Among employers who commit contravention(s), 28% repeated monetary contravention(s) they have had within the past three years. This indicator is above the target of 20% set by the Program. The persistence of repeat contraventions over time raises questions about the effectiveness of deterrence mechanisms. The recurrence rate indicates that a subset of employers may not be fully deterred by existing enforcement actions. Additional targeted strategies may be needed to address repeat non-compliance.
| Fiscal Years | Employers with contravention(s) | Employers with at least one monetary contravention | Employers with monetary contravention(s) in the past 3 years | ||
|---|---|---|---|---|---|
| Key description | N | N | % | N | % |
| 2016/2017 | 893 | 708 | 79.3 | - | - |
| 2017/2018 | 855 | 697 | 81.5 | 231 | 27.0 |
| 2018/2019 | 746 | 601 | 80.6 | 198 | 26.5 |
| 2019/2020 | 832 | 693 | 83.3 | 233 | 28.0 |
| 2020/2021 | 625 | 528 | 84.5 | 185 | 29.6 |
| 2021/2022 | 705 | 611 | 86.7 | 204 | 28.9 |
- Note: Top 3 monetary contraventions include annual vacation, payment of wages and general holidays.
- Source: Administrative Data, ILS
Recovery rates of "monies" are declining despite large amounts assessed.
The percentage of monies assessed and collected, whether through voluntary compliance or enforced compliance, is the indicator used to assess the effectiveness of the Program's compliance and enforcement measures. This metric reflects the Program's capacity to recover wages and other monies owed to workers and is benchmarked against a target of 75% or higher each fiscal yearFootnote 12.
Figure 3 illustrates the annual trends in the amounts of monies assessed and collected, as well as the percentage of recovery relative to the total assessed amounts from 2017-2018 to 2023-2024. During this period, the average amount of monies assessed from monetary contraventions (including annual vacations, payment of wages, overtime and severance pay) was $3.6 million annually, while the average amount collected from non-compliant employers was $2.3 million each year. This translates to an average recovery rate of 63.3%, which falls short of the Program's target.
The Program did not meet its 75% target in any of the years, except 2016-2017. The recovery rate consistently dropped from 70.8% in 2017-2018 to 55.6% in 2023-2024. This downward trend raises concerns about the effectiveness of efforts to recover monies owed to workers. Several factors could be contributing to this situation, including limited enforcement capacity, procedural or legal barriers to collection, reduced employer responsiveness, and/or insufficient follow-up mechanisms.
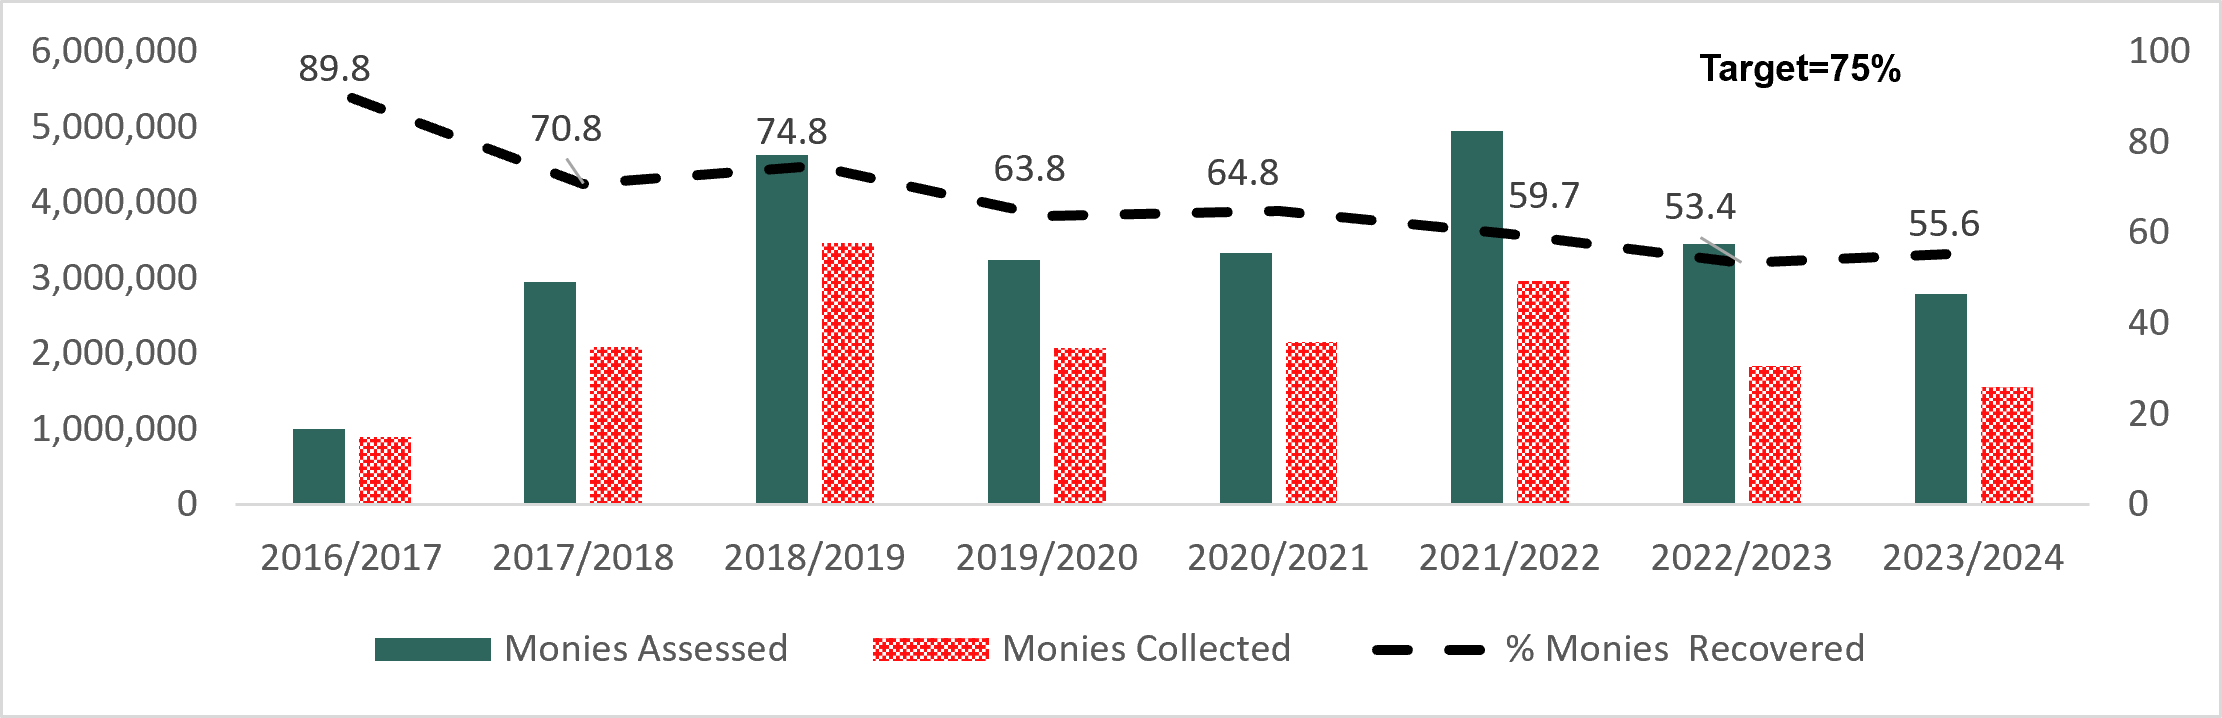
- Source: Administrative Data, ILS
Text description of figure 3
| Fiscal Year | Monies Assessed | Monies Collected | % Monies Recovered |
|---|---|---|---|
| 2016/2017 | 1,004,740 | 902,473 | 89.8 |
| 2017/2018 | 2,943,078 | 2,083,747 | 70.8 |
| 2018/2019 | 4,630,349 | 3,464,298 | 74.8 |
| 2019/2020 | 3,240,359 | 2,068,869 | 63.8 |
| 2020/2021 | 3,333,765 | 2,158,674 | 64.8 |
| 2021/2022 | 4,953,283 | 2,958,208 | 59.7 |
| 2022/2023 | 3,446,231 | 1,840,829 | 53.4 |
| 2023/2024 | 2,793,859 | 1,553,319 | 55.6 |
Enforcement efforts are weakened by limited use of tools, resource constraints, and growing backlogs.
The Labour Program's enforcement system faces several persistent challenges.
Among program officials interviewed, a few (3 out of 15) reported that stronger enforcement tools, such as administrative monetary penalties (AMPs) and compliance orders, are rarely used, citing complex procedural requirements, multiple approval steps, and rigid prerequisites.
Some program officials (5 out of 15) highlighted that enforcement tools, particularly Administrative Monetary Penalties (AMPs), are not user-friendly. They explained that the enforcement process is overly complex, requiring multiple procedural steps, approvals, and prerequisites, which slows down enforcement and discourages officers from using these tools. High workloads, heavy caseloads, and limited training further contribute to inconsistent use of enforcement tools.
In terms of employer types, a few program officials (2 out of 15) mentioned that enforcement tools are more often applied with cooperative employers, while resistant employers may evade penalties by restructuring or concealing operations.
This is also found in the literature, as Vosko et al. (2024)Footnote 13 observed that Labour Affairs Officers (LAOs) face significant challenges with employer non-cooperation and inadequate documentation, particularly in the road transportation sector, where many small firms fail to retain records for the required 36 months. The authors also documented cases of employers intentionally evading compliance, including those that transfer assets, ignore payment orders, or close and reopen under new business identities to avoid enforcement and erase prior debts or contraventions.
Additionally, a few employee representatives (2 out of 9) and program officials (3 out of 15) mentioned that enforcement is often perceived as reactive, symbolic, and ineffective, with penalties viewed as too low or inconsistently applied.
"Administrative monetary penalties have been issued infrequently, and in, some regions, not at all. Even when issued, small fines of $500 to $1,000 are considered just a cost of doing business for many employers, particularly when unpaid wages owed to employees can be significantly higher, sometimes reaching $10,000 per complaint."
Enforcement of labour standards in regulated industries is largely reactive, with over 95% of contraventions identified through worker complaints rather than proactive inspections. Vosko et al. (2021Footnote 14; 2022Footnote 15; 2024) highlighted that reactive enforcement places the burden on individuals and disproportionately disadvantages vulnerable groups, such as migrant and temporary foreign workers, as well as those in precarious employment, particularly in high-contravention sectors, where employees of small businesses often hesitate to file complaints due to fears of retaliation or job loss. Persistent non-compliance is fueled by weak enforcement mechanisms and minimal penalties, which enable employers to exploit loopholes and rely on informal payment practices (Vosko et al.,2022).
Finite resources, including staff capacity in the Labour Program, compounded by growing caseloads and systemic backlogs, has further reduced the deterrent impact of enforcement, contributing to weakened program effectiveness. In interviews and document review, insufficient resources of the Labour Program were identified as a barrier to proactive inspections and timely complaint resolution. Some key informants (11 out of 27), including employee and employer representatives and program officials linked these constraints to unaddressed contraventions and weaker enforcement capacity.
Finally, some key informants (11 out of 27), including employee and employer representatives and program officials, highlighted that vulnerable and underrepresented workers, including women, immigrants, foreign workers, racialized workers, and gig workers, face higher risks of misclassification, workplace exclusion from fair treatment and opportunities, and reprisal, making enforcement less accessible.
"Newcomers are often really unfortunately abused... they have the highest incidence of wage theft, which goes back to misclassification."
The Program's timeliness in responding to complaints and inquiries
The evaluation assessed the responsiveness and operational efficiency during the 2016-2017 to 2023-2024 period, with a focus on the Program's ability to respond to complaints and inquiries using its performance indicators and service standard targets outlined in the 2018 performance information profile.
Finding 4
The Program has not met its service standards for responding to inquiries and resolving monetary complaints for several years, pointing to resource constraints and limited capacity. Complaints and complaint backlogs have grown steadily, with notable increases in 2022-2023 and 2023-2024.
Responding to 1-800 calls and other inquiries
As shown in Table 15, the proportion of inquiries responded to within 24 hours fluctuated over the evaluation periodFootnote 16. Prior to the key legislative changes implemented, starting 2019-2020, response rates were consistently high, 98% in 2017-2018 and 96.4% in 2018-2019. Responsiveness has declined sharply since 2019-2020, falling to 26% in 2022-2023 and further to 16% in 2023-2024.
When assessed against the Program's 90% performance target, administrative data indicate that the Program has not met its goal of returning inquiries within 24h since 2019-2020. This decline is likely linked to resource constraints, as the volume of inquiries remained relatively high during the evaluation period.
| Year | Number of calls received | % of calls returned within 24 hours | Target |
|---|---|---|---|
| 2016-2017 | 8,166 | 69% | 90% |
| 2017-2018 | 11,342 | 98% | 90% |
| 2018-2019 | 17,190 | 96% | 90% |
| 2019-2020 | 18,426 | 56% | 90% |
| 2020-2021 | 12,989 | 57% | 90% |
| 2021-2022 | 12,071 | 70% | 90% |
| 2022-2023 | 13,990 | 26% | 90% |
| 2023-2024 | 16,616 | 16% | 90% |
- Source: Administrative data, LS ERO Hub
Timeliness of complaint resolution
Between 2016-2017 and 2022-2023, the Labour Program resolved on average 78.9% of non-monetary complaints and 72.7% of unjust dismissal complaints within 180 days, exceeding its target of 60% and 75% respectively, for these types of complaints throughout the evaluation period (Figure 4).
In contrast, the Program did not meet the 60% target for resolving monetary complaints within 180 days in any year except 2019-2020, when 62% were finalized within 180 days, coinciding with the onset of the COVID-19 pandemic. On average, only 53.6% of monetary complaints were resolved within the 180-day timeframe during the evaluation period.
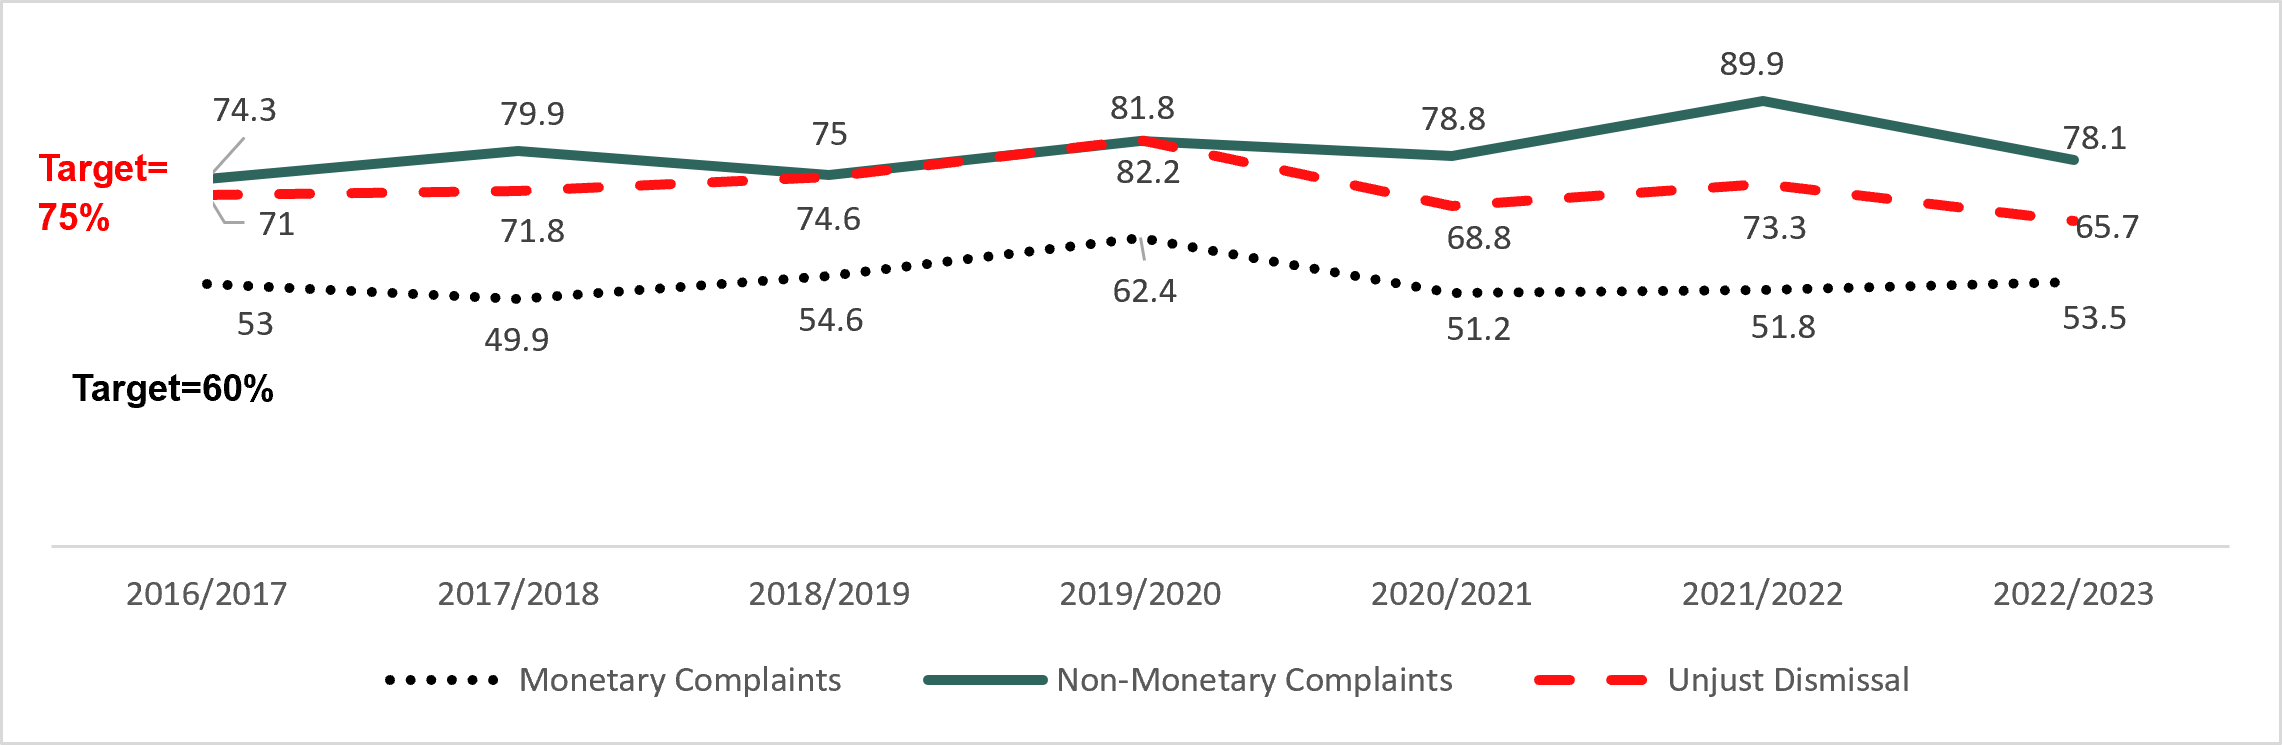
- Source: Administrative data, ILS
Text description of figure 4
| Percentage of Complaints Finalized Within 180 Days by Fiscal Year | Monetary Complaints | Non-Monetary Complaints | Unjust Dismissal |
|---|---|---|---|
| 2016/2017 | 53.0 | 74.3 | 71 |
| 2017/2018 | 49.9 | 79.9 | 71.8 |
| 2018/2019 | 54.6 | 75.0 | 74.6 |
| 2019/2020 | 62.4 | 81.8 | 82.2 |
| 2020/2021 | 51.2 | 78.8 | 68.8 |
| 2021/2022 | 51.8 | 89.9 | 73.3 |
| 2022/2023 | 53.5 | 78.1 | 65.7 |
The average time required for Labour Affairs Officers to process complaints Footnote 17 plays a vital role in assessing and strengthening workplace compliance with Part III of the Code in federally regulated sectors. Extended delays can discourage workers from submitting complaints and may signal to employers that non-compliance may go unaddressed.
Between 2016-2017 and 2023-2024, the Labour Program consistently responded to non-monetary complaints and unjust dismissal cases in a timely manner. As shown in Figure 5, the average time to resolve non-monetary complaints was 6.3 hours, well below the Program's target of 13 hours. For unjust dismissal complaints, the average processing time remained close to the 14-hour threshold throughout the period, ranging from 11.9 hours in 2016-2017 to a high of 14.1 hours in 2021-2022.
The dotted line in Figure 5 shows that monetary complaints generally take longer to process than non-monetary complaints or those related to unjust dismissal. Over the entire evaluation period, the Program exceeded its 17-hour target, taking an average of 19.5 hours to resolve a monetary complaint.
While resolution times were relatively stable before 2020-202, ranging between 17.8 and 18.8 hours, there was a significant increase in recent years reflecting the surge in complaints associated with the numerous legislative changes. In 2021-2022 and 2022-2023, the average time to process a monetary complaint rose to about 24 hours.
This increase in processing time in 2021-2022 and 2022-2023 could be partly explained by operational pressures driven by the observed increase in complaints in recent years. A program official noted that inspectors may have been managing high caseloads and dividing their attention across a broader set of clients, which could have impacted overall efficiency. Additionally, the informant also mentioned that broader resource constraints, such as possible staffing challenges and limited operational flexibility, might also be contributing to the Program's reduced capacity to maintain previous processing times.
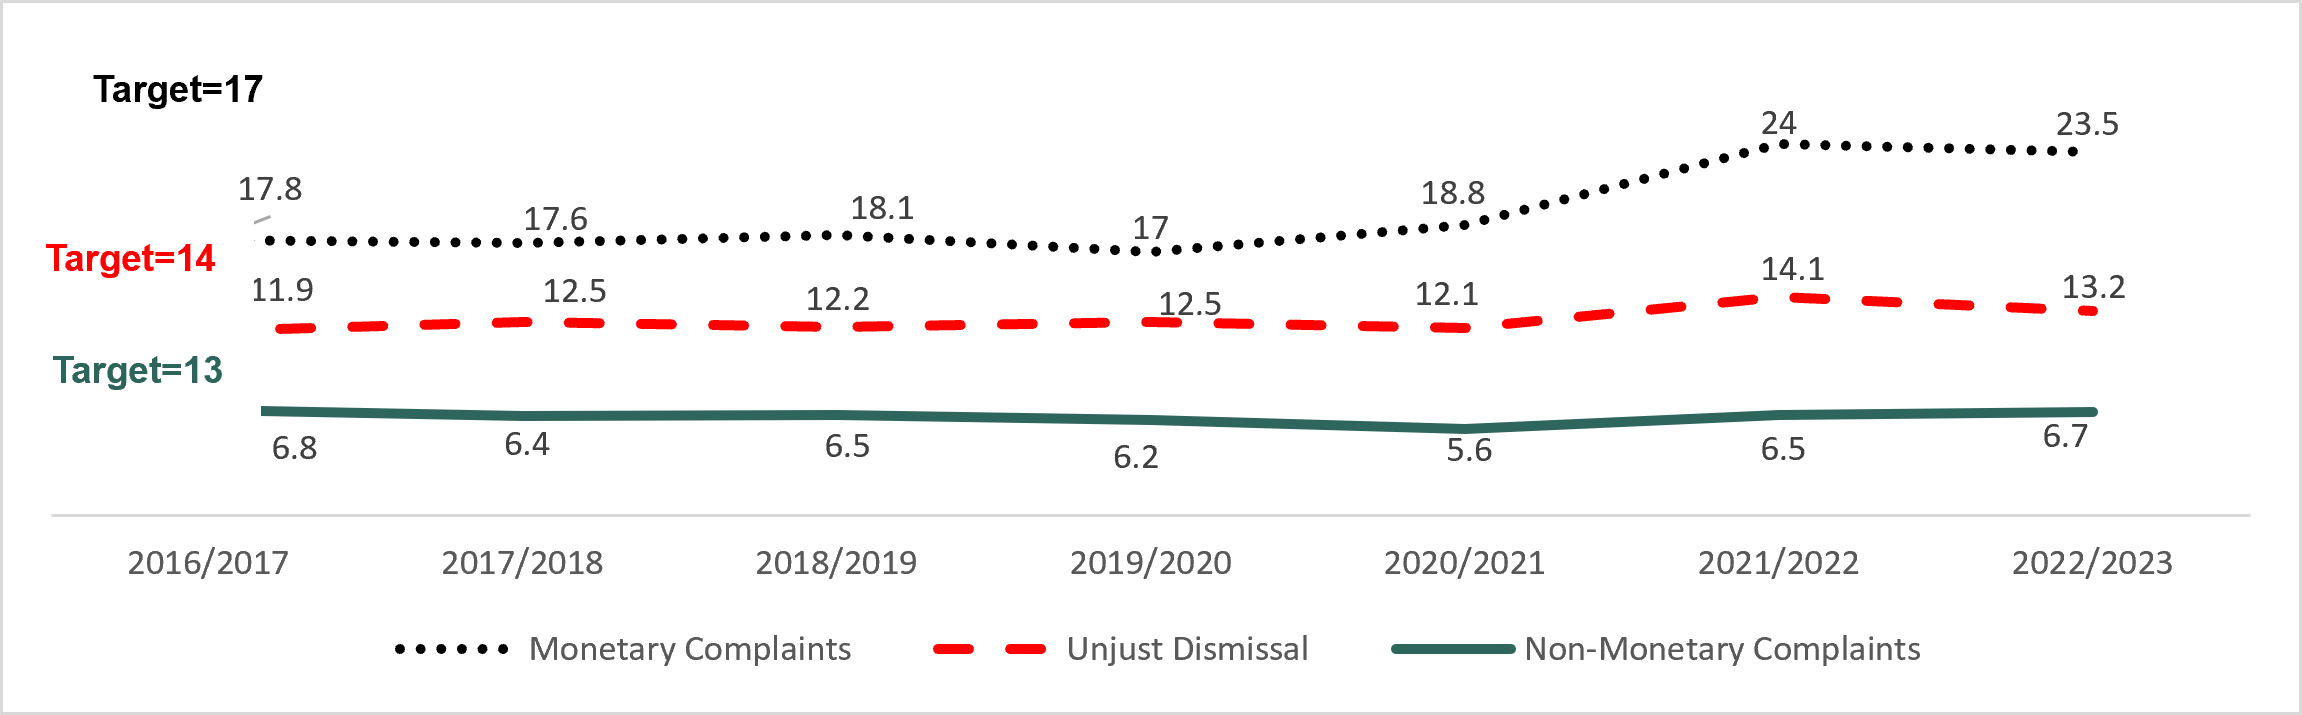
- Source: Administrative data, ILS
Text description of figure 5
| Average Hours to finalize | Monetary Complaints | Unjust Dismissal | Non-Monetary Complaints |
|---|---|---|---|
| 2016/2017 | 17.8 | 11.9 | 6.8 |
| 2017/2018 | 17.6 | 12.5 | 6.4 |
| 2018/2019 | 18.1 | 12.2 | 6.5 |
| 2019/2020 | 17.0 | 12.5 | 6.2 |
| 2020/2021 | 18.8 | 12.1 | 5.6 |
| 2021/2022 | 24.0 | 14.1 | 6.5 |
| 2022/2023 | 23.5 | 13.2 | 6.7 |
Backlogs have increased significantly across all complaint types.
The number of open cases that are not finalized increased substantially during the evaluation period (Figure 6). Open cases for monetary complaints more than tripled (from a low of 1,024 in 2018-19 to a high of 3,084 in 2023-24), non-monetary cases rose from a low of 57 to a high of 622 in 2023-2024, and unjust dismissal complaints increased from a low of 316 in 2021-2022 to 1,025 in 2021-2022.
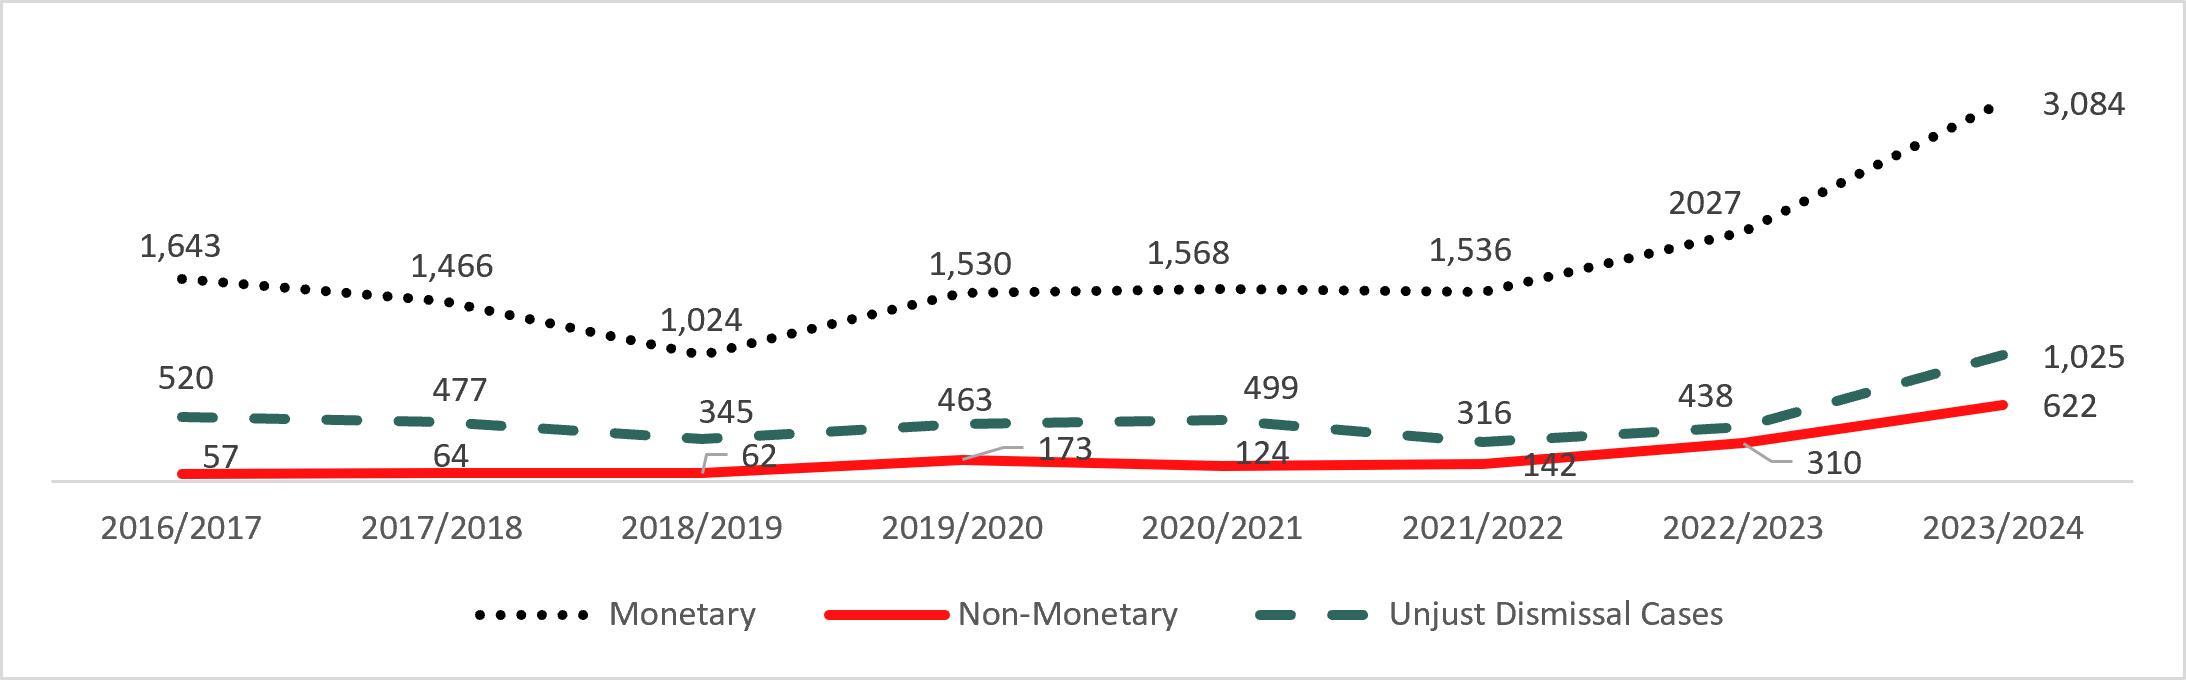
- Source: Administrative data, adapted from labour standards dashboards
Text description of figure 6
| Fiscal Year | Monetary | Non-Monetary | Unjust Dismissal Cases |
|---|---|---|---|
| 2016/2017 | 1,643 | 57 | 520 |
| 2017/2018 | 1,466 | 64 | 477 |
| 2018/2019 | 1,024 | 62 | 345 |
| 2019/2020 | 1,530 | 173 | 463 |
| 2020/2021 | 1,568 | 124 | 499 |
| 2021/2022 | 1,536 | 142 | 316 |
| 2022/2023 | 2,027 | 310 | 438 |
| 2023/2024 | 3,084 | 622 | 1,025 |
The difference between the number of monetary complaints finalized and initiated each fiscal year serves as an indicator of the Program's ability to manage its caseload and reduce backlog. A positive change suggests that more complaints were finalized than initiated, indicating progress in clearing existing cases, while a negative change reflects an accumulation of unresolved complaints.
From 2017-2018 to 2023-2024, the Program met its target of finalizing at least 10% more complaints than it received in only one year (2018-2019), wherein finalized complaints exceeded initiated ones by 19.7% (see Table 16). In all other years, the indicator remained below target, and in most cases, was negative, indicating that the Program ability to finalized complaints was not keeping pace with incoming complaints.
This trend became particularly acute in recent years. In 2022-2023, the number of finalized monetary complaints was 20.8% lower than the number of complaints initiated. The gap widened further in 2023-2024, with a 38.4% shortfall, the largest observed during the evaluation period. These figures point to a growing backlog and suggest a reduced capacity to resolve complaints in a timely manner.
The Program's performance has been strained by an increase in complaints following numerous amendments to the Code since 2019 and the growth in federally regulated employees, especially in the road transportation sector. Historically, the Labour Program processed about 3,600 complaints annually against an intake of roughly 3,800. Since 2019-2020, volumes of complaints have increased and reached 4,400 in 2022-2023 and 5,800 in 2023-2024, outpacing processing capacity and contributing to backlogs.
| Fiscal year | Initiated | Finalized | % Finalized | Target |
|---|---|---|---|---|
| 2017/2018 | 2,442 | 2,379 | -2.6 | 10% |
| 2018/2019 | 2,113 | 2,530 | 19.7 | 10% |
| 2019/2020 | 2,612 | 2,124 | -18.7 | 10% |
| 2020/2021 | 2,220 | 2,138 | -3.7 | 10% |
| 2021/2022 | 2,328 | 2,348 | 0.9 | 10% |
| 2022/2023 | 2,457 | 1,947 | -20.8 | 10% |
| 2023/2024 | 3,219 | 1,983 | -38.4 | 10% |
- Source: Administrative data, ILS
Barriers and challenges to the timely complaint resolution
Delays in complaint processing can be attributed to a combination of internal and external factors. Program documentation and interviews identified increased complaint volumes and complexity, high staff turnover, with over 50% of LAOs being new (2021-2022), and challenges adapting to the new operating system (the Integrated Labour System).
Some program officials (7 out of 15) highlighted that staffing levels did not keep pace with growing demand, and that attrition created significant training gaps. Since it takes approximately three years for new staff to become fully proficient, turnover resulted in prolonged productivity losses, further slowing case processing.
External disruptions, including delays at the Canada Industrial Relations Board (CIRB)Footnote 18, the COVID-19 pandemic, and public service strikes, further exacerbated these issues. Together, these factors hindered the Program's ability to respond to complaints in a timely and consistent manner.
Some program officials (2 out of 6) pointed to administrative inefficiencies such as manual data entry, outdated systems, and redundant processes. Staffing shortages and high complaint volumes, particularly in the road transportation sector, were also cited as barriers to timely resolution.
"Complaints are submitted online and automatically entered into the systems [in the province of Quebec]. We still enter them manually. This takes a lot of staff time and contributes to processing delays."
A few key informants (8 out of 35), including employee and employer representatives and program officials also noted that limited staff capacity and systemic backlogs reduce the deterrence of enforcement mechanisms.
"The biggest problem we have with this is enforcement… taking three to six months to process personal and medical leave (complaints)."
While structured training modules were introduced, some program officials (2 out of 8) reported that they were overly procedural and lacked focus on legal reasoning and real-world application. Foundational training was described as overwhelming, with insufficient ongoing or hands-on learning, especially in smaller or remote regions. Delays in training on new legislation and poor internal communication left some officers less informed than employers. Training was also misaligned with job roles, particularly for technical advisors and early resolution officers.
Stakeholders' experience with service delivery
Among surveyed employees who filed a complaint with the Program, 37% rated the service as good or excellent, 20% as fair, while some (29%) rated it as poor or very poor.
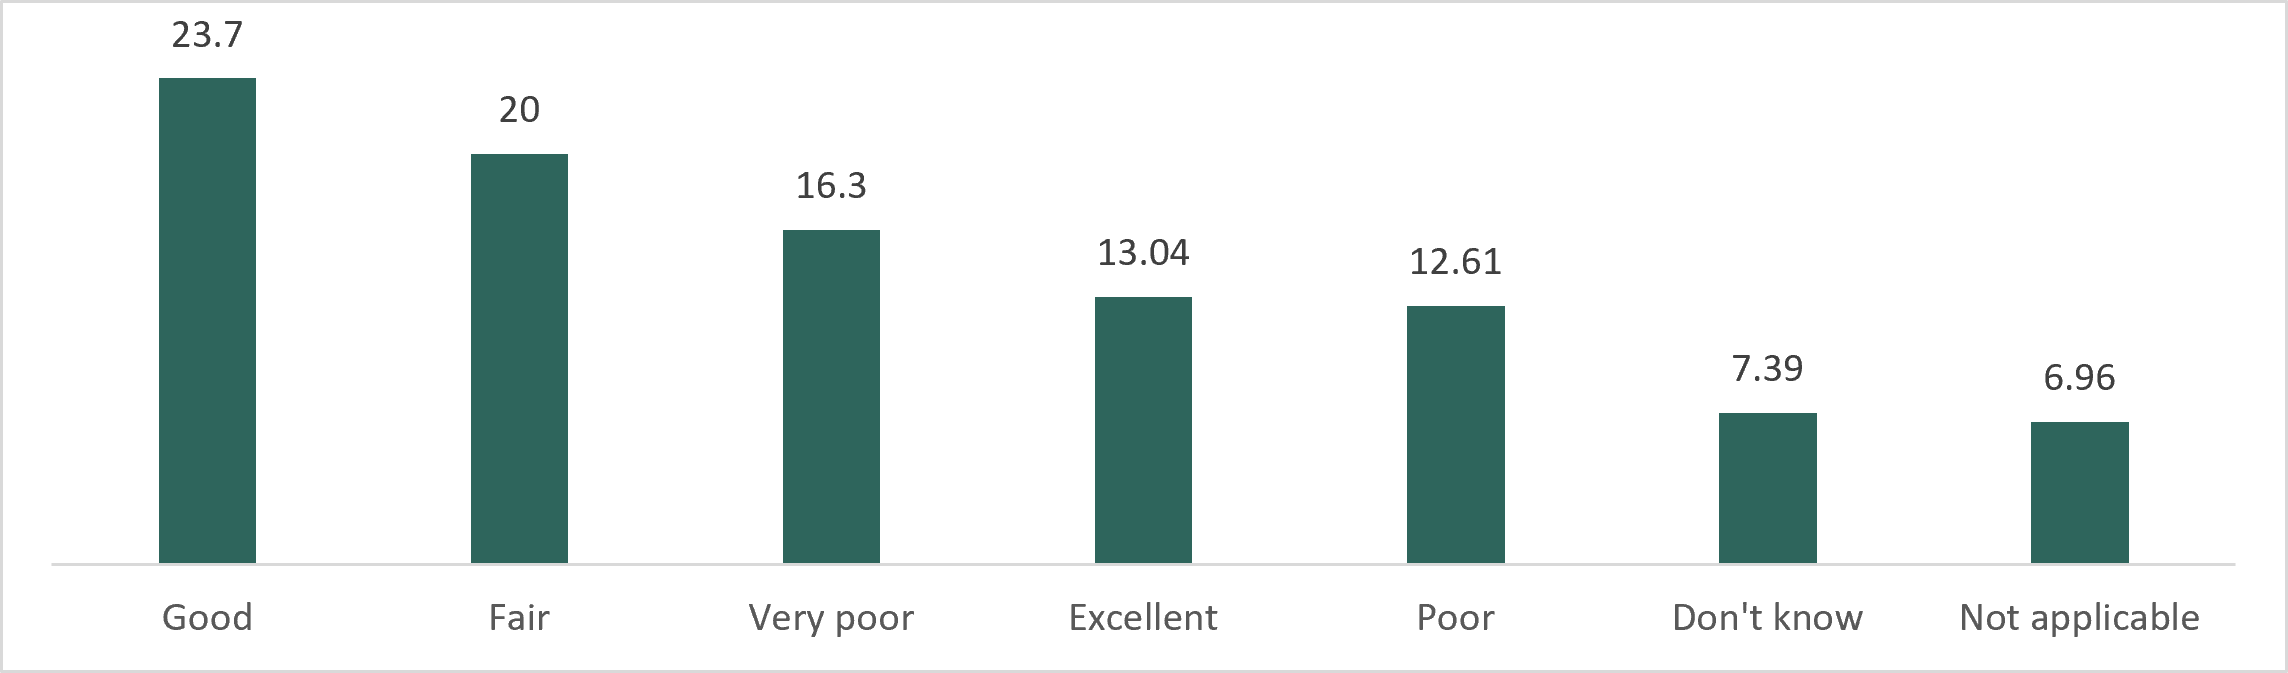
- Source: Source: 2025 Evaluation Survey of Employees who filed a complaint or asked for information
Text description of figure 7
| Complainants' perception on the quality of service received from the Program | Percent |
|---|---|
| Good | 23.7 |
| Fair | 20 |
| Very poor | 16.3 |
| Excellent | 13.04 |
| Poor | 12.61 |
| Don't know | 7.39 |
| Not applicable | 6.96 |
Over half of respondents (50.7%) who rated the service as poor or very poor reported slow response times, indicating persistent delays in complaint processing. Some also experienced no resolution (42.7%) or limited follow-up (41.8%) from the Labour Program.
About one-third found the support from officers insufficient (37.3%) or had difficulty reaching the right contact (32.0%). Additional concerns about fairness (30.2%), unclear communication (27.1%), and complex administrative processes (21.3%) highlight broader issues with timeliness, transparency, and client support within the Labour Program's service delivery.
The majority of surveyed employees (53%) who filed a complaint with the Labour Program reported that no changes occurred in their workplace following the complaint.
- Among employees who did not file a complaint (49% of respondents), the most frequently cited reasons for not initiating a complaint to the Program, included:
- Fear of employer retaliation (60%)
- Belief that reporting would not stop the contravention (49%)
- Slow response times (28%)
- Difficulty reaching the appropriate program contact (25%)
Proactive activities to encourage employer compliance
Finding 5
The Program has increased its proactive activities to encourage employer compliance with labour standards. However, targeting high-risk sectors, those with a higher likelihood of contraventions under Part III of the Code, and the effectiveness of proactive inspections remain limited. Operational challenges also continue to constrain the reach and impact of proactive efforts.
The Program undertakes proactive activities independently of complaints to support compliance promotion through education, outreach, and inspections. These activities include:
- Education: counselling, promotional initiatives, and seminars designed to inform employers and employees of their rights and responsibilities
- Proactive inspections: routine or targeted inspections conducted to assess compliance with relevant regulations, regardless of whether a complaint was received
- Other activities: including follow-up visits and special assignments aimed at reinforcing compliance and addressing specific concerns
The evaluation conducted an administrative data analysis to compare the volume, time allocation, and outcomes of proactive activities over time, to identify trends, shifts in strategy, and potential impacts on employer compliance from 2016-2017 to 2023-2024. Sectoral and regional breakdowns shared in this section are used to assess the alignment of proactive efforts with areas of higher risk.
The Program has increased its proactive activities.
Albeit small relative to the volume of reactive measures, the volume of proactive activities has increased over the evaluation period, going from 359 activities in 2017-2018 to 908 activities in 2023-2024. Over the same period, reactive activities remained more stable fluctuating around an average of 6,000 cases per year.
There was a peak in proactive activities in 2021-2022, with 1,260 activities completed during the recovery year after the COVID-19 pandemic. This decreased to 737 in 2022-2023 and rose to 908 in 2023-2024.
The increase in proactive activities during the evaluation period suggests they were used more frequently to encourage compliance. A program official indicated that this increase was driven by the numerous legislative and regulatory changes introduced since 2019, which created a greater need to raise awareness and educate employers and employees on the new and updated provisions.
The analysis of the hours spent on proactive work versus reactive cases offers insight into how labour standards officers allocate their time, highlighting the Program's recent shift toward placing relatively more emphasis on proactive engagement, even though reactive activities still account for most hours.
Figure 8 shows that time spent on proactive activities increased from 4,617 hours in 2017-2018 to 8,644 hours in 2023-2024, peaking in 2021-2022 during the recovery year after the COVID-19 pandemic (12,494 hours).
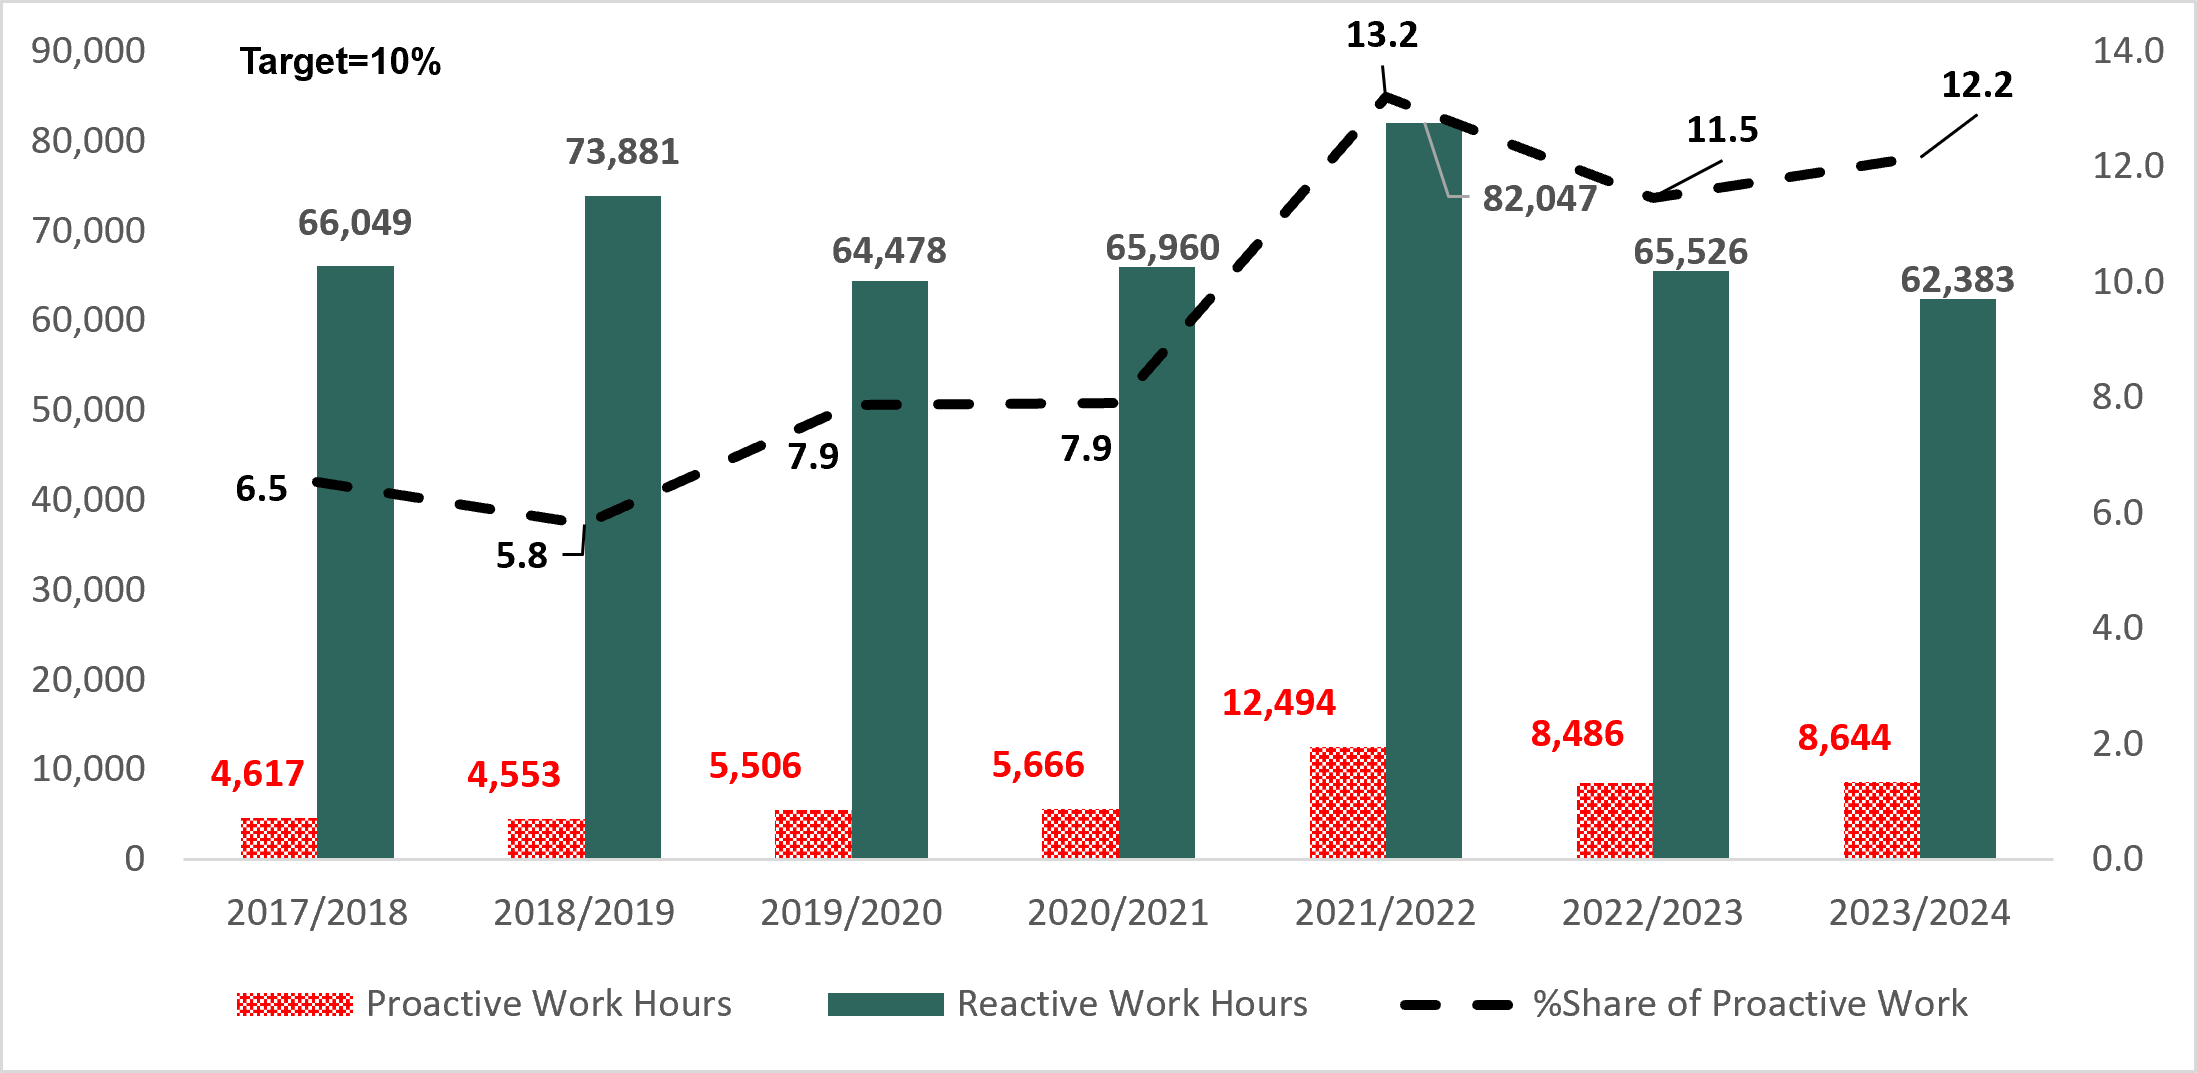
- Source: Administrative data, ILS
Text description of figure 8
| Fiscal Year | Proactive Activities (total hours spent) | Reactive Activities (total hours spent) | Percentage of total hours spent on proactive activities |
|---|---|---|---|
| 2017/2018 | 4,617 | 66049 | 6.5 |
| 2018/2019 | 4,553 | 73881 | 5.8 |
| 2019/2020 | 5,506 | 64478 | 7.9 |
| 2020/2021 | 5,666 | 65960 | 7.9 |
| 2021/2022 | 12,494 | 82047 | 13.2 |
| 2022/2023 | 8,486 | 65526 | 11.5 |
| 2023/2024 | 8,644 | 62383 | 12.2 |
The proportion of time that Labour Affairs Officers dedicate to proactive activities, including educating employees and employers about their rights, informs the relative importance and combination of both types of measures. As per the Labour Program 2018 performance information profile, the target is for proactive activities to represent 10% of total activities.
Figure 12 shows that during the evaluation period, the indicator was below the 10% target until 2020-2021 and exceeded the target as of 2021-2022, when it rose to 13.2%, and remained above target in subsequent years. This proportional increase in the time allocated to proactive activities suggests a deliberate effort towards a preventive enforcement approach.
Since 2021-2022, officers have been dedicating relatively more effort to outreach and education, which is essential for fostering voluntary compliance. Proactive activities are being prioritized to improve employer adherence to labour standards.
Targeting of proactive activities and inspections
During the evaluation period, proactive activities were primarily concentrated in regions with higher levels of complaints and contraventions, most notably Ontario and the Northwest Pacific, indicating a geographically strategic response. However, evidence from the administrative data analysis reveals that the distribution of proactive work hours and inspections across sectors does not closely align with the distribution of complaints or contraventions.
For example, the road transportation sector accounts for 67.9% of complaints and 88.6% of contraventions yet received only 40.0% of proactive work hours and 32.4% of proactive inspections during the evaluation period (Table 17).
In contrast, air transportation, which represents just 5.1% of complaints and 3.5% of contraventions, receives a disproportionately higher share of proactive activities, 20.4% of proactive hours and 23.5% of proactive inspections. Evidence suggests an opportunity to improve targeting and resource allocation across sectors, with a particular need to further prioritize the road transportation sector.
| Industry/Sector | Proactive work hours | Proactive inspection Hours | Contraventions | Complaints |
|---|---|---|---|---|
| Road transportation | 40.0 | 32.4 | 87.4 | 67.9 |
| Air transportation | 20.4 | 23.5 | 3.3 | 5.1 |
| Other industries | 15.4 | 17.8 | 2.9 | 13.5 |
| Indigenous/ Aboriginal | 6.2 | 2.9 | 2.5 | 3.9 |
| Communications | 6.9 | 8.1 | 1.9 | 2.6 |
| Rail transportation | 9.7 | 13.4 | 1.3 | 4.4 |
| Banking / Banks | 1.6 | 2.0 | 0.7 | 2.7 |
- Source: Administrative data, ILS
As noted in the literatureFootnote 19, resource constraints often leave high-risk sectors like road transportation under-monitored, reducing the deterrent effect of proactive efforts (Vosko et al., 2022; Vosko et al., 2021Footnote 20).
Proactive inspections are less effective in detecting non-compliance.
Although the volume of proactive inspections and the number of employers and workplaces inspected have increased, the proportion of contraventions detected through these inspections has declined, from 6.8% in 2016-2017 to 0.4% in 2022-2023 (Table 18). This downward trend may indicate the need for a more refined and targeted approach in selecting sectors and employers for inspection.
It could also suggest that proactive inspections are evolving, potentially uncovering fewer but more complex or less visible issues. Alternatively, the decline in the share of contraventions detected through proactive inspections may also reflect that such contraventions are not systematically recorded when they are directly corrected by employers.
| Fiscal Year | Number of proactive inspections | Contraventions from proactive inspections | % of contraventions from proactive inspections | Number of employers inspected | % of employers inspected with founded contraventions | Number of Workplaces inspected |
|---|---|---|---|---|---|---|
| Key description | N | N | % | N | % | N |
| 2016-2017 | 29 | 180 | 6.8 | 28 | 64.3 | 29 |
| 2017-2018 | 86 | 130 | 5.0 | 79 | 57.0 | 80 |
| 2018-2019 | 60 | 88 | 3.9 | 52 | 38.5 | 56 |
| 2019-2020 | 51 | 16 | 0.5 | 43 | 39.5 | 44 |
| 2020-2021 | 264 | 45 | 2.0 | 120 | 8.3 | 142 |
| 2021-2022 | 405 | 54 | 2.3 | 153 | 15.0 | 180 |
| 2022-2023 | 297 | 11 | 0.4 | 168 | 9.5 | 180 |
- Source: Administrative data, ILS
Targeting and resource challenges limit proactive implementation.
Some program officials (4 out of 15) interviewed for the evaluation indicated that high complaint volumes and increasing complexity are diverting staff from proactive work. They cited staffing shortages, limited time, and performance metrics that prioritize quick resolution of complaints over prevention as key factors reducing proactive activities. A program official also noted that proactive work is perceived as more difficult and less rewarding than reactive cases, which tend to deliver more visible outcomes.
In terms of planning and targeting, a few program officials (3 out of 15) indicated that the implementation of proactive inspections can be constrained by operational limitations. These include the absence of systematic data to identify high-risk employers, limited integration between compliance, policy, and data functions, and competing pressures from reactive workloads and complaint backlogs. In addition, proactive inspections are less effective when employer collaboration is limited, as some employers are unwilling to engage unless enforcement actions carry financial consequences. These constraints may limit the program's ability to consistently plan and target proactive inspections toward employers with higher risks of non-compliance.
A few employer representatives (2 out of 11) highlighted significant gaps in proactive coverage, especially in mobile or high-risk sectors like maritime transportation, where logistical barriers limit access of inspectors. Outreach and engagement efforts are also constrained by outdated contact databases, making it difficult to reach small, new, or less visible employers. Both employer and employee representatives emphasized that the lack of accurate data on regulated entities undermines the effectiveness of proactive enforcement.
"The effectiveness of proactive enforcement is limited by the Labour Program's lack of accurate data on federally regulated trucking companies, making it difficult to target non-compliant businesses. If you don't know who you're regulating, then how are you going out and doing proactive enforcement?"
"The government doesn't even have contact information for all the employers in the public sector, so they don't really know who they should be getting this information out to."
Finding 6
The Program uses multiple communication channels and has substantially increased educational efforts; however, its communication tools are perceived as difficult to navigate, locate, interpret, and as overly legalistic. Stakeholders also reported communication gaps and a lack of inclusive materials.
The Program has different communication channels and has increased its educational efforts.
The Labour Program shares information on labour standards through various channels, including the Government of Canada website (canada.ca), telephone info lines, emails, newsletters, social media (LinkedIn, X), educational material (for example, presentations, infographics, fact sheets), and Labour Standards Advisory Committee (LSAC) meetings. Outreach activities, such as open houses and counselling sessions, vary in frequency across regions and are intensified following regulatory changes.
During the evaluation period, the number of educational activities increased from 249 in 2016-2017 to 604 in 2023-2024. Among education activities, 89.5% of a total of 2,808 sessions conducted during this period consisted of employer counselling sessions. Seminars made up 6.3% of educational activities, while promotional activities accounted for the remaining 4.2%.
In its 2018 Performance Information Profile (PIP), the Program committed to allocating 6 hours or more to educational activities per year per 1,000 federally regulated employees. Table 19 shows that the Program was unable to meet this target, increasing from 2.3 hours in 2016-2017 to 4.4 hours in 2023-2024, and falling short of the 6-hour goal.
In absolute terms, the Program increased the total time allocated to education, with hours dedicated to educational activities doubling from 2,129 hours in 2016-2017 to 4,481 hours in 2023-2024, despite a significant drop in 2020-2021 in the wake of the COVID-19 pandemic.
| Fiscal year | Total hours spent on education activities | Hours per 1,000 employees | Target |
|---|---|---|---|
| 2016/2017 | 2,129 | 2.3 | 6 |
| 2017/2018 | 1,755 | 1.9 | 6 |
| 2018/2019 | 2,096 | 2.2 | 6 |
| 2019/2020 | 2,590 | 2.7 | 6 |
| 2020/2021 | 1,025 | 1.1 | 6 |
| 2021/2022 | 2,566 | 2.7 | 6 |
| 2022/2023 | 3,271 | 3.3 | 6 |
| 2023/2024 | 4,481 | 4.4 | 6 |
- Source: Administrative data, ILS
Evidence from multiple lines of evidence indicates that resources and guidance tools may not be easy for users to find or understand, and that their quality and clarity may be limited.
In the 2025 evaluation surveys, the majority of employees (75%, 345) reported using at least one government source to stay informed about labour standards, and the most selected source of information was the Government of Canada Labour Program website, used by 71% (325) of respondents. Only 32% of employees who used government-prepared sources found the information accessible or clear, with even lower ratings for completeness (23%) and timeliness (16%).
Surveyed employers gave slightly higher ratings, with some respondents (43%) indicating that the resources are accessible and 40% found them to be clear. Among employees who did not use government sources, 45% reported difficulty finding information.
These findings were echoed in interviews, where a few key informants (11%, 4 out of 35), including employee and employer representatives and program officials, stated that guidance tools (for example, Interpretations, Policies and Guidelines (IPGs)) are overly legalistic, difficult to interpret, and especially challenging for vulnerable groups.
"It's a lot of information you have to read through and dissect. While large enterprises have dedicated teams to handle compliance, small businesses lack the resources and time to sift through detailed documentation."
"The language again needs to be clearer, more accessible."
Some key informants (10 out of 35), including employee and employer representatives and program officials, also identified communication gaps. They noted that outreach efforts primarily target employers and rely heavily on union and employer channels, limiting the reach to non-unionized, precariously employed, and marginalized workers.
Some employer representatives (3 out of 11) also reported that they often receive notice of legislative changes too late to prepare, reflecting broader issues with consultation processes that occur too late or are poorly designed. They emphasized that earlier and more meaningful engagement with employers and unions could improve implementation and lead to better outcomes. Furthermore, they noted that many employers are unaware of subscription options.
"Our sense of it is that there is limited filtering down of Labour Program information to the employee level."
"Without a very large campaign to try and make people aware of these changes... it would be very difficult to find the information and keep awareness."
"I think we have to position ourselves in places where newcomers gather or sites within the internet or organizations that assist them."
Furthermore, some employer representatives (3 out of 11) and program officials (2 out of 10) noted that the Labour Standards website and other online tools, while useful, are poorly structured, difficult to navigate, and not updated in a timely manner.
Some key informants (8 out of 27), including employee and employer representatives and program officials, also indicated that the Program lacks inclusive materials, with language and cultural barriers particularly affecting immigrants and temporary foreign workers. Suggestions included offering clearer language, alternative formats, and multilingual resources to improve accessibility and engagement.
"The problem is you need to go searching for it in order to get it. The information is not particularly accessible, and it's not something people stumble upon."
"I think there's a gap definitely there in how we share information. I think there's also a gap in not offering other options in terms of languages and also in terms of accessibility."
Awareness of labour standards is limited among employees who interact with the Program.
Results from surveys reveal that employee awareness of labour standards remains limited, particularly for newer protections. Only some employees (49%) rated their overall level of awareness of labour standards as excellent or good.
Awareness was highest for core, pre-2016 standards such as wage payment and paid holidays (60-68%), but significantly lower for newer standards like flexible work arrangements (25%), the right to refuse overtime for family obligations (22%), misclassification protections (19%), and intern protections (12%) (Table 20). Overall awareness of labour standards was slightly higher among unionized workers (41% vs. 34% for non-unionized) and Canadian citizens (37% vs 30% for non-citizens).
| Labour Standards | Percent |
|---|---|
| Payment of Wages and Overtime: Overtime pays at a minimum rate of 1.5 times the regular hourly wage | 68.0 |
| Holidays: 10 paid general holidays | 67.4 |
| Termination of Employment: At least two weeks' written notice or pay for termination of employment by employer, excluding termination for cause | 61.1 |
| Minimum Wage: Increased to $15 in 2021; $15.55 in 2022; and to $16.65 in 2023 | 60.4 |
| Vacation: 3 weeks of vacation (equivalent of 6% of earnings) after 5 consecutive years of employment with the same employer (effective since September 1, 2019) | 59.4 |
| Hours of Work: Provide a work schedule in writing at least 96 hours before the start of the first work period or shift under that schedule (effective since September 1,2019) | 54.4 |
| Severance Pay: Minimum severance pay is 5 days' wages for employees who have completed at least 12 months of continuous employment | 44.4 |
| Medical Leave: Up to 10 days of paid medical leave (effective since December 1, 2022) | 43.7 |
| General Employment Rights: Right to leave for court or jury duty (effective since September 1, 2019) | 42.0 |
| Personal Leave: 5 days of personal leave each calendar year, with the first 3 days paid after 3 consecutive months of continuous employment (effective since September 1, 2019) | 41.7 |
| Parental Leave: Up to 63 weeks of parental leave (effective since December 3, 2017) | 37.6 |
| General Employment Rights: Right to refuse and not disclose genetic testing results (effective since May 4, 2017) | 29.1 |
| Flexible Work Arrangement: Right to request flexible work arrangements (effective since September 1, 2019) | 25.0 |
| Flexible Work Arrangement and Family-Related Rights: Right to refuse overtime for family obligations (effective since September 1, 2019) | 21.7 |
| Other Leaves: Leave for Aboriginal practices (effective since September 1, 2019) | 19.4 |
| Misclassification: Employers are prohibited from treating employees as though they are not employees (for example, classifying an employee as an independent contractor) (effective since January 1, 2021) | 19.4 |
| Internship: When an internship is not a requirement of an educational program, the intern is entitled to all protections under Part III (effective since September 1, 2020) | 12.2 |
| None of the above | 6.5 |
- Source: 2025 Evaluation survey of employees who filed a complaint or asked for information
The use of program administrative data for strategic enforcement
Finding 7
The Program collects extensive data and reports on a broad range of indicators. However, data gaps, limited analytical capacity, and weak integration of internal data to inform operational and program decisions limit the effective use of administrative data for enforcement.
Centralization of data systems and indicator tracking
The Labour Program has modernized its data infrastructure through the implementation of the Integrated Labour System (ILS), replacing the LA2000 system in June 2022Footnote 21. ILS centralizes data for core functions such as complaint intake, inspections, and enforcement actions.
The review of the Program documentation and administrative data confirms that the system supports extensive data collection and reporting of various indicators. These include useful metrics to assess the volume, timeliness, and effectiveness of Program activities, such as:
- the total number of hours dedicated to proactive and reactive activities
- the average time required to finalize complaints covering monetary, non-monetary, and unjust dismissal cases
- the percentage of cases finalized within 180 days
- the amounts of monies assessed and collected
ILS records data that enable the analysis of the number of founded contraventions per year and their distribution per type, and to some extent, allegation subject matter, which is key to assessing the achievement of the Program outcomes.
Persistent data gaps and limited analytical capacity
Despite the implementation of a new centralized system, data gaps remain. The Program does not collect unique identifiers on complainants nor sociodemographic data, which restricts its ability to integrate Program administrative data with complementary datasets (for example, tax data) to conduct more refined analysis or perform Gender-Based Analysis Plus (GBA+) with an intersectional lens. The lack of demographic data limits the examination of impacted employees.
The transition from the former operating system LA2000 to the Integrated Labour System (ILS) in June 2022 disrupted data continuity, particularly in the reporting of enforcement actions. Under LA2000, all enforcement actions related to a contravention were systematically recorded.
However, in ILS, and at the time of analysis, not all actions or measures taken in response to non-compliance were consistently captured. This gap significantly limits the Program's ability to assess the effectiveness of its enforcement efforts since 2021-2022.
Furthermore, the Program does not collect data on the outcomes of enforcement in cases involving non-monetary contraventions. As a result, it is currently not possible to report on the proportion of employers who achieve compliance with the Code or regulations following enforcement, with respect to non-monetary contraventions.
The review of administrative data also revealed several other limitations. Many variables contained a significant number of missing values, which reduces the accuracy of both disaggregated analysis and trend analysis.
For example, the variable related to the subject matter of allegations and contraventions requires better quality controls, as more precise reporting on the standards breached would strengthen the Program's capacity to identify systemic issues and recurring patterns.
Some program officials (2 out of 7) also observed that key data points, such as contravention severity and client interaction frequency, are not tracked or linked to performance measures, limiting strategic planning and outcome assessment.
Additionally, promotional and outreach activities are not fully recorded in ILS, and identifiers for participating employers are inconsistently captured. As a result, available data does not enable an assessment of the reach and overall impact of these activities.
Some program officials (2 out of 3) who were asked data related questions, and few employee representatives interviewed (2 out of 11) also noted that reporting on proactive activities and enforcement actions is limited.
Finally, a few program officials (2 out of 15) and an employer representative highlighted the absence of a complete employer database as a major obstacle to effective outreach and communication.
Usability and integration challenges in data systems
System usability and integration issues further hinder effective data use; half of program officials interviewed (4 out of 8) described ILS as difficult to use, citing problems such as inconsistent data entry, missing fields, and limited automation. Some program officials (2 out of 8) reported uncertainty about how data informs policy and noted limited collaboration between enforcement and data teams.
Fragmented systems, such as separate Administrative Monetary Penalties (AMPs) modules in ILS, were also flagged as barriers to integrated analysis and evidence-based decision-making. AMPs cases are integrated into ILS in a separate module which is not linked to complaint cases, which limits ability to derive broader enforcement trends.
Recommendations
Based on these findings, the evaluation puts forward the following recommendations and observations:
Recommendation 1: Recognizing the program's operational context, continue to advance efforts to improve timeliness in complaint resolution and reduce complaint backlogs.
Linked to Findings 2 and 4: complaints received for labour standards increased significantly in recent years (2022-2023 and 2023-2024) following numerous amendments to the Code and changes to regulations that expanded leaves and protections for employees under federal jurisdiction. The number of employees in the road transportation sector also expanded between 2016-2017 and 2023-2024 (+22% or 30,000 workers). Historically, this sector accounts for most of the complaints received.
The Program has consistently fallen short of meeting its service standards for resolving complaints. In both 2022-2023 and 2023-2024, over 20% to 30% of complaints remained unresolved, contributing to a growing backlog. In the interviews, program officials also noted that staffing levels did not keep pace with demand and that high attrition created substantial training gaps, further slowing case processing. External disruptions, such as the COVID-19 pandemic and public service strikes, added further strain on the Program's ability to resolve complaints in a timely and consistent manner.
The Program is encouraged to explore practical and sustainable solutions to improve the timeliness of complaint resolution and address the growing backlog. These efforts should be informed by the Program's current operational context, evolving mandate, and priorities.
Recommendation 2: Explore ways to enhance data integration within the operating system and analytical capacity to better support evidence-based planning, effectively monitor compliance outcomes and to enable analysis of impacted employees where possible.
Linked to Finding 7: The Program collects extensive data but faces limitations due to gaps, low data quality for some key variables, fragmentation across modules within the Integrated Labour System (ILS), and underused analytical tools. For example, the Program does not collect demographic information, which makes it hard to assess impacts on different groups of employees.
Data on penalties (AMPs) are stored in a separate module from complaints with no unique key to link these modules, and outreach activities are only partly recorded. Half of program officials interviewed (4 out of 8) find the system (ILS) difficult to use and reported not having the training needed to make full use of analysis tools.
To address this, the Program should enhance its data systems by integrating fragmented data modules (for example, AMPs and complaints), improving the usability of the Integrated Labour System and undertaking the collection of sociodemographic information of employees.
Recommendation 3: Refine targeting and resource allocation to high-risk sectors to improve the reach and impact of proactive inspections and outreach activities.
Linked to Findings 2 and 5: The Program has expanded its proactive activities, but resources are not always directed where they are most needed. For instance, the road transportation sector accounts for nearly 90% of contraventions yet receives about 40% of proactive activities hours, while sectors with low contraventions rates, such as air transport receive a relatively larger share of proactive activities.
At the same time, proactive inspections are detecting fewer contraventions, declining from about 7% in 2016-17 to just 2% of proactive inspections in 2023-2024, highlighting the need for more refined targeting and further prioritization of the road transportation sector.
Observation
There is an opportunity to revisit how new enforcement measures, such as Administrative Monetary Penalties (AMPs) and compliance orders, are applied by program officials to enhance the Program's response to non-compliance.
Linked to Finding 3: While it is too early to fully assess the impact of the Administrative Monetary Penalties (AMPs) system and compliance orders introduced in January 2021, evidence suggests that enforcement tools, such as AMPs and compliance orders are rarely applied.
Current enforcement efforts are not keeping pace with rising complaint volumes, recovery rates of assessed amounts are declining, and repeat non-compliance remains high (28% of employers repeat monetary contravention(s) they have had within the past three years.) Program officials identified several barriers to applying these tools, including complex procedural requirements, multiple approval steps, and rigid prerequisites.
Annexes
Annex A: The Program logic model
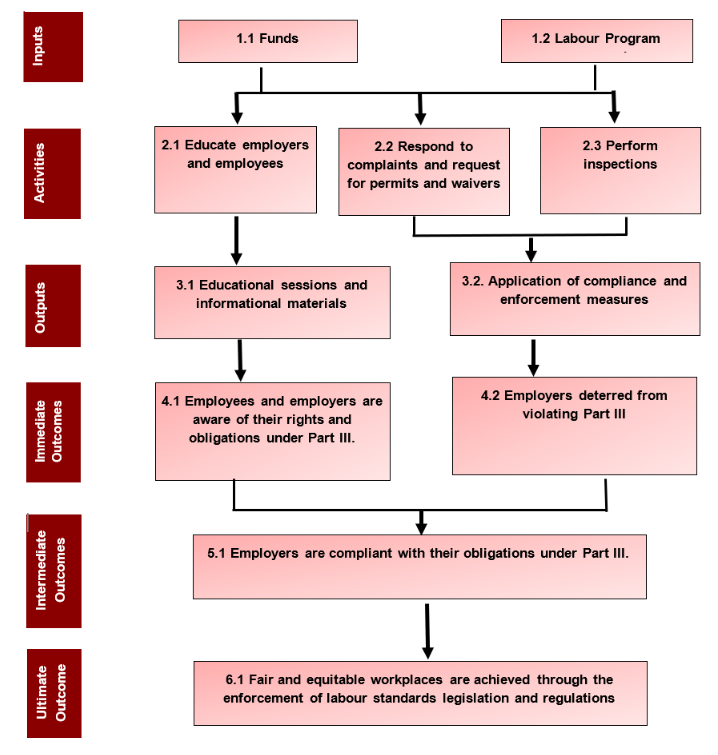
Text description for Annex A
Inputs: Funds and Labour Program
- Contribute to the following activities:
- Educate employers and employees
- Respond to complaints and requests for permits and waivers
- Perform inspections
Activity: Educate employers and employees
- Produces the following output:
- Educational sessions and informational materials
- Contributes to the following immediate outcome:
- Employees and employers are aware of their rights and obligations under Part III
- Contributes to the following immediate outcome:
- Educational sessions and informational materials
Activity: Respond to complaints and requests for permits and waivers
- Produces the following output:
- Application of compliance and enforcement measures
- Contributes to the following immediate outcome:
- Employers are deterred from violating Part III
- Contributes to the following immediate outcome:
- Application of compliance and enforcement measures
Activity: Perform inspections
- Produces the following output:
- Application of compliance and enforcement measures
- Contributes to the following immediate outcome:
- Employers are deterred from violating Part III
- Contributes to the following immediate outcome:
- Application of compliance and enforcement measures
Immediate outcomes:
- Employees and employers are aware of their rights and obligations under Part III
- Employers are deterred from violating Part III
- Contribute to the following intermediate outcome:
- Employers are compliant with their obligations under Part III
- Contribute to the following intermediate outcome:
Intermediate outcome:
- Employers are compliant with their obligations under Part III
- Contributes to the following ultimate outcome:
- Fair and equitable workplaces are achieved through the enforcement of labour standards legislation and regulations
- Contributes to the following ultimate outcome:
Annex B: Evaluation approach
Evaluation questions
This evaluation focused on the following themes and questions:
Theme: Recent legislative and regulatory changes
1. Did the legislative and regulatory changes implemented since 2016 effectively contribute to supporting fair and equitable workplaces within federal jurisdiction?
Theme: Rights and obligations of employees and employers
2. To what extent did the Program promote awareness and understanding of employers' responsibilities and employees' rights regarding labour standards in the workplace?
Theme: Proactive activities, compliance measures (reactive activities) and the Program's administrative data
3.1 To what extent did proactive activities (versus reactive activities) encourage employers' compliance with the labour standards legislation and regulations?
3.2 How effective were the compliance and enforcement measures in correcting and/or deterring violations of the Code?
3.3 To what extent were the Program's administrative data used effectively to support and target proactive and reactive activities? Are additional data needed?
Theme: Responding to complaints and inquiries
4. To what extent did the Program ensure timely responses and processing of complaints and inquiries, in line with service standards?
Lines of evidence and data collection
Data collection for the evaluation took place between August 2024 and July 2025. The evaluation used five (5) lines of evidence: a literature review, a document review, an administrative data review, key informant interviews, and surveys of employers and employees.
Literature review
The literature review examined academic and grey literature (2016-2024, plus earlier relevant studies) on labour standards legislation, awareness, compliance and enforcement, and complaint resolution in Canada and selected OECD countries, notably Australia. Priority was given to federally regulated industries, with some review of Ontario and Quebec provincial standards. Global insights from the OECD and ILO were also included. Sources were identified through search engines, academic databases, international organization libraries, and AI tools, using keywords aligned with the evaluation questions (for example, flexible work arrangements, misclassification, compliance, and enforcement).
Literature review limitations and challenges
The literature review was limited by the predominance of descriptive rather than impact- or outcomes-oriented studies, which reduced their usefulness in assessing the Program's effectiveness. Significant gaps existed in research on employer awareness, worker rights, and proactive educational activities, while most empirical studies focused on compliance and enforcement of labour standards. At the provincial level, the literature on compliance and enforcement was concentrated mainly on Ontario, with some coverage of Quebec. To address these gaps, findings were triangulated with other lines of evidence to inform the evaluation.
Document review
The document review included over 250 selected program documents produced during the period from April 2016 to March 2024.
Document review limitations and challenges
The document review revealed gaps in documentation and inconsistencies across sources. While most indicators were supported by the program documents, some documents were unavailable or not fully aligned with the evaluation period.
Inconsistencies in program targets and program dashboard calculations further complicated the analysis, highlighting the need for clearer documentation and technical notes to enhance data accuracy and interpretation.
The findings from the document review were integrated and triangulated with other sources and lines of evidence to mitigate these challenges and information gaps.
Administrative data review
The administrative data review focused on complaints, contraventions, and proactive activities, including education and inspections. The data came from the Integrated Labour System (ILS) and the Labour Program 2000 (LA2000) suite of applications.
LA2000 was the former system used to process complaints and conduct assignments and activities for most programs under the Labour Program's portfolio. It was replaced by ILS in June 2022.
The evaluation used a descriptive analysis approach to track trends in complaints, contraventions, and enforcement actions over time, and to align them with the implementation of key reforms. Several performance indicators from the Program's 2018 Performance Information Profile (PIP) were used to assess the extent to which the Program achieved its expected outcomes. The analysis disaggregated data by sector and region to identify persistent compliance challenges and areas for improvement.
Administrative data review limitations and challenges
The administrative data review faced several limitations. Missing values in key variables such as "allegation subject matter" reduced the accuracy of disaggregated analyses. In the sample drawn from the Integrated Labour System (ILS) for 2016-2017 to 2023-2024, many cases were still open in the final year 2023-2024, which prevented the evaluation team from accurately estimating the count of founded contraventions for that fiscal year. The report only discusses founded contraventions in cases that were investigated (2016-2017 to 2021-2022) including those open and awaiting final results in 2022-2023.
The migration from LA2000 to ILS in June 2022 created a major data gap, as all enforcement actions were no longer systematically recorded for each founded contravention, limiting post-2021 trend analysis. In addition, no sociodemographic data or unique identifiers (such as social insurance numbers) are collected, preventing demographic or GBA+ analysis and linking with other datasets. Most descriptive data is captured at the workplace level rather than the organization level, and the absence of business numbers further restricts linkage to other administrative sources.
To address these gaps, the evaluation used different periods of analysis depending on the outcome assessed and the available information and drew on multiple lines of evidence to strengthen the validity of findings.
Key informant interviews
A total of 37 key informant interviews were conducted as planned, including 16 with ESDC Labour Standards Program officials, 20 with employer and employee representatives from associations and unions in federally regulated sectors, and one with a labour expert.
For program officials, information such as role, team, region, and contact details were compiled. For employer and employee representatives, the list included sector, region, role, contact details, and Labour Standards Advisory Committee (LSAC) membership status.
While stakeholders across all sectors were contacted, only representatives from the air, broadcasting, grain handling/milling, marine/longshore, multi-industry, pipeline, and trucking sectors agreed to participate.
Key informant interviews limitations and challenges
The key informant interviews faced challenges, including a low initial response rate (about 10%), incomplete answers from some participants, and limited availability of labour program experts (only one of two planned interviews completed). To improve participation, the evaluation team followed up with non-respondents, identified alternate contacts, requested targeted program outreach, and expanded invitations to the full participant list.
Insights from one expert were integrated into other respondent groups when relevant. To address incomplete responses, each question was asked to at least two informants, and findings were triangulated with other lines of evidence.
Scale used to report the findings
- All/almost all: Findings reflect the views and opinions of 90% or more of the key informants within the group.
- Large majority /most: Findings reflect the views and opinions of at least 75% but less than 90% of key informants within the group.
- Majority: Findings reflect the views and opinions of at least 51% but less than 75% of key informants within the group.
- Half: Findings reflect the views and opinions of 50% of key informants within the group.
- Some: Findings reflect the views and opinions of at least 25% but less than 50% of key informants within the group.
- A few: Findings reflect the views and opinions of at least two respondents but less than 25% of key informants within the group.
- One: Findings reflect the input of a single respondent.
*Note: When reporting interview findings, if perspectives were shared across all three stakeholder groups, employer representatives, employee representatives, and program officials, the results were reported collectively rather than separately. The report presents them in an aggregated format: A few key informants (5 out of 35), including employer and employee associations and program officials, stated that guidance tools are overly legalistic. This approach was adopted to enhance readability, providing a smoother and more coherent presentation of shared perspectives.
- Evaluation surveys of employers and employees
The Evaluation Directorate conducted two electronic surveys, one for employers and one for employees, between May 7 and May 28, 2025, with support from ESDC's Interactive Fact-Finding Service (IFFS). The survey questions included a section on Labour Standards and another one on Occupational Health and Safety.
Populations covered: Employers and employees listed in the administrative datasets
The main samples included individuals and employer representatives from the Labour Program's administrative data systems who had prior interactions with the Program (for example, complaints, inspections, inquiries, and education sessions). An attempt to reach employees with no prior contact via Labour Standards Advisory Committee (LSAC) representatives (10 organizations) yielded only 26 responses, 77% from Ontario's radio and television broadcasting sector, so this group was excluded from the analysis.
Surveys limitations and challenges
The surveys faced selection bias as they mainly reached federally regulated employers and employees who had prior interactions with the Labour Program, excluding those without valid email addresses or digital access. Non-response bias was also significant: 10% of invitations bounced back and only 2% of valid recipients responded (595 out of 27,408), limiting representativeness.
Despite these limitations, the surveys provided valuable insights across a broad range of federally regulated sectors and enabled collection of some information from several underrepresented groups. In addition to multiple-choice questions, the surveys included numerous open-text boxes under individual questions and at the end of the survey. These allowed participants to share detailed insights on the Program, generating qualitative information that complemented the quantitative results. Both qualitative and quantitative data were analyzed, reported, and integrated into the findings.
A total of 460 employees responded to the survey, with the largest group from road transportation (28%), followed by banking (8.7%), air transportation (8.5), First Nations band councils (7.4%), and telecommunications (7.4%). Respondents were geographically diverse, with most based in Ontario (36%), Quebec (25%), and the central provinces (22%), and the majority worked in urban areas (84%). The survey also reflected diversity of immigration status, education levels, union membership, and gender identity, with 91% Canadian citizens, 29% holding college diplomas, and 64% identifying as male.
A total of 135 employers participated in the survey, with the largest share (42%) from the road transportation sector, followed by air transportation (14%) and smaller representations from broadcasting, marine services, grain facilities, and telecommunications. Most employer respondents were headquartered in the central provinces (25%), Ontario (22%), and Quebec (18%), and the majority (78%) represented small businesses with fewer than 100 employees.
Evidence from the surveys were triangulated with the other lines of evidence and complemented with results from the 2022 Survey of Employees under Federal Jurisdiction conducted by Statistics Canada.
Annex C: List of industries that are subject to Part III of the Code
- Air transportation, including airlines, airports, aerodromes, and aircraft operations
- Banks, including authorized foreign banks
- Grain elevators, feed and seed mills, feed warehouses, and grain-seed cleaning plants
- First nations band councils (including certain community services on reserve)
- Most federal crown corporations, for example, Canada Post Corporation
- Port services, marine shipping, ferries, tunnels, canals, bridges, and pipelines (oil and gas) that cross international or provincial borders
- Radio and television broadcasting
- Railways that cross provincial or international borders and some short-line railways
- Road transportation services, including trucks and buses, that cross provincial or international borders
- Telecommunications, for example, telephone, internet, telegraph, and cable systems
- Uranium mining and processing and atomic energy
- Any business that is vital, essential, or integral to the operation of one of the above activities
Exclusion from federally regulated industries
- The federal public service
- Employees of parliament
- The Royal Canadian Mounted Police
Additionally, Division I of Part III does not apply to managers and regulated professionals (such as architectural, dental, engineering, legal, or medical professionals). There are also several other regulatory exemptions and exceptions to specific hours of work provisions, as well as exemptions applicable to other divisions of Part III, for example, managers are also exempt from unjust dismissal provisions.
Annex D: Compliance and enforcement actions
- Assurance of voluntary compliance: An employer's written commitment to a Labour Affairs Officer that they will correct one or more monetary or non-monetary contraventions of Part III of the Canada Labour Code within a specified period.
- Letter of determination: A formal written request that the employer correct the non-compliance situation. For example, the Labour Program may ask the employer to pay wages or other amounts owing immediately, or to implement appropriate workplace policies and practices. The letter of determination has been replaced with letter of evaluation.
- Letter of evaluation: Replaced "Letter of determination", serving as a written notice to inform the employer of the Labour Affairs Officer's findings that a contravention or contraventions of the Canada Labour Code have occurred, and to request that the employer either correct the contravention(s) or, if they disagree with the findings, provide any new information/documents to support their position.
- Payment order: When an employer refuses to voluntarily comply, a Labour Affairs Officer may issue a written payment order to the employer or the director(s) of the corporation. The Labour Program will add an administrative fee to the amount owed in this payment order. A payment order may be filed in the Federal Court of Canada to ensure it is enforceable as a judgment of that court.
- Collecting money: If the employer or director of the corporation does not pay a payment order, the Labour Program may collect the amounts owed from:
- the employer's debtors,
- financial institution, or
- the debtors or financial institution of one or more directors of the corporation.
- Filing in Federal Court: The Labour Program may file a payment order and a notice of contravention in Federal Court to ensure that it is enforceable as a judgment of that court. The Labour Program may also publish information on the Government of Canada website concerning an employer to whom a payment order or notice of contravention has been issued
- Compliance order: As of January 1, 2021, the Labour Program may issue a compliance order to stop non-compliance. This order prevents reoccurrence of any contravention of the Code and its regulations, including a contravention related to an 'excess hours' permit
- Administrative monetary penalty: As of January 1, 2021, the Labour Program may issue a notice of contravention with an Administrative monetary penalty (AMP). AMPs are financial penalties under Part IV of the Code that can be imposed for contraventions of labour standards (Part III of the Code) and occupational health and safety measures (Part II of the Code). These penalties are categorized by severity and scaled based on the size of the business and history of non-compliance, ranging from a few hundred to tens of thousands of dollars. AMPs are designed to promote compliance without resorting to prosecution and can be reviewed or appealed by the employer. While notices of contravention (used to impose AMPs) are generally issued as a last resort, this is a matter of practice rather than a legislative requirement, and more serious contraventions may lead to immediate AMPs.
- Prosecution: A prosecution may be undertaken against any person, including an employer, that contravenes any provision of Part III of the Canada Labour Code or its regulations, that contravenes any order made under Part III, or that engages in prohibited conduct (for example, terminating the employment of a person who has testified in a proceeding taken under Part III). The Minister of Labour's consent is required before any prosecution can be instituted under Part III of the Canada Labour Code. Undertaking prosecution precludes issuing an AMP with respect to the same contravention, and vice versa.
If found guilty, a corporation may be subject to the following fines:
- $50,000 for the first offence
- $100,000 for the second offence, and
- $250,000 for the third (and subsequent) offences.
An employer who is not incorporated may be liable to a fine of up to:
- $10,000 for the first offence
- $20,000 for the second offence, and
- $50,000 for the third (and subsequent) offences.
- Public naming: The Labour Program will publish information about employers who violate the Code, including:
- all payment orders of $5000 or greater filed in Federal Court
- administrative monetary penalties (some exceptions apply for category "A" violations) and prosecutions.
Annex E: Compliance and enforcement actions
Legislative changes
Genetic anti-discrimination measures
- Genetic Non-Discrimination Act (S-201) - May 4, 2017
Granted individuals the right to refuse genetic testing and to not disclose genetic test results. Employers are also prohibited from penalizing an employee based on the results of a genetic test.
Flexible work arrangements and modernized labour standards
- Budget Implementation Act, 2017, No. 2 (Bill C-63) - Sep 1, 2019
Introduced the right to request flexible work arrangements and to refuse overtime for family responsibilities; enhanced bereavement leave and added leave for victims of family violence, personal leave, leave for traditional Aboriginal practices, and time off in lieu of overtime; provided more flexibility for individual modified work schedules, holiday substitution and annual vacations. - Budget Implementation Act, 2018, No. 2 (Bill C-86) - September 1, 2019
Introduced 30-minute breaks, nursing breaks, breaks for medical reasons, 96 hours' notice of shift schedules, eight-hour rest between shifts and maintenance of continuity of service in case of contract retendering or transfers of jurisdiction.
Leave provisions
- Budget Implementation Act, 2017, No. 1 (Bill C-44) - Dec 3, 2017
Extended parental leave from 37 to 63 weeks, introduced earlier maternity leave access, and added new unpaid leave for critically ill adults and children. - Budget Implementation Act, 2018, No. 2 (Bill C-86) - Mar 17, 2019, and September 1, 2019
Increased the amount of parental leave when shared between parents; enhanced annual vacation entitlements after five and ten years of service; removed or reduced length of service requirements to qualify for leaves and general holidays; added new leave for court or jury duty; broadened the scope of medical leave to cover organ donations and medical appointments. - Budget Implementation Act, 2021, No. 1 (Bill C-30) - Jun 29, 2021
Extended leave for parents of missing or deceased children under 25 years from 52 to 104 weeks. - Budget Implementation Act, 2021, No. 1 (Bill C-30) - Dec 18, 2022
Increased the maximum length of unpaid medical leave from 17 to 27 weeks. - An Act to amend the Canada Labour Code (National Day for Truth and Reconciliation) (Bill C-5) - Aug 3, 2021
Created a new general holiday on September 30 for National Day for Truth and Reconciliation. - An Act to amend the Canada Labour Code (Bereavement Leave) (Bill C-220) - Sep 29, 2021
Increased the maximum duration of bereavement leave from 5 to 10 days and expanded eligibility. - An Act to amend the Criminal Code and the Canada Labour Code (Bill C-3) - Dec 1, 2022
Introduced up to 10 days of paid medical leave per year. - Budget Implementation Act, 2022, No. 1 (Bill C-19) - Jun 23, 2022
Amended paid medical leave provisions. - Budget Implementation Act, 2023, No. 1 (Bill C-47) - Jun 22, 2023
Extended leave related to death/disappearance of a child due to a crime to 156 weeks.
Compliance and enforcement
- Budget Implementation Act, 2017, No. 1 (Bill C-44) - April 1, 2019
Introduced new enforcement tools such as administrative fees on payment orders, orders to debtors of directors and internal audit orders; clarified complaints handling and wage recovery processes and expanded the inspectorate's power to determine wages due. - Bill C-44 - Jul 29, 2019
Transferred adjudicative functions under the Canada Labour Code to the Canada Industrial Relations Board (CIRB) and added new recourse against reprisals. - Bill C-44 - Jan 1, 2021
Implemented the administrative monetary penalty (AMP) system, authorized public naming of non-compliant employers and added power to issue compliance orders; transferred compliance and enforcement powers, duties and functions under Part II and Part III of the Canada Labour Code to a new Head of Compliance and Enforcement; added prohibition on misclassification of employees.
Interns and work-Integrated learning
- Economic Action Plan 2015 Act, No. 1 (Bill C-59) (Amended by Bill C-63) - Sep 1, 2020
Limited unpaid internships to those required by an educational program, ensured unpaid interns receive labour standards protections.
Youth employment protections
- Budget Implementation Act, 2018, No. 2 (Bill C-86) - Jun 12, 2023
Extended the application of minimum age of employment requirements under the Code to employees under the age of 18 (previously 17), effectively raising the age at which employees are permitted to engage in hazardous work.
Pandemic responses
- COVID-19 Emergency Response Act (Bill C-13) - Mar 25, 2020
Introduced a temporary COVID-19 leave of up to 16 weeks (later extended to 28 weeks); added a new 16-week quarantine leave (later merged with medical leave); temporarily removed medical certificate requirements for medical leave. - COVID-19 Response Measures Act (Bill C-4) - Oct 2, 2020
Replaced the previous leave related to COVID-19, providing up to two weeks of leave for personal sickness or quarantine and a 26-week caregiving leave for COVID-19-related absences. - An Act to provide further support in response to COVID-19 (Bill C-2) - December 17, 2021
Reintroduced new leave related to COVID-19 and increased maximum duration of leave to 6 weeks (illness) and 44 weeks (caregiving).
Regulatory changes
Flexible work arrangements and hours of work
- Exemptions from and modifications to hours of work provisions regulations - Feb 1, 2022
Provided exemptions and special rules with respect to break/rest requirements and shift notice for certain classes of employees in the road transportation, postal and courier, marine and grain sectors. - Air, rail, banking, broadcasting, telecom hours of work modifications - Jan 4, 2024
Modified the application of certain work-hour provisions for sector-specific employees, including exemptions for particular classes of workers. Note: For the air transportation sector, the regulations came into force 10 months after their registration.
Compliance and enforcement
- Regulations Amending Certain Regulations Made Under the Canada Labour Code (SOR/ 2021-118)- Jul 1, 2021
Amended several regulations under Part II and Part III of the Code to reflect the transfer of responsibilities to the Head of Compliance and Enforcement. - Regulations Amending Certain Regulations Made Under the Canada Labour Code (SOR/2022-41) - Mar 4, 2022
Amended various regulations to support the implementation of legislative amendments enacted by Bill C-63 and Bill C-86, including record-keeping requirements and rules surrounding deadline extensions for the filing of complaints.
Interns and work-integrated learning
- Standards for Work-Integrated Learning Activities Regulations (SOR/2020-166) - Sep 1, 2020
Specified labour standards protections applicable to student interns and clarified conditions under which an internship may be unpaid.
Youth employment protections
- Regulations Amending the Canada Labour Standards Regulations (Employees Under 18 Years of Age) (SOR/2023-40) - Jun 12, 2023
Amended the Canada Labour Standards Regulations to raise minimum age requirements, thus restricting hazardous work and night work for all employees under the ago of 18 (compared to 17 previously).
Employment conditions and benefits
- Regulations Amending Certain Regulations Made Under the Canada Labour Code (SOR/2023-79); - Jul 9, 2023
Added new provisions to the Canada Labour Standards Regulations related to employment statements and the reimbursement of work-related expenses.
Pandemic responses
- Extension of temporary layoff periods - Jun 22, 2020
Amendments related to extending the maximum period employees could be temporarily laid off without triggering termination.
Objective: Prevent automatic job termination due to COVID-19 layoffs. - Further increase to temporary lay-off periods that are deemed not to be a termination of employment - Nov 9, 2020
- Extended COVID-19 leave duration - Mar 15, 2021
Increased the maximum number of weeks of benefits by 12 weeks, up to a maximum entitlement of 38 weeks for Canada Recovery Benefit (CRB) and Canada Recovery Caregiving Benefit (CRCB) recipients.
Annex F: The Canada Industrial Relations Board (CIRB)
- Since July 29, 2019, the Canada Industrial Relations Board (CIRB), an independent representational, quasi-judicial tribunal, is responsible for the interpretation and administration of certain sections of Part III of the Canada Labour Code. As part of its expanded mandate, the CIRB is responsible for mediating and adjudicating the following:
- unjust dismissal complaints from employees who are not covered by a collective agreement
- wage recovery appeals where an employer or an employee disagrees with a specific decision (such as notices of unfounded complaint and notices of voluntary compliance where the employer has voluntarily paid the assessed amount), or a payment order issued by a Labour Affairs Officer
- reprisal complaints where an employee believes their employer retaliated against them for exercising their rights under Part III of the Canada Labour Code.