
Evaluation of Pathways to Education, final report
On this page
- Executive summary
- Management response
- 1. Introduction
- 2. Evaluation strategy
- 3. Findings: relevance, effectiveness, and efficiency
- 4. Lessons learned and conclusions
- Appendix A: Pathways logic model
- Appendix B: net social cost-benefit analysis
- Appendix C: lifetime earnings assumptions for the net social cost-benefit analysis
Alternate formats

Evaluation of Pathways to Education, final report [PDF - 1.4 KB]
Large print, braille, MP3 (audio), e-text and DAISY formats are available on demand by ordering online or calling 1 800 O-Canada (1-800-622-6232). If you use a teletypewriter (TTY), call 1-800-926-9105.
Executive summary
This report presents the findings and conclusions of Pathways to Education Canada, in accordance with the Financial Administration Act and Treasury Board's Policy on Results requirements.
The program
Pathways to Education is a charitable organization that provides after-school programming to help at-risk youth in low-income communities graduate from high school and successfully transition into post-secondary education or training. Currently there are 20 sites providing services to over 5,000 students across Canada. Pathways to Education collaborates in partnership with governments, community partners, schools, school boards and hundreds of diverse volunteers to break the cycle of poverty through education and by enabling strategic, long-term social change.
Pathways to Education funding comes from various sources, including a named grant of $31 million to Pathways to Education between 2014 to 2015 and 2017 to 2018 from Employment and Social Development Canada.
Findings
The evaluation found that:
- Pathways to Education programming addresses a demonstrable need by providing support to disadvantaged youth to complete their education, transition to a successful future and better reach their potential.
- Pathways to Education contributed to increased enrollment to post-secondary education among participants.
- Adapted programming in Winnipeg positively affected Indigenous youth.
- Pathways to Education had a direct positive effect on high school graduation rates, enrollment to post-secondary education and educational attainment.
- The program also positively affected eligible participant's labour market outcomes.
Moreover, the evaluation determined that Pathways to Education programming has a net positive social return on investment. Using the incremental impacts for Pathways-eligible students from 1 location (Regent Park) over a comparable population of students at locations not served by Pathways to Education programming as a proxy, the total net social benefit (to both individual participants and to governments) of an intervention for a single student represented a return on investment of approximately 50% over 25 years. Based on this analysis, an investment in the program “breaks even” (where the benefits equal the costs) after 22.5 years from a government perspective and after 20.8 years from a total social net benefit perspective.
Lessons learned and conclusions
The evaluation derived 3 key lessons learned applicable not just to the Pathways to Education program, but also other similar programming:
- Targeted early interventions positively affect vulnerable populations.
- A key component of the success of the Pathways to Education model is the flexibility to adapt to local needs and conditions.
- Early interventions with vulnerable populations can generate long-term net benefits not just for individuals but also for governments.
As such, the evaluation determined that programming of this nature—designed to support early interventions to help vulnerable youth complete high school—has a valuable role to play.
Management response
Every year too many young Canadians drop out of high school because they lack access to the basic supports needed to succeed in school. Youth who drop-out of school are more likely to hold low-paying precarious jobs as the number of jobs requiring post-secondary education is increasing and those with limited education face greater risk of unemployment.
In addition to helping make post-secondary education more affordable for students from low- and middle-income families through savings incentives, grants and loans, Employment and Social Development Canada has invested nearly $55 million in Pathways to Education Canada (Pathways) since 2010. Pathways is a community-based not-for-profit organization that provides youth in low-income communities a suite of after-school programming, including tutoring, mentoring, and financial incentives to help them complete high school and transition to post-secondary education. Budget 2017 committed to renew the Government's support for Pathways to Education Canada by providing $38 million over 4 years, starting in 2018 to 2019.
An evaluation was recently conducted by the Strategic and Service Policy Branch's Evaluation Directorate in order to assess whether Pathways was achieving the intended outcomes of improving rates of high school graduation and increasing successful transitions to post-secondary education and the labour market. The Learning Branch is pleased with the conclusions of this evaluation report, which reinforces the importance of the Government of Canada's investment in Pathways. The report confirmed that Pathways to Education Canada responds to the needs of underrepresented learners and generates desired outcomes.
Learning Branch's response to key findings and lessons learned from the report are included below.
Finding 1: Overall, Pathways programming is contributing to a demonstrable need by providing support to disadvantaged youth in order to complete their education, transition to a successful future and better their potential
Learning Branch is pleased that Pathways' work to address the educational barriers that disadvantaged youth are facing was recognized in the evaluation. Their model, which is based on various types of supports (i.e., academic, social, financial and one-on-one mentoring), contributes to a more equitable participation of Canadians in post-secondary education.
Finding 2: Pathways programming contributed to increased enrollment to post-secondary education
Learning Branch is pleased that Pathways' impact on enrollment to post-secondary education is highlighted by this report. Given an on-time high school graduation rate of 79%, and a cumulative rate (since the launch of the program) of 73% of Pathways graduates successfully transitioning to post-secondary education, it can be inferred that the overall post-secondary education participation rate for Pathways participants is approximately 58%. By way of comparison, a recent report by Statistics Canada indicates that approximately 47% of 19 year olds in the lowest income quintile and approximately 57% of 19 year olds in the second-lowest income quintile participated in post-secondary education in 2015. Footnote 1
Finding 3: Adapted programming in Winnipeg positively affected Indigenous youth
Learning Branch agrees with this finding and recognizes the importance of offering culturally adapted programming to Indigenous students. Other Pathways' sites that also serve large proportions of Indigenous youth have been able to tailor their program as well, for example offering to middle school students to meet the needs of the community (e.g., Mashteuiatsh, Quebec).
Finding 4: Pathways positively affected high school graduation rates
Learning Branch recognizes the positive impact of Pathways on high school graduation rates. This success was demonstrated through the tracking of on-time graduation rates before and after the introduction of Pathways in the community. The introduction of the Pathways program has correlated with a significant change in graduation in some communities post-Pathways (e.g. in Kingston, Ontario, the rate of on-time graduation increased from 40% before the program was introduced to 79% for the 2015 to 2016 school yearFootnote 2). In fact, an average of 79% of all Pathways' participants complete high school on time.
Finding 5: Pathways had a positive effect on enrollment to post-secondary education and educational attainment
Learning Branch is pleased with the findings of the evaluation which used research commissioned by the Learning Branch to demonstrate Pathways' impact on educational attainment in Regent Park. Since the study that was originally conducted by Drs. Lavecchia and Oreopoulos, more time has passed and additional data is available making it timely to confirm the positive impact of Pathways on participants go beyond its initial site in Regent Park. As such, Learning Branch plans to commission additional research that would examine the impact of Pathways at 2 of its expansion sites in Toronto (Rexdale and Lawrence Heights). This research would also explore the data feasibility of the impact of Pathways on social outcomes such as reducing health inequality and crime as well as examining the feasibility of studying expansion sites outside of Toronto. The Rexdale and Lawrence Heights sites were selected because the maturity of their program would allow for a better longitudinal view of outcomes of Pathways participants. Having both opened in 2007, the first cohort of students from these sites would now be approximately 24 years old.
Finding 6: Pathways positively affected labour market outcomes
As noted in finding #5, a small sample was used to consider Pathways' impacts on labour market outcomes. However, given that the first expansion sites (Lawrence Heights and Rexdale) are now at an appropriate age of maturation, Learning Branch plans to pursue additional research to examine other sites to broaden the sample size and expand on research available on Pathways' impact on labour market outcomes for students.
Lesson learned 1: Targeted early interventions can positively affect vulnerable populations
Learning Branch welcomes the first lesson learned through the evaluation. Early interventions have proven to be a successful means to increase academic success and improve labour market outcomes for underrepresented populations. While the Pathways model has proven to be particularly effective, the organization continues to be very intentional in its growth. Their model requires extensive community engagement and takes an average of 2 to 3 years to open a new site. With 20 sites currently in operation, mostly in larger urban areas, both Learning Branch and the organization recognize that there are still many communities that could benefit from Pathways-like supports. In order to increase capacity, Employment and Social Development Canada will explore with Pathways and other organizations ways to address this gap and provide similar opportunities to underrepresented youth who do not have access to Pathways' programming including youth in rural, remote, and Indigenous communities.
Lesson learned 2: A key component of the success of the Pathways model is the flexibility to adapt to local needs and conditions
Learning Branch agrees with this finding. The flexibility and decentralized nature of the Pathways model is critical to allowing the program to be easily adapted to account for regional diversity and provide culturally relevant content for students. Most importantly, the Pathways model is student centered focusing on students' needs and is delivered by local, trusted community partners.
Lesson learned 3: Early interventions with vulnerable populations can generate long-term benefits not just for individuals but also for governments
As the evaluation found and consistent with research produced by Drs. Levecchia, Oreopoulos and Brown, it is clear that early learning interventions with underrepresented populations can generate long-term benefits at both the individual and societal levels. Additional research including validation of the results of the aforementioned study by expanding the sample to additional sites in Lawrence Heights and Rexdale and studying additional factors by including crime and health data, will further enhance our understanding of the long-term benefits of Pathways.
1. Introduction
This report presents the findings and conclusions of the 2018 Evaluation of Pathways to Education Canada (Pathways). Pathways is a charitable organization that works with at-risk youth to improve their educational outcomes. Employment and Social Development Canada (the Department) provides funding to Pathways for after-school programming through a named grant.
In accordance with the Financial Administration Act and Treasury Board's Policy on Results, the Department is required to evaluate Pathways by March 31, 2019. The evaluation examines issues of relevance and performance, including:
- The extent to which it assisted Pathways-eligible students to improve their high school graduation rates
- Increased the number of Pathways-eligible students entering post-secondary education
- Whether participating in Pathways improved labour market outcomes
This report contains the following:
- A description of Pathways, including their mandate, objectives, components and resources (Section 2)
- Evaluation strategy, including the scope, methodology and limitations (Section 3)
- Key findings (Section 4), including outcomes, impacts and a cost/benefit analysis; and,
- Conclusions and lesson learned (Section 5)
The report appendices include the logic model (Appendix A) and the net social cost-benefit analysis (Appendix B) and an explanation of the earnings assumptions made to support the net social cost-benefit analysis (Appendix C).
1.1 Pathways: program objectives
Program description
Pathways is a charitable organization founded in 2001 that provides comprehensive after-school programming to help at-risk youth in low-income communities graduate from high school and successfully transition into post-secondary education or training.
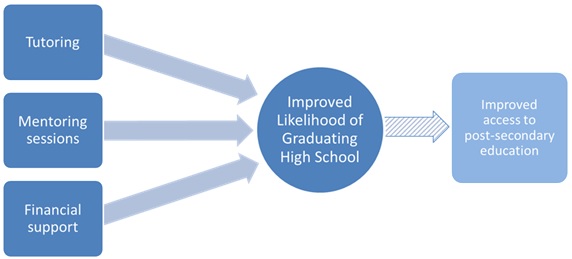
Figure 1: Pathways components – Text version
Pathways consists of 3 elements: Tutoring, Mentoring sessions, and Financial support. Combined, these 3 components lead directly to Improved Likelihood of Graduating High School, which flows, into Improved access to post-secondary education.
Pathways collaborates in partnership with governments, community partners, schools, school boards, and hundreds of diverse volunteers. Working with these partners, Pathways aims to help “break the cycle of poverty through education and enable strategic, long-term social change” (retrieved from Pathways).
It operates within the community alongside the school system and provides after-school tutoring, mentoring, and financial assistance to address the barriers that can stand in the way of education.
Each student benefits from a personal relationship with their Student/Parent Support Worker who motivates and guides students and their families, and ensures students' accountability to the contract they sign as a condition of participation in the Program.
Pathways has a policy of equality, inclusion, and accessibility, and is available to all students of high school age within the communities served by Pathways. With average sign-up rates of more than 80%, Pathways to Education is a collective community-based movement for education.
Pathways has the following objectives:
- Reduce poverty and its effects by lowering the high school dropout rate and increasing access to post-secondary education among disadvantaged youth in Canada
- Help youth from disadvantaged communities set higher aspirations for their future
- Ensure that a greater number of youth can fully benefit from Pathways by expanding direct supports to participants and by expanding the organization's capacity to deliver more services to more participants countrywide
Expected results of the funding agreement include:
- Improved high school graduation rates and labour market outcomes for youth at-risk of leaving high school before completion
- Expand its supports to reach more students in more areas of the country.
- Expand employability programming for participants
- Develop a sustainability plan that will support knowledge transfer and sustainable reach
Program sites
As of 2017, Pathways is located in Ontario, Quebec, Nova Scotia, Manitoba, and British Columbia with sites in 20 communities serving over 5,000 students. Programming in Alberta, Saskatchewan and New Brunswick are expected to be accepting students soon.
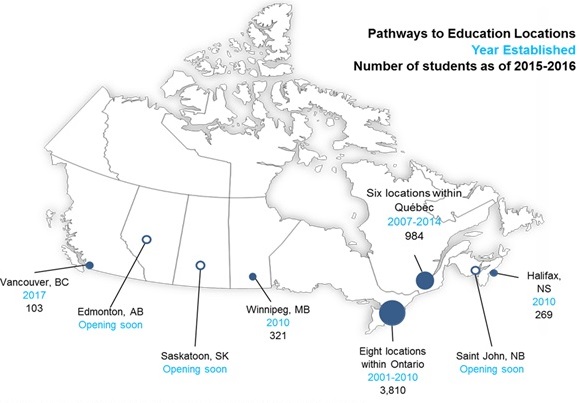
Figure 2: Program site map – Text version
The image depicts Pathways locations across Canada, the year of establishment, and the number of students as of 2015 to 2016.
| Pathways to Education locations | Year established | Number of students |
|---|---|---|
| Halifax, Nova Scotia | 2010 | 269 |
| Saint John, New Brunswick | Opening soon | 0 |
| 6 locations within the province of Quebec | 2007 to 2014 | 984 |
| 8 locations within the province of Ontario | 2001 to 2010 | 3,810 |
| Winnipeg, Manitoba | 2010 | 321 |
| Saskatoon, Saskatchewan | Opening soon | 0 |
| Edmonton, Alberta | Opening soon | 0 |
| Vancouver, British Columbia | 2017 | 103 |
1.2 Pathways funding
As a registered charitable organization, Pathways has developed many formal and informal partnerships across Canada with local governments, private sector groups and other not-for-profit organizations to deliver their programming. Its funding comes from various sources, including the Government of Canada, provincial governments, charitable foundations and private companiesFootnote 3. The Department provides annual funding to Pathways through a named grant. Between 2014 to 2015 and 2017 to 2018, the Department provided $31 million to Pathways.
| Fiscal year / source | 2014-2015 | 2015-2016 | 2016-2017 | 2017-2018 | Total |
|---|---|---|---|---|---|
| Budget 2013 | $6.0M | $6.0M | $6.0M | $6.0M | $24M |
| Budget 2015 | - | - | $3.5M | $3.5M | $7M |
| Total | $6.0M | $6.0M | $9.5M | $9.5M | $31M |
2. Evaluation strategy
2.1 Evaluation scope, methodology, and limitations
This evaluation examines the extent to which Pathways is relevant, achieved its outcomes, and the impact it had on its eligible students. The Department synthesized 3 reports described below to address the evaluation reporting requirements of the Financial Administration Act and the Policy on Results.
- The evaluation of the Pathways to Education program: In 2016 to 2017, Pathways externally contracted this evaluation as stipulated under its agreement with the Department. The report focused on general evaluation issues, program effects and the design and delivery of the program. This line of evidence applied a methodology that compared outcomes between Pathways-eligible students (treatment group) to on-eligible students (comparison group)Footnote 4 and generated qualitative data from key informant interviews, focus groups and 3 surveysFootnote 5.
- The long-term impacts of the Pathways to Education program: This is an academic studyFootnote 6 prepared by Adam M. Lavecchia, Philip Oreopoulos and Robert Brown for the Department in 2018. It examined the incremental impacts of the program covering the period between 1999 and 2013. It compared the outcomes of all adolescents from Regent Park that were eligible for the program with the outcomes of adolescents from other Toronto public housing sites, both before and after the introduction of Pathways. A regression analysis was also used to estimate the impacts on earnings and employmentFootnote 7.
- The returns to completing high school Education: This Department-generated line of evidence literature review focused on the economics of completing high school education as well as individual and societal benefits. It reported on the frequency of not completing high school in Canada; labour market benefits from completing high school; and the benefits of completing post-secondary education.
3. Findings: relevance, effectiveness, and efficiency
The results presented in this section include an assessment of a demonstrable need for the program (relevance); the effectiveness of Pathways (outcomes); the impact Pathways has had on the eligible students (program attribution); and, the overall costs and benefits of the program.
The results of the analyses, detailed below, confirm that Pathways is making a difference in the lives of the eligible students. Eligible students' graduation rates are higher and they have increased their post-secondary enrollment. They have increased their labour market attachment. The analysis also demonstrates that Pathways' benefits outweigh the costs.
3.1 Relevance
Relevance is the extent to which a program, policy or other entity addresses and is responsive to a demonstrable need.
In 2015, approximately 1 out of every 8 Canadians (or about 12%) lived in poverty according to Opportunity for All - Canada's First Poverty Reduction Strategy (2018).
Overall, Pathways programming is contributing to a demonstrable need by providing support to disadvantaged youth in order to complete their education, transition to a successful future and better reach their potentialFootnote 8. The discussion that follows describes the challenges facing children living in poverty and the consequences specifically associated with not completing high school.
Participant profile
Gender: Pathways participants at the Ontario sites were equally divided between men and women, whereas the Halifax, Verdun and Winnipeg sites had more female than male participants.
Age: Generally, when entering Pathways, participants are in grade 9 and approximately 14 years old at the Ontario sites. The average age of Pathways participants in Halifax and Winnipeg was 14 years old and was 12 years old in Verdun.
Language: About one-third of the Ontario site participants were born outside of Canada and 39% of the participants first spoke a language other than English or French. Over 30% of participants in Verdun first spoke a language other than English or French and the Halifax site reported less than one-tenth of participants first spoke a language other than French or English.
Source: Goss Gilroy Inc. (2017). Evaluation of the Pathways to Education Program. Ottawa.
In 2013, more than 15% of Canadian children overall, and as high as 40% among Indigenous children, lived in poverty. According to the Goss Gilroy evaluation report, children living in poverty are at high risk of developing health issues, developmental delays and behaviour disorders and are more likely to have lower levels of education and remain in poverty as adults. This group is also most likely to experience, among other things, interrupted school attendance, lower university attendance, increased risk of illiteracy, and higher dropout ratesFootnote 9.
While a minority of the total population, a significant portion of the population fails to complete secondary school. For example, in 2011 to 2012, Canada's dropout rate was 7.8% nationally with the dropout rates for men being higher (9.7%) than for women (5.9%)Footnote 10. Moreover, the Literature Review also suggested that Canadian youth at risk of dropping out of high school are among the most vulnerable in our society. Figure 3 illustrates the potential consequences of dropping out of high schoolFootnote 11.
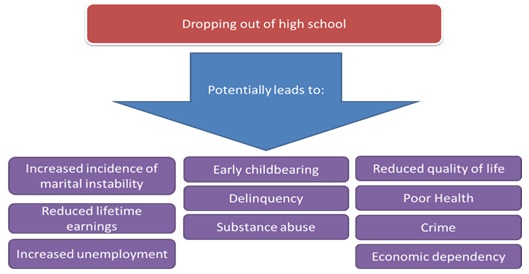
Figure 3: Potential consequences of dropping out of high school – Text version
Dropping out of high school potentially leads to Increased incidence of marital instability; Reduced lifetime earnings and Increased unemployment. It also potentially leads to Early childbearing, Delinquency and Substance abuse. As well, dropping out of high school could lead to a Reduced quality of life, Poor health, Crime, and Economic dependency.
As well, youth who drop out of high school experience lower wage level increases than those who completed high school, report lower wage satisfaction, and were less likely to be employed by age 24Footnote 12. For example, the present value of lifetime earnings is $129,000 higher for men and $104,000 higher for women with a high school diploma, relative to high school dropoutsFootnote 13.
These factors all suggest a continuing relevance for programs and policies designed to help vulnerable youth complete secondary school.
3.2 Outcomes
An outcome, under the 2016 Policy on Results, is a change or consequence attributable to outputs or to which outputs or other outcomes of the program contribute.
This section focuses on the program's outcomes with respect to increasing the number of participants entering post-secondary education and helping Indigenous youth. The evidence presented below suggests that Pathways is achieving these outcomes.
Pathways programming contributed to increased enrollment to post-secondary education
Pathways helped eligible students apply for, be accepted to and enroll in post-secondary institutions. The majority of alumni survey respondentsFootnote 14 and surveyed staff membersFootnote 15 agreed that Pathways programming helped eligible students apply for post-secondary education.
Across the 6 Ontario sitesFootnote 16 analyzed, 63% of Pathways students from the 2010 and 2011 cohorts applied to a post-secondary institution. Application rates were highest in Regent Park (75%) and lowest in Kitchener (51%).
Furthermore, the average Pathways-eligible Regent Park student claimed more tuition spending as an income tax deduction than the average Toronto Community Housing project student who enrolled in a Toronto District School Board school between 2000 and 2008Footnote 17.
Adapted programming in Winnipeg positively affected Indigenous youth
Focus group discussions with Pathways alumni in WinnipegFootnote 18, of which 72% of Pathways students are Indigenous, suggested that the program is positively influencing their lives. In focus groups, the Winnipeg Pathways staff stated that some of the Indigenous students faced multiple barriers and challenges and, as such, they adapted the Pathways programming to meet these students' specific needs and circumstances. For example, Pathways programming in Winnipeg has adapted to Indigenous culture and offers a medicine wheel, sharing circles, smudging ceremonies and sweat lodge ceremonies. Winnipeg Pathways staff supported the holistic development of the students and created a space where students had a sense of belonging and could build relationshipsFootnote 19.
In addition, other services that Pathways staff in Winnipeg provided for students when necessary included collaborating with housing organizations to provide beds for homeless students; established a peer helper initiative to help students develop leadership skills and gain confidence; and, provide meals and snacks for students who attend tutoring sessions.
Focus group participants in Winnipeg agreed that Pathways positively helped them to do better in school and graduate from high school. Some participants (43%) also noted that they were the first ones to graduate in their family and highlighted the importance of having adult figures in their lives that value education and motivate them to do well in school. The focus group participants who had gone on to post-secondary education had accessed the Pathways scholarship and indicated it had helped them purchase school-related supplies and equipment (e.g., books, laptops, etc.)Footnote 20.
3.3 Impacts
Impacts are positive or negative, primary or secondary long-term effects produced by the program, directly or indirectly, intended or unintendedFootnote 21.
This section presents the impacts of participation in Pathways. The findings demonstrate the extent to which the program can be attributed to improving high school graduation rates; increasing the number of eligible students entering and graduating from post-secondary education; and improving the labour market outcomes for Pathways-eligible students.
Pathways positively affected high school graduation rates
Across observed Pathways sites, there was a noticeable improvement in graduation rates compared to non-eligible studentsFootnote 22. Graduation rates were 19.1% higher for participants at the Ontario sites on average. The graduation rates in the Halifax and Verdun sites were also higher for participants (28.4 percentage points and 10.4 percentage points, respectively)Footnote 23.
This finding is supported by a separate study, conducted in 2017, which also attributed an increase in graduation rates to participation in PathwaysFootnote 24. It estimated that eligibility in Pathways led to an increase of 35% in high school graduation rates for Pathways-eligible Regent Park students compared to non-eligible students from Toronto public housing projects.
Figure 4, below, also demonstrates how Pathways positively influences secondary school completion. Across 10 sites where Pathways was present in the 2015-16 academic year, there was a noticeable increase in the share of students who graduated no more than 1 year beyond the province's standard secondary school term (e.g., within 4 years where high school comprises grades 10, 11, and 12) than was the case in the year before Pathways was introducedFootnote 25. This type of comparison cannot attribute the observed increases to Pathways, but the improvement does suggest that the Program is likely contributing to greater on-time graduation at these sites.
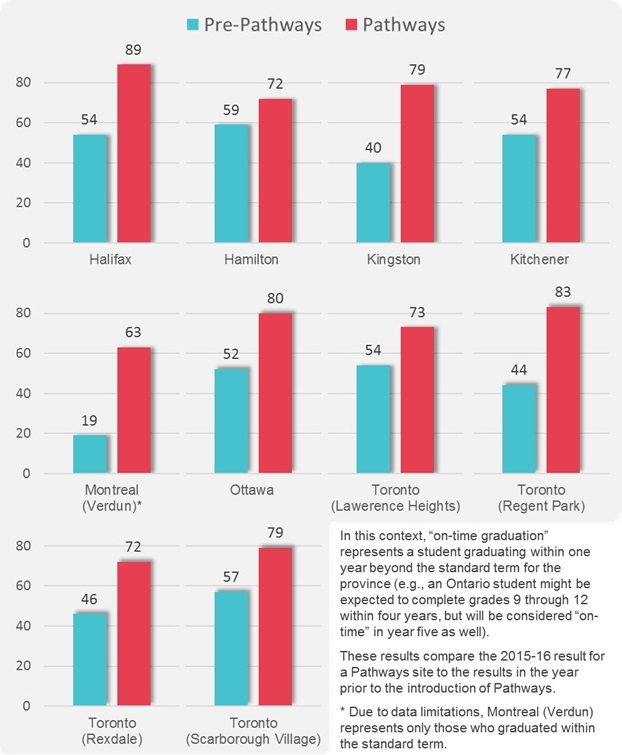
Figure 4: On-time graduation rates by site, 2015-16 – Text version
The graph depicts the on-time graduation rates, before and after the Pathways program, by site, over 2015 to 2016. These results compare the 2015 to 2016 results of a Pathway site to the results in the year prior to the introduction of Pathways. The definition of “on-time graduation rates” appears in the in-set of the graph.
| Pre-pathways | Pathways | |
|---|---|---|
| Halifax | 54 | 89 |
| Hamilton | 59 | 72 |
| Kingston | 40 | 79 |
| Kitchener | 54 | 77 |
| Montreal (Verdun) | 19 | 63 |
| Ottawa | 52 | 80 |
| Toronto (Lawerence Heights) | 54 | 73 |
| Toronto (Regent Park) | 44 | 83 |
| Toronto (Rexdale) | 46 | 72 |
| Toronto (Scarborough Village) | 57 | 79 |
Pathways had a positive effect on enrollment to post-secondary education and educational attainment
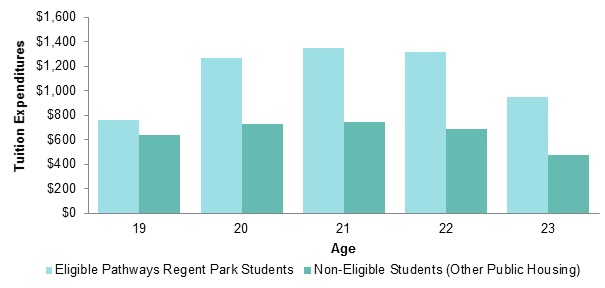
In addition to the improved graduation rates noted above, the average Pathways-eligible Regent ParkFootnote 26 student claimed more post-secondary tuition expenditures for university or college. Figure 5 illustrates that between the ages of 19 and 23, the average Pathways-eligible student had higher tuition expenditures than an average non-eligible student indicating that more Pathways-eligible students participated in a post-secondary education. As well, the regression estimates indicate that eligibility for Pathways increases postsecondary education attainment by approximately 0.5 years.
Source : Lavecchia, Adam M., Philip Oreopoulos et Robert Brown. Long-term impacts of the Pathways to Education program. 2018
Figure 5: 2013 average tuition expenditures for Pathways-eligible and non-eligible students – Text version
The graph depicts the comparison between Pathways-eligible students at Regent Park location, and the non-eligible students associated with other public housing, in terms of average expenditures on tuition, in 2013.
| Age | Eligible Pathways Regent Park students | Non-eligible students (other public housing) |
|---|---|---|
| 19 | $760 | $635 |
| 20 | $1,265 | $727 |
| 21 | $1,352 | $744 |
| 22 | $1,320 | $689 |
| 23 | $950 | $477 |
| 24 | $587 | $303 |
| 25 | $259 | $316 |
| 26 | $139 | $278 |
Pathways positively affected labour market outcomes
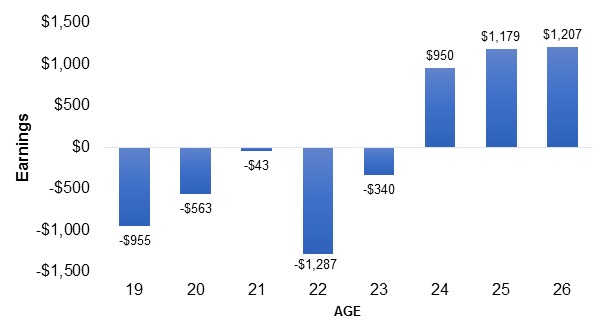
Employment earnings for Pathways-eligible Regent Park students were higher than non-eligible students following graduationFootnote 27. Regression analysis from the Lavecchia study found that, on average, these students earned less than non-eligible students in the comparison group (by an average of $638 annually over 5 years) between the ages of 19 and 23, (see Figure 6); however, at age 24, they earned $12,678 compared to $11,818 for non-eligible students or approximately $950 more. By age 26, Pathways-eligible students earned $1,207 more per year on averageFootnote 28.
Source : Lavecchia, Adam M., Philip Oreopoulos and Robert Brown. Long-term impacts of the Pathways to Education program. 2018
Figure 6: Difference between Pathways-eligible and non-eligible students’ earnings – Text version
The graph shows that the employment earnings of Pathways-eligible Regent Park students were higher than the earnings of the non-eligible students, after graduation. On average, these students earned less than did the non-eligible students in the comparison group between the ages of 19 and 23. However, at age 24, they earned more as compared to the non-eligible students. By age 26, Pathways-eligible students continued earning comparatively more per year, on average.
| Age | Difference in salary |
|---|---|
| 19 | - $955 |
| 20 | - $563 |
| 21 | - $43 |
| 22 | - $1,287 |
| 23 | - $340 |
| 24 | $950 |
| 25 | $1,179 |
| 26 | $1,207 |
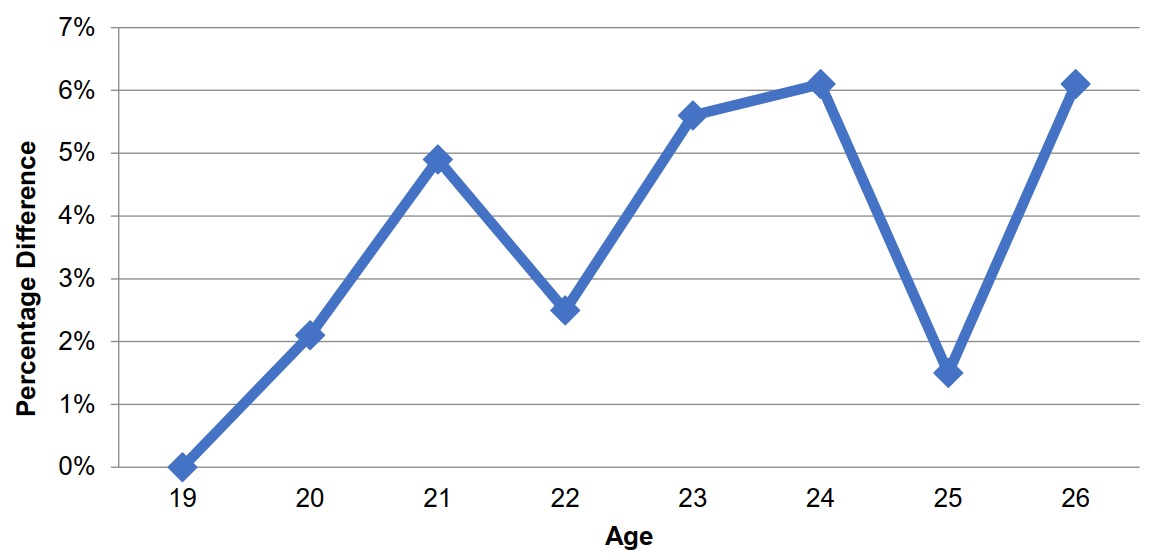
Pathways also positively affected the employment rate of young adults eligible to participate in the program (Figure 7)Footnote 29. At age 19, there was no difference between the Pathways-eligible and non-eligible students. By age 21, their employment rate was 5 percentage points higher compared to non-eligible students; and by age 26, it was more than 6 percentage points higher than non-eligible students.
Source: Lavecchia, Adam M., Philip Oreopoulos and Robert Brown. Long-term impacts of the Pathways to Education program. 2018
Figure 7: Difference of employment rate between Pathways-eligible students and non-eligible students – Text version
The graph depicts how Pathways positively affected the employment rate of young adults eligible to participate in the program. At age 19, there was no difference between the Pathways-eligible and non-eligible students. By age 21, their employment rate was 5 percentage points higher compared to non-eligible students; and by age 26, it was more than 6 percentage points higher than that of the non-eligible students.
| Age | Difference in employment rate |
|---|---|
| 19 | 0% |
| 20 | 2% |
| 21 | 5% |
| 22 | 3% |
| 23 | 6% |
| 24 | 6% |
| 25 | 2% |
| 26 | 6% |
In addition to the improved incidence of employment, the regression analysis found that Pathways-eligible students made less use of social assistance and employment insurance benefits than ineligible students, on average. Specifically, they decreased their likelihood of receiving social assistance by 5.1 percentage points and employment insurance by 5.8 percentage points when compared to non-eligible students. As well, they received $525 less social assistance and $183 less employment insurance than similar non-eligible studentsFootnote 30.
3.4 Costs and benefits
This section presents benefits and costs associated with participation in the program that arise from improving high school completion rates and increasing post-secondary participation. As the program is focused on early interventions, the effects and benefits can be long-lasting and require a longer time horizon to fully assess the impacts.
The costs and benefits of Pathways accumulate to both individual participants and to governments over the short- and long-term (see Appendix B for further details). The impacts of the program begin with participation in Pathways, which results in students improving their high school completion rates.
Using Pathways-eligible Regent Park students as a proxy and comparing them to similar student population without access to Pathways programming, participation in Pathways increased the individual's lifetime earnings, even after factoring in the additional costs associated with higher levels of education and reductions in Employment Insurance and Social Assistance benefits received.
From the individual's perspective, there are short-term costs that arise from participation, such as the direct costs of post-secondary education and the opportunity costs of foregoing employment to increase educational attainment, which can be offset by short-term benefits such as education subsidies and improved skills/employability.
Long-term benefits for individuals consist of greater lifetime earnings and improved social outcomes. Pathways helps at-risk youth graduate high school, thus improving their skills and outcomes. Pathways participants are subsequently less likely to rely on government supports and may pay more taxes as their labour market attachment strengthens, which in turn may moderate (but does not completely offset) their life-time improvement in earnings.
From the government's perspective, short-term costs consist of program costs and costs associated with supporting higher levels of education. Benefits to the government begin in the medium-term and extend into the long-term. These benefits include increased tax revenues from greater lifetime earnings of participants; decreased outlay on Employment Insurance, Social Assistance and other labour market programming; and, a potential decrease in spending on social programs, such as justice and health, reflecting the improved outcomes of participants. Not all of these benefits—particularly those reflecting improved social outcomes—are easily quantifiable.
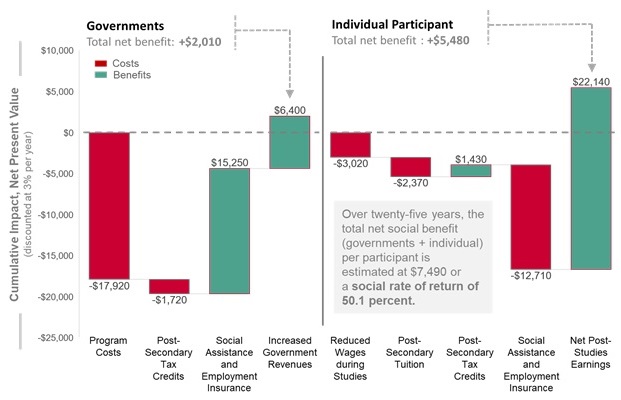
Figure 8 illustrates the costs and benefits of Pathways associated to governments and an individual student over a longer period of time. The incremental impacts were determined by comparing the outcomes of Pathways-eligible students to non-eligible students in Regent ParkFootnote 31. This analysis was estimated by comparing costs and benefits associated with individuals participating in Pathways compared to individuals who did not participate.
- * Components may not sum to reported total due to rounding
- Chart Source: ESDC staff estimates based on results found in Lavecchia et al. (2018). “Long Term Impacts of the Pathways Education Program” for ESDC.
Figure 8: Costs and benefits per student over 25 years, net present value – Text version
The graph shows how costs and benefits of Pathways accrue to both individual participants and to governments, over the short- and long-term. From individuals' perspective, short-term benefits such as education subsidies and improved skills/employability can offset short-term costs incurred due to participation. Long-term benefits for individuals consist of greater lifetime earnings and improved social outcomes. From the government's perspective, short-term costs consist of program costs and costs of supporting higher levels of education. Benefits to the government begin in the medium-term and extend into the long-term, and include the following: increased tax revenues from greater lifetime earnings of participants; decreased outlay on Employment Insurance, Social Assistance etc. and a potential decrease in spending on social programs, such as justice and health of individuals.
| Governments | Real cumulative impact (discounted at 3% per year) |
|---|---|
| Program Costs | -$17,920 |
| Post-Secondary Tax Credit | -$1,720 |
| Social Assistance and Employment Insurance | +$15,250 |
| Increased Government Revenues | +$6,400 |
| Total Governments Net Benefit | +$2,010 |
| Individual | Real cumulative impact (discounted at 3% per year) |
|---|---|
| Reduced Wages During Studies | -$3,022 |
| Post-Secondary Tuition | -$2,370 |
| Post-Secondary Tax Credits | +$1,430 |
| Net Post-studies Earnings | +$22,140 |
| Total Individual Net Benefit | +$5,480 |
| Total net benefit (Governments plus Individual) | +$7,490 |
While the Pathways' program has total costs ($17,920) in the short-termFootnote 32 from the government perspective (from all sources of funding), the long-term approach reveals a net benefit ($2,010) due to decreased outlays and increased revenues.
In the short-term, Pathways-eligible students incur tuition costs related to post-secondary education and foregone earnings due to decreased employment while attending school. Their benefits include a tuition tax credit remitted to individuals attending a college or university and greater net earnings from having pursued a post-secondary education.
The individual's total net benefit is about $5,480. The total net social benefit to society of an eligible student participating in Pathways over 25 years is $7,490 compared to a non-eligible student. This results in a social return on investment for Pathways of 50.1% over 25 years or a compound annual growth rate of 1.6%.
As a result, an investment in the program “breaks even” (where the benefits equal the costs) after 22.5 years from a government perspective and after 20.8 years from a total social net benefit perspective.
As noted above, other potential gains, such as improved well-being for individuals related to better health outcomes and improved social outcomes (for example, reduced interactions with the criminal justice system), may also accrue to individuals. A number of studies suggest that completing high school is linked to social and economic benefits later in lifeFootnote 33.
Though not quantifiable for the purposes of this analysis, international studies have shown that secondary school completion is correlated with:
- Large and significant decrease in the likelihood of both conviction and incarceration
- Small, but significant, improvements in health outcomes
- Increased civic engagement with the probability of voting rising by 28 to 34 percentage points
- Generating significant social savings through crime reduction
4. Lessons learned and conclusions
4.1 Lessons learned
Pathways is an organization that assists Canadian youth living in poverty and who are at risk of dropping out of high school. Pathways help youth graduate from high school and transition into post-secondary education so they can reach their full potential.
The lessons learned— applicable to both Pathways and similar programming—are as follows:
Targeted early interventions can positively affect vulnerable populations
Targeted and sustained early interventions for vulnerable youth has resulted in significant positive outcomes. The evidence indicates that Pathways is improving high school graduation rates.
- Graduation rates were higher for Pathways students compared to non-eligible students at the Ontario, Verdun and Halifax sites
Students where participation in Pathways was an option invested more in post-secondary education than comparable students not able to access the program.
- The average Regent Park Pathways-eligible student claimed more post-secondary tuition expenditures for university or college than the average non-eligible student
Moreover, it positively affected their labour market outcomes.
- Employment earnings for Regent Park Pathways-eligible students at age 26 were $1,200 greater than the earnings of non-eligible students
- Pathways positively affected the employment rate of young adults eligible to participate in the program by 6 percentage points at age 26
- Regent Park Pathways-eligible students made less use of Social Assistance and Employment Insurance benefits
A key component of the success of the Pathways model is the flexibility to adapt to local needs and conditions
The flexible nature of the Pathways program allowed staff to adjust the programming to meet the unique needs of the local youth.
For example, Pathways staff adapted the programming at the Winnipeg site to address the multiple barriers and challenges faced by Indigenous students by incorporating Indigenous teachings and traditions. The findings from this example suggest that this tailored programming has had a positive influence on the lives of Indigenous youth.
Early interventions with vulnerable populations can generate long-term net benefits not just for individuals but also for governments
Pathways participants and the government both incurred short and long-term costs and benefits from participation. Using the impact analysis for Pathways-eligible Regent Park students as a proxy, it was determined that the average total benefit for an eligible participant are greater than the personal costs and result in a net benefit of $5,480 per individual. In addition, this does not include any improvements in well-being that might arise from other improved outcomes.
From a government perspective, participants may be less likely to require government supports (i.e. Employment Insurance, Social Assistance) over their lifetime and may contribute more to government revenues due to improved personal incomes and stronger attachment to the labour market. The same social cost-benefit analysis noted above determined the benefits to the government outweigh the costs associated with Pathways resulting in a net benefit of $2,010 even before potential gains due to reduced expenditures on other types of programs or potential intergenerational effects. Considering only a limited set of government programs (Employment Insurance and Social Assistance) and revenue and expenditure sources, governments collectively break even 22.5 years after the initial investment, after which point it represents a net gain.
When taken together, the total net social benefit of participation was calculated at $7,490 per participant over a 25-year projection, for a total social rate of return of 50.1%. Looking over a longer time horizon and including other factors would potentially increase this even further.
4.2 Conclusion
Overall, the findings show that Pathways reduced the high school dropout rate and increased access to post-secondary education. The program is flexible, adapting to the needs and characteristics of the target population and benefits society as a whole.
As such, programming of this nature—designed to support early interventions to help vulnerable youth complete high school—has a valuable role to play.
Appendix A
*PSE refers to post-secondary education
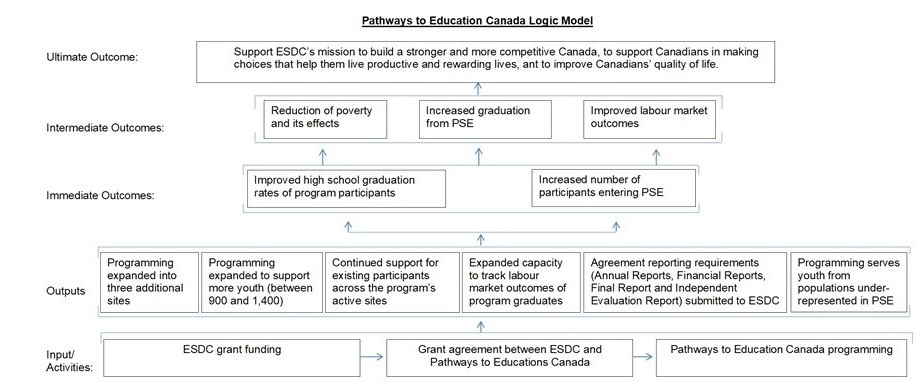
Appendix A: Pathways to Education Canada logic model – Text version
Appendix A presents a flow chart illustrating the logic model of the Pathways to Education program. The flow chart outlines, from top to bottom:
- The program's ultimate outcome: support ESDC's mission to build a stronger and more competitive Canada, to support Canadians in making choices that help them live productive and rewarding lives, and to improve Canadians' quality of life.
- The intermediate outcomes are reduction of poverty and its effects; increased graduation from post-secondary education; and, improved labour market outcomes.
- Immediate outcomes include improved high school graduation rates of program participants and increased number of participants entering post-secondary education.
- The program's outputs are: programming expanded into 3 additional sites; programming expanded to support more youth (between 900 and 1,400); continued support for existing participants across the program's active sites; expanded capacity to track labour market outcomes of program graduates; agreement reporting requirements (annual reports, financial reports, final report and independent evaluation report) submitted to ESDC; and, programming serves youth from populations under-represented in post-secondary education.
- The input or activities for the program are ESDC grant funding, grant agreement between ESDC and Pathways to Education Canada and Pathways to Education Canada programming.
Appendix B
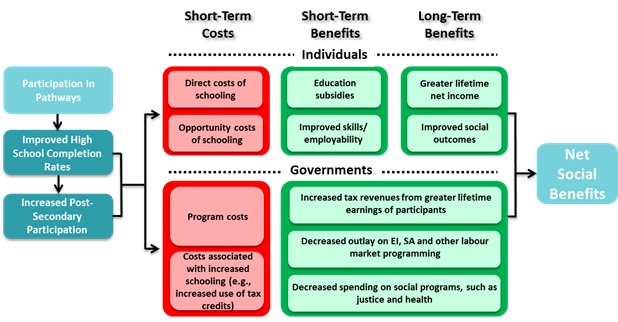
Appendix B: net social cost-benefit analysis – Text version
Appendix B is a flow chart illustrating the costs and benefits associated with participating in the Pathways to Education program. The flow chart, from left to right, includes the following:
- Participation in Pathways leads to improved high school completion rates and increased post-secondary participation.
- The short-term costs include the direct costs of schooling, opportunity costs of schooling for individuals. For governments, the short-term costs include program costs and costs associated with increased schooling (such as increased use of tax credits).
- The individual short-term benefits are education subsidies and improved skills/employability.
- The governments' benefits are both short-term and long-term. They include increased tax revenues from greater lifetime earnings of participants; decreased outlay on Employment Insurance, Social Assistance and other labour market programming; and, decreased spending on social programs, such as justice and health.
- The individual long-term benefits are great lifetime earnings and improved social outcomes.
- These costs and benefits flow directly into net benefits.
This graphic presents a conceptual framework for how costs and benefits might accrue from participation in the Pathways to Education program. While not intended to be exhaustive, it includes elements that are not part of the net benefit analysis due to insufficient information on how to quantify the specific cost or benefit, such as the gains from potential improvements to health outcomes, but are reasonably expected to have an effect.
This section presents the methodology used to develop the analysis found in section 3.4 of the report and provides more detail on Figure 8: Costs and Benefits per Student over 25 Years.
Programs that focus on improving the outcomes of youth are designed, almost by definition, to have long-lasting and cumulative effects. As such, analysis focused entirely around the period of intervention will underestimate the full impact of the programs for individual participants and for society in general.
The benefits and costs associated with participation in Pathways stem from the direct and indirect effects of the program's ability to improve high school completion rates and, by extension, increase post-secondary participation. These benefits do not accumulate solely to the individual participant, but neither are the costs associated with participation borne only by the program or its funding sources. As such, the many short-term and long-term labour market outcomes, as well as social benefits, result in broader positive impacts for society that are rarely captured in more limited, traditional cost-benefit analysis.
Source material: “Long term impacts of the Pathways to Education program” (2018)
In “Long Term Impacts of the Pathways to Education Program”, authors Lavecchia, Oreopolous and Brown used a difference-in-differences method to determine the causal impacts of Pathways. This report compared a sample of eligible high school students who entered grade 9 between 2000 and 2005 in a location served by the Pathways program to a statistically similar sample of students who were not eligible (non-eligible students) for the program in 70 public housing projects in the City of Toronto. The impacts from the analyses focused on the Regent Park site.
Outcomes presented in Lavecchia et al. (2018) are "implied" (regression-adjusted) means for eligible and non-eligible students. Several other factors (such as housing project and cohort fixed effects) are accounted for in these means, allowing them to more precisely reflect the impact of Pathways on individuals. Furthermore, the difference between the regression-adjusted means for participants and non-participants can be interpreted as the causal effect of the program under the assumption that the evaluation of outcomes for participants would have followed the same path as the outcomes for non-participants. The plausibility of this assumption is tested in Lavecchia et al. (2018) through the process of establishing treatment and control groups.
These results for Regent Park are used as a proxy for the program overall. While any individual site might have better or worse incremental impacts for their observed populations, there is nothing to suggest that these results might be an outlier.
Through impact analysis, the overall benefits and costs of implementing the program per participant are presented in Figure 8: Costs and Benefits per Student over 25 Years in section 3.4 of the report. These figures are based on calculations and assumptions (outlined below) made by the Evaluation Directorate of ESDC. It is founded in the incremental impacts reported by Lavecchia et al. (2018) for Pathways-eligible participants at the Regent Park site in versus a control group (see explanatory box), which is treated as a proxy for Program-wide participation results in this analysis. This type of analysis supports the evaluation's effort to better assess and estimate the relevance of the program and the efficiency and effectiveness of its outcomes.
Projections: Time horizon and discount rate
All estimates assume a 25-year time horizon and an annual discount rate of 3%.
A discount rate of 3% is consistent with the discounting done in Lavecchia et al. (2018)Footnote 34 and other similar studies that examine the impacts of education interventions on earnings (Krueger, 1999; and Chetty et. al., 2011). This rate is also in line with Boardman et al. (2008) and the interim TBS guide for Cost-Benefit Analysis (the “TBS Guide”). The TBS Guide, which cites Boardman et al. (2008), suggests a social discount rate of 3% accompanied by a shadow price of investment applied to all the costs that crowd out investment activityFootnote 35. Since Pathways does not invest in capital and is not a regulation, the 3% rate is applied without modification.
Components of the net benefit analysis
The components of the net benefit analysis are discussed in the order that they appear in Figure 8 (from left to right) in section 3.4 of the report.
Below are the costs and benefits from the perspective of governments. All values include the Marginal Social Costs of Public Funds, the distortionary loss incurred by society when raising additional taxes to fund government spending. This effect increases the magnitude of both the costs and benefits associated with a government program. As a result, this effect will be positive (net benefit) if a program generates net savings, but negative (net cost) if it falls short. As in previous evaluations produced by Employment and Social Development Canada (see the 2017 Evaluation of the Labour Market Development Agreements), the effect is assumed to be 20%, this is to say that each dollar of net costs or net benefits generated by a program or an intervention is increased by 20 cents.
- Program costs
-
This is based on the total program costs per participant ($14,935) reported in Lavecchia et al. (2018) and applies to Regent Park Pathways-eligible students.
Funding to cover these program costs includes not only the direct contributions of the Government of Canada, but also contributions from the Government of Ontario and private donations.
As these sources cannot be disentangled from the final program costs, the Marginal Social Costs of Public Funds is applied to the entire amount and may represent an overestimate as a result. The Marginal Social Costs of Public Funds adds an additional $2,987 (20% of $14,935) for a total cost of $17,920 per student. While this cost will be spread out over multiple years, it is treated as an upfront expense and the amount is not discounted.
- Post-secondary tax credit
-
Tuition expenses are reported in Lavecchia et al. (2018). This value is the difference in annual average tuition tax credits between participants and non-participants between the ages of 19 and 26. It represents a cost to governments due to the increased take-up of post-secondary education. After discounting, this amounts to $1,433. The Marginal Social Cost of Public Funds increases this expense by 20% for a total cost of $1,719 for the analysis period.
Related, though not included, are the potential additional institutional costs associated with a student continuing their studies beyond secondary school. The incremental cost of an additional student is likely minimal for the post-secondary educational system, but it is conceivable that sufficient scaling of the program could increase system-wide pressures due to increased demand.
- Social assistance and employment insurance
-
Lavecchia et al. (2018) reports a reduction in social assistance use among Pathways-eligible students compared to non-eligible students of $525 in 2013. For this analysis, this reduction is assumed to be constant over the entire analysis period.
Similarly, Lavecchia et al. (2018) reports that in 2013 a reduction in the use of Employment Insurance among Pathways-eligible students compared to non-eligible students of $183. This is also assumed to be constant over the entire analysis.
The total combined savings is $12,706 after discounting.
These may be middling estimates, as benefit use may change as a result of changes in an individual's income over time. Incremental impacts related to Social Assistance, for example, may widen as incomes and outcomes diverge. In the case of Employment Insurance, it is unclear if benefits received by participants would increase or decrease relative to non-participants over the 25-year period. On the one hand, participants appear to have greater labour market attachment and may earn more, entitling them to greater benefits during a job separation. On the other hand, participants may experience fewer extended periods of unemployment, leading to less dependency on Employment Insurance.
Because it is a net benefit to governments, the Marginal Social Cost of Public Funds increases the size of this benefit by 20%. This results in a net benefit to governments of $15,248 over the analysis period.
- Increased government revenue
-
Using forecasted earnings underlying the values for Net Post-Studies Earnings of individuals (see below), the incremental taxes paid are estimated based on similar incremental impacts observed for Ontario participants in Employment Benefits and Support Measures delivered through the Canada-Ontario Labour Market Development Agreement. For example, administrative data for tax years 2002 through 2012 showed that where there was an incremental impact on earnings of just over $1000 in a year, it resulted in increased income taxes paid of roughly $140 compared to the control population. This was calculated from the age of 24 to 43, as between 19 and 23 the forecasted earnings for both participants and non-participants were below or around the basic personal amount. The total incremental amount for income taxes came to $3,807 after discounting.
In addition to the gains from income taxes, the analysis included estimates of the incremental impact in revenues due to combined Federal and Provincial sales taxes. As in the 2017 Evaluation of the Labour Market Development Agreements, it is assumed that each dollar in incremental earnings results in 48 cents of spending on taxable goods (i.e., a propensity to consume of 96% with an assumed breakdown of half on taxable and half on non-taxable goods and services). With a Harmonized Sales Tax (HST) rate of 13%, this results in a little over 6 cents of sales tax for each incremental dollar in earnings. The total incremental amount for sales taxes came to $1,526 after discounting.
Because it is a net benefit to governments, the Marginal Social Cost of Public Funds increases the size of these benefits by 20%. Combined, this results in $6,400 in benefits due to increased tax revenues.
Changes in payroll taxes, such as Employment Insurance Premiums, are not included in this estimation.
Below are the costs and benefits from the perspective of the individual participant. Unlike the costs and benefits from the governments' perspective, the costs and benefits experienced by the individual participant are not affected by Marginal Social Costs of Public Funding. As was the case above, specific values presented below are prior to application of the discount rate.
- Reduced wages during studies
-
Lavecchia et al. (2018) report average annual earnings for eligible students and non-eligible students from ages 19 to 26. Pathways-eligible students have lower average annual earnings than non-eligible students between the ages of 19 and 23. The difference in annual earnings between these 2 groups between ages 19 and 23 is taken to be the estimated opportunity cost of participating in the program and assumed to be associated with increased likelihood participation in schooling. The total difference is $3,022 after discounting.
- Post-secondary tuition
-
Lavecchia et al. (2018) provides average tuition costs incurred by program eligible students between ages 19 and 26. Eligible students are more likely to pursue post-secondary education, and incur greater tuition expenses. After discounting, this amounts to $1,433 for the analysis period.
This value only reflects what has been reported and claimed according to the tax records and may understate actual incremental expenditures. Further amounts are not projected beyond the age of 26.
- Social assistance and employment insurance
-
Lavecchia et al. (2018) reports a reduction in 2013 of social assistance use among Pathways-eligible students compared to similar students at sites where the Program is unavailable of $525. This is assumed to be constant over the entire analysis period.
Similarly, Lavecchia et al. (2018) reports a reduction in the use of Employment Insurance in 2013 among Pathways-eligible students compared to similar students at sites where the Program is unavailable of $183. This is assumed to be constant over the entire analysis period.
The total combined savings is $12,706 after discounting.
From the individual participant's perspective, changes in Social Assistance and Employment Insurance income are a reduction in lifetime earnings and represent a cost.
It should be noted that this method treats a dollar collected in Social Assistance or Employment Insurance as being of equal value to a dollar earned from employment. A potential concern of this approach is that it does not consider the possibility that income from employment earnings may be preferred to income from Social Assistance and Employment Insurance, as employment earnings may be a reflection of self-sufficiency, well-being, and greater participation in society.
- Net post-studies earnings
-
Lavecchia et al. (2018) finds that from the age of 24 to 26 (inclusive), eligible students have higher average annual earnings than non-eligible students. This increases from $950 at age 24 to $1,207 at age 27.
Earnings for participants and the divergence in earnings between the 2 group from age 27 ($1,369) to age 43 ($3,425) are extrapolated from the above results. The forecasted earnings for participants is the sum of these 2 extrapolated values. See Appendix C: Lifetime Earnings Assumptions for the Net Social Cost-Benefit Analysis for more details.
The divergence in incomes does result in a larger gain than assumed by Lavecchia et al. (2018), as the authors assume a constant gap of $1,207 after age 27.
From the total increased post-studies earnings, the additional amount paid in taxes (see Increased Government Revenues above) is removed. The net increase in post-studies earnings is $22,144 after discounting.
Taken together, the social rate of return is calculated as the total net benefits of individuals and government ($2,010 + $5,480 = $7,490) divided by the unadjusted program costs ($14,935), which equals 50.1% over 25 years or an annualized rate of return of 1.6%.
Beyond year 25
The 25-year time horizon was selected in order to illustrate the effects of early interventions over a longer period. Even at 25 years, the constrained time period likely underestimates the full discounted benefits of a program such as Pathways.
The most obvious underestimation relates to improved lifetime earnings. Pathways, by definition, involves an intervention at a point very early in a person's life. As such, the expected earnings differential should persist well beyond the 25-year time horizon (when the participant will be only 43 years old) and may even continue to expand. This would have implications not only for the individual—who would see net earnings increase—but also on the Governments perspective, which could experience further savings in Social Assistance and Employment Insurance and increased tax revenues.
Also outside the time horizon, governments may enjoy savings in seniors' programs—particularly Old Age Security/the Guaranteed Income Supplement—because of the individual's greater lifetime earnings. Expanding the analysis would require taking into account Canada Pension Plan (CPP) payments and would need to analyze the effect related to the collection of CPP premiums over the entire period (currently not included in the analysis).
Finally, intergenerational effects could play an important role in considering the long-term outcomes associated with such an early intervention. This is beyond the scope of the evaluation, but longer time horizons could reasonably wish to encompass the effects of improved outcomes on successive generations.
Further analysis: other social benefits
In addition to the related labour market costs and benefits of governments and of individuals captured above, there are social benefits of the program that would factor into a more extensive analysis of Pathway's net benefit.
As an extension of the analysis to date, it would be worthwhile to examine ways to reflect other societal gains—such as savings for governments and higher well-being for individuals related to better health outcomes and reduced criminality—that may correlate with the outcomes observed. The Department may seek to consider how best to quantify these effects for future analysis and longer time-series data may be required. Even if quantified, however, it is unlikely this would capture the full positive impact, as it would not reflect the knock-on effects within society.
References for the net social cost-benefit analysis
- Boardman et al. (2008). “Social Discount Rates for Canada”. Working paper.
- Chetty et. al. (2011). “How Does your Kindergarten Classroom Affect Your Earnings? Evidence from Project Star,” Quarterly journal of Economics, 126(4): 1593-1660
- Employment and Social Development Canada (2017). “Evaluation of the Labour Market Development Agreements — Synthesis Report”. Ottawa, ON: ESDC.
- Krueger, Alan B. (1999). “Experimental Estimates of Education Production Functions,” Quarterly Journal of Economics, 114, 497-532.
- Lavecchia et al. (2018). “Long Term Impacts of the Pathways to Education Program,” ESDC.
- Lochner, Lance. (2011). “Nonproduction Benefits of Education: Crime, Health and Good Citizenship,” In Handbook of Economics of Education, vol. 4, edited by Eric Hanushek, Steve Machin and Ludger Woessmann, Elsevier, Amsterdam.
Appendix C: lifetime earnings assumptions for the net social cost-benefit analysis
Lavecchia et al. (2018) find that from the age of 24 to 26 (inclusive), eligible students have higher average annual earnings than non- eligible students. This earnings differential increases by 6% between 24 years old ($950) and 26 years old ($1,207).
In order to estimate the program’s incremental impact over 25 years, the Net Social-Cost Benefit Analysis requires an estimate of the earnings over the analysis period of participants and non-participants. This section of the report details the assumptions made in the Social Cost-Benefit Analysis to project earnings beyond 26 years old (labelled as the “Straight-Line Projection” approach) and also an alternative method undertaken as a robustness check (the “Educational Attainment” approach).
Straight-line projection
The following steps were taken to project earnings for both participants and non-participants from age 27 to 43 (inclusive):
- Extrapolated income levels for non-participants from age 27 to 43 using a straight trend line
- Used the difference in average annual earnings (for each year between 24 and 26) reported in Lavecchia et al. (2018) to extrapolate the future increases using a straight trend line
- The forecasted earnings for participants is the sum of these 2 extrapolated values
The annual post-program earnings of participants show incremental gains over the years to follow. The size of the increase continuously grew over the years and ranged from $1,369 (age 27) to $3,425 (age 43). In other words, at the end of the projection period the annual average earnings of participants were $3,425 higher than if they had not participated.
The upward growth in income is consistent with what is observe in Statistics Canada data, where average earnings appear to peak after 50 years old for all levels of educational attainment. However, this assumption of a sustained, steady rise results in a more gradual increase in the initial years than is generally observed in the data (where a sharper increase will generally occur between the 20 to 24 and the 25 to 29 age categories).

Source: Lavecchia and al. (2018) for observed results and ESDC calculations for projected and inferred income levels.
Figure 9: Straight line projection results on employment earnings – Text version
In order to estimate the program's incremental impact over 25 years, the net social-cost benefit analysis requires an estimate of the earnings over the analysis period of participants and non-participants. Figure 9 depicts the projected earnings beyond 26 years old, i.e. earnings for both participants and non-participants from age 27 to 43 (inclusive), labelled as the “Incremental Impact” approach. In addition, as an alternative method was undertaken as a robustness check, labelled as the “Income levels” approach.
| Age | Non-participants (observed) $ | Participants (observed) $ | Non-participants (projected) $ | Participants (inferred) $ | Gap (observed) $ |
Gap (projected) $ |
|---|---|---|---|---|---|---|
| 19 | 3,828 | 2,873 | -955 | |||
| 20 | 4,957 | 4,394 | -563 | |||
| 21 | 6,183 | 6,140 | -43 | |||
| 22 | 7,768 | 6,481 | -1,287 | |||
| 23 | 9,833 | 9,493 | -340 | |||
| 24 | 11,818 | 12,768 | 950 | |||
| 25 | 13,448 | 14,627 | 1,179 | |||
| 26 | 15,574 | 16,781 | 15,574 | 16,781 | 1,207 | 1,207 |
| 27 | 17,456 | 18,825 | 1,369 | |||
| 28 | 19,379 | 20,877 | 1,498 | |||
| 29 | 21,302 | 22,928 | 1,626 | |||
| 30 | 23,224 | 24,979 | 1,755 | |||
| 31 | 25,147 | 27,030 | 1,883 | |||
| 32 | 27,070 | 29,081 | 2,012 | |||
| 33 | 28,993 | 31,133 | 2,140 | |||
| 34 | 30,915 | 33,184 | 2,269 | |||
| 35 | 32,838 | 35,235 | 2,397 | |||
| 36 | 34,761 | 37,286 | 2,526 | |||
| 37 | 36,683 | 39,337 | 2,654 | |||
| 38 | 38,606 | 41,389 | 2,783 | |||
| 39 | 40,529 | 43,440 | 2,911 | |||
| 40 | 42,451 | 45,491 | 3,040 | |||
| 41 | 44,374 | 47,542 | 3,168 | |||
| 42 | 46,297 | 49,593 | 3,297 | |||
| 43 | 48,220 | 51,645 | 3,425 |
Robustness check: Educational attainment approach
Given the simplicity of the Straight-Line Projection method, the Evaluation Directorate wished to validate it against a method using assumptions on educational attainment and age. This was to ensure that the Straight-Line Projection:
- provided a good approximation of the pattern that might be observed under other assumptions.
- would not result in significant over-estimates in the potential gains in lifetime earnings over the analysis period.
To that end, the Evaluation Directorate used Statistics' Canada income/earnings data (2010) in order to construct the average income profile for participants and non-participants based on the average income associated with age and educational attainment, as in Table C1.
| Highest education attainment | 20 to 24 | 25 to 29 | 30 to 34 | 35 to 39 | 40 to 44 |
|---|---|---|---|---|---|
| No certificate, diploma or degree | $17,507 | $25,588 | $30,233 | $31,878 | $33,752 |
| High school diploma or equivalent | $15,792 | $29,346 | $35,299 | $38,898 | $41,783 |
| Apprenticeship or trades certificate or diploma | $24,846 | $35,969 | $40,298 | $43,082 | $44,828 |
| College, CEGEP or other non-university certificate or diploma | $18,752 | $33,531 | $40,323 | $45,010 | $48,915 |
| University certificate or diploma below bachelor level | $16,210 | $32,600 | $41,386 | $47,400 | $53,687 |
| University, diploma or degree at bachelor level or above | $17,970 | $38,485 | $52,623 | $65,191 | $74,892 |
Source: Statistics Canada, Average earnings or employment income, by age group and highest certificate, diploma or degree, Canada, 2010 Visit Statistics Canada
In order to determine the weights/breakdown among different educational attainment categories, the Report on Pathways to Education produced by Goss Gilroy Inc (GGI report) was used to weight “no certificate, diploma or degree” versus those that completed secondary school or higher. As per the GGI report, 57.6% of participants and 38.5% of the comparison group completed high school.
Among those that graduated high school, distributions observed among Ontario residents aged 25 to 64 as reported in the 2016 Census was applied. The Ontario data were used to remain consistent with the Toronto-area population analyzed by Lavecchia et al (2018). These can be found in Table C2.
| Highest education attainment | Share of total population (%) | Share of attainment of secondary and post-secondary education (%) |
|---|---|---|
| No certificate, diploma or degree | 10.4 | -- |
| High school diploma or equivalent | 24.5 | 27.3 |
| Apprenticeship or trades certificate or diploma | 6.2 | 6.9 |
| College, CEGEP or other non-university certificate or diploma | 24.7 | 27.5 |
| University certificate or diploma below bachelor level | 2.4 | 2.7 |
| University, diploma or degree at bachelor level or above | 31.9 | 35.6 |
Note: Sums may not add up to 100.0% due to rounding. Source: Statistics Canada, 98-402-X2016010-11 Highest level of educational attainment (general) by selected age groups 25 to 64, both sexes, percentage distribution 2016, Canada, provinces and territories, 2016 Census – 25% sample data. Visit Statistics Canada
Due to the inclusion of younger and older age categories in this sample, the level of educational attainment might be biased downwards slightlyFootnote 36. However, given the barriers to educational attainment often faced by the target population for the Program, this issue may be moot.
The average earnings level for each 5-year age category using this approach is reported in Table C3. This results in earnings estimates that are initially higher than our Straight-Line Projection approach, except after 40 years old when the Straight-Line Projection of income levels exceed the Educational Attainment approach.
| 25 to 29 | 30 to 34 | 35 to 39 | 40 to 44 | |
|---|---|---|---|---|
| Participants | $30,602 | $37,789 | $42,574 | $46,596 |
| Non-Participants | $28,940 | $35,284 | $39,028 | $42,337 |
| Difference (Incremental Impact) | +$1,663 | +$2,506 | +$3,547 | +$4,259 |
For all age categories, however, the incremental impacts exceeds the values produced under the Simple Projection, but follows a similar pattern of growth.
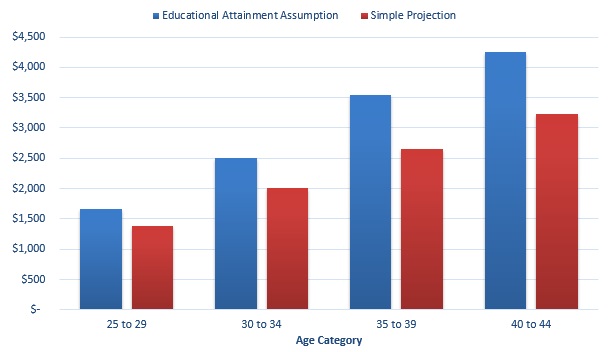
Figure 10: Incremental impacts (participant earnings minus non-participant earnings) of the straight-line projection approach versus the educational attainment approach – Text version
The graph depicts the incremental impacts, i.e. the participant earnings minus non-participant earnings, of the straight-line projection approach, in comparison with those of the educational attainment approach. The Straight-Line Projection approach produces a conservative estimate over the projection period and is derived from the initial observed data. As well, it follows a similar growth path in incremental impacts, and it requires fewer assumptions that need to be calibrated to the target population.
| 25 to 29 | 30 to 34 | 35 to 39 | 40 to 44 | |
|---|---|---|---|---|
| Educational Attainment Assumption | $1,663 | $2,506 | $3,547 | $4,259 |
| Simple Projection | $1,376 | $2,012 | $2,654 | $3,232 |
Conclusion
The Evaluation Directorate favoured the continued use of the Straight-Line Projection approach given that it: produces a more conservative estimate over the projection period; is derived from the initial observed data; follows a similar growth path in incremental impacts; and requires fewer assumptions that need to be calibrated to the target population.
Should the projection period be extended further, however, a re-evaluation of the income assumptions would be necessary and would likely require the introduction of more complex assumptions.