
Evaluation of the Workforce Development Agreements
On this page
- Executive summary
- Management response
- Introduction
- Workforce Development Agreements
- Evaluation objectives, governance, scope, questions and lines of evidence
- Evaluation findings
- Conclusions and recommendations
- References
- Appendix A: Evaluation matrix
- Appendix B: Key literature review findings
- Appendix C: Documents included in the document review
- Appendix D: Survey methodology and respondent profile
- Appendix E: Additional labour market outcome tables
List of abbreviations
- ESDC
- Employment and Social Development Canada
- WDAs
- Workforce Development Agreements
- P/Ts
- Provinces and territories
List of charts
- Chart 1: Percentage of participants who identified pre-participation labour market needs
- Chart 2: Number of P/Ts experiencing challenges with each of the WDAs’ provisions
- Chart 3: Percentage of missing values in socio-demographic variables for the 132,402 WDA participants in 2020 to 2021
- Chart 4: Number of P/Ts reporting employer-sponsored training data by value
- Chart 5: Percentage of national survey respondents who reported that their labour market needs were addressed by the WDA programs and services they received
- Chart 6: Percentage of national survey respondents who reported being completely or very satisfied with the WDA program or service they received
List of tables
- Table 1: P/T funding allocation for fiscal years 2017 to 2018 and 2018 to 2019.
- Table 2: Preliminary profile of 132,402 WDA participants in 2020 to 2021
- Table 3: Programs and services provided to persons with disabilities
- Table 4: Missing values in participant data upload by P/Ts
- Table 5: Employment rates and changes in employment rates at 3 points in time, by WDA program and service for all national survey participants
- Table 6: Employment rates and changes in employment rates of national survey respondents at 3 points in time, by employment status at the beginning of their WDA participation
- Table 7: Employment rates and changes in employment rates at 2 points in time in the British Columbia survey, by employment status at the beginning of respondents’ WDA participation
- Table 8: Employment rates and changes in employment rates at 3 points in time, for all national survey participants by population subgroup
- Table 9: Weekly earnings and change in weekly earnings at 3 points in time, by WDA program or service, for all national survey respondents
- Table 10: Weekly earnings and change in weekly earnings at 3 points in time of national survey respondents, by employment status at the beginning of their WDA participation
- Table 11: Weekly earnings and change in weekly earnings at 3 points in time, by population subgroup, for all national survey participants
Alternate formats

Large print, braille, MP3 (audio), e-text and DAISY formats are available on demand by ordering online or calling 1 800 O-Canada (1-800-622-6232). If you use a teletypewriter (TTY), call 1-800-926-9105.
Executive summary
The Workforce Development Agreements (WDAs) are a key mechanism to provide training and employment supports to Canadians. Through bilateral agreements with provinces and territories (P/Ts), financial support is provided for the design and delivery of programs and services to help participants obtain the training, skills, and work experience they need to improve their labour market outcomes. The agreements also allow for the provision of support to employers seeking to train current and future employees.
The agreements’ broad participant and program eligibility criteria aim to give P/Ts the flexibility they need to design and deliver programs and services that meet their jurisdictions’ labour market needs. The agreements aim to support those who are further away from the labour market or are underemployed, and include targeted funding for persons with disabilities as well as funding that can be used to serve other underrepresented groups, such as Indigenous peoples, youth, older workers, women, immigrants and newcomers to Canada.
Evaluation objectives
- Describe the types of programs and services funded by the agreements and the delivery approaches
- Identify the labour market needs and priorities that the agreements are being used to address
- Examine the labour market outcomes observed for participants
- Identify strengths and challenges associated with the design and implementation of the agreements
The WDA investment
With a total on-going annual funding envelope of $722M, an additional $900M over 6 years from April 2017 to March 2023, as well as an additional $1.5B in 2020 to 2021 to support economic recovery, the WDAs provide training and employment supports to Canadians, particularly those further from the labour market, through bilateral agreements with provinces and territories (P/Ts).
Evaluation methodology
The evaluation uses a mix of qualitative and quantitative methods to address the evaluation questions:
- 5 literature reviews
- a document review
- a national survey of 5,707 WDA participants and a survey of 3,017 participants in British Columbia
- 64 key informant interviews with ESDC officials, P/T representatives, and service provider/caseworkers who work with persons with disabilities
- an assessment of program data provided by the P/Ts
Key findings
- Nearly 132,400 individuals participated in 291,200 WDA-funded programs and services in the 2020 to 2021 fiscal year
- The agreements reached targeted participants, namely those who are unemployed or further from the labour market, as well as members of underrepresented groups
- Survey respondents’ employment rate increased by 16 percentage points post-participation, nationally from 48% to 64%, and in British Columbia from 66% to 82%
- The employment rate of those who were unemployed pre-participation increased by 43 percentage points post-participation nationally and 62 percentage points in British ColumbiaFootnote 1
- 36% of the national survey respondents reported earning more post-participation, and an average weekly earnings increase of $90
- Approximately 70% of national survey participants attributed the increase in their employment and earnings (in part or to a great extent) to the WDA programs or services they received
- 74% of national survey participants reported a high level of satisfaction with the programs and services they had received
- While challenges have been identified, almost all P/Ts emphasized that the WDAs are, overall, flexible enough to meet their needs and to respond to their priorities
Challenges and lessons learned
Key informants identified challenges relating to the agreements’ provisions and implementation.
- P/T representatives in all 12 jurisdictions identified the insufficient funding level as the most important challenge associated with the agreementsFootnote 2
- ESDC officials acknowledged that WDA participants are generally further away from the labour market and require more intensive programs and services to improve their labour market outcomes
- More flexibility with respect to how funding can be used (year-to-year carryover funds, and administrative funds) would further enable P/Ts and third-party service providers to respond to labour market needs
- Third-party service provider staff retention and service continuity represent ongoing challenges, which have repercussions on service delivery and participant outcomes
- These can be exacerbated by the lack of multiyear funding provided by P/Ts to service providers
- Lack of clarity among service providers and P/Ts with respect to program, service, and participant eligibility criteria can hamper program/service design and delivery
- All P/Ts identified challenges meeting some of the WDAs’ performance measurement provisions (such as data collection and reporting, and outcome and performance indicators)
- Most P/Ts identified challenges meeting the agreements’ annual reporting provisions, such as:
- delays in receiving data from service providers
- difficulty coordinating reporting from different P/T departments
- lack of alignment between federal and P/T reporting timelines
- duplication of efforts between the WDAs and Labour Market Development Agreements deliverables
The literature reviews and key informant interviews with P/T representatives and service providers/caseworkers identified lessons learned relating to the implementation and delivery of WDA programs and services.
- Meeting the needs of participants who are further from the labour market is resource intensive, requiring a broad spectrum of coordinated life stabilization,Footnote 3 health, mental health, education, pre-employment, employment, and employment maintenance supports and services offered over a longer time period
- Providing services to those who are further away from the labour market requires stable services and skilled staff who develop relationships of trust with participants, employers, and other service providers over time
- Wage subsidies are effective in helping to overcome barriers to labour market entry, particularly when combined with intensive employment services
- Although resource intensive, skills development and training are associated with more significant long-term improvements in earnings and career advancement
- When assisting those who are further from the labour market, using a dual model that focuses simultaneously on the needs of participants and those of employers, and that provide ongoing support to employers to deal with issues as they arise once they have hired a participant, leads to more successful outcomes
Capacity to assess the impact and effectiveness of the WDAs in the future
The transfer agreements require the assessment of the impact and effectiveness of funded programs and services. Based on established practices, this is achieved by comparing the outcomes of participants with those of similar non-participants (comparison group). However, building a comparison group requires access to a wide range of socio-demographic and labour market information on participants and similar non-participants.
A data assessment was conducted to determine the extent to which the participant data, and other available data sources, could be used to meet the agreements’ evaluation requirements. Overall, the data assessment revealed that assessing the impact and effectiveness of the WDA programs and services, as is done for the Labour Market Development Agreements, will be more challenging. This is especially the case for employer-sponsored training and programming for persons with disabilities.
A number of steps would enhance the ability to assess the impact and effectiveness of the WDA-funded programs and services in the future.
For exploration purposes, access to data on Employment Insurance applicants deemed to be not eligible, to P/T social assistance data and to data on immigration and citizenship, maintained by Statistics Canada, may further enable the building of comparison groups for some participants (for example, social assistance recipients, immigrant and visible minority participants).Footnote 4
In the case of employer-sponsored training,Footnote 5 this type of training does not lend itself to the construction of a comparison group given the fact that participants are already employed. In that context, the transfer agreements’ performance measurement strategy does not currently require the collection of data on these participants. Therefore, future evaluation would focus on assessing the relevance of investing in these programs using qualitative data on employers and the type of training provided.
Based on recent studies and on qualitative information collected from 40 organizations across Canada who provide services for persons with disabilities,Footnote 6 additional information on the severity of their disability and/or their capacity to work full-time would enable a sound interpretation of observed labour market outcomes and estimated impacts if adequate comparison groups were found.
Recommendations
A total of 3 recommendations emerge from the evaluation findings.
Challenges associated with assisting person with disabilities to integrate into the labour market
Recommendation 1
To support program and service delivery, ESDC and P/Ts are encouraged to share and discuss the lessons learned, best practices and challenges associated with serving persons with disabilities and individuals who are further removed from the labour market.
Rationale for recommendation 1
As noted in the report, third-party service providers interviewed as part of the evaluation reported the following challenges:
Staff retention and service continuity represent ongoing challenges, which have repercussions on service delivery and participant outcomes. These can be exacerbated by the lack of multiyear funding provided by P/Ts to service providers.
Meeting the needs of participants who are further from the labour market is resource intensive, requiring a broad spectrum of coordinated life stabilization,Footnote 7 health, mental health, education, pre-employment, employment, and employment maintenance supports and services offered over a longer time period. Providing services to those who are further away from the labour market requires stable services and skilled staff who develop relationships of trust with participants, employers, and other service providers over time. These approaches to service delivery are resource intensive.
Program and participant eligibility criteria
Recommendation 2
Building on existing flexibilities in addressing labour market challenges, ESDC and P/Ts are encouraged to continue working to ensure that the WDA programming responds to the needs of the ever-evolving labour market and discuss ways to reach more individuals who are further removed from the labour market.
Rationale for recommendation 2
Existing flexibility in terms of program, service, and participant eligibility criteria is widely appreciated by P/Ts and third-party service providers alike. Some P/Ts and over half of interviewed third-party service providers indicated that having more clarity around what is eligible and ineligible for funding would enable them to take fuller advantage of the WDA’s flexible eligibility criteria. Specifically, key informants reported that more clarity would be beneficial around:
- identifying programs and services that are eligible and ineligible for funding
- identifying participants who are eligible and ineligible for assistance
- defining what flexibility exists to offer pre-employment programs and services (such as mental health counselling, addictions counselling, and access to housing and transportation)
- this would help third-party service providers to understand which types of programs and services can be funded under the transfer agreements in their jurisdiction, and to develop their proposals
Data collection
Recommendation 3
ESDC and P/Ts are encouraged to discuss what further steps could be taken to facilitate the collection of data necessary to assess the impact of the WDA programming and demonstrate the results to Canadians.
Rationale for recommendation 3
As observed in the report and based on the first year of participant data uploaded (2020 to 2021), challenges around the completeness of the data collected in some P/Ts could limit the ability to assess the impacts of WDA programs and services in these jurisdictions in the future. Key informants identified issues relating to third-party service provider capacity (such as access to IT systems, software, and human resources), P/T capacity (such as access to appropriate IT systems, limited human resource capacity), and barriers to interdepartmental data collection, sharing, and reporting in some P/Ts.Footnote 8 Similar challenges were observed for the requirement to report aggregate-level information on employer-sponsored training. It is also acknowledged that the pandemic may have exacerbated participant data collection challenges.
Management response
ESDC would like to thank all members of the WDA Evaluation Steering Committee, including the Evaluation Working Group, for their valuable contributions to this evaluation of the Workforce Development Agreements.
The findings demonstrate that the Workforce Development Agreements reach the intended participants, namely those who are unemployed or further from the labour market, as well as members of underrepresented groups. During the period covered by the evaluation, nearly 15% of WDA participants were older workers, 22% were youth, 60% were persons with disabilities, 19% were immigrants, and 6.5% were indigenous peoples.
Results of the national survey of WDA participants, conducted as part of the evaluation, demonstrate efficacy of programming under the agreements.
- Nearly 75% of survey participants indicated that they were either completely or very satisfied with the program or service they received
- Over 70% have indicated that the WDA programs and services they received addressed their labour market needs
- Employment rate for those who were unemployed pre-participation increased by 43 percentage points post-participation
- Survey respondents reported earning an average of $90 more per week
The findings of the evaluation demonstrate the impact of these agreements and point to opportunities for collaboration with PTs on how they could be further strengthened to respond to the changing labour market conditions and continue to benefit employers and workers across the country. ESDC is looking forward to engaging with P/Ts on the identified strands of work.
Recommendation 1
To support program and service delivery, ESDC and P/Ts are encouraged to share and discuss the lessons learned, best practices and challenges associated with serving persons with disabilities and individuals who are further removed from the labour market.
Management response
As the evaluation shows, the WDAs reach members of underrepresented groups and those further away from the labour market: 60% of participants covered by the scope of this study were persons with disabilities, 47% were unemployed, and most (56%) had low educational attainment (high school diploma or less). The surveys of WDA participants showed that WDAs lead to positive outcomes, such as an increased employment rate for those who were unemployed pre-participation and increased weekly earnings.
In order to identify opportunities to further enhance participant outcomes under the WDAs, ESDC will discuss with each of the P/Ts, the lessons learned, best practices and challenges associated with serving persons with disabilities and individuals who are further removed from the labour market.
In addition, ESDC will collect and analyse P/T feedback on the impact of temporary flexibilities introduced in response to COVID-19 in 2020 to 2021 on the WDA programs and services.
Recommendation 2
Building on existing flexibilities in addressing labour market challenges, ESDC and P/Ts are encouraged to continue working to ensure that the WDA programming responds to the needs of the ever-evolving labour market and discuss ways to reach more individuals who are further removed from the labour market.
Management response
P/Ts have the flexibility to establish eligibility criteria for their programs and services within the broad parameters set out in the WDAs, which specify eligible costs, beneficiaries and programs. Findings of this evaluation demonstrate that currently the WDAs reach the target populations, particularly those further from the labour market. In particular, based on interviews, the evaluation reveals that the WDAs are an effective labour market program for P/Ts.
- In most (11) jurisdictions, P/T representatives reported that the WDAs provided their jurisdiction with the flexibility to design and deliver employment programs and services aimed at addressing the needs of the local labour market and labour force
- Three P/Ts found that the WDAs are more flexible than the Labour Market Development Agreements, and that the WDAs allowed them to cover gaps in the Labour Market Development Agreements’ program and participant eligibility criteria
The evaluation also illustrates that the WDAs contribute to improving participants’ labour market outcomes and help to meet participants’ skill development and work experience needs. In the national survey of WDA participants, over 70% of respondents indicated that the WDA program or service they received addressed their labour market needs.
ESDC will work with P/Ts to ensure that the WDAs continue to respond to the rapidly evolving labour market conditions and needs of those further from the labour market and to identify ways to improve the labour market outcomes of an even higher number of Canadians. In particular, ESDC and P/Ts will discuss the impact of the WDA funding, including the additional investments provided through Budget 2017 and those in response to the COVID-19 pandemic, on P/T labour markets and identify lessons learned to inform future policy decisions.
Recommendation 3
ESDC and P/Ts are encouraged to discuss what further steps could be taken to facilitate the collection of data necessary to assess the impact of the WDA programming and demonstrate the results to Canadians.
Management response
ESDC has been working with P/Ts to implement data collection requirements of the WDAs since their introduction in 2017. All twelve jurisdictions with WDA information sharing agreements are currently providing data in accordance with the Performance Measurement Strategy. Work is underway to finalize an information sharing agreement with the remaining jurisdiction.
In addition, ESDC has worked with P/Ts to streamline annual planning and reporting requirements. ESDC and P/Ts will explore opportunities to further align LMDA and WDA reporting requirements to reduce duplication.
ESDC will continue to work with P/Ts to ensure that all stakeholders are well equipped to collect, compile, and share data necessary to assess the results of the WDA programming.
Introduction
This report presents the main findings and conclusions from the evaluation of the Workforce Development Agreements (WDAs). Employment and Social Development Canada (ESDC) worked jointly with 12 Provinces and Territories (P/Ts) to undertake the evaluation.
Evaluation objectives
- Describe the types of programs and services funded by the agreements and the delivery approaches
- Identify the labour market needs and priorities that the agreements are being used to address
- Examine the labour market outcomes observed for participants
- Identify strengths and challenges associated with the design and implementation of the agreements
Lines of evidence
Five literature reviews
The literature reviews summarise Canadian and international literature on effective labour market programs and services to assist specific population groups. These included immigrants and newcomers to Canada, Indigenous peoples, older workers, persons with disabilities, social assistance recipients and youth.
A document review
The review of federal, provincial, and territorial government documents provides insight on the design, implementation, and use of WDA programs and services.
Surveys of WDA participants
Two surveys were conducted to identify the short-term labour market outcomes for participants in WDA programs and services. These included:
- a survey of 5,707 participants in 8 jurisdictions
- a survey of 3,017 participants in British Columbia
Key informant interviews
Sixty-four key informant interviews with 110 individuals representing the federal and provincial/territorial governments and service providers were conducted. These include:
- 2 interviews with 6 federal ESDC officials
- 19 interviews with 47 P/T government officials in 12 jurisdictions
- 43 interviews with 57 case workers and service providers who provide WDA-funded programs and services to persons with disabilities
A data assessment
The assessment examines the extent to which the program data collection provisions under the performance measurement strategy were met.
The evaluation report is organised as follows:
- introduction providing a succinct summary of the evaluation objectives and lines of evidence
- overview of the WDAs
- overview of the evaluation scope and methodology
- evaluation findings
- key evaluation findings and recommendations
Workforce Development Agreements
Introduced in 2017, the WDAs are bilateral funding agreements between the Government of Canada and each P/T Government. The agreements support the delivery of employment and training programs and services for Canadians and employers. The WDAs consolidated and replaced the Canada Job Fund Agreements,Footnote 9 the Labour Market Agreements for Persons with Disabilities,Footnote 10 and the Targeted Initiative for Older Workers. They complement the long-standing Labour Market Development Agreements, which have similar goals.Footnote 11
The WDAs are open-ended agreements, with a total on-going annual funding envelope of $722 million. The Government of Canada allocated an additional $900 million to the WDAs over the 6 fiscal years from April 2017 to March 2023.Footnote 12 In the 2020 to 2021 fiscal year another $1.5B was allocated to the WDAs to support economic recovery efforts in response to the impacts of the COVID-19 pandemic.
This section provides an overview of the agreements’ program objectives, eligible activities, eligible participants and employers, accountability framework, program funding, and evaluation provisions.
Program objectives
The WDAs support the provision of employment and training supports to Canadians. They aim to help participants improve their labour market outcomes. The agreements seek to provide P/Ts with the flexibility they need to address their labour market priorities and respond to emerging issues.
Overall, the WDAs:
- support Canadians, including those who are further away from the labour market, to develop the skills needed to find, keep, and advance in jobs, or reorient their careers
- require that a dedicated portion of each P/Ts’ annual allocation be used for programming for persons with disabilities
- P/Ts are also required to provide cost-matched programming
- can be used to provide supports to members of other underrepresented groups, which can include, for example:
- Indigenous peoples
- women
- youth
- older workers
- newcomers to Canada
- support employers seeking to train current or future employees
- encourage research and innovative projects to test new approaches to programs and service delivery
- complement the Labour Market Development Agreements, which focus primarily on unemployed workers with some connection to the Employment Insurance Program
Eligible activities
Examples of eligible activities include the following:
- skills training
- on-the-job training and workplace-based skills upgrading
- group interventions and job readiness assistance
- financial assistance and benefits related to the delivery of an eligible program
- employment counselling and services
- labour market connections
- employment opportunities or experiential learning and on the job development
- employer-sponsored training
Eligible participants and employers
Eligible participants and employers include the following:
- Canadian citizens
- permanent residents
- protected persons as per Immigration and Refugee Protection Act entitled to work in Canada
- employers, with the exception of federal and P/T governments, and federal crown corporations and agencies
WDA accountability framework and evaluation provisions
The agreements have an accountability framework and evaluation provisions.
As part of the accountability framework P/Ts produce and provide annual plans and annual reports to ESDC.P/Ts collect and report data on participants, programs and services to ESDC. Data is reported on a quarterly basis according to the provisions set out in the agreements. This provision took effect on April 1, 2020.Footnote 13
As part of the evaluation provisions: ESDC and P/Ts have a joint responsibility for the evaluation of the agreements. Together, they must ensure that funding is spent on programming and services that produce meaningful employment results for Canadians. All P/Ts, with the exception of Quebec, participated in the national level evaluation. Quebec is responsible for the conduct of its own evaluation activities. The evaluation is to be completed by March 31, 2022.
WDA program funding
Table 1 presents the transfer agreements allocation by P/T for the 2017 to 2018 and 2018 to 2019 fiscal years.
| Province/Territory | 2017 to 2018 | 2018 to 2019 |
|---|---|---|
| Newfoundland and Labrador | $13,324,443 | $13,198,830 |
| Prince Edward Island | $3,884,484 | $3,881,167 |
| Nova Scotia | $23,318,201 | $23,273,724 |
| New Brunswick | $18,129,668 | $18,185,042 |
| Quebec | $177,714,656 | $176,480,928 |
| Ontario | $296,579,293 | $296,494,169 |
| Manitoba | $29,442,783 | $29,462,080 |
| Saskatchewan | $28,557,595 | $28,366,230 |
| Alberta | $91,076,291 | $90,783,116 |
| British Columbia | $105,545,197 | $107,447,325 |
| Yukon | $3,142,463 | $3,142,463 |
| Northwest Territories | $3,142,463 | $3,142,463 |
| Nunavut | $3,142,463 | $3,142,463 |
| National | $797,000,000 | $797,000,000 |
Evaluation objectives, governance, scope, questions and lines of evidence
Evaluation objectives
- Describe the types of programs and services funded by the agreements and the delivery approaches
- Identify the labour market needs and priorities the agreements are being used to address
- Examine the short-term outcomes observed for WDA participants
- Identify strengths and challenges associated with the design and implementation of the agreements
Appendix A presents a complete list of evaluation issues and questions.
Evaluation governance
The evaluation was overseen by an Evaluation Steering Committee. The committee was composed of representatives from P/Ts, the ESDC Evaluation Directorate, and the ESDC Skills and Employment Branch. An Evaluation Working Group, composed of members of the Evaluation Steering Committee, provided further guidance and support throughout the evaluation process.
Evaluation scope
The evaluation is national in scope. While some information was collected at the P/T level, the evaluation report summarizes information at the national level. The key outcome is a national evaluation synthesis report pertaining to the design and delivery, and short-term post-program outcomes for participants. The evaluation focused on participants who started and completed a WDA-funded program or service between April 1, 2018 and September 30, 2019. All provinces and territories, with the exception of Quebec, were included in the evaluation. Quebec is responsible for the conduct of its own evaluation activities.
Evaluation methodology and lines of evidence
The WDA evaluation relies on multiple lines of evidence: literature reviews, a document review, surveys of participants, key informant interviews, and a data assessment. Using multiple lines of evidence helped to corroborate findings and to increase general confidence in the evaluation results. For a complete summary of how each line of evidence is used to address specific evaluation questions and issues, please consult Appendix A.
Literature reviews
Five literature reviews summarising Canadian and international literature on effective programs and services to support the labour market integration underrepresented groups were completed. Specifically, the literature reviews focus on the following population groups:
- immigrants and newcomers to Canada
- Indigenous peoples
- older workers
- persons with disabilities
- social assistance recipients and youth
A summary of literature review findings is provided in Appendix B.
Document review
A document review of federal, provincial, and territorial government documents on the design, implementation, and use of the WDA programs was undertaken. The document review also summarised any documented best practices and lessons learned though the implementation and delivery of WDA-funded programs and services. A list of documents included in the document review is provided in Appendix C.
Surveys of WDA participants
Surveys of WDA participants were undertaken to identify their short-term labour market outcomes.Footnote 14 Two surveys were conducted.
- A survey of 5,707 individuals in 8 jurisdictions who started and completed participating in WDA-funded programs and services between April 1, 2018 and September 30, 2019Footnote 15
- Respondents could choose to participate over the phone or to complete the questionnaire online
- The survey received a completion rate of 19%, which represents a margin of error of +/- 1.1% with a 95% confidence levelFootnote 16
- A survey conducted by British Columbia of 3,017 individuals in its jurisdiction who started participating in WDA-funded programs and services during the same reference period as the national survey
- Program participants were surveyed 3 months post-intervention, and those who responded to the 3-month survey were surveyed again 9 months later (12 months post-intervention)
- The findings presented in this report are based on the 12-month survey
- The survey received a response rate of 66%, which represents a margin of error of +/- 1.02% with a confidence level of 95%
More information on the survey methodologies and samples is provided in Appendix D.Footnote 17
Key informant interviews
A total of 64 key informant interviews were conducted.
- Two interviews with 6 federal ESDC officials and 19 interviews with 47 P/T government officials in 12 jurisdictions
- The interviews capture their perspectives on key issues related to the governance, design, delivery, and implementation of the transfer agreements
- Forty-three interviews with 57 caseworkers and service providers who provide WDA-funded programs and services to persons with disabilities
- The interviews capture their perspectives on the successes and challenges associated with the design and delivery of these programs and services
Interviews were conducted over the telephone or through video conference calls using a standard interview questionnaire.
Data assessment
A data assessment was completed to examine the extent to which the WDA data collection provisions under the performance measurement strategy are met. The assessment relies on data uploaded by P/Ts to ESDC since April 1, 2020. It includes only participants who started their programs and services after March 31, 2020.
Evaluation limitations
Data collection for the evaluation, including for the key informant interviews and the surveys, took place during the COVID-19 pandemic. The pandemic negatively affected labour markets across Canada. Accordingly, the evaluation includes contextual findings, taken from the key informant interviews, on the pandemic’s impact on WDA program and service design and delivery. The evaluation also sought to control for the pandemic’s impact on participants’ labour market outcomes. To this end, survey respondents were questioned about their labour market outcomes both before and after the start of the pandemic.
The evaluation faced some limitations related to adequately assessing the impact and effectiveness of WDA programs and services on participants.
First, individual-level participant data enabling the construction of comparison groups, which would have been required to conduct an impact analysis, was not available. Therefore, the evaluation relied exclusively on participant surveys to assess the labour market outcomes of participants in WDA-funded programs and services. The surveys asked respondents to provide pre/post-participation employment and earning information. The national survey also asked participants to assess the extent to which employment and earning outcomes can be attributed to their participation in a WDA-funded program or service. However, surveys are subject to a range of limitations, including but not limited to recall errors, non-response bias, and sampling errors.Footnote 18 Accordingly, definitive conclusions about the impact and effectiveness of WDA-funded programs and services cannot be drawn from this evaluation. Nevertheless, the surveys provides unique insights regarding the labour market outcomes of program participants and their perception of program effectiveness.
Second, following consultations with participating P/Ts, numerous programs and services were excluded from the national survey. This was due mainly to the lack of participant contact information and/or because written consent permitting the transfer of contact information to ESDC had not been obtained. These issues applied to many programs targeting persons with disabilities.Footnote 19 Accordingly, persons with disabilities are underrepresented in the national survey of WDA participants.Footnote 20 This limitation was in part addressed through the inclusion of key informant interviews with service providers and caseworkers who work with persons with disabilities.
Third, when comparing the profile of national survey respondents to the preliminary profile of the 2020 to 2021 participants, important differences were noticed. These differences related to participants’ education levels, immigration history, and employment status at the beginning of participation.Footnote 21 These limitations, combined with the exclusion of numerous programs and services from the survey, impact the extent to which the national survey is representative of all participants.
Fourth, the 12-month survey sample used for the British Columbia survey consists only of participants who completed the 3-month survey. Accordingly, the results may be skewed depending on who responded to the 3-month survey.
Finally, key informant interviews confirmed that the type and severity of participants’ disability have a direct impact on their labour market goals. The type and severity of disabilities impact participants’ capacity to work on a full-time basis. Inability to secure and maintain full-time employment with benefits can deter participants from accepting paid work when it jeopardises their access to publicly-funded disability supports and benefits. These considerations have a direct impact on the interpretation of employment and earnings outcomes collected through the surveys of WDA participants.
Evaluation findings
Evaluation findings are organized around 4 main evaluation issues:
- program design and delivery
- supports for employers
- governance, planning, reporting and accountability
- labour market outcomes for participants in WDA-funded programs and servicesFootnote 22
Program design and delivery
Labour market priorities, objectives, and challenges addressed through the WDAs
P/Ts address a range of labour market priorities, objectives, and challenges through the WDAs. The document review and interviews with P/T representatives identified 6 main labour market objectives and priorities being targeted through the WDAs:
- improving and increasing training to align participants’ skills with labour market needs (11 P/Ts)
- improving participants’ labour market participation (11 P/Ts)
- improving the labour market participation of specific population sub-groups (11 P/Ts)
- improving labour market participation in specific sectors and industries (9 P/Ts)
- expanding education initiatives, such as adult literacy and essential skills, continuous learning, post-secondary education, workplace educationFootnote 23 (6 P/Ts)
- increasing the size and/or productivity of the workforce (6 P/Ts)
The document review also identified 4 main challenges that P/Ts seek to address through the transfer agreements:
- high unemployment and few job openings, including downturns in key sectors and industries (7 P/Ts)
- serving geographically dispersed populations living in rural and remote areas (4 P/Ts)
- access to a workforce with the skills, training and education to meet labour market needs (4 P/Ts)
- employee retention (3 P/Ts)
Programs and services funded through the WDAs
P/Ts employ the WDAs to offer a variety of programs and services targeting specific sectors and industries, unemployed or underemployed jobseekers, and vulnerable populations.Footnote 24
Types of programs and services funded through the agreements include:
- skills training, such as occupational skills training, short-term training, and on-the-job training (12 P/Ts)
- employer-sponsored training (12 P/Ts)
- programs and services for persons with disabilities (12 P/Ts)
- programs and services that target other vulnerable groups (such as youth, women, Indigenous peoples, newcomers, older workers or the unemployed) (10 P/Ts)
- work experience programs for unemployed or underemployed participants, such as apprenticeships, job placements, and paid work experience (10 P/Ts)
- employment assistance services, such as resume writing, job search, interview practice (10 P/Ts)
- pre-employment supports, such as literacy, basic adult education, essential skills training, and official language training (6 P/Ts)
- wage subsidies (4 P/Ts)
These programs and services are often combined to meet specific needs, such as skills training programs for specific marginalised populations. All P/Ts have contracts with third-party service providers to deliver a variety of WDA-funded program and services, including those aiming to assist specific subgroups. Some P/Ts rely on these contracts exclusively for service delivery while others employ a mixed model including direct government delivered services.
Sectors and industries targeted through the agreements
Sectors and industries targeted for labour force development through the agreements include:
- construction and manufacturing (6 P/Ts)
- services and tourism (6 P/Ts)
- communication and technology (5 P/Ts)
- health care and social assistance (5 P/Ts)
- professional and scientific (5 P/Ts)
- raw materials industries (4 P/Ts)
- transportation (4 P/Ts)
- mining and forestry (3 P/Ts)
- agriculture (fewer than 3 P/Ts)
Population subgroups targeted through the agreements
Key subgroups targeted for assistance under the agreements include:
- persons with disabilities (12 P/Ts)
- Indigenous peoples (10 P/Ts)
- newcomers and immigrants (10 P/Ts)
- youth, including at-risk youth (10 P/Ts)
- unemployed participants (9 P/Ts)
- women (7 P/Ts)
- older workers (6 P/Ts)
- Social assistance recipients (3 P/Ts)
- visible minorities (3 P/Ts)
- low-income individuals, people involved with the justice system and rural workers (Fewer than 3 P/Ts each)
Profile of 2020 to 2021 WDA participants
Nearly 132,400 individuals participated in 291,200 WDA-funded programs and services in 2020 to 2021.Footnote 25 On average, every participant took 2.2 programs and/or services. Table 2 presents the preliminary profile of participants by key socio-demographic variables. Considering the scope and the target population under the WDAs, it is noted that:
- nearly 15% of participants were older workers and 22% were youth
- persons with disabilities represent 60% of participants
- immigrants accounted for 19% of participants
- Indigenous participants accounted for 6.5% of participants
- nearly 39% of participants were employed or self-employed at the start of participation
- unemployed participants represented 47% of the total participants and 7% were out of the labour force at the start of participation
Compared to the profile of national survey respondents, it is noted that:
- persons with disabilities represent 60% of participants in 2020 to 2021 compared to 14% of the national survey respondents
- immigrants represent 19% of participants in 2020 to 2021 compared to 37% for national survey respondents
- participants with less than a high-school degree represent 27% of participants in 2020 to 2021 compared to 15% of national survey respondents
- participants with a university degree represent 6% of participants in 2020 to 2021 compared to 29% of national survey respondents
| Characteristics | % of WDA participants |
|---|---|
| Gender: Female | 50.5 |
| Gender: Male | 48.9 |
| Age: 15 to 24 | 21.7 |
| Age: 25 to 54 | 63.5 |
| Age: 55 and over | 14.7 |
| Indigenous (self-reported) | 6.5 |
| Persons with disabilities (self-reported) | 60.1 |
| Visible minorities (self-reported) | 7.6 |
| Immigrants (self-reported) | 19 |
| Marital status: Single | 58 |
| Marital status: Married or common-law | 24.7 |
| Education level: Less than high school | 27.3 |
| Education level: High school diploma or equivalent | 28.7 |
| Education level: Some post-secondary training | 4.6 |
| Education level: College or other non-university certificate or diploma | 6.4 |
| Education level: University certificate of diploma | 3.4 |
| Education level: University degree | 6.2 |
| Programs and services: Employment assistance services | 63.4 |
| Programs and services: Skills development | 26 |
| Programs and services: Targeted earnings supplements | 6.6 |
| Programs and services: Targeted wage subsidies | 1.9 |
| Programs and services: Job creation partnerships | 1.9 |
| Programs and services: Self-employment assistance | 0.2 |
| Employment status at start of action plan: Unemployed | 47.3 |
| Employment status at start of action plan: Employed | 35.6 |
| Employment status at start of action plan: Self-employed | 3.6 |
| Employment status at start of action plan: Not in the labour force | 6.9 |
*Values may not equal to 100% due to rounding or missing information.
Labour market needs of WDA participants
National survey respondents identified their labour market needs at the start of their WDA participation; these are presented in Chart 1. Survey respondents could select all applicable categories.
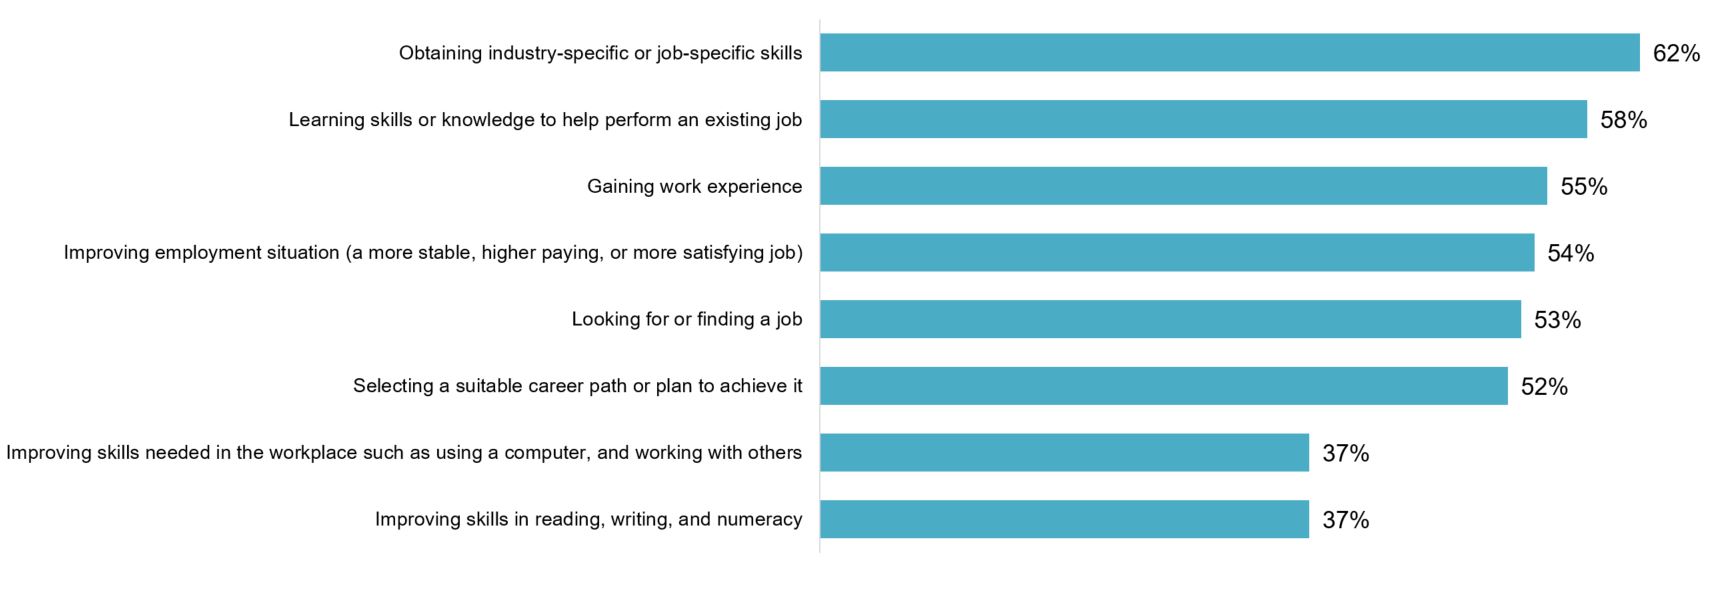
Text description – Chart 1
| Pre-participation labour market need | % of surveyed participants who reported having need |
|---|---|
| Improving skills in reading, writing, and numeracy | 37% |
| Improving skills needed in the workplace such as using a computer, and working with others | 37% |
| Selecting a suitable career path or plan to achieve it | 52% |
| Looking for or finding a job | 53% |
| Improving employment situation (a more stable, higher paying, or more satisfying job) | 54% |
| Gaining work experience | 55% |
| Learning skills or knowledge to help perform an existing job | 58% |
| Obtaining industry-specific or job-specific skills | 62% |
Programs and services provided to persons with disabilities
P/T representatives in 12 jurisdictions and 43 service providers/caseworkers who work in organizations that offer WDA-funded services to persons with disabilities across the country were interviewed. These interviews aimed to identify:
- the main challenges experienced by persons with disabilities and those who serve them
- the type of programs and services offered to them
- the best practices for supporting these participants to improve their labour market outcomes
Challenges and labour market needs experienced by persons with disabilities
Key informants identified a wide range of challenges experienced by persons with disabilities seeking entry and advancement in the labour market.
Societal attitudes
- Discrimination, stigma and lack of awareness on the part of employers and colleagues (51 key informants in 12 P/Ts)
Lack of service availability, affordability, and infrastructure
- Access to transportation (40 key informants in 12 P/Ts)
- Access to childcare (14 key informants in 9 P/Ts)
- Access to a reliable internet connection and to telecommunication technology to receive services and to participate in training and employment (6 key informants in 4 P/Ts)
Lack of accessibility supports
- Access to accessibility and accommodation supports (25 key informants in 12 P/Ts)
Poor health and wellbeing
- Mental health challenges, including trauma, and access to mental health services (17 key formants in 10 P/Ts)
- Inability to work full-time (14 key informants in 8 P/Ts)
- Low self-confidence (12 key informants in 8 P/Ts)
- Substance use (7 key informants in 6 P/Ts)
Limited work opportunities and experience
- Lack of work opportunities and tight labour market (17 key informants in 9 P/Ts)
- Lack of work experience and gaps in resume (15 key informants in 10 P/Ts)
- Maintaining employment for some persons with disabilities (5 key informants in 4 P/Ts)
Need for essential skills development and education
- Lack of social and communication skills (20 key informants in 8 P/Ts)
- Lack of employment readiness and need for more pre-employment supports and essential skills training (15 key informants in 10 P/Ts)
- Low education and/or skill level (11 key informants in 6 P/Ts)
- Fewer pre-employment and employment opportunities for persons with disabilities, increasing the challenge of the school to work transition (8 key informants in 6 jurisdictions)
- Barriers to accessing training and education for persons with disabilities (5 key informants in 5 P/Ts)
Insufficient service navigation and coordination
- Service navigation, knowing which services are available and how to access them, in a poorly coordinated and a competitive service provider environment (11 key informants in 7 P/Ts)
Poverty and vulnerability
- Poverty and low-paying jobs (11 key informants in 6 P/Ts)
- Fear of losing benefits and the security that these represent inhibits after finding employment (9 key informants in 5 jurisdictions)
Cultural and language barriers
- Cultural and language barriers impeding persons with disabilities from accessing services, obtaining employment, and maintaining employment (7 key informants in 5 P/Ts)
In the territories, person with disabilities experience additional challenges. These include living in areas with poorer service infrastructure and fewer programs and services targeted toward their distinct labour market needs. These challenges are further exacerbated for those who live in remote areas.
Subgroup-specific labour market challenges and needs of persons with disabilities
Interviewed service providers and caseworkers were asked whether participants experience different challenges and labour market needs depending on their age or gender. Most (35 out of 43) of those interviewed reported that they did.
Youth: 25 service providers/caseworkers in 10 P/Ts reported that youth with disabilities are more likely to experience the following:
- lack of work experience (15 service providers/caseworkers in 9 P/Ts)
- mental health challenges (8 service providers/caseworkers in 5 P/Ts)
- need for more pre-employment supports (8 service providers/caseworkers in 4 P/Ts)
- school-to-work transition related challenges (4 service providers/caseworkers in 3 P/Ts)
Women: 19 service providers/caseworkers in 10 jurisdictions reported that women with disabilities are more likely to experience the following:
- lack of access to childcare (12 service providers/caseworkers in 8 P/Ts)
- discrimination based on sexism, traditional gender roles, and difficulty finding employment in male dominated industries (6 service providers/caseworkers in 6 P/Ts)
- gaps in resumes due to caregiving responsibilities (3 service providers/caseworkers in 3 P/Ts)
Older adults: 17 service providers/caseworkers in 8 P/Ts reported that older adults with disabilities are more likely to experience the following:
- ageism, assumptions about older workers’ abilities and character based on their age (7 service providers/caseworkers in 3 P/Ts)
- lack of technological literacy (6 service providers/caseworkers in 5 P/Ts)
- resistance to change (5 service providers/caseworkers in 3 P/Ts)
- age related decline (4 service providers/caseworkers in 4 P/Ts)
Men: 7 service providers/caseworkers in 6 P/Ts reported that men with disabilities are more likely to experience the following:
- mental health challenges (3 service providers/caseworkers in 3 P/Ts)
- outdated skills (3 service providers/caseworkers in 3 P/Ts)
- lack of technological literacy (3 service providers/caseworkers in 3 P/Ts)
- mismatched expectations about job prospects (3 service providers/caseworkers in 3 P/Ts)
Program design and delivery responsiveness to labour market needs of persons with disabilities
Most service providers and case workers (35 out of 43) reported that persons with disabilities are more likely to experience certain challenges based on their age and gender. However, only 7 service providers/caseworkers in 5 P/Ts reported having targeted programming based on age or gender. Most of these (in 4 out of 7 organizations with targeted programming) are school to work transition programs for youth.
In general, service providers and caseworkers reported that they assess each participant and provide services based on their unique needs, challenges, and strengths. These key informants identified a variety of approaches used by their organization to achieve this objective, including:
- individual-centred approaches (35 service providers/caseworkers in 12 P/Ts)
- strength-based approaches focusing on the strengths rather than the limitations of participants (11 service providers/caseworkers in 7 P/Ts)
- disability-specific services, such as services for individuals with autism, hearing impairments, or mental illnesses (10 service providers/caseworkers in 7 P/Ts)
- holistic approaches targeting a variety of employment and non-employment related needs to improve labour market outcomesFootnote 26 (10 service providers/caseworkers in 7 P/Ts)
- accessible programs and services designed to be inclusive of all participants regardless of personal characteristics, such as disability type, age, gender, and culture (6 service providers/caseworkers in 4 P/Ts)
- trauma-informed programs and services (4 service providers/caseworkers in 3 P/Ts)
- culturally grounded services for Indigenous peoples (4 service providers/caseworkers in fewer than 3 P/Ts)
Organizations often combine several of these approaches to determine participants’ needs.
Most (38) service providers and caseworkers reported that they take the severity and nature of participants’ disability into account when designing their programs and services. They use a variety of strategies when developing programs and services, including:
- assessments (27 service providers/caseworkers in 11 P/Ts)
- employer engagement (12 service providers/caseworkers in 8 P/Ts)
- stakeholder engagement (12 service providers/caseworkers in 7 P/Ts)
- environmental scans (11 service providers/caseworkers in 8 P/Ts)
- community engagement (11 service providers/caseworkers in 7 P/Ts)
- labour market reports (11 service providers/caseworkers in 7 P/Ts)
Most (35) service providers and caseworkers reported that over 20% of the participants with disabilities served by their organization require ongoing assistance for 2 years or more. In 11 of the organizations interviewed, over 80% of participants with disabilities require ongoing assistance.
Programs and services for persons with disabilities funded through the WDAs
P/T representatives in 12 jurisdictions and 43 service providers/caseworkers were asked to identify the types of WDA-funded labour market programs and services that they provide to persons with disabilities. Service providers could not always identify the source of funding for individual programs and services. Accordingly, the services identified by service providers/caseworkers may not all be funded through the WDAs.
Table 3 presents the list of programs and services provided to persons with disabilities according to the P/T representatives and service providers/caseworkers interviewed. There are important differences between the list of programs and services identified by P/T representatives and the list provided by service providers. This can be explained partially by the use of multiple sources of funds by service providers. It is also possible that not all P/T representatives provided a complete list of WDA-funded programs and services as part of this evaluation exercise.
| Program or service | # of P/Ts (out of 12) that fund the program or service through the WDAsFootnote 27 | # of interviewed service providers (out of 43) that offer the program or service | # of P/Ts (out of 12) where service providers reported offering the program or service |
|---|---|---|---|
| Job placements | < 3Footnote 28 | 39 | 12 |
| Short-term training | N/AFootnote 29 | 37 | 12 |
| Job maintenance supports | 8 | 21 | 11 |
| Paid work experience | < 3 | 28 | 11 |
| Pre-employment supports | 5 | 23 | 11 |
| Wage subsidies | 3 | 25 | 11 |
| Literacy and essential skills training | N/A | 27 | 10 |
| Employment services | 3 | 23 | 11 |
| Skills training | 6 | 18 | 10 |
| Occupational skills training | 3 | 14 | 8 |
| Assessments | < 3 | 10 | 6 |
| Accessibility and accommodations supports | 6 | < 3 | < 3 |
| School to work supports | 3 | 4 | 4 |
| Transportation supports | 4 | < 3 | < 3 |
| Employer/community education | 5 | < 3 | < 3 |
| Job development | < 3 | 5 | 3 |
| Community-based work assessments | N/A | 4 | 3 |
| Culturally grounded programs and services | N/A | 4 | < 3 |
Best practices to improve the labour market outcomes of persons with disabilities
The document review and interviews with P/T representatives and service providers/caseworkers identified a number of best practices to improve the labour market outcomes of persons with disabilities.
- Most effective service delivery approaches:
- providing services through a holistic approach (23 key informants in 12 P/Ts)
- providing services through an individual-centred approach (12 key informants in 8 P/Ts)
- comprehensively assessing participants’ employability and skills to develop individualised plans (9 key informants in 6 P/Ts)
- providing ongoing personalized services (reviewed documents of 7 P/Ts)
- collaborating with other service providers and coordinating service delivery (4 key informants in 4 P/Ts)
- Most effective labour market programs and services:
- providing job maintenance supports (22 key informants in 10 P/Ts)
- providing wage subsidies (22 key informants in 9 P/Ts)Footnote 30
- providing skills training (20 key informants in 10 P/Ts)
- providing job placements (15 key informants in 10 P/Ts)
- providing pre-employment services (11 key informants in 7 P/Ts)
- job development (11 key informants in 6 P/Ts)
- case management (5 key informants in 5 P/Ts)
- self-esteem building (5 key informants in 5 P/Ts)
- Employer education, engagement, and support:
- educating employers about hiring persons with disabilities (22 key informants in 10 P/Ts)
- conducting employer engagement activities (8 key informants in 7 P/Ts)
- providing HR type supports for employers (4 key informants in 4 P/Ts)
- Most effective supports:
- providing transportation (16 key informants in 9 P/Ts)
- providing accessibility and accommodation supports (11 key informants in 7 P/Ts)
- providing childcare supports (5 key informants in 5 P/Ts)
- Having skilled staff:
- having skilled staff to better assist persons with disabilities (8 key informants in 7 P/Ts)
Targeted services based on age and gender
Service providers and caseworkers were asked whether there were differences in terms of the programs and services that work best for persons with disabilities of different ages and genders. Most (23 service providers in 12 P/Ts) reported no differences. However, a significant minority (18 service providers in 11 P/Ts) reported that participants of different ages and genders benefit from targeted programs and services. Key informants identified targeted services for youth, older workers, women, and men.
- Youth benefit from targeted programs, such as school to work pre-employment supports (16 service provider in 10 P/Ts)
- Older workers benefit from targeted programs, such as technological literacy training support to adapt to changing workplaces (8 service providers in 7 P/Ts)
- Women benefit from targeted services to address gender specific barriers (6 service providers in 5 P/Ts)
- Men benefit from gender specific service delivery approaches (3 service providers in 3 P/Ts)
Support for employers
All jurisdictions provide WDA-funded programs and services to assist employers to address their labour market challenges and needs. In 10 jurisdictions, P/T representatives reported that employers in specific sectors and industries are targeted. These include:
- health care and social assistance (5 P/Ts)
- construction and manufacturing (4 P/Ts)
- mining and forestry (4 P/Ts)
- agriculture (3 P/Ts)
- essential services, food processing, hospitality and tourism, IT sector, oil and gas, professional and scientific services, and transportation (Fewer than 3 P/Ts each)
P/T representatives in 3 jurisdictions also reported that employers in rural and remote regions are targeted.
According to P/T representatives, the following employer needs are targeted through the WDAs:
- access to labour (6 P/Ts)
- employee training (6 P/Ts)
- employee retention (3 P/Ts)
- support to employ persons with disabilities (3 P/Ts)
- job matching (Fewer than 3 P/Ts)
The following types of programs and services are funded through the WDAs to address employers’ labour market challenges and needs:Footnote 31
- employer-sponsored training (12 P/Ts)
- job grants, financial assistance benefits, and wage subsidies (10 P/Ts)
- partnerships, employer engagement, working groups, and consultations (4 P/Ts)
- pandemic related programs to fill labour need through youth employment, training grants, and worker attraction and retention programs (Fewer than 3 P/Ts)
P/T representatives were asked whether the WDAs had been successful at assisting employers to address their labour market needs and challenges. P/T representatives in 6 jurisdictions responded that it had been successful. The other half were either unsure (5 P/Ts) or thought that the WDAs had been unsuccessful at assisting employers. In 4 jurisdictions, P/T representatives identified specific challenges that the WDAs were unable to address. Reported challenges include: improving access to labour; employer awareness of WDA-funded programs and services; and developing employer-friendly application and reporting processes (each in fewer than 3 P/Ts).
Interviewed service providers and case workers were asked about the programs and services they provide to help employers hire persons with disabilities. Thirty-three service providers and caseworkers (out of 43) reported that their organization offered services to employers. These included:
- employer education (24 service providers/case workers in 9 P/Ts)
- support with training and human resources issues (20 service providers/caseworkers in 9 P/Ts)
- wage subsidies (12 service providers/caseworkers in 9 P/Ts)
- job matching (10 service providers/caseworkers in 6 P/Ts)
- accessibility and accommodation supports (Fewer than 3 service providers/caseworkers)
Seven service providers/caseworkers in 5 P/Ts also reported that organized activities to publicly recognize employers who hire persons with disabilities.
Service providers/caseworkers identified several benefits of employer focused programs and services.
- Employee retention supports help employers to keep positions filled longer and reduces onboarding costs (20 service providers/caseworkers in 10 P/Ts)
- Employer education creates a more supportive environment for employees with disabilities (18 service providers/caseworkers in 9 P/Ts)
- Assistance with human resources issues helps employers feel supported, which lessens the perceived risks of hiring persons with disabilities (16 service providers/caseworkers in 9 P/Ts)
- Job matching services help employers to more easily access the labour they need (8 service providers/caseworkers in 6 P/Ts)
- Providing job-specific training to persons with disabilities saves employers time and resources (6 service providers/caseworkers in 4 P/Ts)
- Participants with disabilities have more opportunities to work (5 service providers/caseworkers in 5 P/Ts)
- Participants with disabilities experience pride and independence when given the opportunity to work in a supportive environment (3 service providers/caseworkers in 3 P/Ts)
Innovation
The document review identified programs and services being designed and delivered in an innovative way in 10 provinces and territories. Each of these jurisdictions reported innovation within existing programs and services. Four jurisdictions also reported developing new innovative programs and services. Innovation occurred in the following areas.
Skills training (5 P/Ts)
Examples include:
- incorporating trauma-informed pedagogy in language training programs for refugees occupation-specific skills training for refugees
- combining occupation specific training with on the job learning
Service delivery (5 P/Ts)
Examples include:
- online employment services
- programs to help offset the cost of transportation
- pilot projects to test best practices in service delivery to Indigenous participants
Education (3 P/Ts)
Examples of innovation related to education include:
- experiential co-op training to help persons with disabilities acquire transferable job skills
- using a GBA+ lens to train youth, women, immigrants, and non-binary individuals in trades-related occupations
- using experiential learning to help participants acquire the skills, experience, and support to transition into employment
Employer partnership (Fewer than 3 P/Ts)
An example includes:
- creating employment opportunities in partnership with employers to hire and train persons with disabilities
Incorporating new technologies (Fewer than 3 P/Ts)
An example includes:
- creating a mobile web application to connect recent graduates, youth, newcomers and international students with local business leaders
Uptake of the research and innovation stream
In most (7 out of 12) provinces and territories, P/T representatives reported that no projects had been undertaken under the Research and Innovation stream. Reasons provided for not doing so included the following:
- P/Ts use the Labour Market Development Agreements for Research and Innovation projects (3 P/Ts)
- research and innovation is integrated into program and service delivery (fewer than 3 P/Ts)
P/T representatives in 5 provinces and territories reported having projects funded under the Research and Innovation stream of the WDAs.
Examples of Research and Innovation Stream projects
- Housing renovation:
Funding was used to develop an innovative training program where students contributed to repairing damaged housing units. Participants acquired trades skills while improving housing quality and availability. - Modular housing:
Funding was used to develop an innovative program where students developed modular housing units, which were then shipped throughout the jurisdiction to improve housing availability. - Sub-journeyman certification:
Funding was used to pilot an innovative certification program that allows experienced trades people to be certified below the journeyman level without having to take written exams. The program seeks to address significant employment barriers for individuals with low literacy levels and learning disabilities. - Culturally grounded service delivery:
Funding was used to co-develop a culturally grounded service delivery approach with a First Nations community. The program seeks to increase engagement and employment outcomes for at-risk youth. - Service delivery model:
Funding was used to engage in a broad community consultation in order to develop a new service delivery model. The program seeks to ensure that all individuals in the jurisdiction receive the support they require to improve their labour market integration and employment outcomes.
Flexibility and responsiveness of the WDA model to workforce needs
Overall, ESDC officials and P/T representatives reported that the WDAs provided P/Ts with the flexibility needed to meet the needs of their jurisdiction. When asked about the strengths of the model, ESDC officials identified the following:
- the WDAs have strong focus on those who are more removed from the labour market
- the agreements have broad program and participant eligibility criteria
- they are adaptable to P/T policy objectives
P/T representatives in 11 out of 12 P/Ts also found the agreements to be flexible. They reported that the WDAs provide their jurisdiction with the flexibility to design and deliver employment programs and services that are adapted their respective labour market needs and priorities. In particular, P/Ts found that the WDAs:
- are more flexible than the Labour Market Development Agreements (3 P/Ts)
- allow them to cover gaps in the Labour Market Development Agreements’ program and participant eligibility criteria (Fewer than 3 P/Ts)
Challenges associated with the WDAs
ESDC representatives, P/T representatives in all jurisdictions, and most (39 out of 43) service providers/caseworkers who work with persons with disabilities identified challenges with the agreements.
Funding level and flexibilityFootnote 32
P/T representatives in all 12 jurisdictions identified the insufficient funding level as the most important challenge associated with the agreements.
ESDC officials noted the smaller budget for the WDAs compared to the Labour Market Development Agreements. It was also acknowledged that WDA participants are generally further away from the labour market and require more intensive programs and services to improve their labour market outcomes. This would suggest the need for a more even allocation of funding between the WDAs and the Labour Market Development Agreements.
P/T representatives identified a number of funding related adjustments that would improve their ability to meet current and emerging needs; these included:
- increased flexibility to fund programs and services targeting those who are further away from the labour market and who require more intensive supports (6 P/Ts)
- increasing year-to-year carryover funds (4 P/Ts)
- more flexibility to offer holistic services, including mental health services, connectivity supports and technological literacy training, life stabilization measures, and transportation supports (4 P/Ts)
- increasing the flexibility in the use of administrative funds (3 P/Ts)
P/T representatives and service providers reported that more funding is required for specific types of programs and services; these included:
- job-readiness and employment maintenance supports that reflect the resource intensive and long-term nature of serving persons with disabilities (Reported in 18 interviews, 15 with service providers and 3 with P/T representatives, in 8 P/Ts)
- transportation supports (9 service providers/caseworkers in 5 P/Ts)
- mental health supports (Reported in 8 interviews, 4 with providers/caseworkers and 4 with P/T representatives, in 3 P/Ts)
- employer education and awareness (5 service providers in 5 P/Ts)
- funding to cover the cost of criminal record checks and pardons (4 service providers in fewer than 3 P/Ts)
- life stabilization supports, such as providing food, clothing, transportation, and temporary housing (3 service providers in fewer than 3 P/Ts)
Sixteen service providers/caseworkers in 10 P/Ts who work with persons with disabilities reported that the funding level allocated to their organization is insufficient to stabilize their staff. They reported that staff turnover results in:
- a continuous loss of organizational knowledge
- increased resources needed for onboarding and training
- suboptimal service delivery
- loss of crucial relationships with the community, employers, and participants with disabilities
Nine service providers/caseworkers in 5 P/Ts reported that the lack of multi-year funding exacerbates these issues. According to these key informants, the provision of multi-year funding would significantly increase the stability of their staff and services. It would also significantly reduce the administrative burden associated with annual funding applications.
Program and service eligibility criteria unclear and inflexible
Twenty-three service providers/caseworkers in 12 P/Ts reported a lack of flexibility and clarity with respect to eligible programs and services. This hampered service providers’ ability to effectively apply for funding and to use funding in a way that best served the needs of persons with disabilities. In particular, they lacked the flexibility to respond to the needs individuals who require more intensive, holistic program design and delivery approaches.
Participant eligibility criteria
ESDC officials, P/T representatives in 6 jurisdictions, and 10 service providers/caseworkers in 6 P/Ts identified populations who are ineligible for participation in WDA-funded programs and services, these included:
- international students, temporary foreign workers, and some refugees (ESDC officials, P/T representatives in 6 jurisdictions, and 4 service providers/caseworkers in 4 P/Ts)
- employed participants (P/T representatives in 4 jurisdictions, and 4 service providers/caseworkers in 4 P/Ts)Footnote 33
- participants who are unwilling to identify as persons with disabilities, and those who do not have a formal assessment (5 service providers/caseworkers in 3 P/Ts)Footnote 34
Overall, key informant interviews revealed that there is a need to clarify the participant, program, and service eligibility criteria.
Data collection
ESDC officials, P/T representatives in 5 jurisdictions, and 10 service providers/caseworkers in 6 jurisdictions identified the data collection requirements as a barrier. According to these key informants, data collection form a barrier to both the development and delivery of programs and services to serve vulnerable populations.
P/T representatives and service providers/caseworkers also reported that the data collection provisions limit their ability to:
- serve marginalised individuals, such as those who do not have social insurance numbers or fixed addresses (P/T representatives in 3 jurisdictions, and 10 service providers in 6 P/Ts)
- serve marginalised individuals who, for a variety of reasons, are not comfortable sharing personal information (P/T representatives in 3 jurisdictions, and 10 service providers in 6 P/Ts)
- work with third-party service providers who do not have the capacity to collect, store, and report data in a timely manner (P/T representatives in 3 jurisdictions)
- maintain balance between administrative work and service delivery, because data collection and reporting is time-consuming (6 service providers/caseworkers in 3 P/Ts)
P/T representatives were asked how this barrier could be mitigated. Representatives in 4 jurisdictions suggested that more flexibility be provided to exempt some vulnerable individuals from having to provide personal information, including social insurance numbers.
Service delivery to Indigenous peoples
P/T representatives in 3 jurisdictions reported that more funding and flexibility is needed to provide intensive, culturally and linguistically appropriate supports to Indigenous participants.
Micro-credentialing
P/T representatives in 3 jurisdictions identified micro-credentialing as an existing need that is not currently funded under the WDAs in their respective jurisdictions. The relevance of micro-credential is growing given the increasingly ad-hoc nature of employment (gig economy).
Contextual challenges affecting service delivery
P/T representatives and service providers/caseworkers who provide services to persons with disabilities identified several significant challenges that affected their ability to deliver WDA-funded programs and services in their jurisdictions.
Service delivery in rural and remote areas: P/T representatives in 7 jurisdictions reported that service delivery in sparsely populated rural and remote areas remains challenging and resource intensive. This challenge is exacerbated by the lack of internet connectivity and difficult access to transportation.
Online service delivery
P/T representatives in 3 jurisdictions reported that online service delivery creates a significant barrier for individuals who:
- do not have access to communication technology
- live in areas with poor internet connectivity
- have low independent learning skills, low literacy, and learning disabilities
Pandemic related challenges
P/T representatives in 3 jurisdictions and 10 service providers/caseworkers in 5 jurisdictions reported that the pandemic intensified a wide range of pre-existing challenges. Pandemic restrictions and health protocols, such as protective barriers and wearing masks in public spaces, exacerbated communication barriers for those with visual and hearing impairments. These additional barriers further limited their employment options. Lockdowns in many jurisdictions increased the severity of participants’ mental illnesses as well as their vulnerability to abuse. These factors interfered with their ability to participate in WDA-funded programs and services and to maintain employment.
Challenges specific to the territories
Territorial representatives reported that the territories experience additional challenges, which are particular to their distinct geographic, socio-demographic, and infrastructural context, these include:
- lack of training infrastructure and access to coaches and trainers
- high cost of travel and accommodation to bring trainers to the territories and to send participants to receive training
- poorly developed service infrastructures, such as health, mental health, and transportation services
- lack of internal capacity due to high staff turnover
Three service providers/caseworkers in the territories identified the need for greater inclusion of cultural and contextual expertise in program design and delivery. According to these individuals, this would improve the WDAs’ effectiveness in meeting the labour integration needs of Indigenous persons with disabilities. These service providers/caseworkers recognise the importance of subject matter expertise. However, they emphasised that it is not sufficient in their context, and that more weight should be given to contextual and cultural expertise in territorial recruitment processes.
Governance, planning, reporting and accountability
The WDAs include provisions relating to financial reporting, official languages, planning and governance, performance measurement, annual reporting, and evaluation. ESDC officials and P/T representatives were asked to reflect on each of these provisions to identify best practices, challenges, and potential areas for improvement.
Best practices for federal-provincial/territorial agreements
There was broad agreement on the benefits of the agreements and appreciation for their flexibility and broad eligibility criteria. However, there was little consensus over which WDA provisions stood out as best practices. ESDC officials identified the governance structure, having a performance measurement strategy, and financial accountability/reporting mechanism as best practices. P/T representatives were divided in their assessment. None of the provisions was identified as best practices by representatives in more than 2 P/Ts.
Challenges in meeting WDA provisions and potential for improvement
As illustrated in Chart 2, all P/Ts reported challenges meeting some of the provisions set out in the agreements. The specific challenges encountered with each provision, as well as improvements relating to the provisions, are discussed below.
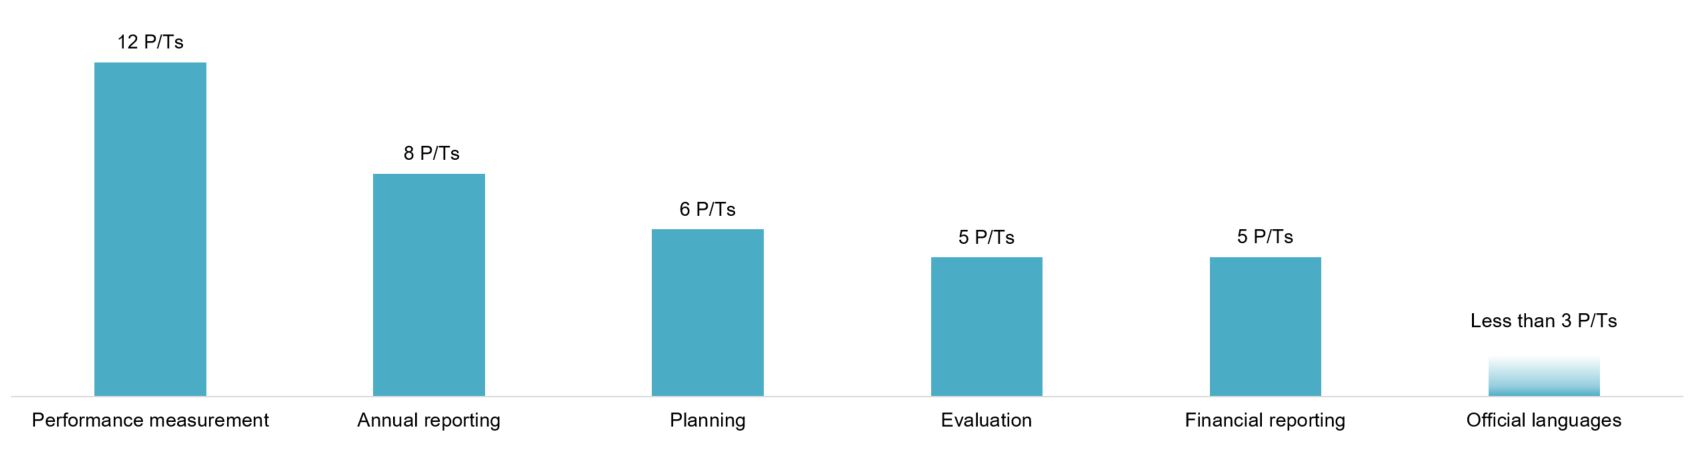
Text description – Chart 2
| WDA provision | # of P/Ts that experienced challenges with the provision |
|---|---|
| Performance measurement | 12 |
| Annual reporting | 8 |
| Planning | 6 |
| Evaluation | 5 |
| Financial reporting | 5 |
| Official languages | <3 |
Performance measurement
ESDC officials, P/T representatives in all jurisdictions, and 7 service providers/caseworkers in 5 P/Ts reported challenges meeting the provisions relating to performance measurement. Representatives in 12 P/Ts identified performance measurement as one of the most challenging of the WDA provisions.
ESDC officials reported that the capacity to implement the performance measurement framework is uneven across jurisdictions and that the implementation timeframe was too short for some P/Ts. Representatives in 5 P/Ts reported that the implementation of the framework and ongoing data reporting requirements was challenging and resource intensive.
Challenges in data collection and reporting
- Third-party service providers do not all have adequate data collection systems in place to collect all the required data (3 P/Ts)
- Data collected by third-party service providers is not always complete, reliable, and provided on time, which in turn impedes P/Ts’ ability to report performance measurement data (3 P/Ts)
- Third-party service providers have privacy concerns about collecting data from some marginalised populations (3 P/Ts)
- Some participants are hesitant about providing personal information (3 P/Ts)Footnote 35
- There are significant barriers to interdepartmental data sharing within some jurisdictions (Fewer than 3 P/Ts)
ESDC officials, P/T representatives, and service providers/caseworkers reported that improvements were needed with respect to outcome and performance indicators. Specific recommendations included:
- need for outcome and performance indicators that better capture a wider range of outcomesFootnote 36 (P/T representatives in 3 jurisdictions, and 7 service providers/caseworkers in 5 P/Ts)
- need for more clarity around data collection and reporting requirements (ESDC officials and fewer than 3 P/Ts)
- need for reliable data on barriers to employment experienced by participants (ESDC officials)
- need for better qualitative data on employer-sponsored training and light touch supports (ESDC officials)
- need for a consistent nomenclature of disability types (ESDC officials)
P/T representatives in fewer than 3 jurisdictions called for a comprehensive review of the performance measurement strategy.
Annual reporting
ESDC officials and P/T representatives in 8 jurisdictions reported challenges meeting the annual reporting provisions. P/T representatives in fewer than 3 jurisdictions identified annual reporting as one of the most challenging of the WDA provisions. Specific challenges relating to annual reporting include:
- performance measurement challenges relating to data collection have an impact on annual reporting, leading to delays and incomplete reporting (ESDC officials and 4 P/Ts)
- the timeframe for annual WDA reporting does not align with the timeframe for reporting within some jurisdictions (Fewer than 3 P/Ts)
- there is duplication between the WDAs and Labour Market Development Agreements deliverables (ESDC officials and fewer than 3 P/Ts)
ESDC officials and P/T representatives in fewer than 3 jurisdictions recommended streamlining and harmonizing WDA and LMDA reporting to help reduce the reporting burden. P/T representatives in fewer than 3 jurisdictions recommended developing a standardised reporting template to facilitate the annual reporting process.
Planning and governance
ESDC officials and P/T representatives in 6 jurisdictions identified challenges relating to the planning provisions. P/T representatives in fewer than 3 P/Ts identified planning as one of the most challenging of the WDA provisions.
ESDC officials reported that WDA Working Group meetings and bilateral Director-level meetings provide a productive forum for strategic planning discussions, information sharing, and priority setting. However, they identified challenges relating to the in-person annual and bilateral Assistant Deputy Minister level meetings. According to ESDC officials, these are too infrequent to engage in substantive issues, and tend to have a federal lens. They suggested that the integration of more virtual meetings could help to reduce the scheduling challenges and travel burden associated with the meetings. Moreover, they identified these meetings as potential venues for federal leadership in facilitating inter-provincial/territorial knowledge transfer and sharing best practices in terms of policy and labour market planning.
ESDC officials and P/T representatives in fewer than 3 jurisdictions reported that the annual stakeholder consultations required as part of WDA planning provisions were unhelpful and burdensome for P/Ts.
P/T representatives identified additional challenges relating to the planning provisions; these include:
- insufficient federal-provincial/territorial committee meetings, joint planning, and coordination (Fewer than 3 P/Ts)
- insufficient data and information sharing between the federal government and the P/Ts (Fewer than 3 P/Ts)
Nine service providers/caseworkers in 6 jurisdictions reported that greater inclusion of service providers in planning activities would benefit the WDAs’ ability to meet the needs of persons with disabilities.
Evaluation
P/T representatives in 5 jurisdictions identified challenges relating to evaluation. None identified evaluation as one of the most challenging WDA provision. Specific evaluation related challenges identified by P/T representatives include:
- jurisdictions with smaller populations do not have the population size to benefit from P/T specific quantitative evaluation findings (fewer than 3 P/Ts)
- there is duplication between federal and P/T evaluation efforts (fewer than 3 P/Ts)
- future evaluations should rely on administrative data and long-term tax data rather than surveys (fewer than 3 P/Ts)
Financial reporting
P/T representatives in 5 jurisdictions identified challenges with financial reporting. None identified financial reporting as one of the most challenging WDA provision. Specific financial reporting challenges include:
- reporting on the cost-matching component for programs and services for persons with disabilities is challenging (fewer than 3 P/Ts)
- incomplete and late reporting by third-party service providers impedes timely financial reporting (fewer than 3 P/Ts)
- lack of alignment between federal and P/T budget and reporting timelines impedes timely financial reporting (fewer than 3 P/Ts)
Official languages
P/T representatives in fewer than 3 jurisdictions identified challenges relating to the official languages provisions, and none identified this WDA provision as one of the most challenging. Specific challenges related to official languages include:
- no applications were received from third-party service providers to provide French language programs and services (fewer than 3 P/Ts)
- multiple official languages increase the difficulty of ensuring that all WDA materials are available in official languages (fewer than 3 P/Ts)
Additional areas for improving the WDA provisions
Some P/T representatives identified general improvements that could facilitate the implementation of the WDAs in their jurisdiction; these included:
- clearer guidelines on the types of programs and services that are eligible for funding under the WDAs (fewer than 3 P/Ts)
- clearer participant eligibility criteria (fewer than 3 P/Ts)
- combining the WDAs and Labour Market Development Agreements into one agreement (fewer than 3 P/Ts)
Data assessment
The WDAs require the assessment of the impact and effectiveness of funded programs and services. Based on established practices, this is achieved by comparing the outcomes of participants with those of similar non-participants (comparison group). However, building a comparison group requires access to a wide range of socio-demographic and labour market information on participants and similar non-participants.
A data assessment was conducted to determine the extent to which WDA participant data, and other available data sources, could be used to meet WDA evaluation requirements. Overall, it revealed that assessing the impact and effectiveness of the WDA programs and services, as is done for the Labour Market Development Agreements, will be more challenging. This is especially the case for employer-sponsored training and programming for persons with disabilities.
Issues affecting participant data collection and reporting
The uploading of P/T WDA participant data was scheduled to begin on April 1, 2020. As of July 2021:
- 10 P/Ts had uploaded WDA data to ESDC
- 2 P/Ts were unsuccessful in uploading their data
- 1 P/T has no information sharing agreement with ESDC for the data transfer
Chart 3 presents the profile of WDA participants from uploaded P/T data with a focus on the missing information. The data reveal that:
- there is a high number of missing frequencies for participants’ marital status, number of dependents and education levels
- nearly 20% of participants preferred not to self-identify as immigrants, Indigenous peoples, persons with disabilities or visible minorities
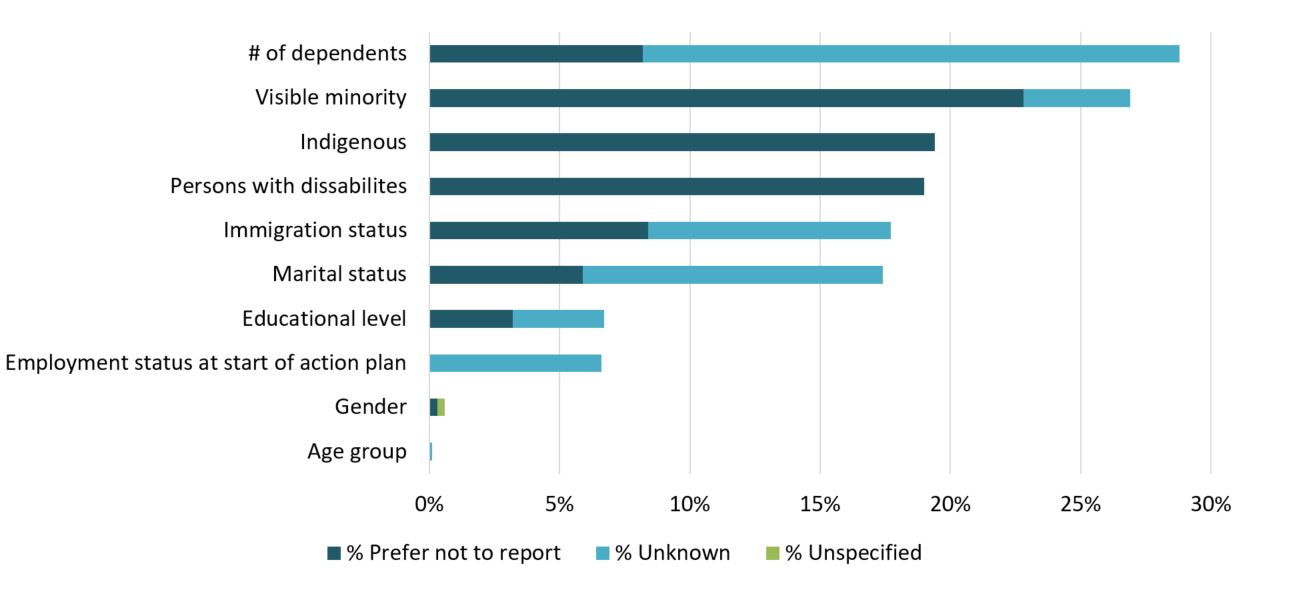
Text description – Chart 3
| Socio-demographic variable | % Prefer not to report | % Unknown | % Unspecified |
|---|---|---|---|
| # of dependants | 8.2 | 20.6 | 0 |
| Visible minority | 22.8 | 4.1 | 0 |
| Indigenous | 19.4 | 0 | 0 |
| Persons with disabilities | 19 | 0 | 0 |
| Immigration status | 8.4 | 9.3 | 0 |
| Marital status | 5.9 | 11.5 | 0 |
| Education level | 3.2 | 3.5 | 0 |
| Employment status at start of action plan | 0 | 6.6 | 0 |
| Gender | 0.3 | 0 | 0.3 |
| Age group | 0 | 0.1 | 0 |
As shown in Table 4, missing values demonstrate that some P/Ts experience more difficulty in collecting the needed information consistently than other.Footnote 37 This could limit the ability to assess the impacts of WDA programs and services in these P/Ts in the future.
| Variable | P/T 1 | P/T 2 | P/T 3 | P/T 4 | P/T 5 | P/T 6 | P/T 7 | P/T 8 | P/T 9 | P/T 10 |
|---|---|---|---|---|---|---|---|---|---|---|
| Marital status | 1% | 29% | 15% | 11% | 5% | 28% | 3% | 8% | 51% | 31% |
| Number of dependents | 78% | 40% | 15% | 5% | 25% | 72% | 4% | 0% | 86% | 28% |
| Immigration status | 5% | 14% | 15% | 10% | 2% | 43% | 7% | 7% | 100% | 19% |
| Immigration year | 11% | 78% | 0% | 7% | 0% | 86% | 8% | 50% | 100% | 0% |
| Visible minorities | 17% | 18% | 18% | 9% | 7% | 64% | 19% | 12% | 57% | 25% |
| Education level | 1% | 4% | 12% | 15% | 1% | 35% | 1% | 1% | 37% | 0% |
| Language spoken | 0% | 23% | 0% | 0% | 0% | 0% | 0% | 0.1% | 54% | 0% |
| Language of intervention/ service | 0% | 23% | 0% | 0% | 0% | 0% | 0% | 0% | 0% | 0% |
| Employment status at start of action plan | 0% | 0% | 1% | 5% | 0% | 42% | 0% | 4% | 79% | 0% |
* Information on immigration status and being a member of a visible minority is self-reported. Two of the 12 P/Ts with information sharing agreements had not uploaded data to ESDC as of July 2021.
Key informant interviews with P/T representatives and third-party service providers provided insight into issues that may be hampering participant data collection in different jurisdictions. Key informants identified the following challenges:
- P/T capacity to collect, store, aggregate, and report participant level data (P/T representatives in 7 jurisdictions)
- examples of barriers reported include access to appropriate IT systems, limited human resource capacity, and barriers to interdepartmental data sharing
- third-party service provider capacity to collect, store, and report participant level data (P/T representatives in 3 jurisdictions; and 6 service providers/caseworkers in 3 P/Ts)
- examples of barriers reported include inadequate access to appropriate IT systems and software, limited human resource capacity, and ongoing training needs due to staff turnover
- inability and reluctance of some participants to provide personal information (P/T representatives in 3 jurisdictions; and 6 service providers/caseworkers in 3 P/Ts)
It is acknowledged that the pandemic may have exacerbated these challenges.
Collecting and reporting aggregate data on employer-sponsored training
Chart 4 presents the number of P/Ts that provided aggregate qualitative data on employer-sponsored training as per the provisions of the performance measurement strategy. The data revealed that:
- all P/Ts reported the number of employers that participated, and 8 out of 9 P/Ts reported on the size of participating employers
- roughly half of the P/Ts reported on the sector (NAICs) of employers
- roughly half of the P/Ts provided a high level description of the type of WDA employer-sponsored training activities funded in their jurisdiction
- no P/Ts reported data for the count of participants, the type of training provided, the type of skills learned, or the underrepresented groups targeted
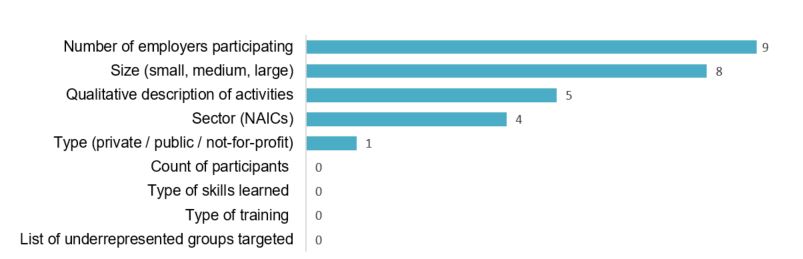
Text description – Chart 4
| Type of employer-sponsored training data | # of P/Ts reporting data |
|---|---|
| Number of employers participating | 9 |
| Size (small, medium, large) | 8 |
| Qualitative description of activities | 5 |
| Sector (NAICs) | 4 |
| Type (private/public/not-for-profit) | 1 |
| Count of participants | 0 |
| Type of skills learned | 0 |
| Type of training | 0 |
| List of underrepresented groups targeted | 0 |
In 2018 to 2019, nearly 20% of WDA funding was allocated to employer-sponsored training in 5 jurisdictions. One province spent 47% of its WDA allocation on these programs.
Most participants in employer-sponsored training are already employed when they begin participating in WDA-funded training. For this reason, employment rates can only decline after participation, meaning that post-participation labour market outcomes are less relevant indicators of program effectiveness for these participants. Moreover, data enabling the creation of valid comparison groups for employed participants is not available. Accordingly, this type of training does not lend itself to incremental impact analyses.
Given these limitations, future evaluation could focus on assessing the relevance of investing in these programs using qualitative data on employers and the type of training provided, such as:
- contributing to job creation by assisting small and medium-sized businesses
- supporting economic growth by investing in training employees in specific industries
- investing in skills that are currently or forecasted to be in demand
Collecting the relevant qualitative information to support such an analysis will be important, taking into account the gaps in reporting presented in Chart 3.
Representativity of national level estimates
The current WDA agreement with Quebec does not include an information sharing agreement for the transfer of participant level data to ESDC. In the absence of participant-level data from Quebec, future ESDC evaluations may not be able to assess the impact and effectiveness of programs and services across all P/Ts. It is noted that Quebec conducts regular evaluations to assess the impact and effectiveness of its programs and services.
Assessing the impact and effectiveness of programs and services for persons with disabilities
The WDA performance measurement strategy requires the collection of information on whether participants have a disability. However, it does not require the collection of information on the severity of the disability or on participants’ capacity to work full-time.
The 2017 Canadian Survey on Disability found that 4 out of 10 persons with disabilities aged 15 years and over had more severe disabilities (severe or very severe).Footnote 38 Labour market statistics further reveal that labour market outcomes vary significantly depending on the severity of disabilities.Footnote 39
Accordingly, if an adequate comparison were found, sound interpretation of observed labour outcomes and estimated impacts for persons with disabilities would require the collection of additional information, including:
- information on the severity of participants’ disability in terms of how it impact on labour market participation
- information on participants’ capacity to work full-time
These findings are supported by recent studies and qualitative information collected through key informant interviews from 40 organizations across Canada who provide services for persons with disabilities.Footnote 40
Access to additional datasets
One of the main limitations with the WDA evaluation is the availability of a single or multiple data set(s) from which to create comparison groups of non-participants.
The Labour Market Development Agreement evaluation uses data from the Employment Insurance program to create a comparison group. Specifically, the data is used identify groups of individuals who are similar on a number of characteristics but who did not participate in Labour Market Development Agreement programs. Comparing participants with similar non-participants provide a more robust assessment of program outcomes and impacts.
ESDC can access Employment Insurance and income tax records for research and evaluation purposes. However, many WDA participants are further away from the labour market and do not interact with the Employment Insurance program. Accordingly, exploratory work is needed to assess the extent to which this data can be used to build comparison groups for WDA participants. Specifically, work is needed to explore the option of building comparison groups using the data of individuals who applied but were not deemed eligible for Employment Insurance benefits. The option of using social assistance data held by P/Ts could also be explored.Footnote 41
Overall, assessing the impact and effectiveness of WDA programs and services, as is done for the Labour Market Development Agreements, will be more challenging.
Nearly a fifth of all WDA participants in 2020 to 2021 were immigrants. The WDA performance measurement strategy requires the collection of information on whether participants are immigrants, and on immigrant participants’ year of arrival in Canada. It does not require the collection of information on the following:
- their level of proficiency in English or French
- their level of education and the relevance of their credentials upon arrival
- their previous work experience
- their immigration class
The literature review revealed that immigrants’ labour market outcomes can vary significantly depending on these variables. Access to immigration and citizenship data, maintained by Statistics Canada, would enable ESDC to take these variables into account. This in turn would improve the soundness of immigrant and visible minority participants’ labour market outcome analyses. It would also facilitate the creation of much more robust comparison groups for impact analysis.
Labour market outcomes for participants in WDA-funded programs and services
Overall, the national survey of WDA participants revealed improvements in participants’ employment and earnings outcomes. Moreover, most participants reported a high level of satisfaction with the WDA programs and services they received. Most also reported that they received the help they needed thanks to their participation.
Employment outcomes
WDA participants who responded to the surveys reported positive post-participation outcomes in terms of both hours worked and employment rate.
Employment outcomes for all survey participants
As presented in Table 5, national survey respondents’ employment rate increased by 16 percentage points post-participation, from 48% to 64%. Although respondents’ employment rate decreased to 58% after the start of the pandemic, this still represents an increase of 10 percentage points when compared to the pre-participation employment rate.
Findings from the British Columbia survey similarly demonstrated that respondents’ employment rate increased by an average of 16 percentage points post-participation, from 66% to 82% (pre-pandemic 87%; pandemic 79%Footnote 42).Footnote 43 When excluding participants in British Columbia’s employer training programs, the employment rate increased by an average of 39 percentage points post-participation, from 26% to 65% (pre-pandemic 69%; pandemic 63%).
The national survey results revealed significant variation based on the type of program or service that respondents received. Respondents’ post-participation employment rate increased across all programs and services with the exception of those who participated in employer-sponsored training. This is to be expected given that these participants had 97% employment rate at the start of participation. The 3 percentage point decrease in employment as of February 2020 may be a reflection of normal staff turnover.
In the British Columbia survey, employer training program respondents’ employment rate increased by an average of 1 percentage point post-participation, from 93% to 94% (pre-pandemic 95%; pandemic 92%).
| WDA program and service | n= | Participation start date | February 2020 | Survey date winter 2021 |
Change: start to Feb 2020 | Change: start to survey |
|---|---|---|---|---|---|---|
| Occupational training | 280 | 42% | 70% | 68% | +28 pp | +26 pp |
| Work experience | 1,145 | 20% | 56% | 50% | +36 pp | +30 pp |
| Short-term training | 1,017 | 27% | 56% | 50% | +29 pp | +23 pp |
| Job placement | 53 | 27% | 51% | 56% | +24 pp | +29 pp |
| Literacy, adult basic education, essential skills and language training | 1,609 | 34% | 44% | 40% | +10 pp | +6 pp |
| Employer-sponsored training | 1,554 | 97% | 94% | 89% | -3 pp | -8 pp |
| Wage subsidy | 49 | 53% | 54% | 59% | +1 pp | +6 pp |
| Total sample | 5,707 | 48% | 64% | 58% | +16 pp | +10 pp |
- * pp: percentage points
- ** Values in red font represent a decline
- *** The change in employment rates for participants in job placement and wage subsidies should be interpreted with caution given the small number of participants and survey respondents
Employment outcomes for those who were employed and unemployed at the beginning of their WDA participation
As presented in Table 6, post-participation changes in national survey respondents’ employment rates were:
- positive for those who had been unemployed at the start of participation
- negative for those who were employed at the start of participation
The employment rate of those who were unemployed pre-participation increased by 43 percentage points post-participation, and was subject to little decline after the pandemic started (minus 2 percentage points). Conversely, the employment rate of those who were employed pre-participation decreased by 13 percentage points post-participation, and declined by another 8 percentage points after the start of the pandemic.
| Employment status at start of WDA participation | n= | Participation start date | February 2020 | Survey date winter 2021 |
Change: start to Feb 2020 | Change: start to survey |
|---|---|---|---|---|---|---|
| Employed | 2,704 | 100% | 87% | 79% | -13 pp | -21 pp |
| Unemployed | 2,803 | 0% | 43% | 41% | +43 pp | +41 pp |
| Total sample | 5,707 | 48% | 64% | 58% | +16 pp | +10 pp |
* pp: percentage points
As presented in Table 7, the survey in British Columbia revealed that the employment rate of those who were unemployed pre-participation increased by 62 percentage points post-participation. The employment rate of those who were employed pre-participation decreased by 7 percentage points post-participation.Footnote 44 Of those employed pre-participation but unemployed post-participation, 29% were surveyed pre-pandemic and 71% were surveyed during the pandemic.Footnote 45
| Employment status at start of WDA intervention | n= | Participation start date | Survey date | Change: start to survey |
|---|---|---|---|---|
| Employed | 1,989 | 100% | 93% | -7 pp |
| UnemployedFootnote 46 | 1,028 | 0% | 62% | +62 pp |
| Total sample | 3,017 | 66% | 82% | +16 pp |
- * pp: percentage points
- ** Values in red font represent a decline
Employment outcomes by subgroups of national survey respondents
As presented in Table 8, post-participation changes in employment rates were positive across nearly all population subgroups. However, the findings reveal some variations based on respondents’ age, immigration history, Indigenous/non-Indigenous identity, visible minority status, and disability status.Footnote 47
Age
Young respondents (under 25 years old) had the highest increase in employment rates between the start of participation and the time of survey in winter 2021. Older workers (aged 55 and above) were the only subgroup whose employment rate dropped below their pre-participation rate after the start of the pandemic.
Immigration history
When compared to Canadian-born respondents, immigrants experienced larger increases in their post-participation employment rate, and a slightly smaller decline in their employment rate after the start of the pandemic. Increases in post-participation employment rates were significantly higher for newcomers, and declines following the start of the pandemic were significantly smaller.
Indigenous/non-Indigenous
Indigenous and non-Indigenous respondents experienced similar increases in their post-participation employment rates. However, Indigenous participants experienced a more significant decline in their employment rate following the start of the pandemic.
Visible minority
Respondents who self-identified as visible minorities experienced a significantly greater increase in their post-participation employment rate than those who did not identify as being part of a visible minority. They also experienced a smaller decline in their employment rate after the start of the pandemic.
Disability status
Respondents with disabilities experienced a smaller increase in their post-participation employment rate than those who did not have a disability. Declines in employment rate after the start of the pandemic were similar for both population subgroups.
| Subgroups of survey respondents | n= | Participation start date | February 2020 | Survey date winter 2021 |
Change: start to Feb 2020 | Change: start to survey |
|---|---|---|---|---|---|---|
| Female | 2,990 | 44% | 60% | 57% | +16 pp | +13 pp |
| Male | 2,528 | 52% | 69% | 64% | +17 pp | +12 pp |
| Under 25 years | 1,167 | 25% | 49% | 45% | +24 pp | +20 pp |
| 25 to 34 years | 1,395 | 47% | 63% | 58% | +16 pp | +11 pp |
| 35 to 44 years | 1,353 | 57% | 74% | 70% | +17 pp | +13 pp |
| 45 to 54 years | 846 | 62% | 72% | 67% | +10 pp | +5 pp |
| 55 years and over | 540 | 56% | 62% | 53% | +6 pp | -3 pp |
| Born in Canada | 3,484 | 50% | 62% | 57% | +12 pp | +7 pp |
| Not born in Canada | 2,138 | 42% | 66% | 62% | +24 pp | +20 pp |
| Arrive to Canada prior to 2011 | 525 | 57% | 69% | 62% | +12 pp | +5 pp |
| Arrived to Canada between 2011 and 2015 | 432 | 54% | 64% | 61% | +10 pp | +7 pp |
| Arrived to Canada in 2016 to 2017 | 479 | 41% | 59% | 56% | +18 pp | +15 pp |
| Arrived to Canada in 2018 to 2019 | 611 | 24% | 71% | 70% | +47 pp | +46 pp |
| Indigenous | 596 | 26% | 41% | 32% | +15 pp | +6 pp |
| Not Indigenous | 4,915 | 50% | 66% | 62% | +16 pp | +12 pp |
| Visible minority | 1,390 | 41% | 66% | 60% | +25 pp | +19 pp |
| Not visible minority | 3,975 | 51% | 64% | 59% | +13 pp | +8 pp |
| Persons with disabilities | 735 | 26% | 38% | 34% | +12 pp | +8 pp |
| Not persons with disabilities | 4,756 | 51% | 68% | 63% | +17 pp | +12 pp |
| Total sample | 5,707 | 48% | 64% | 58% | +16 pp | +10 pp |
- * pp: percentage points
- ** Values in red font represent a decline
Appendix E presents the employment rates for unemployed WDA survey participants by population subgroup in February 2020 and at the time of the survey in winter 2021.
Estimated change in hours worked
The estimated impact of participation on the number of hours worked post-participation was mostly positive. 27% of national survey respondents reported working more hours, 59% reported working approximately the same amount of hours, and 10% reported working fewer hours. When asked to what extent the WDA programs and services they received contributed to the increase in the hours they worked:
- 36% responded that they contributed to a great extent
- 37% responded that they contributed to some extent
Only a minority of respondent reported that the program or service they received contributed little to the increase in the hours they worked. Specifically:
- 13% responded that they contributed minimally
- 12% responded that they contributed not at all
In the British Columbia survey, the number of weekly hours worked by survey respondents increased by an average of 10.86 hours post-participation, from 26 hours per week to 36.86 hours per week.
Earnings outcomes
Overall, WDA participants who responded to the surveys reported positive post-participation earning outcomes.
Estimated change in earnings
The estimated impact of participation on post-participation earnings was mostly positive. 36% of national survey respondents reported earning more, 50% reported earning approximately the same amount, and 9% reported earning less. Moreover, most respondents attributed the increase in their earnings to the program or service they received either to a great extent (27%) or to some extent (42%). Only a minority of respondents reported that the programs and services they received contributed minimally or did not contribute to the increase in their earnings (19% and 11% respectively).
As presented in Table 9, national survey respondents’ weekly earnings increased by $90 post-participation, from an average of $440 to an average of $530. Although respondents’ average weekly earnings decreased to $485 after the start of the pandemic, this still represents an increase of $45 when compared to pre-participation earnings. The decrease may reflect the broader impact of COVID-19 on the labour market.
National survey respondents’ post-participation earnings increased across all programs and services. However, those who participated in job placements and employer-sponsored training saw their earnings decline slightly below their pre-participation earning level after the start of the pandemic. This decline may be due to the impact of the COVID-19 pandemic on the number of hours worked. Moreover, there was significant variation in the amount of increased earnings across programs and services. For example, those who received wage subsidies experienced an average increase of $283 per week. Those who participated in literacy, adult basic education, essential skills and language training experienced a smaller average increase of $42 per week.
Given the small number of participants and national survey respondents in both job placements and wage subsidies, the positive outcomes should be interpreted with caution.
| WDA program or service | n= | 12 months prior to participation | End of participation to end of February 2020 | March 2020 to end of December 2020 | Change before and after participation | Change before participation to during pandemic |
|---|---|---|---|---|---|---|
| Occupational training | 280 | $236 | $372 | $409 | + $136 | + $173 |
| Work experience | 1,145 | $126 | $262 | $237 | + $136 | + $111 |
| Short-term training | 1,017 | $168 | $292 | $249 | + $124 | + $81 |
| Job placement | 53 | $177 | $287 | $176 | + $110 | - $1 |
| Literacy, adult basic education, essential skills and language training | 1,609 | $154 | $196 | $174 | + $42 | + $20 |
| Employer-sponsored training | 1,554 | $1,389 | $1,465 | $1,367 | + $76 | - $22 |
| Wage subsidy | 49 | $144 | $427 | $396 | + $283 | + $252 |
| Total sample | 5,707 | $440 | $530 | $485 | + $90 | + $45 |
- ** Values in red font represent a decline
As presented in Table 10, post-participation changes in national survey respondents’ weekly earnings were positive for both those who had been employed and unemployed at the start of participation. Specifically:
- the average earnings of those who were employed prior to their participation rose by $95
- the average earnings of those who were unemployed prior to participation rose by $104
However, those who were employed prior to their participation experienced a more significant decrease in their earnings after the start of the pandemic.
| Employment status at start of WDA participation | n= | 12 months prior to participation | End of participation to end of February 2020 | March 2020 to end of December 2020 | Change before and after participation | Change before participation to during pandemic |
|---|---|---|---|---|---|---|
| Employed | 2,704 | $863 | $958 | $864 | + $95 | + $1 |
| Unemployed | 2,803 | $96 | $200 | $193 | + $104 | + $97 |
| Total sample | 5,707 | $440 | $530 | $485 | + $90 | + $45 |
Findings from the British Columbia survey indicate that:
- the average earning of those who were employed prior to their participation rose by $53
- the average earning of those who were unemployed prior to their participation rose by $421
Overall, the average weekly earnings of all respondents increased by $428 post-participation, from $575 to $1,003.
As presented in Table 11, post-participation changes in average weekly earnings were positive across nearly all population subgroups. The findings reveal some variations depending on respondents’ age, immigration history, Indigenous/non-Indigenous identity, visible minority status, and disability status.Footnote 48
Age
Younger respondents experienced a greater increase in their average weekly earnings post-participation, and a less significant decline in their average weekly earnings after the start of the pandemic. Respondents aged 45 to 54, experienced a smaller increase in average weekly earnings post-participation, and these dropped below their pre-participation earnings after the start of the pandemic. The post-participation average weekly earnings of respondents aged 55 and over dropped below their pre-participation earnings, and declined even further after the start of the pandemic.
Immigration history
When compared to Canadian-born respondents, immigrants reported greater increases in their average weekly earnings post-participation, and a lower decline after the start of the pandemic.
Indigenous/non-Indigenous
Non-Indigenous respondents reported a higher increase in their average weekly earnings post-participation than Indigenous respondents.
Visible minority
Respondents who self-identified as being a visible minority experienced greater increases in their average weekly earnings post-participation than those who did not identify as visible minorities.
Disability status
Respondents with disabilities experienced a smaller increase in their average weekly earnings post-participation than those who did not have disabilities.
| Subgroups | n= | 12 months prior to participation | End of participation to end of February 2020 | March 2020 to end of December 2020 | Change before and after participation | Change before participation to during pandemic |
|---|---|---|---|---|---|---|
| Female | 2,990 | $344 | $434 | $394 | + $90 | + $50 |
| Male | 2,528 | $573 | $659 | $615 | + $86 | + $42 |
| <25 years | 1,167 | $123 | $201 | $186 | + $78 | + $63 |
| 25 to 34 years | 1,395 | $392 | $507 | $464 | + $115 | + $72 |
| 35 to 44 years | 1,353 | $643 | $736 | $682 | + $93 | + $39 |
| 45 to 54 years | 846 | $709 | $761 | $704 | + $52 | - $5 |
| >54 years | 540 | $665 | $652 | $595 | - $13 | - $70 |
| Born in Canada | 3,484 | $532 | $596 | $546 | + $64 | + $14 |
| Not born in Canada | 2,138 | $298 | $427 | $398 | + $129 | + $100 |
| Arrived to Canada prior to 2011 | 525 | $627 | $699 | $651 | + $72 | + $24 |
| Arrived to Canada between 2011 and 2015 | 432 | $296 | $401 | $364 | + $105 | + $68 |
| Arrived to Canada in 2016 to 2017 | 479 | $161 | $266 | $251 | + $105 | + $90 |
| Arrived to Canada in 2018 to 2019 | 611 | $169 | $381 | $375 | + $212 | + $206 |
| Indigenous | 596 | $176 | $212 | $200 | + $36 | + $24 |
| Not Indigenous | 4,915 | $477 | $572 | $528 | + $95 | + $51 |
| Visible minority | 1,390 | $306 | $442 | $396 | + $136 | + $90 |
| Not visible minority | 3,975 | $505 | $577 | $537 | + $72 | + $32 |
| Persons with disability | 735 | $145 | $196 | $157 | + $51 | + $12 |
| Not persons with disability | 4,756 | $496 | $591 | $550 | + $95 | + $54 |
| Total sample | 5,707 | $440 | $530 | $485 | + $90 | + $45 |
- ** Values in red font represent a decline
Participant satisfaction
Overall, national survey respondents reported that the WDA programs or services they received addressed their needs and most were satisfied with the services they received.
WDA responsiveness to participant needs
As presented in Chart 5, over 70% of respondents to the national survey indicated that the WDA programs and services they received addressed their labour market needs.Footnote 49

Text description – Chart 5
| Type of labour market need | # of respondents who identified having each need | % of respondents who reported WDA programs and services address each need |
|---|---|---|
| Learning skills or knowledge to help perform an existing job | 1,819 | 94 |
| Improving your skills in reading, writing, using information, and using numbers | 2,089 | 89 |
| Improving skills needed in the workplace such as using a computer, and working with others | 2,982 | 87 |
| Obtaining industry-specific or job-specific skills | 3,531 | 78 |
| Gaining work experience | 3,164 | 75 |
| Looking for or finding a job | 3,025 | 74 |
| Selecting a suitable career path or plan to achieve it | 2,994 | 71 |
Participant satisfaction with WDA programs and services
As presented in Chart 6, nearly 75% of national survey respondents indicated that they were either completely or very satisfied with the program or service they received. Level of satisfaction varied slightly by program or service. Over 80% of participants in employer-sponsored training indicated that they were completely or very satisfied, while only 64% of participants in short-term training did so.

Text description – Chart 6
| Type of training received | % percentage of respondents who reported being completely or very satisfied with the program or service they received |
|---|---|
| Employer Driven Training | 82 |
| Occupational Training | 76 |
| Literacy, Adult basic education, Essential Skills and Language Training | 73 |
| Work Experience | 72 |
| Wage Subsidy | 71 |
| Job Placement | 69 |
| Short-term Training | 64 |
| Total sample | 74 |
The national survey of participants revealed slight variation among respondents of different genders, ages, immigration histories, Indigenous/non-Indigenous identity, visible minority status, and disability status. Overall, over 70% of nearly all respondent groups reported being either completely or very satisfied with the WDA program or service they received. However, persons with disabilities, which constitute over 60% of WDA participants in 2020 to 2021, were least likely to respond that they were completely or very satisfied (66%).
British Columbia evaluated participant satisfaction as part of its short-term outcomes surveys (3-months post-intervention) only, and therefore does not have participant satisfaction information in its 12-month survey data. However, for the same participants that responded to the 12-month survey, a high level of satisfaction was reported. 88% of these participants reported being “very satisfied” and “somewhat satisfied” with the WDA training programs during the reference period.
Conclusions and recommendations
The WDAs represent a significant annual investment in active labour market programs and services in Canada. Given the findings presented in this evaluation report, the agreements are contributing to helping participants to develop their skills, acquire work experience, and improve their labour market outcomes. WDA programs and services are also reaching and helping those who are further away from the labour market and those who are underemployed.
Summary of findings
Overall, the transfer agreements are reaching intended participants, contributing to improving participants’ labour market outcomes, and helping to meet participants’ skill development and work experience needs. While challenges have been identified, almost all P/Ts find the agreements to be flexible and adaptable to their needs and priorities.
WDAs reached targeted participants
The transfer agreements reached individuals who are unemployed or further away from the labour market, as well as members of underrepresented groups.
- Nearly 132,400 individuals participated in 291,200 WDA-funded programs and services in 2020 to 2021
- Every participant received an average of 2.2 interventions
- Unemployed individuals accounted for 47.3% of participants
- Most (56%) had low educational attainment (high school diploma or less)
- Underrepresented groups accounted or a significant portion of the participants
- 60.1% were persons with disabilities; 21.7% were youth, 19% were immigrants, 14.7% were older workers, and 6.5% were Indigenous
WDA programs and services contributed to improving participants’ labour market outcomes
The national survey of WDA participants revealed improvements to participants’ employment and earnings outcomes.
- Overall, respondents’ employment rate increased by 16 percentage points post-participation, from 48% to 64%
- Over 40% of respondents who had been unemployed at the start of their program participation were employed following participation (before and during the pandemic)
- 27% of survey respondents reported working more hours post-participation
- Of those, 73% attributed the increase in the number of hours worked to the program or service they received (either to a great extent or to some extent)
- 36% of respondents reported earning more post-participation
- Of those, 69% attributed the increase in earnings to the program or service they received (either to a great extent or to some extent)
- Respondents’ average weekly earnings increased by $90 post-participation, from $440 to $530 per week
- The average weekly earnings of participants who were unemployed at the start of their WDA participation rose by $104
WDA participants reported a high level of satisfaction
- 70% of national survey respondents indicated that the WDA program or service they received addressed their labour market needs
- 75% of national survey respondents indicated that they were either completely or very satisfied with the program or service they received
WDAs are flexible and adaptable to P/T needs and priorities
Overall, P/T representatives reported that the agreements provide them with the flexibility to design and deliver programs and services to meet the labour market needs of their jurisdictions. Specifically, they reported that:
- the WDAs have broad program and participant eligibility criteria
- the WDAs are adaptable to P/Ts’ policy objectives
- the WDAs allow P/Ts to address gaps in the Labour Market Development Agreements
Summary of challenges and lessons learned
Challenges
Despite the overall flexibility and adaptability of the transfer agreements, key informants identified specific challenges related to the agreements’ funding level and allocation, eligibility criteria, implementation and provisions.
Funding
P/T representatives in all 12 jurisdictions identified the insufficient funding level as the most important challenge associated with the agreements. ESDC officials noted the smaller budget for the WDAs compared to the Labour Market Development Agreements. It was also acknowledged that WDA participants are generally further away from the labour market and require more intensive programs and services to improve their labour market outcomes.
P/T officials reported that they needed more flexibility in how they can use the funding. Examples of how to improve flexibility included increasing year-to-year carryover funds and increasing flexibility in the use of administrative funds. The Covid-19 pandemic may have exacerbated the need for carryover flexibility.
Service providers/caseworkers reported that the lack of multi-year funding provided by P/Ts to the service providers and insufficient funding levels contributed to staff turn-over. This results in a continuous loss of organization knowledge, increased use of resources for onboarding and training, suboptimal service delivery, and loss of trusted relationships with vulnerable participants.
Program and participant eligibility criteria
P/T representatives and service providers/caseworkers reported they needed more flexibility to offer holistic services to those who are further from the labour market. Examples of holistic services include mental health, health, and life stabilization measures. Under the agreements, some of these services are not eligible for funding because they are not considered as labour market programs and services.
Interviews with ESDC officials, P/T representatives, and service providers revealed the need to clarify the participant, program, and service eligibility criteria.
Service providers/caseworkers reported that the way the transfer agreements were implemented in their jurisdiction lacked flexibility and clarity with respect to eligible programs and services. They indicated that this hampered third-party organization’s ability to effectively apply for funding and to use funding in a way that best served the needs of participants with disabilities.
WDA provisions
Of all WDA provisions, performance measurement is considered the most challenging, with uneven capacity at the P/T level. All P/Ts reported challenges in meeting some performance measurement provisions. Specific challenges reported included:
- the capacity of third-party service providers to collect and report participants’ data is uneven, which leads to incomplete and late data reporting
- data collection requirements limit P/Ts’ and third-party service providers/caseworkers’ ability to serve some individuals who do not have/do not want to provide personal informationFootnote 50
- outcome and performance indicators are not specific, adaptable, and flexible enough to capture positive labour market outcomes for some participantsFootnote 51
- ESDC officials reported the need for a consistent nomenclature of disability types
- ESDC officials reported the need for better qualitative data on employer-sponsored training and light touch supports
Most P/Ts reported challenges meeting the annual reporting provision, including:
- delays in receiving data from third-party service providers and lack of alignment between P/T and federal reporting timeframes lead to delays in annual reporting
- Duplication of reporting efforts between the WDAs and Labour Market Development Agreements deliverables
Lessons learned
The literature reviews and key informant interviews identified lessons learned relating to the implementation and delivery of WDA programs and services.
- Meeting the needs of participants who are further from the labour market is resource intensive, and requires a broad spectrum of coordinated services offered over a longer timeframe
- Examples include life stabilization,Footnote 52 health, mental health, education, pre-employment, employment, and employment maintenance supports and services
- Providing services to those who are further away from the labour market requires:
- stable services that are known to community members
- skilled staff who build trust with participants, employers, and other organizations over time
- Wage subsidies are effective in helping to overcome barriers to labour market entry, particularly when combined with intensive employment services
- Although resource intensive, skills development and training are associated with more significant long-term improvements in earnings and career advancement
- When assisting those who are further from the labour market, using a dual model that focuses simultaneously on the needs of participants and employers leads to more successful outcomes
- Providing ongoing support to employers to deal with issues as they arise once they have hired a participant also leads to more successful outcomes
Capacity to assess the impact and effectiveness of the WDA in the future
The transfer agreements require the assessment of the impact and effectiveness of funded programs and services. Based on established practices, this is achieved by comparing the outcomes of participants with those of similar non-participants (comparison group). However, building a comparison group requires access to a wide range of socio-demographic and labour market information on participants and similar non-participants.
A data assessment was conducted to determine the extent to which participant data, and other available data sources, could be used to meet the agreements’ evaluation requirements. Overall, it revealed that assessing the impact and effectiveness of the WDA programs and services, as is done for the Labour Market Development Agreements, will be more challenging. This is especially the case for employer-sponsored training and programming for persons with disabilities.
Access to P/T social assistance data and data on immigration and citizenship maintained by Statistics Canada would further enable the building of comparison groups for some participants. For example, this data could use to create comparison groups for social assistance recipients, immigrant and visible minority participants.Footnote 53
Employer-sponsored trainingFootnote 54 does not lend itself to the construction of a comparison group. Participants in this type of training are already employed, and data enabling the creation of valid comparison groups for employed participants is not available. In that context, the agreements’ performance measurement strategy does not require the collection of data on these participants. Therefore, future evaluation could focus on assessing the relevance of investing in these programs using qualitative data on employers and the type of training provided.
Recent studies and qualitative information collected from 40 organizations across Canada provided insight into the data needed to assess program and service outcomes and impacts for persons with disabilities.Footnote 55 Based on these studies and interviews, the following information would enable a sound interpretation of observed labour market outcomes and estimated impacts if adequate comparison groups were found:
- information on the severity of participants’ disability in terms of how it impact on labour market participation
- information on participants’ capacity to work full-time
Recommendations
A total of 3 recommendations emerge from the evaluation findings.
Challenges associated with assisting person with disabilities to integrate into the labour market
Recommendation 1
To support program and service delivery, ESDC and P/Ts are encouraged to share and discuss the lessons learned, best practices and challenges associated with serving persons with disabilities and individuals who are further removed from the labour market.
Rationale for recommendation 1
As noted in the report, third-party service providers interviewed as part of the evaluation reported the following challenges.
Staff retention and service continuity represent ongoing challenges, which have repercussions on service delivery and participant outcomes. These can be exacerbated by the lack of multiyear funding provided by P/Ts to service providers.
Meeting the needs of participants who are further from the labour market is resource intensive, requiring a broad spectrum of coordinated life stabilization,Footnote 56 health, mental health, education, pre-employment, employment, and employment maintenance supports and services offered over a longer time period. Providing services to those who are further away from the labour market requires stable services and skilled staff who develop relationships of trust with participants, employers, and other service providers over time. These approaches to service delivery are resource intensive.
Program and participant eligibility criteria
Recommendation 2
Building on existing flexibilities in addressing labour market challenges, ESDC and P/Ts are encouraged to continue working to ensure that the WDA programming responds to the needs of the ever-evolving labour market and discuss ways to reach more individuals who are further removed from the labour market.
Rationale for recommendation 2
Existing flexibility in terms of program, service, and participant eligibility criteria is widely appreciated by P/Ts and third-party service providers alike. Some P/Ts and over half of interviewed third-party service providers indicated that having more clarity around what is eligible and ineligible for funding would enable them to take fuller advantage of the WDA’s flexible eligibility criteria. Specifically, key informants reported that more clarity would be beneficial around:
- identifying programs and services that are eligible and ineligible for funding
- identifying participants who are eligible and ineligible for assistance
- defining what flexibility exists to offer pre-employment programs and services (such as mental health counselling, addictions counselling, and access to housing and transportation
- this would help third-party service providers to understand which types of programs and services can be funded under the transfer agreements in their jurisdiction, and to develop their proposals
Data collection
Recommendation 3
ESDC and P/Ts are encouraged to discuss what further steps could be taken to facilitate the collection of data necessary to assess the impact of the WDA programming and demonstrate the results to Canadians.
Rationale for recommendation 3
As observed in the report and based on the first year of participant data uploaded (2020 to 2021), challenges around the completeness of the data collected in some P/Ts could limit the ability to assess the impacts of WDA programs and services in these jurisdictions in the future. Key informants identified issues relating to third-party service provider capacity (such as access to IT systems, software, and human resources), P/T capacity (such as access to appropriate IT systems, limited human resource capacity), and barriers to interdepartmental data collection, sharing, and reporting in some P/Ts.Footnote 57 Similar challenges were observed for the requirement to report aggregate-level information on employer-sponsored training. It is also acknowledged that the pandemic may have exacerbated participant data collection challenges.
References
Employment and Social Development Canada. Literature review on effective labour market programs and services to assist with the integration of Indigenous peoples into the labour market. Internal document, 2020.
Employment and Social Development Canada. Literature review on effective labour market programs and measures to assists older workers to integrate and remain in the labour market. Internal document, 2020.
Ference & Company Consulting. National survey of participants under the workforce development agreements. Internal document, 2021.
Lalonde, P. et al. Literature review on effective labour market programs and services: Assisting youth and social assistance recipients to integrate into the labour market. Internal document, 2020.
Prince, J.P. Effective labour market programs and services to assist persons with disabilities to integrate into the labour market: A review and synthesis of empirical literature. Internal document, 2020.
Sweetman, A. Literature review on effective labour market programs and services to assist immigrants and newcomers to integrated into the labour market. Internal document, 2020.
Appendix A: Evaluation questions, indicators, and lines of evidence
Program design and delivery
Evaluation question 1: What programs and services are provided under the WDAs? How are these programs and services delivered?
Evaluation question 1.1: What programs and services are provided under the WDAs? How are these programs and services delivered?
Indicators:
- documented descriptions of:
- provincial and territorial programs and services provided under the WDAs
- program delivery approach (such as, direct delivery by provincial and territorial staff, third-party service providers)
- perceptions and feedback from program managers
Lines of evidence:
- document review
- key informant interviews
Evaluation question 1.2: What labour market needs do these programs and services aim to address and for what sub-groups of individuals (for example, those further removed from the labour market, social assistance recipients, employed/unemployed)?
Indicators:
- documented description of the labour market needs that programs and services aim to address for participants in general and subgroups of participants
- perceptions and feedback from key informants (including, managers, caseworkers and/or service providers)
- participants’ responses to corresponding survey questions
Lines of evidence:
- document review
- survey
- key informant interviews
Evaluation question 1.3: What is the profile of the 2020 to 2021 WDA participants?
Indicators:
- detailed profile of 2020 to 2021 WDA participants, including socio-demographic characteristics
Lines of evidence:
- data assessment
Evaluation question 1.4: Are there programs and services designed and delivered in an innovative way? What makes these programs innovative compared to other programs?
Indicators:
- documented descriptions of programs and services considered as innovative
- perceptions and feedback from key informants (including, managers, caseworkers and/or service providers)
Lines of evidence:
- document review
- key informant interviews
Evaluation question 1.5: Have innovative projects been undertaken under the Research and Innovation program? What have been the successes or challenges?
Indicators:
- documented descriptions of:
- innovative aspects / components of projects undertaken under the Research and Innovation program
- successes and/or challenges identified in undertaking innovative projects
- perceptions and feedback from managers
Lines of evidence:
- document review
- key informant interviews
Evaluation question 2: What are the provincial and territorial labour market priorities, challenges or objectives that the WDAs are aimed to achieve/address?
Indicators:
- documented descriptions of provincial and territorial labour market priorities, needs, challenges and objectives that the WDAs are aimed to address / achieve
- perceptions and feedback from managers
Lines of evidence:
- document review
- key informant interviews
Evaluation question 3: Are there any perceived gaps in Federal/Provincial-Territorial programming when aiming to assist unemployed/employed Canadians in improving their labour market attachment? Do Federal, Provincial/Territorial agreements provide sufficient flexibility to provinces and territories to design and deliver employment programs and services aiming to address the needs of the local labour market and labour force?
Evaluation question 3.1: Are there any perceived gaps in Federal/Provincial-Territorial programming when aiming to assist unemployed/employed Canadians in improving their labour market attachment?
Indicators:
- perceptions and Feedback from Federal, Provincial/Territorial officials
- perceptions and feedback from key informants (including, managers, caseworkers and/or service providers)
- documented issues/ challenges from Federal, Provincial/Territorial documentation (for example, records of decisions of bilateral meetings)
Lines of evidence:
- document review
- key informant interviews
Evaluation question 3.2: Do Federal, Provincial/Territorial agreements provide sufficient flexibility to provinces and territories to design and deliver employment programs and services aiming to address the needs of the local labour market and labour force?
Indicators:
- feedback from Federal, Provincial/Territorial officials
- feedback from program managers
Lines of evidence:
- key informant interviews
Evaluation question 4: What programs and services are provided to Persons with Disabilities? What works best and what challenges are encountered when assisting them to integrate the labour market?
Evaluation question 4.1: What programs and services are provided to Persons with Disabilities?
Indicators:
- documented description of programs and services
- perception and feedback from program managers
Lines of evidence:
- document review
- key informant interviews
Evaluation question 4.2: What works best and what challenges are encountered when assisting them to integrate the labour market?
Indicators:
- documented best practices from the literature reviews
- documented best practices from provincial and territorial documentation
- perceptions and feedback from key informants (including, managers, caseworkers and/or service providers)
Lines of evidence:
- document review
- key informant interviews
- literature reviews
Evaluation question 5: What programs and services provided under the WDAs are aimed at assisting employers to address their labour market challenges/needs (such as, support for training, shortages)?
Indicators:
- documented description of programs and services
- aggregate level information reported annually to ESDC as part of the Performance Measurement Strategy
- perceptions and feedback from key informants (including, managers, caseworkers and/or service providers)
Lines of evidence:
- document review
- key informant interviews
Governance, planning, reporting and accountability
Evaluation question 6: What are there implementation challenges, if any, related to the various provisions under the WDAs
Indicators:
- feedback from Federal, Provincial/Territorial officials and managers on challenges in meeting the planning and reporting requirements set out in the agreements (such as, data collection elements)
- documented issues/ challenges from implementation plans developed by provinces and territories
- evidence from the data assessment
Lines of evidence:
- document review
- key informant interviews
- data assessment
Evaluation question 7: What WDA provisions can be qualified as a good practice for Federal, Provincial/Territorial agreements?
Indicator:
- feedback from Federal, Provincial/Territorial officials and managers
Line of evidence:
- key informant interviews
Evaluation question 8: To what extent can the participant data, collected by provinces and territories and uploaded to ESDC, be used to support future evaluations of the WDAs using quasi-experimental methods and relying solely on the use of linked administrative records?
Indicator:
- evidence/ analysis from the administrative data collected and uploaded by provinces and territories
Lines of evidence:
- data assessment
Labour market outcomes for participation in the WDAs programs and services
Evaluation question 9: What are the labour market outcomes for WDA participants, by various socio-economic characteristics, at 12-month following participation (such as employment level, skills acquisition, earning levels, satisfaction)?
Indicators:
- evidence from the survey of participants
Lines of evidence:
- survey
Appendix B: Key literature review findings
Five literature reviews summarising Canadian and international literature on effective programs and services to support the labour market integration underrepresented groups were completed. Specifically, the literature reviews focus on the following population groups:
- immigrants and newcomers to Canada
- Indigenous peoples
- older workers
- persons with disabilities
- social assistance recipients and youth
Each literature review was supported by a bibliography identifying the relevant articles or publications. Priority was given to publications with quantitative evidence. Qualitative evidence was also used to identify useful support and services that complement active labour market programs and services. Challenges and best intervention practices identified through the literature reviews are summarised here.
Immigrants
Immigrants are more likely to face several labour market participation challenges and barriers, including:
- low official language skills
- lack of Canadian professional certification and difficulty of securing foreign credentials recognition
- Canadian employers’ tendency to favour individuals with Canadian work experience
Best practices for supporting the labour market integration and participation of immigrants include:
- wage subsidies, which yield the best short and long-term improvements in labour market outcomes
- official language training, particularly when integrated with work placements or vocational, occupational and job search training
- skills development and training
- post-secondary education, which is associated with significant improvements in labour market outcomes, particularly for immigrants who have higher levels of pre-migration education
Indigenous peoples
Indigenous peoples are more likely to face several labour market participation challenges and barriers, including:
- lack of access to education and poor educational attainment
- lack of access to skills development and training, and low job-related skills
- lack of access to basic infrastructure, including water, transportation, and housing
- lack of access to services, including health, mental health, social, and employment services
- high incidence of poverty, including food and housing insecurity
- high incidence of poor mental health related to intergenerational trauma, on-going trauma, being in care as children, abuse, and incarceration
- on-going discrimination
- lack of employment opportunities in remote areas
Best practices for supporting the labour market integration and participation of Indigenous peoples include:
- employment-training programs must address the social and systemic barriers experienced by Indigenous peoples in order to be successful
- this can include providing wrap-around services and intensive case management to address systemic inequities such as:
- high school completion
- school to work transition
- access to post-secondary education
- access to housing and childcare
- this can include providing wrap-around services and intensive case management to address systemic inequities such as:
- ensuring community development and community involvement is essential in designing and developing successful labour market programs for Indigenous peoples
- active labour market programs for Indigenous peoples are more likely to be successful when designed, delivered and managed by Indigenous peoples
- having Indigenous front-line staff builds trust and ensures appropriate cultural awareness of the barriers faced by Indigenous jobseekers
- employer engagement and developing formal partnerships with employers result in improved post-program employment outcomes
- targeting Indigenous labour market programming toward occupations in-demand, in partnership with private sector employers in particular, has proved to be a successful approach
- peer mentoring when participants attend out-of-community education and training
- skills development and training, and wage subsidies are effective in supporting the labour market integration of Indigenous peoples
Older workers
Older workers, aged 55 and above, are more likely to face several labour market participation challenges and barriers, including:
- difficulty re-entering the labour market when they become unemployed
- experiencing a decrease in their wages when they do re-enter the labour market
- a greater likelihood of exiting the labour force after becoming unemployed due to labour market re-entry barriers
- examples of barriers faced by older workers include:
- ageism
- health issues
- inability/unwillingness to move for work, low education and skill level
- mismatched expectations regarding salaries and job search
- examples of barriers faced by older workers include:
Best practices for supporting the labour market re-integration and participation of older workers include:
- individualised supports and flexible, comprehensive approaches to program delivery
- early intervention and job-search assistance after job loss
- on-going and intensive career counselling and coaching
- self-paced, job-related and work integrated skills training
- workplace support and education to change attitudes toward older workers
Persons with disabilities
Persons with disabilities are more likely to face several labour market participation challenges and barriers, including:
- lack of access to transportation is one of the greatest and most widely experienced barriers to labour market participation faced by persons with disabilities
- discrimination, including being denied opportunities for volunteering, education, training, work experience and career advancement
- fear of losing health and other government benefits provided by P/Ts and often unavailable in most entry-level jobs
- insufficient integration of services within and across the education, labour market and mental health sectors forms a significant barrier
Best practices for supporting the labour market integration and participation of persons with disabilities include:
- skill development and training
- work experience programs and services, including wage subsidies, apprenticeships, paid work experience, mentoring, and volunteering to facilitate the school to work transition
- intensive employment services for those who are further from the labour market
- examples of helpful services include:
- assessment
- individual counselling
- job development
- employer engagement
- job matching
- job placements
- job maintenance for those who are further from the labour market
- examples of helpful services include:
- workplace accommodations and access to assistive technology and related digital solutions to help persons with disabilities to participate in school, to obtain a job, and to maintain employment
- employer education and engagement to foster disability-confident organizations and inclusive workplaces
- integrated delivery of clinical treatment, vocational rehabilitation, and practical support services for those with chronic and severe substance use disorders
- this approach requires collaboration and coordination between medical personnel, social work staff, employer groups, local service agencies, and social enterprises
Those with severe mental illness benefit from:
- individualized placement and training with work-related skills training
- early and continuing support to participants and employers before and during employment
- an integrated team of mental health and employment specialists working together through planning, treatment and delivery, and follow-up
Persons with disabilities are diverse in terms of their age group, disability type and life situations. The level of investment made available to support their labour market integration has an impact on their expected labour market outcomes. Moreover, performance measurement indicators of labour market programs for these individuals need to be realistic, flexible, and adaptable to the reality of diverse participants.
Social assistance recipients
The work experience and capabilities of social assistance recipients vary widely, as do the barriers that they face and the types of programs or services they require. Nevertheless, the literature review identified a variety of best practices to support the labour market re-integration and participation of social assistance recipients, including:
- wage subsidies have the best long-term impact on earnings and employment, particularly when combined with intensive employment services
- intensive employment services, including assessment, individual counselling, job development, employer engagement, job matching, job placements, and job maintenance lead to decreased reliance on social assistance
- skills development and training programs are associated with long-term improvements in earnings and career advancement
- using a dual model that focuses simultaneously on the needs of participants and those of employers leads to more successful outcomes
- lower client caseloads per case manager could improve service delivery and lead to better job prospects for clients
- program coordination between different service providers is needed to effectively address the needs of individuals with multiple barriers
- achieving this goal could require that funders incentivise coordination and referrals to the most appropriate services for participants, regardless of the supplier
- maintaining benefits increases participation, as the risk of losing social assistance-related benefits can deter some individuals from enrolling in programs likely to improve their long-term employment and earning prospects
Youth
Youth are more likely to face several labour market challenges and barriers.Footnote 58 These include:
- limited work experience
- lower access to full-time work, as many entry-level positions are part-time
- lower wages for entry level jobs
- a job market increasingly characterised by informal, gig economy work with no benefits or job security
- the increasing automation of entry-level jobs
Best practices for supporting the labour market integration and participation of youth include:
- comprehensive approaches to service delivery combining multiple service and program components that addressed youths’ essential skills training, skill development, and work experience needs
- holistic approaches that address the underlying factors that hinder individual youths’ access to and retention of employment
- examples of underlying factors include:
- inadequate financial resources
- poor mental health
- precarious housing
- inadequate access to affordable childcare
- inadequate access to health care
- examples of underlying factors include:
- employer/sector focused school to work transition programs
- work experience programs and services, including wage subsidies, apprenticeships, mentoring and volunteering
- pre-employment services focusing on employability, soft skills, and essential for youth who are further from the labour market
- employment services, such as job search assistance, resume writing support, and interview practice for work-ready youth
Appendix C: Documents included in the document review
Alberta:
- 2018 to 2019 WDA Annual Plan
- 2018 to 2019 WDA Annual Report
- Canada-Alberta LMAPD Evaluation Report (2018)
British Columbia:
- 2018 to 2019 WDA Annual Plan
- 2019 to 2020 WDA Annual Plan
- 2018 to 2019 WDA Annual Report
- Canada-British Columbia Evaluation of the LMAPD and of Employment Services (March 2018)
- WDC meetings minutes 2018 to 2019
Manitoba:
- 2018 to 2019 WDA Annual Plan
- 2019 to 2020 WDA Annual Plan
- 2018 to 2019 WDA Annual Report
- Manitoba LMAPD Evaluation Findings (from April 2014 to March 2017)
- WDC meetings minutes 2018 to 2019
New Brunswick:
- 2018 to 2019 WDA Annual Plan
- 2019 to 2020 WDA Annual Plan
- Evaluation of the Employment Assistance Program – With Focus on Services for Persons with Disabilities (March 2018)
- Assessment of the Transitional Living Program (2018)
- Evaluation of the Canada-New-Brunswick LMAPD (June 2017)
- Factors leading to Enhanced Education and Employability; A review of Opioid Replacement Therapy and Portage Atlantic Residential Youth Rehabilitation Programs (December 2017)
- Training and Employment Support Services Program Evaluation (January 2017)
- WDC meetings minutes 2018 to 2019
Newfoundland and Labrador:
- 2018 to 2019 WDA Annual Plan
- 2019 to 2020 WDA Annual Plan
- 2018 to 2019 WDA Annual Report
- Canada-Newfoundland and Labrador LMAPD Evaluation Report April 2015 to March 2018
- WDC meetings minutes 2018 to 2019
Northwest Territories:
- 2018 to 2019 WDA Annual Plan
- 2019 to 2020 WDA Annual Plan
- 2018 to 2019 WDA Annual Report
- Canada-Northwest territories LMAPD Evaluation Report (March 2018)
- WDC meetings minutes 2018 to 2019
Nova Scotia:
- 2018 to 2019 WDA Annual Plan
- 2019 to 2020 WDA Annual Plan
- 2018 to 2019 WDA Annual Report
- 2014 to 2018 Canada-Nova Scotia LMAPD Evaluation Report (April 2018)
- WDC meetings minutes 2018 to 2019
Nunavut:
- 2018 to 2019 WDA Annual Plan
- WDC meetings minutes 2018 to 2019
Ontario:
- 2018 to 2019 WDA Annual Plan
- 2019 to 2020 WDA Annual Plan
- 2018 to 2019 WDA Annual Report
- 2014 to 2018 Canada-Ontario LMAPD Evaluation Report
- WDC meetings minutes 2018 to 2019
Prince Edward Island:
- 2018 to 2019 WDA Annual Plan
- 2019 to 2020 WDA Annual Plan
- 2018 to 2019 WDA Annual Report
- 2015 to 2018 Canada-Prince Edward Island LMAPD Evaluation
- WDC meetings minutes 2018 to 2019
Québec:
- 2018 to 2019 WDA Annual Plan
- 2019 to 2020 WDA Annual Plan
- 2018 to 2019 WDA Annual Report
- Canada-Québec Evaluation of the LMAPD (March 2018)
- WDC meetings minutes 2018 to 2019
Saskatchewan:
- 2018 to 2019 WDA Annual Plan
- 2019 to 2020 WDA Annual Plan
- 2018 to 2019 WDA Annual Report
- 2014 to 2018 Canada-Saskatchewan LMAPD Evaluation Report
- WDC meetings minutes 2018 to 2019
Yukon:
- 2018 to 2019 WDA Annual Plan
- 2019 to 2020 WDA Annual Plan
- 2018 to 2019 WDA Annual Report
Appendix D: Survey methodology and respondent profile
National survey methodology
ESDC contracted a consulting firm to undertake the design, implementation and reporting on a national survey of participants under the guidance of the WDA Evaluation Steering Committee. The purpose of the survey was to identify the short-term labour market outcomes of WDA participants.
The contractor was provided with a sample of 42,741 individuals who participated in WDA-funded programs and services between April 1, 2018 and September 30, 2019. From this original sample, 30,678 individuals were invited to participate in the survey. Of these, 5,707 individuals in 8 jurisdictions, or 18%, completed the survey either over the phone or by completing an online questionnaire during the winter and spring of 2021. The overall margin of error is +/- 1% with a 95% confidence level.
Survey data from the completed sample was compared with the overall sampled portion of the population. A Random Iterative Method was used to create the weight. The weight was calculated using cross tabulation software to correct for response bias between the distribution of the sample frame and the completed sample.
Further details about the survey design, implementation and outcomes of participation are documented in a survey report entitled National survey of participants under the Workforce Development Agreements, 2021.
| Characteristics | % of survey respondents |
|---|---|
| Gender: Female | 52 |
| Gender: Male | 44 |
| Age: 15 to 24 | 20 |
| Age: 25 to 54 | 63 |
| Age: 55 and over | 9 |
| Indigenous (self-reported) | 10 |
| Persons with disabilities (self-reported) | 13 |
| Visible minorities (self-reported) | 13 |
| Immigrants (self-reported) | 37 |
| Marital status: Single | 51 |
| Marital status: Married or common-law | 46 |
| Education level: Less than high school | 15 |
| Education level: High school diploma or equivalent | 25 |
| Education level: Some post-secondary training | 11 |
| Education level: College or other non-university certificate or diploma | 14 |
| Education level: University degree | 20 |
| Programs and services: Literacy, adult basic education, essential skills and language training | 28 |
| Programs and services: Employer-sponsored training | 27 |
| Programs and services: Skills development and/or Work experience | 20 |
| Programs and services: Short-term Training | 18 |
| Programs and services: Occupational Training | 5 |
| Programs and services: Job placement | 1 |
| Programs and services: Wage subsidy | 1 |
| Employment status at start of action plan: Unemployed | 51 |
| Employment status at start of action plan: Employed | 45 |
| Employment status at start of action plan: Self-employed | 3 |
British Columbia survey methodology
WDA participants in British Columbia were surveyed 3 months post-intervention, and those who responded to the 3-month survey were surveyed again 9 months later (12 months post-intervention). The 3-month survey assessed short-term outcomes and the 12-month survey assessed longer-term outcomes, including whether participants obtained sustained employment.Footnote 59 The findings presented in this report are based on the 12-month survey.
For the reference period of April 1, 2018 through to September 30, 2019, WDA programming in British Columbia supported 27,467 participants. Of those, 4,515 were invited to participate in the 12-month survey. The survey dates range from July 2019 to March 2021.Footnote 60 In this time frame, 3,017 participants completed the survey resulting in a response rate of 66%.
Participants in the following WDA-funded programs were surveyed:
- British Columbia Employer Training Grant
- Community Workforce Response Grant
- Employment Training Program (Skills Training and Employment Programs for Vulnerable and Under-Represented Groups) that includes:
- Project Based Training
- Industry Training Authority Pre-apprenticeship Training
- Employment Services and Supports
- Indigenous Skills Training
- BladeRunners
- Older Workers
- Survivors of Violence and/or Abuse
- Young Adults
- Young Adults at Risk
Because the 12-month survey sample consists only of participants who also completed the 3-month survey, the results do not represent a truly random sampling of 12-month participants. Accordingly, results may be skewed depending on who responded to the 3-month survey.
| Characteristics | % of WDA survey respondents in British Columbia |
|---|---|
| Gender: Female | 46 |
| Gender: Male | 53 |
| Age: 15 to 24 | 13 |
| Age: 25 to 54 | 68 |
| Age: 55 and over | 19 |
| Indigenous | 9 |
| Persons with disabilities | 7 |
| Visible minorities | 21 |
| Immigrants | 35 |
| Education level: High school or less | 20 |
| Education level: Some post-secondary training | 15 |
| Education level: College or other non-university certificate or diploma | 25 |
| Education level: University degree | 40 |
| Intervention: British Columbia Employer Training Grant | 60 |
| Intervention: Employment Training Program | 35 |
| Intervention: Community Workforce Response Grant | 5 |
| Employment status at start of action plan: Unemployed | 34 |
| Employment status at start of action plan: Employed | 63 |
| Employment status at start of action plan: Self-employed | 3 |
Appendix E: Additional labour market outcome tables
| Subgroups of survey respondents | n= | February 2020 | Survey date winter 2021 |
|---|---|---|---|
| Female | 1551 | 41% | 40% |
| Male | 1151 | 47% | 45% |
| Under 25 years | 817 | 42% | 42% |
| 25 to 34 years | 682 | 45% | 40% |
| 35 to 44 years | 555 | 50% | 51% |
| 45 to 54 years | 316 | 40% | 42% |
| 55 years and over | 228 | 29% | 22% |
| Born in Canada | 1602 | 37% | 34% |
| Not born in Canada | 1164 | 51% | 52% |
| Arrive to Canada prior to 2011 | 400 | 34% | 25% |
| Arrived to Canada between 2011 and 2015 | 2321 | 45% | 44% |
| Arrived to Canada in 2016 to 2017 | 786 | 51% | 50% |
| Arrived to Canada in 2018 to 2019 | 1832 | 40% | 39% |
| Indigenous | 505 | 26% | 24% |
| Not Indigenous | 2190 | 48% | 46% |
| Visible minority | 1551 | 43% | 41% |
| Not visible minority | 1151 | 41% | 40% |
| Persons with disabilities | 817 | 47% | 45% |
| Not persons with disabilities | 682 | 42% | 42% |
| Total sample | 2,803 | 45% | 40% |