
Quarterly financial report for the quarter ended September 30, 2017
Official title: Employment and Social Development Canada - Quarterly Financial Report Statement Outlining Results, Risks and Significant Changes in Operations, Personnel and Programs - For the Quarter Ended September 30, 2017
On this page
- 1.0 Introduction
- 2.0 Highlights of Fiscal Quarter and Fiscal Year–to–date results
- 3.0 Risks and uncertainties
- 4.0 Significant changes in operations, personnel and programs
- 5.0 Approval by senior officials
- Table 1A: Statement of authorities (unaudited) (in thousands of dollars) Fiscal Year 2017-2018
- Table 1B: Statement of authorities (unaudited) (in thousands of dollars) Fiscal Year 2016-2017
- Table 2A: Departmental budgetary expenditures by standard object (unaudited) (in thousands of dollars) Fiscal Year 2017-2018
- Table 2B: Departmental budgetary expenditures by standard object (unaudited) (in thousands of dollars) Fiscal Year 2016-2017
1.0 Introduction
This quarterly report has been prepared by management as required by section 65.1 of the Financial Administration Act and in the form and manner prescribed by the Treasury Board. This quarterly report should be read in conjunction with the Main Estimates for the current year.
1.1 Authority, mandate and programs
The mission of Employment and Social Development Canada (ESDC), including the Labour Program and Service Canada, is to build a stronger and more inclusive Canada, to support Canadians in helping them live productive and rewarding lives and improving Canadians’ quality of life.
ESDC delivers a range of programs and services that affect Canadians throughout their lives. The Department provides seniors with basic income security, supports unemployed workers, helps students finance their post-secondary education and assists parents who are raising young children. The Labour Program contributes to social and economic well-being by fostering safe, healthy, fair and inclusive work environments and cooperative workplace relations in the federal jurisdiction. Service Canada helps citizens access ESDC’s programs, as well as other Government of Canada programs and services.
The Minister of Families, Children and Social Development, the Minister of Employment, Workforce Development and Labour and the Minister of Sport and Persons with Disabilities are responsible for this organization.
To fulfill its mission, the Department is responsible for:
- developing policies that ensure all can use their talents, skills and resources to participate in learning, work and their community;
- delivering programs that help Canadians move through life’s transitions, from school to work, from one job to another, from unemployment to employment, from the workforce to retirement;
- providing income support to seniors, families with children and Employment Insurance beneficiaries;
- fostering inclusive growth by providing opportunity and assistance to Canadians with distinct needs, such as Indigenous people, people with disabilities, homeless people, and recent immigrants;
- overseeing labour relations, occupational health and safety, labour standards, employment equity and workers’ compensation in the federal jurisdiction; and
- delivering programs and services on behalf of other departments and agencies, such as passport services delivered on behalf of Immigration, Refugees and Citizenship Canada and services to veterans delivered on behalf of Veterans Affairs Canada.
Included in these core roles are responsibilities for the design and delivery of some of the Government of Canada’s most well-known programs and services, including:
- Old Age Security (OAS);
- the Canada Pension Plan (CPP);
- Employment Insurance (EI);
- Canada Student Loans and Grants and Canada Apprentice Loans Program;
- the Canada Education Savings Program (Canada Education Savings Grant and Canada Learning Bond);
- the Wage Earner Protection Program; and
- passport services.
These direct benefits to Canadians are part of Canada’s social safety net and represent 95 percent of the Department’s expenditures.
Further details on ESDC’s authority, mandate and programs may be found in Part II of the Main Estimates and in the Departmental Plan.
1.2 Basis of presentation
This quarterly report has been prepared by management using an expenditure basis of accounting. The accompanying Statement of Authorities (Table 1) includes ESDC’s spending authorities granted by Parliament, consistent with the Main Estimates and the budgetary authorities used by the Department for the 2017-2018 Fiscal Year. This quarterly report has been prepared using a special-purpose financial reporting framework designed to meet financial information needs with respect to the use of spending authorities.
The authority of Parliament is required before moneys can be spent by the Government. Approvals are given in the form of annually approved limits through appropriation acts or through legislation in the form of statutory spending authorities for specific purposes.
As part of the departmental performance reporting process, ESDC prepares its annual departmental financial statements on a full accrual basis in accordance with Treasury Board accounting policies, which are based on Canadian generally accepted accounting principles for the public sector. However, the spending authorities voted by Parliament remain on an expenditure basis.
The quarterly report has not been subject to an external audit or review.
1.3 ESDC’s financial structure
ESDC has a complex financial structure, with various funding mechanisms used to deliver its mandate. This includes budgetary authorities, comprised of voted and statutory authorities, as well as non-budgetary authorities. The voted budgetary authorities include Vote 1 (Operating Expenditures), vote-netted revenues, and Vote 5 (Grants and Contributions), while the statutory authorities are mainly comprised of the Old Age Security Program, the Canada Student Loans and Grants and Canada Apprentice Loans Program, the Canada Education Savings Program, the Canada Disability Savings Program, the Wage Earner Protection Program, Federal Workers’ Compensation and employee benefit plans (EBP). The non-budgetary authorities consist of loans disbursed under the Canada Student Financial Assistance Act and the Apprentice Loans Act.
It should be noted that EI and CPP benefits and related administrative costs are administered through specified purpose accounts and not through appropriations from government. The EI Operating Account and the CPP are financed by employers and employees. Federal administrative costs incurred by departments in the delivery of programs related to EI and CPP are charged to the respective accounts and reported as revenues credited to the vote. The EI Operating Account and the CPP are excluded from ESDC’s Main and Supplementary Estimates. However, they are presented in the Departmental Plan. Accordingly, these accounts are not reflected in the Quarterly Financial Report.
2.0 Highlights of Fiscal Quarter and Fiscal Year–to–date results
This section highlights the significant items that contributed to the net increase in resources available for the year and the net increase in actual expenditures for the quarter ending September 30, 2017.
ESDC’s total budgetary authority available in the second quarter ending September 30, 2017 was $58,050 million, which represents an overall increase of $1,853 million from the previous year. Much of this increase relates to an increase in statutory items. Statutory items are payments to be made under legislation previously approved by Parliament and are non-discretionary. Total Year-to-Date (YTD) budgetary authorities used as of the second quarter ending September 30, 2017 were $28,773 million. In comparison, total YTD budgetary authorities used as of the second quarter of the previous year were $28,717 million, representing a year-over-year increase of $56 million.
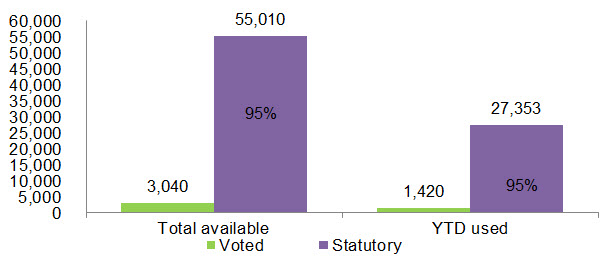
Figure 1 – Text description
| Details | Total available | Percentage total available | YTD used | Percentage YTD used |
|---|---|---|---|---|
| Voted | 3,040 | 5% | 1,420 | 5% |
| Statutory | 55,010 | 95% | 27,353 | 95% |
| Total | 58,050 | 100% | 28,773 | 100% |
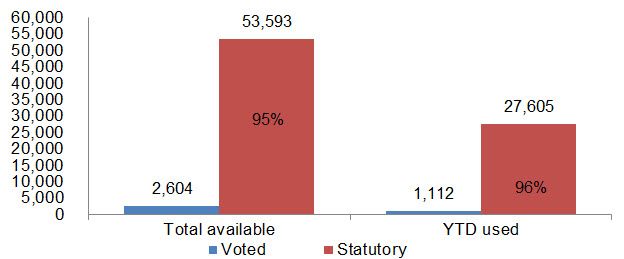
Figure 2 – Text description
| Details | Total available | Percentage total available | YTD used | Percentage YTD used |
|---|---|---|---|---|
| Voted | 2,604 | 5% | 1,112 | 4% |
| Statutory | 53,593 | 95% | 27,605 | 96% |
| Total | 56,197 | 100% | 28,717 | 100% |
2.1 Significant changes to authorities
ESDC’s budgetary authorities available for use increased by $1,853 million compared to the second quarter of 2016-2017 (Tables 1 and 2).
This increase is primarily associated with statutory items. In particular, forecasted OAS pension and Guaranteed Income Supplement (GIS) payments represent an increase of $1,724 million and $1,044 million respectively owing to changes in average benefit payments and in the number of beneficiaries. This increase is mainly offset by a decrease of $1,901 million from the Universal Child Care Benefit (UCCB), as planned spending was adjusted to include only retroactive payments pertaining to benefits paid prior to July 2016. The UCCB has been replaced by the Canada Child Benefit announced in Budget 2016, and administered by the Canada Revenue Agency as of July 2016. Other factors contributing to the increase include:
- An increase of $461 million in Canada Student Loans and Grants for Students and Apprentices mostly explained by an increase to Canada Student Grants as a result of Budget 2016 measures to make post-secondary education more affordable for low- and middle-income families;
- An increase of $454 million in Voted Grants and Contributions to fund government initiatives announced in Budget 2016, mainly to support early learning and child care; and
- An increase of $107 million to Registered Disability Savings Grants and Bonds which is due to a steady increase in total registered Canada Disability Savings Plans and participation in the program.
These increases are offset by a decrease of $19 million to Vote 1 — Operating expenditures, mainly due to a reduction in resources for the Temporary Foreign Worker Program pending authority approval following Budget 2017 funding renewal, and a decrease of $17 million for other items.
| Detail | Amount (in millions of dollars) |
|---|---|
| Total budgetary authorities available for use — 2016-2017 | 56,197 |
| Changes to authorities available for use | |
| Old Age Security Payments | 1,724 |
| Guaranteed Income Supplement Payments | 1,044 |
| Canada Student Loans and Grants and Canada Apprentice Loans Program | 461 |
| Vote 5 — Grants and contributions | 454 |
| Canada Disability Savings Programs | 107 |
| Other | (17) |
| Vote 1 — Operating Expenditures | (19) |
| Universal Child Care Benefit | (1,901) |
| Sub-total – Changes to authorities available for use | 1,853 |
| Total budgetary authorities available for use — 2017-2018 | 58,050 |
For non-budgetary loans, there is a net decrease in authorities of $621 million from 2016-2017 mainly as a result of Budget 2016 measures which increased Canada Student Grants and reduced the disbursement of Canada Student Loans as more borrowers will have their financial needs met by the increase in grants.
As shown in Table 2, total authorities related to personnel expenditures have decreased by $38 million mainly due to a reduction of resources for the Temporary Foreign Worker Program, the EI Inventory Reduction Strategy to address the accumulated inventory of EI claims, and Budget 2016 measures to improve EI. In addition, there is a decrease to the amount of Employee Benefit Plans (EBP) as a result of a reduction to the EBP rate.
The decrease of $36 million in authorities recoverable from the Employment Insurance Operating Account is mostly attributable to a reduction in resources for the EI Inventory Reduction Strategy, and the completion of Budget 2016 measures, and other related initiatives to improve EI.
As well, variances to other operating expenditures (standard objects 02, 03, 04, 05, 06, 07 and 09) are the result of adjustments made to authorities available for use to bring them more in line with actual historical spending trends.
2.2 Significant changes to expenditures
Overall, the proportion of ESDC’s total budgetary expenditures as of September 30, 2017 is comparable to the usual spending presented at the second quarter, with approximately 50% of the authorities available for use expensed.
Compared to the previous year, total budgetary expenditures as of the quarter ending September 30, 2017 have increased by $56 million (0.2%), from $28,717 million to $28,773 million (refer to Tables 1 and 2).
This 0.2% increase is primarily explained by an overall increase of $186 million in Vote 1 – Operating Expenditures and an increase of $122 million in Vote 5 — Grants and Contributions. The increase in operating expenditures, as compared to the same period last year, is mainly attributable to retroactive payments for earnings to employees in relation with collective agreements recently signed. For voted grants and contributions, the increase of $122 million is mostly attributable to the new transfer agreements with provinces and territories to support Early Learning and Child care (ELCC).These new transfers account for $76 million of the increase between the two years.The remaining $46 million variance mainly relates to the Youth Employment Strategy and the Homelessness Partnering Strategy.
Those increases are partly offset by a decrease to the statutory expenditures from $27,605 million for the second quarter in 2016-2017 to $27,353 million for the same period in 2017-2018, representing a $252 million decrease as of the end of the second quarter of 2017-2018.
The main reason for this decrease is a reduction of $1,939 million that relates to the Universal Child Care Benefit, which was replaced by the new Canada Child Benefit introduced in Budget 2016 and administered by the Canada Revenue Agency effective July 1, 2016.
This reduction is offset by increases to other statutory payments such as OAS pension payments which have increased by $997 million and GIS payments which have also increased by $455 million. The main factors explaining these increases are the aging population, thus a greater number of seniors receiving OAS and GIS benefits, in addition to higher average amounts paid to beneficiaries, mainly explained by an increase of the GIS top-up amount for single seniors in July 2016, and the indexation of benefits.
In addition, payments under the Canada Student Loans and Grants and Canada Apprentice Loans Program have increased by $188 million compared to the spending as at September 30, 2016, mostly due to increased grant amounts for low-income, middle-income and part-time students provided through the Canada Student Grants.Enhancements to the Canada Student Grants took effect August 1, 2016
An increase of $38 million compared to the second quarter of 2016-2017 for the Canada Education Savings Program can be mainly attributed to more Canadians opening Registered Education Savings Plans and requesting the education savings incentives for their children.
Other smaller changes, equating $9 million, also contribute to the variance.
| Detail | Amount (in millions of dollars) |
|---|---|
| Total budgetary authorities used as of September 30, 2016 | 28,717 |
| Changes in authorities used | |
| Universal Child Care Benefit | (1,939) |
| Old Age Security Payments | 997 |
| Guaranteed Income Supplement Payments | 455 |
| Vote 1 — Operating expenditures | 186 |
| Canada Student Loans and Grants and Canada Apprentice Loans Program | 188 |
| Vote 5 — Grants and contributions | 122 |
| Canada Education Savings Program | 38 |
| Other | 9 |
| Sub-total – Changes in authorities used | 56 |
| Total budgetary authorities used as of September 30, 2017 | 28,773 |
In Table 1, the net amount of non-budgetary loans disbursed under the Canada Student Financial Assistance Act has increased by $198 million at the end of the second quarter, primarily due to an increase in loans being issued.
In Table 2, the expenditure increase in professional services and rentals (standard object 04 and 05) is mostly attributable to the timing of payments rather than changes in spending patterns.
3.0 Risks and uncertainties
The delivery of our programs and services is impacted by factors such as economic fluctuations, demographic shifts, technological developments and government priorities, to which the Department must respond accordingly. The Department has identified corporate level risk and mitigation strategies for 2017-2018 in the Key Risks section of the Departmental Plan. The following report identifies risks which have a potential financial impact and provides a brief overview of progress to date to reduce them.
3.1 Human resource management
There is a risk that the Department will not be able to sustain a sufficient workforce or attract skilled employees with the appropriate competencies to meet current and future organizational needs.
Risk response strategies:
- A 2017-2018 Workforce Action Plan has been developed.
- Significant improvement has been made, specifically in terms of increased senior leadership capacity and innovative hiring approaches.
3.2 Investment planning and project management
There is a risk that major projects may be over budget, face substantial delays and/or not be completed within scope.
Risk response strategy:
- An Investment Advisory Group was formalized to provide investment recommendations to senior management through the use of a new investment prioritization methodology.
3.3 Policy on results
There is a risk that ESDC may not adequately meet the objectives or expected results of Treasury Board Secretariat's Policy on Results thereby limiting its ability to effectively achieve and communicate results to Canadians.
Risk response strategy:
- The 2018-2019 Departmental Results Framework has been developed and approved by the Minister.
4.0 Significant changes in operations, personnel and programs
Budget 2016 introduced the new Canada Child Benefit, one simple, tax-free, and more generous benefit targeted to families who need it most. The new, income-tested Canada Child Benefit came into effect and replaced the UCCB on July 1, 2016. The UCCB payments were made to eligible recipients only for the months of April, May, and June 2016. ESDC is still disbursing payments for retroactive claims, and other adjustments, and this responsibility has not been transferred to any another department.
5.0 Approval by senior officials
Original document was signed in Gatineau, Canada by:
- Mark Perlman, Chief Financial Officer, on November 20, 2017
- Louise Levonian, Deputy Minister, on November 20, 2017
Table 1A: Statement of authorities (unaudited) (in thousands of dollars) Fiscal Year 2017-2018
| Vote | Total available for use for the year ending March 31, 2018Footnote 1 | Used during the quarter ended September 30, 2017 | Year to date used at quarter-end |
|---|---|---|---|
| 1 – Operating expenditures | 613,485 | 275,049 | 481,681 |
| 5 – Grants and contributions | 2,426,924 | 392,185 | 937,709 |
| (S) – Contributions to employee benefit plans | 240,013 | 57,853 | 115,709 |
| (S) – Minister of Families, Children and Social Development—Salary and motor car allowance | 84 | 21 | 42 |
| (S) – Minister of Employment, Workforce Development and Labour—Salary and motor car allowance | 84 | 35 | 42 |
| (S) – Old Age Security Pension Payments (Old Age Security Act) | 38,810,000 | 10,014,243 | 19,825,075 |
| (S) – Guaranteed Income Supplement Payments (Old Age Security Act) | 11,848,000 | 2,848,817 | 5,672,986 |
| (S) – Canada Student Grants to qualifying full and part-time students pursuant to the Canada Student Financial Assistance Act | 1,135,016 | 508,397 | 594,067 |
| (S) – Canada Education Savings grant payments to Registered Education Savings Plan (RESP) trustees on behalf of RESP beneficiaries to encourage Canadians to save for post-secondary education for their children | 843,000 | 179,043 | 385,697 |
| (S) – Payments related to the direct financing arrangement under the Canada Student Financial Assistance Act | 795,376 | 97,974 | 154,506 |
| (S) – Allowance Payments (Old Age Security Act) | 497,000 | 131,036 | 262,790 |
| (S) – Canada Disability Savings Grant payments to Registered Disability Savings Plan (RDSP) issuers on behalf of RDSP beneficiaries to encourage long-term financial security of eligible individuals with disabilities | 371,500 | 57,698 | 152,833 |
| (S) – Canada Disability Savings Bond payments to Registered Disability Savings Plan (RDSP) issuers on behalf of RDSP beneficiaries to encourage long-term financial security of eligible individuals with disabilities | 200,600 | 14,228 | 31,430 |
| (S) – Canada Learning Bond payments to Registered Education Savings Plan (RESP) trustees on behalf of RESP beneficiaries to support access to post-secondary education for children from low-income families | 143,000 | 77,716 | 105,735 |
| (S) – Wage Earner Protection Program payments to eligible applicants owed wages and vacation pay, severance pay and termination pay from employers who are either bankrupt or in receivership as well as payments to trustees and receivers who will provide the necessary information to determine eligibility | 49,250 | (17) | 8,119 |
| (S) – Payments of compensation respecting government employees (Government Employees Compensation Act) and merchant seamen (Merchant Seamen Compensation Act) | 44,000 | 10,668 | 35,777 |
| (S) – Universal Child Care Benefit (Universal Child Care Benefit Act) | 24,000 | 2,307 | 3,525 |
| (S) – The provision of funds for interest and other payments to lending institutions and liabilities under the Canada Student Financial Assistance Act | 7,359 | 1,414 | 2,805 |
| (S) – Payment related to direct financing arrangement under the Apprentice Loans Act | 3,219 | 1,591 | 1,792 |
| (S) – Civil Service Insurance actuarial liability adjustments | 145 | - | - |
| (S) – Supplementary Retirement Benefits—Annuities agents' pensions | 35 | - | - |
| (S) – The provision of funds for interest payments to lending institutions under the Canada Student Loans Act | - | - | - |
| (S) – The provision of funds for liabilities including liabilities in the form of guaranteed loans under the Canada Student Loans Act | (3,572) | (1,473) | (1,457) |
| (S) – Spending of proceeds from the disposal of surplus Crown assets | 224 | 1 | 1 |
| (S) – Refunds of amounts credited to revenues in previous years | 13 | 1 | 13 |
| (S) – Spending pursuant to section 12(4) of the Canada Education Savings Act | 1,652 | 887 | 1,651 |
| (S) - Energy Cost Benefit | - | - | - |
| Sub-total – Statutory items | 55,009,998 | 14,002,440 | 27,353,138 |
| Total budgetary | 58,050,407 | 14,669,674 | 28,772,528 |
| Non-budgetary | |||
| (S) – Loans disbursed under the Canada Student Financial Assistance Act | 280,883 | 1,297,581 | 1,056,956 |
| (S) – Loans disbursed under the Apprentice Loans Act | 77,880 | 6,263 | 16,735 |
| Total non-budgetary | 358,763 | 1,303,844 | 1,073,691 |
Table 1B: Statement of authorities (unaudited) (in thousands of dollars) Fiscal Year 2016-2017
| Vote | Total available for use for the year ending March 31, 2017Footnote 1 | Used during the quarter ended September 30, 2016 | Year to date used at quarter-end |
|---|---|---|---|
| 1 – Operating expenditures | 631,759 | 174,940 | 295,606 |
| 5 – Grants and contributions | 1,972,638 | 294,507 | 815,624 |
| (S) – Contributions to employee benefit plans | 266,027 | 60,427 | 120,854 |
| (S) – Minister of Families, Children and Social Development—Salary and motor car allowance | 84 | 28 | 35 |
| (S) – Minister of Employment, Workforce Development and Labour—Salary and motor car allowance | 84 | 28 | 35 |
| (S) – Old Age Security Pension Payments (Old Age Security Act) | 37,086,490 | 9,475,681 | 18,828,244 |
| (S) – Guaranteed Income Supplement Payments (Old Age Security Act) | 10,804,379 | 2,649,792 | 5,217,897 |
| (S) – Canada Student Grants to qualifying full and part-time students pursuant to the Canada Student Financial Assistance Act | 763,845 | 368,646 | 430,496 |
| (S) – Canada Education Savings grant payments to Registered Education Savings Plan (RESP) trustees on behalf of RESP beneficiaries to encourage Canadians to save for post-secondary education for their children | 824,000 | 171,712 | 365,043 |
| (S) – Payments related to the direct financing arrangement under the Canada Student Financial Assistance Act | 705,088 | 81,480 | 132,651 |
| (S) – Allowance Payments (Old Age Security Act) | 515,878 | 125,653 | 257,108 |
| (S) – Canada Disability Savings Grant payments to Registered Disability Savings Plan (RDSP) issuers on behalf of RDSP beneficiaries to encourage long-term financial security of eligible individuals with disabilities | 322,900 | 57,219 | 138,104 |
| (S) – Canada Disability Savings Bond payments to Registered Disability Savings Plan (RDSP) issuers on behalf of RDSP beneficiaries to encourage long-term financial security of eligible individuals with disabilities | 142,200 | 20,199 | 49,491 |
| (S) – Canada Learning Bond payments to Registered Education Savings Plan (RESP) trustees on behalf of RESP beneficiaries to support access to post-secondary education for children from low-income families | 133,000 | 68,720 | 88,583 |
| (S) – Wage Earner Protection Program payments to eligible applicants owed wages and vacation pay, severance pay and termination pay from employers who are either bankrupt or in receivership as well as payments to trustees and receivers who will provide the necessary information to determine eligibility | 49,250 | 5,758 | 11,490 |
| (S) – Payments of compensation respecting government employees (Government Employees Compensation Act) and merchant seamen (Merchant Seamen Compensation Act) | 44,000 | 8,265 | 21,839 |
| (S) – Universal Child Care Benefit (Universal Child Care Benefit Act) | 1,924,955 | 45,231 | 1,942,569 |
| (S) – The provision of funds for interest and other payments to lending institutions and liabilities under the Canada Student Financial Assistance Act | 6,892 | 660 | 1,300 |
| (S) – Payment related to direct financing arrangement under the Apprentice Loans Act | 4,273 | 859 | 1,284 |
| (S) – Civil Service Insurance actuarial liability adjustments | 145 | - | - |
| (S) – Supplementary Retirement Benefits—Annuities agents' pensions | 35 | - | - |
| (S) – The provision of funds for interest payments to lending institutions under the Canada Student Loans Act | 1 | - | - |
| (S) – The provision of funds for liabilities including liabilities in the form of guaranteed loans under the Canada Student Loans Act | (4,080) | (1,721) | (2,107) |
| (S) – Spending of proceeds from the disposal of surplus Crown assets | 248 | 37 | 38 |
| (S) – Refunds of amounts credited to revenues in previous years | 45 | 7 | 45 |
| (S) – Spending pursuant to section 12(4) of the Canada Education Savings Act | 2,803 | - | 284 |
| (S) - Energy Cost Benefit | - | - | - |
| Sub-total – Statutory items | 53,592,542 | 13,138,681 | 27,605,283 |
| Total budgetary | 56,196,939 | 13,608,128 | 28,716,513 |
| Non-budgetary | |||
| (S) – Loans disbursed under the Canada Student Financial Assistance Act | 861,806 | 1,099,661 | 858,770 |
| (S) – Loans disbursed under the Apprentice Loans Act | 118,164 | 10,161 | 23,785 |
| Total non-budgetary | 979,970 | 1,109,822 | 882,555 |
Table 2A: Departmental budgetary expenditures by standard object (unaudited) (in thousands of dollars) Fiscal Year 2017-2018
| Details | Planned expenditures for the year ending March 31, 2018Footnote 1 | Expended during the quarter ended September 30, 2017 | Year to date used at quarter-end |
|---|---|---|---|
| Expenditures | |||
| (01) Personnel | 1,884,421 | 606,600 | 1,071,817 |
| (02) Transportation and communications | 58,788 | 12,420 | 22,469 |
| (03) Information | 65,961 | 2,946 | 12,320 |
| (04) Professional and special services | 663,948 | 142,775 | 277,114 |
| (05) Rentals | 262,565 | 56,338 | 112,722 |
| (06) Repair and maintenance | 5,392 | 572 | 723 |
| (07) Utilities, materials and supplies | 9,581 | 1,492 | 2,398 |
| (09) Acquisition of machinery and equipment | 36,048 | 6,155 | 7,318 |
| (10) Transfer payments | 57,033,138 | 14,306,015 | 28,111,935 |
| (12) Other subsidies and payments | 4,223 | 98 | 3,348 |
| Total gross budgetary expenditures | 60,024,065 | 15,135,411 | 29,622,164 |
| Less: Revenues netted against expenditures | |||
| Recoverable expenditures on behalf of the Employment Insurance Operating Account | (1,329,026) | (307,350) | (614,466) |
| Recoverable expenditures on behalf of the Canada Pension Plan | (316,217) | (75,832) | (151,665) |
| Amounts recoverable from Crown agencies and other government departments regarding payments of injury compensation benefits | (124,671) | (35,560) | (36,046) |
| Other amounts recoverable from provincial and territorial governments, other departments or other programs within a department | (203,744) | (46,995) | (47,459) |
| Total revenues netted against expenditures | (1,973,658) | (465,737) | (849,636) |
| Total net budgetary expenditures | 58,050,407 | 14,669,674 | 28,772,528 |
Table 2B: Departmental budgetary expenditures by standard object (unaudited) (in thousands of dollars) Fiscal Year 2016-2017
| Details | Planned expenditures for the year ending March 31, 2017Footnote 1 | Expended during the quarter ended September 30, 2016 | Year to date used at quarter-end |
|---|---|---|---|
| Expenditures | |||
| (01) Personnel | 1,921,963 | 471,607 | 914,399 |
| (02) Transportation and communications | 61,432 | 13,859 | 23,864 |
| (03) Information | 57,898 | 8,398 | 17,886 |
| (04) Professional and special services | 665,697 | 144,950 | 253,370 |
| (05) Rentals | 274,814 | 93,640 | 102,269 |
| (06) Repair and maintenance | 11,488 | 814 | 1,430 |
| (07) Utilities, materials and supplies | 9,591 | 1,572 | 2,607 |
| (09) Acquisition of machinery and equipment | 30,684 | 3,654 | 4,627 |
| (10) Transfer payments | 55,133,096 | 13,348,610 | 28,252,552 |
| (12) Other subsidies and payments | 4,573 | 265 | 315 |
| Total gross budgetary expenditures | 58,171,236 | 14,087,369 | 29,573,319 |
| Less: Revenues netted against expenditures | |||
| Recoverable expenditures on behalf of the Employment Insurance Operating Account | (1,364,722) | (336,179) | (631,602) |
| Recoverable expenditures on behalf of the Canada Pension Plan | (299,443) | (77,196) | (136,066) |
| Amounts recoverable from Crown agencies and other government departments regarding payments of injury compensation benefits | (114,566) | (32,755) | (47,932) |
| Other amounts recoverable from provincial and territorial governments, other departments or other programs within a department | (195,566) | (33,113) | (41,208) |
| Total revenues netted against expenditures | (1,974,297) | (479,243) | (856,808) |
| Total net budgetary expenditures | 56,196,939 | 13,608,126 | 28,716,511 |