
Quarterly financial report for the quarter ended December 31, 2019
From: Employment and Social Development Canada
Official Title: Employment and Social Development Canada Quarterly Financial Report Statement Outlining Results, Risks and Significant Changes in Operations, Personnel and Programs for the Quarter Ended December 31, 2019
On this page
- Introduction
- Highlights of fiscal quarter and fiscal year–to–date results
- Risks and uncertainties
- Significant changes in operations, personnel and programs
- Approval by senior officials
1. Introduction
This quarterly report has been prepared by management as required by section 65.1 of the Financial Administration Act and in the form and manner prescribed by the Treasury Board. This quarterly report should be read in conjunction with the Main Estimates for the current year authority, mandate and programs
The mission of Employment and Social Development Canada (ESDC), including the Labour Program and Service Canada, is to build a stronger and more inclusive Canada, to support Canadians in helping them live productive and rewarding lives and improve Canadians’ quality of life.
The Ministers responsible for Employment and Social Development Canada are:
- the Minister of Employment, Workforce Development and Disability Inclusion
- the Minister of Families. Children and Social Development
- the Minister of Labour and
- the Minister of Seniors
ESDC delivers programs and services to each and every Canadian throughout their lives in a significant capacity. ESDC fulfills its mission by:
Developing policies that ensure Canadians can use their talents, skills and resources to participate in learning, work and their community;
Delivering programs that help Canadians move through life’s transitions, from school to work, from one job to another, from unemployment to employment, from the workforce to retirement;
Providing income support to seniors, families with children and those unemployed due to job loss, illness or caregiving responsibilities;
Helping Canadians with distinct needs, such as Indigenous people, persons with disabilities, homeless people, travelers and recent immigrants;
Ensuring labour relations stability by providing mediation services;
Promoting a fair and healthy workplace by enforcing minimum working conditions, promoting decent work and employment equity, and fostering respect for international labour standards; and
Delivering programs and services on behalf of other departments and agencies.
Further details on ESDC’s authority, mandate and programs can be found in Part II of the Main Estimates and in the Departmental Plan.
1.1 Basis of presentation
This quarterly report has been prepared by management using an expenditure basis of accounting. The accompanying Statement of Authorities (Table 3) includes ESDC’s spending authorities granted by Parliament, consistent with the Main Estimates and the budgetary authorities used by the Department for the fiscal year ending March 31, 2020. This quarterly report has been prepared using a special-purpose financial reporting framework designed to meet financial information needs with respect to the use of spending authorities.
The authority of Parliament is required before moneys can be spent by the Government. Approvals are given in the form of annually approved limits through appropriation acts or through legislation in the form of statutory spending authorities for specific purposes.
As part of the departmental performance reporting process, ESDC prepares its annual departmental financial statements on a full accrual basis in accordance with Treasury Board accounting policies, which are based on Canadian generally accepted accounting principles for the public sector. However, the spending authorities voted by Parliament remain on an expenditure basis.
The quarterly report has not been subject to an external audit or review.
1.2 ESDC’s financial structure
ESDC has a complex financial structure, with various funding mechanisms used to deliver its mandate. This includes budgetary authorities, comprised of voted and statutory authorities, as well as non-budgetary authorities.
The voted budgetary authorities include:
- vote 1 (Operating Expenditures)
- vote-netted revenues and
- vote 5 (Grants and Contributions)
The statutory authorities are mainly comprised of:
- the Old Age Security (OAS) Program
- the Canada Student Loans Program
- the Canada Apprentice Loan
- the Canada Education Savings Program
- the Canada Disability Savings Program
- the Wage Earner Protection Program
- Federal Workers’ Compensation and
- employee benefit plans (EBP).
The non-budgetary authorities consist of loans disbursed, net of reimbursements, under the Canada Student Financial Assistance Act and the Apprentice Loans Act.
The Department is financed by four main sources of funds:
- appropriated funds from the Consolidated Revenue Fund (CRF)
- the Employment Insurance (EI) Operating Account
- the Canada Pension Plan (CPP) and
- other government departments and Crown corporations
EI and CPP benefits and related administrative costs are charged against revenues earmarked in separate specified purpose accounts and not through appropriations from government. The EI Operating Account and the CPP are financed by employers and employees. Federal administrative costs incurred by departments in the delivery of programs related to EI and CPP are charged to the respective accounts and reported as revenues credited to the vote. While presented in the Departmental Plan, the EI Operating Account and the CPP are excluded from ESDC’s Main and Supplementary Estimates. Accordingly, these accounts are not reflected in the Quarterly Financial Report.
Departmental costs related to the delivery of programs and services on behalf of other government departments, which are mainly for passport services and the administration of the Government Employee Compensation Act, were previously reported as revenues netted against ESDC’s expenditures. However, in 2018, the Department of Employment and Social Development Act was amended to broaden the Department’s mandate to include service delivery to the public for partners with a view to improving services to Canadians.
The Department now has the legislative authority to deliver services to the public for partners on a cost-recovery basis as well as to deliver specific services for the Government of Canada. As a result, departmental costs related to the delivery of programs and services on behalf of other government departments are reported, for the fiscal year ending March 31, 2020, under a new statutory authority. The Department will recover its service delivery costs from partners under a non-respendable revenue authority.
2. Highlights of fiscal quarter and fiscal year-to-date results
This section highlights the significant items that contributed to the net increase in resources available for the year and the net increase in actual expenditures for the quarter ending December 31, 2019.
ESDC’s total budgetary authority available in the third quarter ending December 31, 2019 was $65,035 million, which represents an overall increase of $3,938 million from the previous year. Much of this increase relates to an increase in statutory items. Statutory items are payments to be made under legislation previously approved by Parliament and are non discretionary.
Total year-to-date (YTD) budgetary authorities used as of the third quarter ending December 31, 2019 were $48,715 million. In comparison, total YTD budgetary authorities used as of the third quarter of the previous year were $45,842 million, representing a year-over-year increase of $2,873 million.
Figure 1: Quarter ended December 31, 2019
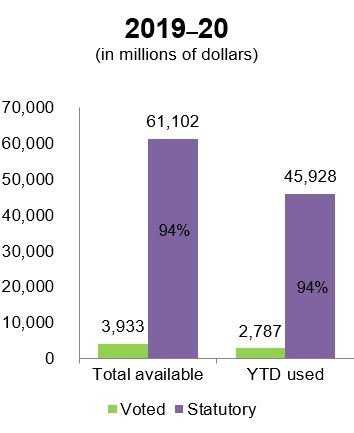
Text description
| 2019 to 2020 (in millions of dollars) | ||||
|---|---|---|---|---|
| Authorities | Total available | % Total available | YTD Used | % YTD Used |
| Voted | 3,933 | 6% | 2,787 | 6% |
| Statutory | 61,102 | 94% | 45,928 | 94% |
| Total | 65,035 | 100% | 48,715 | 100% |
Figure 2: Quarter ended December 31, 2018
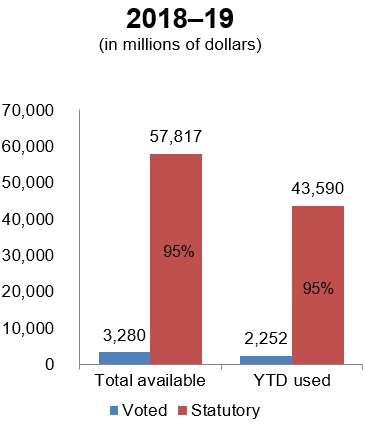
Text description
| 2018 to 2019 (in millions of dollars) | ||||
|---|---|---|---|---|
| Authorities | Total available | % Total available | YTD used | % YTD Used |
| Voted | 3,280 | 5% | 2,252 | 5% |
| Statutory | 57,817 | 95% | 43,590 | 95% |
| Total | 61,097 | 100% | 45,842 | 100% |
2.1 Significant changes to authorities
ESDC’s budgetary authorities available for use increased by $3,938 million compared to the third quarter of the fiscal year ending March 31, 2019 (Tables 3 and 4).
This increase is primarily associated with forecasted OAS pension and Guaranteed Income Supplement (GIS) amount, which increased by $1,900 million and $633 million respectively, owing to expected changes in the average monthly benefit payments and in the number of beneficiaries. Other factors contributing to the increase include:
An increase of $502 million in Grants and Contributions (Vote 5), mainly related to:
- the investments announced in Budget 2017, Budget 2018 and Budget 2019
- to the Workforce Development Agreements
- the Youth Employment and Skills Strategy
- the Student Work Placement
- the Indigenous Early Learning and Child Care programs
- the Future Skills Program
- the Canada Service Corps and
- Canada’s Innovation and Social Finance Strategy
An increase of $335 million in the Canada Student Loans Program and the Canada Apprentice Loan mostly due to the implementation of Budget 2016 and Budget 2017 measures that increased the number of low-and middle-income students, including those with dependent children, eligible for the Canada Student Grants;
A new statutory item of $195 million due to the Department of Employment and Social Development Act that was recently amended to broaden the Department’s mandate to include service delivery to the public for partners with a view to improving services to Canadians. The Department will recover its service delivery costs from partners;
An increase in net operating expenditures (Vote 1) of $152 million, mainly related to:
- additional funding approved for the OAS Service Improvement Strategy
- the OAS Workload,
- the Technical Stabilization and Remediation, the Reaching Home program (formerly Homelessness Partnering Strategy) and
- the Youth Employment Strategy;
An increase of $98 million to Canada Disability Savings Grants and Bonds which is due to a steady increase in total Registered Disability Savings Plans and participation in the program;
An increase of $69 million to the Canada Education Savings Grant and the Canada Learning Bond, due to more people saving for the post-secondary education of their children, and to the implementation of Budget 2017 measures to make it easier for families to apply for Canada Learning Bond;
An increase of $61 million to contributions to employee benefit plans, which is mostly related to additional personnel resources approved for the implementation of Budget 2019 measures and to an increase in rate; and
A decrease of $7 million for other items.
| Detail | (in millions of dollars) |
|---|---|
| Total budgetary authorities available for use for the fiscal year ending March 31, 2019 | 61,097 |
| Changes to authorities available for use | |
| Old Age Security Payments | 1,900 |
| Guaranteed Income Supplement Payments | 633 |
| Vote 5— Grants and contributions | 502 |
| Canada Student Loans Program and Canada Apprentice Loans | 335 |
| Spending of Revenues pursuant to subsection 5.2(2) of the Department of Employment and Social Development Act | 195 |
| Vote 1 — Operating expenditures | 152 |
| Canada Disability Savings Program | 98 |
| Canada Education Savings Program | 69 |
| Contributions to employee benefit plans | 61 |
| Other | (7) |
| Sub-Total –Changes to authorities available for use | 3,938 |
| Total budgetary authorities available for use – 2019 to 2020 | 65,035 |
Related to non-budgetary loans, there is a net increase in authorities of $339 million from the fiscal year ending March 31, 2019, mainly because the introduction of a fixed student contribution model, to determine Canada Student Loans Program eligibility, had a bigger impact than expected on the issuance of loans. This model allows students to gain valuable work experience without having to worry about a reduction in the amount of their financial assistance, as announced in Budget 2016 and Budget 2017.
As shown in Table 4, total authorities related to personnel expenditures have increased by $365 million mainly due to the implementation of Budget 2019 measures in the fiscal year ending March 31, 2020.
Variances to other operating expenditures (standard objects 02, 03, 04, 05, 06, 07 and 09) are the result of adjustments made to authorities available for use to align them with actual historical spending trends.
2.2 Significant changes to expenditures
Overall, the proportion of ESDC’s total budgetary expenditures as of December 30, 2019 is comparable to the usual spending presented at the end of the third quarter, with approximately 75% of the authorities available for use expensed.
Compared to the previous year, total budgetary expenditures as of the quarter ending December 31, 2019 have increased by $2,873 million (6%) from $45,842 million to $48,715 million (refer to Tables 3 and 4).
This 6% increase is primarily explained by the rise in OAS pension and GIS payments by $1,624 million and $497 million respectively, due to the increased number of beneficiaries and the indexation of benefit amounts. Other factors contributing to the increased expenditures include:
An increase of $587 millions in Grants and Contributions (Vote 5) expenditures, partly attributable to:
- the Workforce Development Agreements
- the Youth Employment and Skills Strategy
- the Indigenous Early Learning and Child Care
- the Student Work Placement
- the Indigenous Skills and Employment Training Program and
- Canada’s Innovation and Social Finance Strategy
An increase of $108 million in expenditures under the new statutory authority for the delivery of services to the public on behalf of partners, which mainly relates to passport services. Gross spending is comparable to the fiscal year ending March 31, 2019, which was netted against expenditures in previous years;
An increase of $67 million under the Canada Education Savings Grant and the Canada Learning Bond, due to more people saving for the post-secondary education of their children, and to the implementation of Budget 2017 measures to make it easier for families to apply for the Canada Learning Bond;
An increase of $35 million under the Wage Earner Protection Program (WEPP) mainly due to the Budget 2018 increase to the WEPP maximum payment amount from $3,977 to $7,148;
An increase of $35 million in net compensation payments to government employees due to system changes by a Workers’ Compensation Board that created processing delays which were overtook in the first half of 2019-20;
A net decrease of $52 million in operating expenditures (Vote 1), mainly due to timing with regard to Revenues netted against expenditures; and
Other smaller changes, representing a decrease of $28 million, also contribute to the variance in expenditures.
| Details | (in millions of dollars) |
|---|---|
| Total budgetary authorities used as of December 31, 2018 | 45,842 |
| Changes in authorities used | |
| Old Age Security Payments | 1,624 |
| Guaranteed Income Supplement Payments | 497 |
| Vote 5— Grants and contributions | 587 |
| Spending of Revenues pursuant to subsection 5.2(2) of the Department of Employment and Social Development Act | 108 |
| Canada Education Savings Program | 67 |
| Wage Earner Protection Program | 35 |
| Federal Workers' Compensation Payments | 35 |
| Vote 1 — Operating expenditures | (52) |
| Other | (28) |
| Sub-Total - Changes in authorities used | 2,873 |
| Total budgetary authorities used as of December 31, 2019 | 48,715 |
As shown in Table 3, the net amount of non-budgetary loans expenditures under the Canada Student Financial Assistance Act has decreased by $210 million at the end of the third quarter, primarily due to an excess of loans reimbursements received in relation to new loans disbursed to students during the year.
3. Risks and uncertainties
As the Department strives to ensure that Canadians receive high quality and efficient services, it must remain mindful of the changing environment in which it operates as well as the risks that may delay or prevent it from achieving its mission. Across the portfolio, the Department uses standard risk management practices, oversight committees, consultation, and training to anticipate and mitigate the probability and impact of negative events. The Department’s top corporate risks and the efforts being taken to mitigate them are described in the Risks and Mitigation sub-section of the ESDC Departmental Plan for the fiscal year ending March 31, 2019. Risks which have a potential financial impact are explained below and a brief overview of progress to date to reduce them is provided.
In a department the size of ESDC, with its vast and varied programs and benefits, there is a risk that current funding is insufficient to meet the Department's transformation agenda intended to meet rising expectations for service delivery. In addition, the Department has also identified a lack of project management capabilities within its workforce which could result in scheduling delays, cost overruns and ultimately reduce the likelihood of delivering on project benefits.
The Department is committed to strengthen project management and investment planning to direct resources to emerging priorities and deliver results.
Mitigation strategies implemented as of the first quarter of the fiscal year ending March 31, 2020:
- the investment portfolio risk management process has been enhanced to promote better resource management
- a Project Management Competency Development program was established and is being launched
- a risk and benefits advisory service has been launched for all projects and programmes in the investment portfolio
4. Significant changes in operations, personnel and program
The Department will continue to transform the delivery of its services to ensure they meet the evolving expectations of Canadians by:
- providing a world-class service experience with benefits and services delivered when needed
- delivering accurate and consistent service
- resolving issues at the first point of contact
- ensuring that services are accessible to all; and
- continuing to improve online availability and access to programs and services
5. Approval by senior officials
Original document was signed in Gatineau, Canada by:
- Mark Perlman, Chief Financial Officer, on February 18, 2020
- Graham Flack, Deputy Minister, on February 24, 2020
| Vote | (in thousands of dollars) | Total available for use for the year ending March 31, 20201 | Used during the quarter ended December 31, 2019 | Year to date used at quarter-end | Total available for use for the year ending March 31, 20191 | Used during the quarter ended December 31, 2018 | Year to date used at quarter-end |
|---|---|---|---|---|---|---|---|
| 1 | Operating expenditures | 885,396 | 223,919 | 582,626 | 733,807 | 221,451 | 634,310 |
| 5 | Grants and contributions | 3,047,781 | 1,112,010 | 2,204,544 | 2,545,972 | 688,965 | 1,617,998 |
| (S) | Contributions to employee benefit plans | 308,491 | 53,682 | 161,048 | 247,152 | 60,247 | 180,741 |
| (S) | Minister of Families, Children and Social Development—Salary and motor car allowance | 88 | 14 | 58 | 86 | 21 | 64 |
| (S) | Minister of Employment, Workforce Development and Labour—Salary and motor car allowance | 88 | 14 | 58 | 86 | 21 | 64 |
| (S) | Minister of Seniors—Motor car allowance | 88 | 22 | 66 | 86 | 25 | 32 |
| (S) | Old Age Security Payments (Old Age Security Act) | 42,754,294 | 11,292,866 | 33,191,709 | 40,854,760 | 10,719,725 | 31,567,611 |
| (S) | Guaranteed Income Supplement Payments (Old Age Security Act) | 12,894,967 | 3,309,677 | 9,648,104 | 12,262,059 | 3,085,318 | 9,151,303 |
| (S) | Canada Student Grants to qualifying full and part-time students pursuant to the Canada Student Financial Assistance Act | 1,454,300 | 128,739 | 904,041 | 1,190,685 | 161,307 | 876,790 |
| (S) | Canada Education Savings grant payments to Registered Education Savings Plan (RESP) trustees on behalf of RESP beneficiaries to encourage Canadians to save for post-secondary education for their children | 955,000 | 206,393 | 622,790 | 912,000 | 195,403 | 593,896 |
| (S) | Payments related to the direct financing arrangement under the Canada Student Financial Assistance Act | 931,034 | 98,173 | 279,170 | 858,073 | 133,504 | 308,841 |
| (S) | Allowance Payments (Old Age Security Act) | 555,082 | 140,812 | 410,824 | 550,221 | 138,457 | 414,889 |
| (S) | Canada Disability Savings Grant payments to Registered Disability Savings Plan (RDSP) issuers on behalf of RDSP beneficiaries to encourage long-term financial security of eligible individuals with disabilities | 430,700 | 71,079 | 241,855 | 435,456 | 70,214 | 235,561 |
| (S) | Canada Disability Savings Bond payments to Registered Disability Savings Plan (RDSP) issuers on behalf of RDSP beneficiaries to encourage long-term financial security of eligible individuals with disabilities | 336,600 | 14,446 | 44,545 | 233,243 | 16,414 | 49,223 |
| (S) | Spending of Revenues pursuant to subsection 5.2(2) of the Department of Employment and Social Development Act | 194,537 | 39,593 | 107,736 | 0 | 0 | 0 |
| (S) | Canada Learning Bond payments to Registered Education Savings Plan (RESP) trustees on behalf of RESP beneficiaries to support access to post-secondary education for children from low-income families | 185,000 | 42,973 | 180,837 | 159,000 | 27,962 | 142,355 |
| (S) | Wage Earner Protection Program payments to eligible applicants owed wages and vacation pay, severance pay and termination pay from employers who are either bankrupt or in receivership as well as payments to trustees and receivers who will provide the necessary information to determine eligibility | 49,250 | 5,687 | 47,298 | 49,250 | 1,470 | 11,553 |
| (S) | Payments of compensation respecting government employees (Government Employees Compensation Act) and merchant seamen (Merchant Seamen Compensation Act) | 44,000 | 7,129 | 75,216 | 44,000 | 3,121 | 39,945 |
| (S) | Universal Child Care Benefit (Universal Child Care Benefit Act) | 300 | 1,571 | 5,918 | 12,000 | 5,487 | 11,487 |
| (S) | The provision of funds for interest and other payments to lending institutions and liabilities under the Canada Student Financial Assistance Act | 4,028 | 594 | 3,692 | 4,449 | 1,180 | 4,622 |
| (S) | Payment related to direct financing arrangement under the Apprentice Loans Act | 3,144 | 249 | 1,835 | 5,279 | 234 | 2,025 |
| (S) | Civil Service Insurance actuarial liability adjustments | 145 | 0 | 0 | 145 | 0 | 0 |
| (S) | Supplementary Retirement Benefits—Annuities agents' pensions | 0 | 0 | 0 | 35 | 0 | 0 |
| (S) | The provision of funds for liabilities including liabilities in the form of guaranteed loans under the Canada Student Loans Act | (2,402) | (1,446) | (1,370) | (2,889) | (644) | (1,724) |
| (S) | Spending of proceeds from the disposal of surplus Crown assets | 102 | 2 | 2 | 120 | 36 | 36 |
| (S) | Refunds of amounts credited to revenues in previous years | 874 | 22 | 874 | 58 | 11 | 58 |
| (S) | Spending pursuant to section 12(4) of the Canada Education Savings Act | 1,954 | 0 | 1,032 | 2,002 | 0 | 657 |
| Sub-total—Statutory items | 61,101,664 | 15,412,291 | 45,927,338 | 57,817,356 | 14,599,513 | 43,590,029 | |
| Total budgetary | 65,034,841 | 16,748,220 | 48,714,508 | 61,097,135 | 15,509,929 | 45,842,337 | |
| Non-Budgetary | |||||||
| (S) | Loans disbursed under the Canada Student Financial Assistance Act | 1,031,822 | (131,439) | 892,152 | 669,084 | (92,658) | 1,097,484 |
| (S) | Loans disbursed under the Apprentice Loans Act | 41,887 | 7,707 | 18,162 | 65,890 | 9,488 | 22,380 |
| Total Non-Budgetary | 1,073,709 | (123,732) | 910,314 | 734,974 | (83,170) | 1,119,864 | |
1. Includes only authorities available for use and granted by Parliament at quarter-end.
| Expenditures (in thousands of dollars) | Planned expenditures for the year ending March 31, 20201 | Expended during the quarter ended December 31, 2019 | Year to date used at quarter-end | Planned expenditures for the year ending March 31, 20191 | Expended during the quarter ended December 31, 2018 | Year to date used at quarter-end |
|---|---|---|---|---|---|---|
| (01) Personnel | 2,386,749 | 587,514 | 1,651,043 | 2,021,515 | 535,451 | 1,578,169 |
| (02) Transportation and communications | 68,330 | 16,876 | 42,606 | 63,621 | 14,617 | 39,060 |
| (03) Information | 73,533 | 14,745 | 39,265 | 76,839 | 16,537 | 30,877 |
| (04) Professional and special services | 655,703 | 184,981 | 413,495 | 659,927 | 180,465 | 405,578 |
| (05) Rentals | 290,155 | 43,347 | 148,378 | 280,308 | 54,538 | 170,751 |
| (06) Repair and maintenance | 8,568 | 1,983 | 3,767 | 6,557 | 945 | 2,313 |
| (07) Utilities, materials and supplies | 10,026 | 1,561 | 3,616 | 7,539 | 1,456 | 3,835 |
| (09) Acquisition of machinery and equipment | 60,411 | 7,220 | 13,799 | 31,106 | 3,040 | 7,331 |
| (10) Transfer payments | 63,520,921 | 16,418,294 | 47,767,261 | 59,948,391 | 15,205,084 | 44,930,092 |
| (12) Other subsidies and payments | 9,269 | 2,768 | 10,758 | 9,227 | (126) | 22,344 |
| Total gross budgetary expenditures | 67,083,895 | 17,279,289 | 50,093,988 | 63,105,030 | 16,012,007 | 47,190,350 |
| Less: Revenues netted against expenditures | ||||||
| Recoverable expenditures on behalf of the Employment Insurance Operating Account | (1,509,694) | (375,894) | (1,044,156) | (1,321,207) | (323,131) | (940,877) |
| Recoverable expenditures on behalf of the Canada Pension Plan | (413,775) | (109,637) | (282,742) | (351,124) | (88,818) | (251,755) |
| Amounts recoverable from Crown agencies and other government departments regarding payments of injury compensation benefits | (124,685) | (45,538) | (52,582) | (124,671) | (44,221) | (78,200) |
| Other amounts recoverable from provincial and territorial governments, other departments or other programs within a department | (900) | 0 | 0 | (210,893) | (45,908) | (77,181) |
| Total revenues netted against expenditures | (2,049,054) | (531,069) | (1,379,480) | (2,007,895) | (502,078) | (1,348,013) |
| Total net budgetary expenditures | 65,034,841 | 16,748,220 | 48,714,508 | 61,097,135 | 15,509,929 | 45,842,337 |
1. Includes only authorities available for use and granted by Parliament at quarter-end.