
Incremental Impact Analysis of the Youth Employment Strategy – Career Focus Stream
Technical report prepared under the Fourth Summative Evaluation of the Youth Employment Strategy (YES)
By: Andy Handouyahia, Essolaba Aouli, Leeroy Rikhi and Azadeh Heydarirad.
On this page
- List of acronyms
- List of tables
- List of figures
- Executive summary
- 1. Introduction
- 2. Previous research and evaluation studies
- 3. Data and methodology
- 4. Participant’s profile and outcome trends
- 5. Incremental impact
- 6. Cost benefit analysis
- 7. Sensitivity analysis
- 8. Conclusion
- References
- Appendix A: Additional methodology details
- Appendix B: Cost-benefit conceptual framework
- Appendix C: Subgroup incremental impact results
List of acronyms
- YES
- Youth Employment Strategy
- SL
- Skills Link
- CF
- Career Focus
- SWE
- Summer Work Experience
- GBES
- Group-Based Employability Skills
- ESWE
- Employability Skills Work Experience
- WE
- Work Experience
- ESEN
- Employability Skills Entrepreneurship
- ISE
- Individual Skills Enhancement
- CSGC
- Common Systems Grants and Contributions
- AP
- Action Plan
- SEB
- Skills and Employment Branch
- POB
- Program Operation Branch
- SA
- Social Assistance
- EI
- Employment Insurance
- SIN
- Social Insurance Number (masked)
- CRA
- Canada Revenue Agency
- PIF
- Participant Information Form
- STEM
- Science, Technology, Engineering, and Mathematics
- EAS
- Employment Assistance Service
List of tables
- Table 1a: Gender Distribution of CF Participants (T) and their EAS-Only Comparison Group (C)
- Table 1b: Age Distribution of CF Participants (T) and their EAS-Only Comparison Group (C)
- Table 1c: Education level of CF Participants (T) and their EAS-Only Comparison Group (C)
- Table 1d: Other characteristics of CF Participants (T) and their EAS-Only Comparison Group (C)
- Table 1e: Province of residence for CF Participants (T) and their EAS-Only Comparison Group (C)
- Table 1f: Labour Market Characteristics for CF Participants (T) and their EAS-Only Comparison Group (C) – 1-year before participation
- Table 2: Incremental impact for Career Focus (CF), 2010 to 2011 cohort (n=2,744)
- Table 3: Incremental Impact on Earnings by in-program Industry of Work
- Table 4: Incremental Impacts of Career Focus at the Education-Industry Intersection
- Table 5: Estimated Program Cost per Participant for Career Focus (2010 to 2011)
- Table 6a: Costs accounting framework from the perspectives of participants, government, and society
- Table 6b: Benefits accounting framework from the perspectives of participants, government, and society
- Table 7a: Sensitivity Analysis for CBA
- Table 7b: Sensitivity Analysis for CBA – STEM and non-STEM
- Table 8: Summary of Propensity Score Variables*
- Table 9: Mean Standardized Bias and Pseudo R²(Kernel Matching Approach)
- Table 10a: Male (n=1,188) Incremental impact for Career Focus participants using EAS as comparison group
- Table 10b: Female (n=1,540) Incremental impact for Career Focus participants using EAS as comparison group
- Table 10c: Youth between 20 to 24 (n=1,193) Incremental impact for Career Focus participants using EAS as comparison group
- Table 10d: Youth between 25 to 30 (n=1,479) Incremental impact for Career Focus participants using EAS as comparison group
List of figures
- Figure 1: Trends in average earnings over the 1-year pre-program, in-program, and 5–year post-program period for Career Focus stream
- Figure 2: Illustrative example of how the long-term benefits of the CF program exceeds its initial cost from a Government Perspective
- Figure 3: Costs and benefits per participant over 11 years, net present value
- Figure 4: Net Social Cost-Benefit
Executive summary
This report presents the results of the fourth summative evaluation of the Career Focus stream of the Youth Employment Strategy (YES) program. The analysis focused on the socio-economic profiles of participants, medium-term labour market outcomes, and incremental impacts. The costs and benefits from participation are also considered. The Youth Employment Strategy is a horizontal initiative led by ESDC, and delivered in collaboration with 10 other federal departments and agencies. The YES received approximately $520M in 2017 to 2018.
The YES consists of the following 3 program streams, all of which involved youth aged 15 to 30. Each stream has distinct objectives and targets youths with different needs:
- Career Focus (CF) provides youth, who were completing or had completed their post-secondary education, with career-related work experiences
- Skills Link (SL) helps youth who have barriers to employment
- Summer Work Experience (SWE) creates work opportunities for students
This study concentrates on participants who started an ESDC Career Focus intervention during January 2010 to December 2011. It examines their labour market outcomes up to 5 years post-participation. Specifically, this study addresses the following questions:
- did Career Focus reach its eligible participants? What are the characteristics of Career Focus participants?
- what impacts does Career Focus have on supporting participants to obtain employment, decrease reliance on Employment Insurance or Social Assistance and improve income?
- do results vary by region or target groups?
- what was the average cost per participant and what was the cost/benefit of participating in Career Focus?
Methodology
For the ESDC Career Focus intervention, we used the reference period of January 1, 2010 to December 31, 2011 to define the participant cohorts for the analysis. The analyses concentrated on profiles (that is, socio-economic characteristics), labour market outcomes, incremental impacts, and economic benefits. The incremental impacts were measured relative to a comparison group. These comparison cases had the same observed socioeconomic characteristics as Career Focus participants, but had received only minor services through minor Employment Assistance Services (EAS) interventions as part of the Labour Market Development Agreements (LMDA). The comparison group also started their participation in EAS during the same 2010 to 2011 reference period.
We assessed the net impact of Career Focus year-by-year over a 6-year span, (1 year in-program and 5 years post-participation) including both average and cumulative 5-year impacts. The net impact is measured for the following 5 labour market indicators:
- total reported earnings (T4 earnings)
- incidence of employment (proportion employed)
- annual amount of EI benefits collected
- annual amount of Social Assistance benefits used
- dependence on government income support (EI and SA as a proportion of total income)
In addition, we conducted further analyses to assess the influence of field of study on net incremental impacts. These additional analyses focused on measuring the impact of CF for individuals who worked in science, technology, engineering, and mathematics (STEM) industries during the program participation period versus those in non-STEM fields. We did this additional analysis to examine potential biases that may arise from lack of information on the field of study.
Key findings
About 2,744 youth participated in an ESDC Career Focus intervention during the January 1, 2010 to December 31, 2011 period. The highest proportion of participants were those aged 25 to 29, representing 49% of participants, followed by those aged 20 to 24. Female participants (56%) were notably more prevalent than male participants (43%).
The incremental impact analysis indicated that relative to the EAS comparison group, Career Focus participants had higher earnings and incidence of employment. They also experience a small decrease in their reliance on income support relative to the comparison group.
- During the 5 period following an intervention, Career Focus participants increased their average annual earnings by about $5,642. Their incidence of employment also increased by about 3.8% and they were able to decrease their dependence on government-provided income support by 1.8%.
- Further analysis suggests that participants’ field of study is one of the key factors explaining the high impact on earnings. The estimated average treatment effect for participants who worked in the STEM industries was higher than the Career Focus group as a whole during their in-program period.
- approximately 31% of all Career Focus participants worked in STEM industries
- these participants earned approximately $9,581 on average over the 5-year post participation period, compared to $5,642 for overall Career Focus
- moreover, the net impact on average earnings over the 5-year post participation period for those working in non-STEM industries, estimated at $3,235, was lower compared to overall Career Focus
The cost-benefit analysis showed that the total societal economic benefit (government + participant benefit) was $46,293 per participant.
- This period consists of a 1-year in-program period, an observed 5 year post-program period, and a 5 year projection period
- For individuals and governments, the total net benefits were $42,272 and $4,021 respectively. This indicates that the medium term economic benefits of Career Focus primarily accrued to participantsFootnote 1
The cost-benefit sensitivity analysis on the discount rate and marginal cost of public funds showed small fluctuations in outcomes in terms of net present value and rate of return. However, sensitivity analysis with respect to field of study, that is STEM versus non-STEM, revealed substantial variation in the cost-benefit analysis results. The average annual social rate of return for participants who worked in STEM industries during the in-program period is approximately 25%, compared to 13% for those who did not work in STEM industries and 18% overall.
1. Introduction
The ESDC-led, horizontal Youth Employment Strategy represents the government’s commitment to helping to equip youth with the skills, work experience and abilities they need to transition into the labour market. This evaluation will assess whether and to what extent the program is meeting these objectives for the 2010 to 2011 cohort of participants by examining results on:
- the socio-economic profiles of participants
- medium-term labour market outcomes
- incremental impacts (that is, outcomes that can be attributed to participation in the program)
In addition, we used the incremental impacts as the basis for cost-benefit analysis of the program.
The report is structured as follows:
- section 1 describes the core components of Career Focus and recent modernization efforts
- section 2 provides a literature review summarizing past evaluations of YES, and discusses available international evidence on the effectiveness of youth employment programs
- section 3 describes the data sources and main statistical techniques used for the analysis, and the associated strengths and limitations of the methodology
- section 4 presents the results of the analysis on the participant profiles and outcomes
- section 5 presents results for the incremental impacts
- sections 6 and 7 discusses the cost-benefit analysis and sensitivity analysis, respectively
- section 8 offers reflections and conclusions on the findings
1.1 YES program overview
The Youth Employment Strategy is a horizontal initiative led by ESDC and delivered in collaboration with 10 other federal departments and agencies. The YES received approximately $520M in 2017 to 2018. In order to be eligible to participate in YES, youth must meet all of the following criteria:
- be between 15 and 30 years of age
- be a Canadian citizen, permanent resident, or person who has been granted refugee status in Canada
- be legally able to work in Canada
- not be currently receiving Employment Insurance (EI) benefits
YES is divided into the Career Focus (CF), Skills Link (SL) and Summer Work Experience (SWE) program streams. Each of these streams has a different youth target population and corresponding objectives. This report concentrates solely on the Career Focus stream and those who participated in the ESDC initiative during the January 2010 to December 2011 period.
Career Focus (CF) provides funding for employers and organizations to design and deliver activities that enable youth to make informed career decisions and develop their skills. Specifically, CF activities are designed to:
- enable youth to acquire and enhance skills, which include but are not limited to employability skills and advanced employability skills
- provide work experiences, mentoring and coaching
- support youth entrepreneurs to gain self-employment
- help youth obtain skills acquired while participating in exchanges between post-secondary institutions. These can include higher education institutions in other countries where reciprocal exchange of people, knowledge and expertise will occur
- support youth in making informed career decisions, promote the value of education, and promote youth as the labour force of the future
- support research and innovative projects to identify better ways of helping youth prepare and maintain employment to be productive participants in the labour force
1.2 Modernization of the Youth Employment Strategy program
ESDC has re-designed the YES program to address multiple labour market challenges faced by youth, particularly those facing barriers to employment. The new initiative, which began in June 2019, is called the Youth Employment and Skills Strategy (YESS) program. The YESS continues to be led by ESDC and delivered in conjunction with 10 departments and agencies across the Government of Canada. YESS aims to provide more flexible employment services tailored to each individual and enhanced supports for all young Canadians. It also aims to broaden eligibility and offer a wider range of programs to help young people gain the skills, abilities, and experience they need to obtain good-quality jobs.
2. Previous research and evaluation studies
Today’s economic landscape is highly dynamic, and is rapidly and continuously reshaped by factors such as increasing global competition and technological innovation. These forces have resulted in a swiftly-evolving labour market that presents numerous and growing opportunities for both industries and individuals. However, the current pace of change has also led to an increased likelihood of supply-demand mismatches between job requirements and prospective workers’ skill sets. These mismatches making it progressively more challenging for young people in Canada and elsewhere to find consistent and meaningful work.Footnote 2
Moreover, it is not uncommon for those with a post-secondary education to struggle with translating their credentials and training into satisfactory work. These individuals would be deemed “underemployed” in the service industry for some time, with few opportunities for advancement, before settling into more stable, career-related employment (Hoskins et al., 2018). In addition, Dhakal et al. (2018) point out other potential barriers to employment of youth (including those with PSE), such as employer preferences for employees with better credentials and work experience (which are typically accumulated with age), and the absence of adequate transitional support mechanisms (from an institutional, policy perspective).
In Canada, there have been 2 previous summative evaluations of the youth employment strategy, which focused on the 2003 to 2006 and 2008 to 2009 program cohorts. The overarching conclusion from these studies was that some streams of YES targeting disadvantaged youth did not achieve their objectives. In comparison for the Career Focus stream, the incremental impact was highly positive and significant. Another recent Canadian study suggests that co-op programs can help ease the transition to the labour market for recent graduates; as well as, positively impact their income in both the short and long term (Wyonch, 2020).
3. Data and methodology
3.1 Scope
The objective of this study is to measure the incremental impacts and economic benefits resulting from participation in the Career Focus stream of the YES. We estimate the program effect through a counterfactual approach. In this approach, we compare the participants’ labour market outcomes to what would have happened had they not received CF interventions. This study also includes a statistical analysis of Career Focus participants’ socioeconomic profiles and outcome trends.
This study examines Career Focus participants who received an intervention during the January 2010 to December 2011 period. This reference period allows us to measure program impacts on labour market outcomes over a period of at least 5 years following the completion of the intervention.
We examine the following evaluation questions as part of this study:
- did Career Focus reach its eligible participants? What are the characteristics of Career Focus participants?
- what impacts does Career Focus have on supporting participants to obtain employment, decrease reliance on Employment Insurance or Social Assistance and improve income?
- do results vary by region or target groups?
- what was the average cost per participant and what was the benefit of participating in Career Focus?
We addressed questions 1 and 2 by examining descriptive statistics on the socio-demographic characteristics and labour market outcomes of the participants. We addressed question 3 by conducting an incremental impact analysis on:
- employment earnings
- incidence of employment
- use of social assistance
- use of EI benefits
- dependence on income support
Finally, we answered question 4 through a cost-benefit analysis, using the incremental impact findings as input.
3.2 Data
We used the integrated Labour Market Program Data Platform (LMPDP) as our main data source. The Platform contains program administrative data collected through the Common System for Grants and Contributions, linked to the EI benefits databank and Canada Revenue Agency (CRA) taxation files. The Platform includes a large number of variables that are closely linked to individuals’ labour market experiences, such as:
- socio-demographic characteristics of both participants and comparison cases (for example, age, gender, education, marital status, disability, and province of residence)
- background qualifications (for example, occupational group, industry codes)
- labour market history (for example) use of EI benefits, employment, self-employment earnings, use of social assistance, and incidence of employment in the 5-year pre-participation period)
3.3 Unit of analysis
Throughout this report, the unit of analysis was the individual, with respect to their CF intervention, as all participants received only one intervention.
3.4 Outcome indicators
We measured outcome trends and incremental impacts for the following individual-level labour market indicators:
- Employment earnings: the total annual earnings from paid employment and, or self-employment, captured in Canada Revenue Agency (T4) data
- Incidence of employment: binary indicator for the incidence of non-zero annual earnings from employment and/or self-employment, based on T4 data
- Social Assistance benefits used: measures the average amount of Social Assistance used across the 5-year post-participation period, which is captured in CRA data
- Amount of EI benefits received: measures the average amount of EI benefits received across the 5-year post–participation period, which is captured in EI Part I data
- Dependence on income support across the 5-year post–participation period, defined as:
- (EI benefits + Social Assistance benefits)
- (EI benefits + Social Assistance benefits + total earnings)
3.5 Methods for estimating incremental impacts
We built the methodological framework for this study using the same quasi-experimental methods as the evaluation of the LMDAsFootnote 3. The procedure used here measures the effectiveness of the program by comparing the actual outcomes for the participants to their counterfactual outcomesFootnote 4. Because we cannot observe a given individual’s outcomes under both participation and non-participation, an appropriate comparison group is needed to “stand in” as the counterfactual.
We use specialized statistical methods to render the comparison group exchangeable with the participant group. These methods control for all observable factors that can influence both program participation and outcomes, so that the only difference remaining between the 2 groups is participation itself. This exchangeability criterion allows the estimated impacts to be attributed to program participation rather than differences in other factors across the 2 groups. Such differences could include pre-existing socioeconomic characteristics and labour market histories.
For Career Focus, we constructed our comparison group using a subset of individuals aged 15 to 30 who have similar observed characteristics as CF participants. However, the comparison group only received a low-intensity treatment through minor EAS interventions as part of the LMDAs.
We produced the net impact results using a state of-the-art combination of difference-in-differences estimation and propensity score kernel matching methods (Caliendo, 2005). Given the breadth of background variables available in our data, we can be reasonably confident that the impact estimates are robust (Lechner & Wunsch, 2013) in the context of ALMP evaluations. However, there may be some unobserved, relevant characteristics (for example, field of study, confidence, motivation, mental health, etc.) that are not captured in the data. Details on the estimation methods as well as the various validation tests conducted are provided in Appendix A.
This study also investigated how the incremental impact of participating in Career Focus varied among sociodemographic subgroups, such as gender and age (Appendix C). Moreover, we conducted further analyses (discussed in section 3.6) to assess the influence of field of study on net incremental impacts. In particular, these analyses focused on measuring the impact of CF for individuals who worked in science, technology, engineering, and mathematics (STEM) industries versus those who did not.
3.6 Robustness analysis
We conducted a robustness check to examine potential biases that may arise from lack of access to data on the field of study. To do this, we created a proxy for field of study using CRA data on the industries that individuals worked in during their in-program period, broadly categorized in terms of STEM versus non-STEM industries. The methodology for estimating the impacts within these industry subgroups was the same as that used for the overall impact analysis of Career Focus. We examined the distribution of the 5-year annual averages for post-program earnings to check for imbalances related to the selected groups of industry. Moreover, other outcome indicators, such as employment insurance benefits received, income taxes paid and social assistance usage were re-estimated for STEM and non-STEM groups for additional cost-benefit analysis.
We also further partitioned the groups working in the STEM and non-STEM industries by their level of education (that is, college vs. university), and estimated impacts within those categories.
A recent study published by the C.D. Howe Institute (Wyonch, 2020) found that on average, individuals in STEM earned more than their counterparts in other fields of study. This finding led to the conjecture that the overall incremental impact might be levered primarily by the STEM group. Thus, adjusting for field of study should give more robust estimates of program impact. As a result of these findings, we developed a proxy for individuals who (possibly) studied in STEM fields by using industry codes from income tax data to identify participants who worked within STEM-related industries during their CF program participation period. The assumption here is that participants who worked in STEM industries are those who were more likely to have graduated from a STEM field of study. For these participants the estimated treatment effect inform an upper bound of the incremental impact. Conversely, the treatment effect for participants in other fields constitute the lower bound of the incremental impact. The following industry codes were used as proxies for STEM fields of study:
- mining oil and gas
- manufacturing
- utilities
- professional, science or technologies service industries
- health
3.7 Strengths and limitations
The primary strength of this study is its reliance on the rich administrative data in the Labour Market Development Platform. The Platform allows for numerous socioeconomic and labour characteristics to be accounted for in the analysis. Additionally, we used a combination of machine learning and econometric techniques to build an appropriate comparison group that is closely matched to the group of CF participants.
A potential limitation is that the universal eligibility of the Career Focus stream under the YES program creates challenges for comparison group selection. This is because there is no readily available data where we can draw comparison cases. For example, in the case of the LMDAs, EI claimants who do not to take interventions naturally form the comparison group. Another limitation is that this analysis requires linking participants’ administrative records to CRA and EI databases and, for privacy reasons, could only be done for ESDC participants but not other government department.
An additional limitation is the lack of access to data on the field of study for participants and comparison cases, which may result in potential biases. To address this limitation, we conducted further analyses based on a proxy for field of study using CRA data on the industries that individuals worked in during their in-program period, broadly categorized in terms of STEM vs. non-STEM industries.
Lastly, using labour market indicators in assessing program effectiveness does not measure unobservable characteristics of youth that might also affect participation and outcomes. Such characteristics may be confidence, motivation, mental health, etc.
4. Participant’s profile and outcome trends
4.1 Career Focus profile
The socio-demographic profiles of Career Focus participants are presented in Table 1 below, which shows CF participants were more likely to be female (56%) than male (43%). The highest proportions among youth aged 25 to 29 (49%), followed by the 20 to 24 age group. Relative to the Canadian youth population at-large, a relatively lower proportion of Career pocus participants self-identified as a visible minority or a person with a disability, whereas the share of participants who self-identified as Indigenous persons was roughly comparable.
| Gender* | Participants (N=2744) |
Comparison group (n=5,588) |
|---|---|---|
| Male | 43% | 45% |
| Female | 56% | 54% |
| Age | Participants (N=2744) |
Comparison group (n=5,588) |
|---|---|---|
| Under 20 | 3% | 3% |
| 20-24 | 44% | 44% |
| 25 and over | 54% | 53% |
| Education level | Participants (N=2744) |
Comparison group (n=5,588) |
|---|---|---|
| Secondary incomplete | 2% | 2% |
| Secondary complete | 2% | 3% |
| Post-Secondary incomplete | 3% | 4% |
| Post-Secondary complete | 90% | 88% |
| Missing/Unknown | 2% | 3% |
| Other socio demographics characteristics | Participants (N=2744) |
Comparison group (n=5,588) |
|---|---|---|
| Person with disability | 1% | 3% |
| Indigenous status | 5% | 5% |
| Visible minority | 12% | 14% |
| Immigration Status | 4% | 4% |
| Married/Common law | 17% | 17% |
| Separated / Divorced | 1% | 1% |
| Single | 79% | 79% |
| Province/Territory | Participants (N=2744) |
Comparison group (n=5,588) |
|---|---|---|
| Newfoundland and Labrador | 2% | 1% |
| Prince Edward Island | 1% | 1% |
| Nova Scotia | 4% | 5% |
| New Brunswick | 2% | 3% |
| Quebec | 26% | 24% |
| Ontario | 37% | 37% |
| Manitoba | 4% | 4% |
| Saskatchewan | 2% | 2% |
| Alberta | 9% | 10% |
| British Columbia | 12% | 13% |
| The North | 1% | 1% |
| Key labour market indicators in the year preceding the start of participation | Participants (N=2744) |
Comparison group (n=5,588) |
|---|---|---|
| No earnings | 15% | 14% |
| Had earnings | 85% | 86% |
| $1 to $5k | 23% | 22% |
| $5k to $10k | 25% | 25% |
| $10k to $20k | 31% | 30% |
| $20k to $40k | 18% | 18% |
| $40k to $60k | 3% | 4% |
| Over $60k | 1% | 1% |
| Received Employment Insurance | 10% | 11% |
| Received Social Assistance | 2% | 3% |
- Source: ESDC – Labour Market Program Data Platform
- + Socio-Demographic and Labour Market Characteristics of 2010 to 2011 (January 2010 to December 2011) Skills Links Participants (all interventions)
- * Percentages might not add up to 100% due to missing values
4.2 Outcome trends
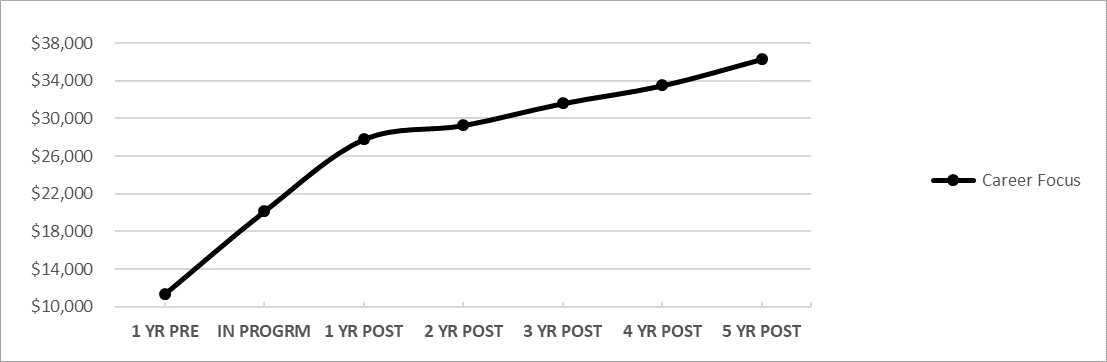
Figure 1 below shows the average trends in earnings across the 1-year pre-program, in-program, and 5-year post-program period for Career Focus participants. The average annual employment earnings of Career Focus participants increased remarkably during and 1-year post participation, followed by steady increases until the end of the study time horizon.
Figure 1: Trends in average earnings over the 1-year pre-program, in-program, and 5–year post-program period for Career Focus stream
Text description of figure 1
| Period | Average earnings |
|---|---|
| 1 year pre | $11,326 |
| In program | $20,112 |
| 1 year post | $27,775 |
| 2 year post | $29,277 |
| 3 year post | $31,609 |
| 4 year post | $33,502 |
| 5 year post | $36,299 |
5. Incremental impact
5.1 Overall incremental impact results
The incremental impact analysis shows that on average, CF participants outperformed their comparison group on all labour market indicators (see Table 2 below). In particular, participants had higher average earnings and incidence of employment during the program, and over the 5 years following participation. Career Focus participants were also less dependent on government income supports, and received less Social Assistance income and EI benefits.
| Indicators | Program start year (0) |
1 yr post-program (1) |
2 yr post-program (2) |
3 yr post-program (3) |
4 yr post-program (4) |
5 yr post-program (5) |
Annual average post-program (1-5) |
Cumulative in & post-program (0-5) |
|---|---|---|---|---|---|---|---|---|
| Total reported earnings ($) | 7156*** | 6391*** | 4901*** | 5248*** | 5741*** | 5926*** | 5642*** | 35366*** |
| Employment Income ($)+ | 7038*** | 6270*** | 4761*** | 5043*** | 5712*** | 5888*** | 5535*** | 34715*** |
| Incidence of employment (pp) | 7.2*** | 5.78*** | 2.94** | 3.21** | 3** | 2.82* | 3.86*** | N/A |
| EI benefits ($) | -459*** | 134* | 89 | 78 | -53 | -50 | 34 | -270 |
| SA benefits ($) | -82* | -148*** | -106** | -98** | -138*** | -112** | -126*** | -710*** |
| Dependence on income support (pp) | -4.48*** | -1.51* | -1.54* | -1.05 | -1.77** | -2.5*** | -1.89*** | N/A |
- Significance level ***1% **5% *10%.
- Total Reported Earnings: Reported on T4 Earnings.
- pp : percentage point.
- +Please note that the Employment Income results were used in the evaluation report.
The main incremental impact findings for specific sociodemographic subgroups are as follows, using the same time horizon as for the overall analyses:
- among males, there was a net increase of 5% in the incidence of employment earnings, and a net increase of $8.5K in average total reported earnings
- for females, there was a net increase of 3.3% in the incidence of employment, and a net increase of $3.3K in average total reported earnings
- for youth aged 20 to 24 years, there was a net increase of 2.3% in the incidence of employment earnings, and a net increase of $5.9K in average total reported earnings
- for youth aged 25 to 30 years, there was a net increase of 4.9% in the incidence of employment earnings, and a net increase of $4.5K in average total reported earnings
5.2 Variability in incremental impacts results by industry of placement
As mentioned previously, there could be potential biases in the estimates of Career Focus impacts, due to the absence of information for field of study. Thus, we conducted a sensitivity analysis to examine whether the heterogeneity of the incremental impacts by the field of study. First, we developed a proxy for individuals who (possibly) studied in STEM fields of study by using industry codes from income tax data. Subsequently, we conducted the net impact analysis according to industry of work (that is, STEM and non-STEM), and by level of education (that is, college and university).
Table 3 below provides the net impacts on five-year post-program average earnings for the CF participants working in STEM and non-STEM industries. The results suggest that the net impact on earnings for participants who worked in STEM industries is substantially higher than the impacts for participants in non-STEM industries.Footnote 5 We can therefore interpret the results for these two groups as constituting a lower and upper bounds of the net impact on earnings for participants.
Moreover, as shown in table 4, the analysis points to incremental impacts on income of Career Focus ranging from approximately $2,500 to about $10,000 per year. These estimates are generally consistent with the results found in a recent paper by the C.D. Howe Institute (Wyonch, 2020) on the impact of co-op programs, by field of study.
| Main categories | Participant | Average over 5 years | Min over 5 years post | Max over 5 years post |
|---|---|---|---|---|
| STEM industries | 861 (31%) | $9,581*** | $8,931*** | $10,141*** |
| Non-STEM industries | 1,883 (69%) | $3,235*** | $2,488*** | $4,098*** |
| Career Focus (Overall) | 2,744 | $5,535*** | $6,391*** | $4,901*** |
- Note: All impacts are significant at the 1% level.
- Ranges and average exclude in-program year.
- (%) = proportion of participant under STEM and Non-STEM.
5.3 Interaction between field and level of education
Using an approach similar to the one undertaken by the C.D. Howe Institute (Wyonch, 2020), we estimated the net incremental impact on 5-year post average earnings by of field of study and highest level of education. Note that unlike the C.D. Howe Institute’s approach, the current analysis does not have information on actual field of study. Instead, it relies on a proxy under the premise that the industry of work during the in-program period most likely corresponds to the participants’ actual field of study. It is recognized that these may not be identical in some cases. The findings presented in Table 4 provide additional nuances around the previous results, showing that participants working in non-STEM industries (about 70% of the CF population) achieved the same benefits from the program regardless of whether they were in university or college. However, participants with a university education who worked in STEM-related industries experienced appreciably higher benefits from the program compare with their college counterparts.
These results are generally consistent with those found in the C.D. Howe study. Some additional limitations of this approach include: (1) the limited sample size for the population working in STEM industries; and (2) lack of information on the full educational trajectory for individuals. For instance, some university graduates may have also subsequently attended college, in order to gain more hands-on experience in their fields.
| Main categories | Participant | Average over 5 years | Min observed impact over 1-5 yrs |
Max observed impact over 1-5 yrs |
|---|---|---|---|---|
| Non-STEM & University | 1,020 (37%) | $3,569*** | $2,788*** | $4,113*** |
| Non-STEM & College | 639 (23%) | $3,760*** | $2,800*** | $4,449*** |
| STEM & University | 462 (17%) | $13,290*** | $12,133 | $14,509*** |
| STEM & College | 295 (11%) | $5,681*** | $4,458*** | $7,793*** |
| Career Focus - Overall | 2,744 (100%) | $5,535*** | $4,901*** | $6,391*** |
- Note: All impacts are significant at the 1% level.
- Ranges and averages exclude the in-program year.
- (%) = proportion of participant under the main categories.
- Percentages do not add up to 100%, due to missing data on education and participants falling outside of common support.
6. Cost benefit analysis
To inform the economic value of a given labour market program, we need methodological frameworks to quantify the various types of costs and benefits involvedFootnote 6. In particular, cost-benefit analysis (CBA) is a key analytical tool used to highlight the distribution of program costs and benefits from a participants’ and governments’ perspective.
This section presents the benefits and costs associated with participation in the Career Focus stream of the YES program. The costs and benefits of Career Focus accumulate to individual participants, governments and society over the short- and long-term (see Appendix A for further details). The impacts of the program begin with participation in Career Focus, which results in participants improving their employability skills and leading to higher earnings’ profiles relative to the earnings’ profiles of non-participants. The cost-benefit analysis compared the financial costs incurred by the Government in delivering the program with the benefits generated by participation (for example, increases in employment earnings, increased tax revenues, decreases in social assistance use).
In addition, given that the program participants were youth, a longer time horizon was required for fully assessing economic returns while meeting the Treasury Board’s guide on Canadian Cost-Benefit Analysis. Therefore, the CBA is based on an observed 5-year period and an additional 5-year projection. It is estimated by computing the difference between the discounted observed and projected net incremental benefits and costs from individual and government perspectives.
As described in more detail below, the CBA focuses on the following three indicators, each with respect to individual-specific benefits (for example, increases in gross employment earnings), government-specific benefits (for example, increases in tax revenues), and societal (individual + government) benefits:
- the Net Present Value (NPV): calculated by subtracting the program cost from the discounted benefits
- Social Rate of Return: calculated as the total net benefits to individuals and government divided by absolute value of total program costs
- payback period: amount of time required for the discounted benefits to equal the discounted costs. If the discounted benefits were inferior to the discounted costs 5 years post-participation, the impacts over the following years were extrapolated depending on the projection scenario used
It is also important to highlight up front that a CBA only provides an approximation of the costs and benefits of program participation. This is due to the difficulties in attributing an exact dollar value to both the full range of benefits (Mason & Tereraho, 2007) stemming from participation and the costs associated with program delivery. However, we addressed this uncertainty through the use of sensitivity analyses on our guiding assumptions.
6.1 Methodology
6.1.1 Costs included in the analysis
Program costs. The program costs are those incurred by the government in delivering the Career Focus program from January 1, 2010 to December 31, 2011. These costs include the administration costs and the direct costs of the program (that is, wage-subsidies received by participating employers and organisations). Table 5 provides a summary of the estimated program costs for the Career Focus stream, including the cost per participant.
| Program name | Program cost | Administration cost | Total cost | Number of participants | Cost per participant |
|---|---|---|---|---|---|
| Career Focus | $20,801,000 | $2,600,000 | $23,401,000 | 2,744 | $8,528 |
The Marginal Social Cost of Public Funds (MSCPF).
In addition, to estimate program costs, we take into account the costs incurred by society associated with raising additional revenues to fund government spending. This is also referred to the Marginal Social Cost of Public Funds (MSCPF). Based on expert advice received during past evaluation studies, the Marginal Social Cost of Public Funds is calculated as follows:
(program costs - impacts on sales taxes - impacts on income taxes - impacts on EI - impacts on social assistance)*20%
In other words, the MSCPF represents 20% of the program cost and subsequent impacts on sales taxes, income taxes as well as on EI and SA outlays. The value of the MSCPF will be calculated from the costs and benefits for the government, and will also be taken into account when calculating the NPV, cost-benefit ratio, and payback period for society. However, to provide a conservative estimate on Net Present Benefit from the governmental perspective, the MSCPF was only applied to direct program costs.
6.1.2 Benefits included in analysis
Employment earnings. Employment earnings benefits consist of incremental impacts on participants’ employment earnings during and after participation (estimated using propensity score matching). Fringe benefits. Fringe benefits (FB) from employment are benefits that supplement employment earnings. Fringe benefits include (but are not limited to) employer-paid health and life insurance, Canada Pension Plan (CPP)/Québec Pension Plan (QPP) contributions, and employer-sponsored pension plan contributions. In line with the methods used by the Ministère et de la Solidarité Sociale du Québec (2006) and the Social Research and Demonstration Corporation (2002), fringe benefits were assumed to comprise 15% of the incremental impact on employment earnings.
Formally, the incremental impact on fringe benefits is defined as:
∆FB = α ∆y where:
- ∆FB is the average treatment effect on fringe benefits
- ∆y is the average treatment effect on employment income
- α is a parameter representing the assumed value of fringe benefits set as a proportion of the effect on employment earnings
Federal and provincial income taxes. The differences between the employment earnings profiles of participants and non-participants also affect their respective amount of federal and provincial income taxes paid. Federal and provincial income taxes paid and the incremental impact on taxes paid were derived from the Canada Revenue Agency tax data. Similar to the impacts on employment earnings, propensity score matching was used to estimate the incremental impact on taxes paid by the participants.
Sales taxes. An increase in employment earnings also increases participants’ sales tax payments, as a result of additional purchasing power. In line with the methods used by the Ministère de l’Emploi et de la Solidarité Sociale du Québec (2006), the sales taxes paid will be simulated by assuming that part of the change in employment earnings is devoted to taxable consumer goods. The proportion of employment earnings spent on taxable goods is estimated at 51% from 2012 to 2016Footnote 7.
However, as not all goods are taxable, the average share of spending typically used to buy taxable goods and services was estimated using data from Statistics Canada’s Survey of Household Spending (Table 11-10-0223-01 Household spending by household income quintile, Canada, regions and provinces). This proportion is estimated at 51% for 2012 to 2016. The sales tax rate is estimated as the sum of the federal sales taxes rate and the weighted average of provincial sales tax rates. The national weighted average of the provincial tax rates between 2010 and 2017 is 7%, whereas the average federal tax rate is 5%. The national average of the propensity to consume between 2012 and 2016 is 0.956 (1-0.044).
Formally, the impact on sales taxes paid is expressed as follows:
∆STP = (tp + tf ) ∆y * (1 –PMS) * λ
where:
- ∆STP is the incremental impact on sale taxes
- ∆Y is the incremental impact on employment net earnings
- tp is the average of provincial sales taxes rate
- tf is the federal sales taxes rate
- PMS is the national average of propensity to save between 2012 and 2017, which is 0.044
- λ is the part of taxable goods and services in the total consumption, estimated at 51% in 2017
Employment Insurance and Social Assistance benefits. Represent the differences in the amount of EI and SA benefits received between participants and their comparison group (EAS), after participation in the initiative. Thus, the reduction of SA and EI benefit use would represent an increase in benefits from the government perspective. Incremental impacts on SA and EI benefits were, similar to employment earnings, estimated using propensity score matching.
Employment Insurance premium. An increase in employment earnings changes the EI premium rate. To account for these fluctuations, the EI premium was identified from Canada Revenue Agency tax data. The incremental impacts on EI premiums were then estimated. As with the impacts on employment earnings, propensity score matching was used to estimate the incremental impacts on EI premiums paid by the program participants.
6.2 Approach for estimating and reporting cost-benefit results
6.2.1 Time frame and discount rate
Program costs were observed at the program start year, with benefits calculated over an 11-year period consisting of the in-program period, an observed 5-year post-program period, and an additional 5-year forecast period.
Because the program costs are incurred at the beginning of participation and benefits are experienced in the years after, all benefits were discounted by 5% starting with the year following the participation start year. The current choice of 5% is representative of the increase in interest on foregone government investmentFootnote 8.
6.2.2 Conceptual and accounting framework
An important aspect of the cost-benefit analysis is to determine who bears a particular cost or benefit (that is, participant, government, and society). What can be a benefit from one perspective could be a cost from another perspective. For example, a decrease in EI benefits received can be viewed as a reduction in income for the participant (that is, a cost), but as a benefit for the government. The costs and benefits assigned to each perspective are identified in Table 6.
The societal perspective combines the participant and government perspectives. For a given factor, a net gain to society occurs only when a gain to one group was not at the expense of another group. For example, higher employment earnings after participation represent a benefit for participants and are neither a benefit nor a cost to the government. Thus, the net result is a gain for society. A cost to society occurs when a factor is a cost from one perspective and not a gain from the other perspective. For example, program costs represent a cost to the government, but not to participants; thus, they are considered a cost to society. Factors that constitute a net gain from one perspective but a net loss from the other perspective are equal to 0 from the societal perspective. For example, EI benefit reductions may represent a cost to participants and a benefit to the government, and neither a cost nor a benefit for society.
| Costs factors included | Participants | Government | Society | Estimation methods |
|---|---|---|---|---|
| Program cost | 0 | - | - | Cost estimates are based on program expenditure and intervention file data |
| MSCPF | 0 | - | - | Estimates are measured as 20% of program costs |
| Benefits factors included | Participants | Government | Society | Estimation methods |
|---|---|---|---|---|
| Employment earnings | + | 0 | + | Observed period values are based on incremental impacts findings, whereas unobserved/ future period are based on fixed average observed periods’ incremental impacts. This includes during program earnings which is associated with the wage subsidy (depending on wage subsidy received by the employer). |
| Fringe benefits | + | 0 | + | Estimates are measured as 15% of employment earnings |
| Federal and provincial income taxes | - | + | 0 | Estimates are based on earnings, federal and provincial income tax rate for future years, and trend function |
| Federal and provincial sale taxes | - | + | 0 | Incremental impacts on net total reported earnings are multiplied by the propensity to consume (96%), the proportion of household spending on taxable goods and service (50%) and by the total average federal and provincial sales tax rate (12%) |
| EI | -/+ | -/+ | 0 | Observed period values are based on incremental impacts findings, whereas unobserved/ future period are based on fixed average observed periods’ incremental impacts |
| SA | -/+ | -/+ | 0 | Observed period values are based on incremental impacts findings, whereas unobserved/ future period are based on fixed average observed periods’ incremental impacts |
| EI Premium | -/+ | -/+ | 0 | Observed period values are based on incremental impacts findings, whereas unobserved/ future period are based on fixed average observed periods’ incremental impacts |
6.3 Results
Results from the cost-benefit analysis are explained below and presented in Figure 2 and 3 for the following key indicators:
- Net Present Value
- annualized social rate of return
- payback period
6.3.1 Net Present Value
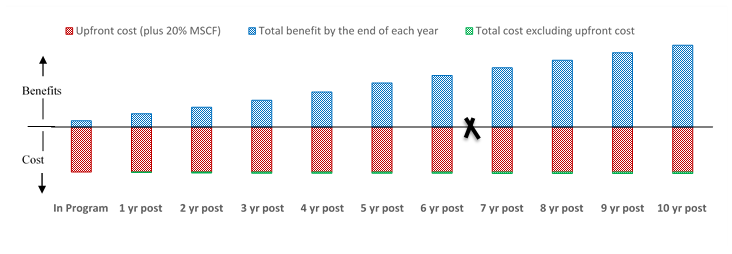
Figure 2 (following page) presents the Net Present Value (NPV) of the costs and benefits for Career Focus over the 1-year in program period and 10-year post-participation period, based on the EAS comparison group.
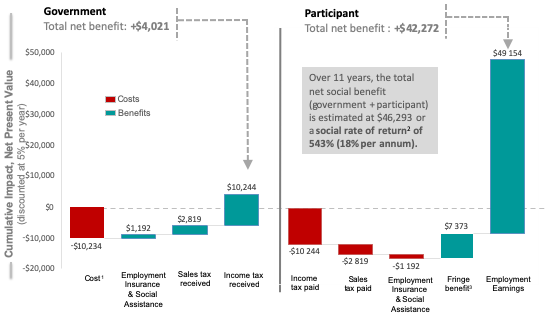
As previously discussed, future Career Focus impacts such as earnings, federal and provincial income taxes, EI benefits, SA benefits, and EI premiums were projected based on the trend over the last 4 years of the observed post-participation period. The NPV indicated that from a societal perspective, the benefits of participation exceeded the costs by $46,293 during program participation and over the 10-year post participation. The societal benefits arose primarily from benefits to participants ($42,272), with a much smaller government benefits ($4,021).
6.3.2 Annualized social rate of return
The annualized social rate of return for Career Focus was 543% over an 11 year time horizon (1-year in-program plus a 10 year post-participation period), which equates to an 18% annual rate of return.
6.3.3 Payback period
As illustrated in Figure 2, from the government’s perspective, it would take 7.4 years (from the start of the program) for future benefits associated with the program to outweigh its initial costs. Whereas from a societal perspective, it would take only about 4 months (0.33 years). Note also that the societal payback period falls within the observed time frame (5-years post-participation), and therefore the projection methods applied in this study are irrelevant in this regard.
Figure 2: Illustrative example of how the long-term benefits of the CF program exceeds its initial cost from a Government Perspective
Text description of figure 2
| Period | Upfront cost (plus 20% MSCF) |
Accumulated benefit | Accumulated cost (excluding up front cost) |
Accumulated cost (including up front cost) |
|---|---|---|---|---|
| In program | -$10,234 | $1,392 | $ - | -$10,234 |
| 1 year post | -$10,234 | $2,991 | -$134 | -$10,368 |
| 2 years post | -$10,234 | $4,450 | -$224 | -$10,592 |
| 3 years post | -$10,234 | $6,021 | -$303 | -$10,895 |
| 4 years post | -$10,234 | $7,899 | -$303 | -$11,198 |
| 5 years post | -$10,234 | $9,966 | -$303 | -$11,501 |
| 6 years post | -$10,234 | $11,685 | -$320 | -$11,820 * |
| 7 years post | -$10,234 | $13,403 | -$336 | -$12,157 |
| 8 years post | -$10,234 | $15,122 | -$353 | -$12,510 |
| 9 years post | -$10,234 | $16,840 | -$370 | -$12,880 |
| 10 years post | -$10,234 | $18,558 | -$387 | -$13,267 |
* break-even point
Figure 3: Costs and benefits per participant over 11 years, net present value
- Source: Administrative Data - Labour Market Program Data Platform cohorts of Career Focus participants from January 1, 2010 to December 31, 2011.
- 1. Cost includes the program direct cost per participant (estimated at $8,528) plus the marginal cost of public funds (estimated at $1,706; that is 20% of the program direct cost per participant).
- 2. The social rate of return (543%) is the net benefit to the society ($46,293) divided by the program direct cost per participant. The annual average social rate of return of 18% per year is equal to 5.43 (543%) plus 1, raised to the power of 1 divided by the number of years covered by the cost-benefit analysis (that is, 11 years).
- 3. Fringe benefit is defined as a proportion of compensation given to employees in addition to wages which approximately represents 15% of the employment earnings.
Text description of figure 3
| Components analysis | Government |
|---|---|
| Cost ($) * | -$10,234 |
| EI & SA benefits ($)** | $1,192 |
| Sales tax paid ($)** | $2,819 |
| Income Tax Received | $10,244 |
| Net present value | $4,021 |
| Components analysis | Government |
|---|---|
| Income Tax Paid | -$10,244 |
| Sales tax paid ($) | -$2,819 |
| EI & SA benefits ($) | -$1,192 |
| Fringe benefit ($)*** | $7,373 |
| Earnings*** ($) | $49,154 |
| Net present value | $42,272 |
6.4 Challenges and limitations
The CBA was based on major quantifiable benefits and costs that are available in the administrative and Canada Revenue Agency tax data files. Although the calculations take into account the majority of the key costs and benefits, some are estimated, or were simply not included due to data limitations.
Participation costs: Participants generally incur some personal costs related to participation in Career Focus, such as travel, tuition, training or job search-related expenses. Unfortunately, given that the administrative data or other available information sources do not provide information on out-of-pocket costs paid by participants, it was not possible to include this information in the analysis.
Tax benefit: Moreover, the analysis does not take into account the Canada Child Benefit (CCB), formerly known as Canadian Child Tax Benefit (CCTB), because it depends on the number of children below 18 (information that is not available in the administrative databases that were used). However, such benefits are likely to be small or largely inapplicable in the case of Career Focus participants.
Indirect benefits: In addition, the CBA does not capture “intangible”, non-pecuniary, and indirect benefits stemming from finding employment. Intangible benefits can include improvement of participants’ mental and physical well-being associated with increased income and reduced duration of unemploymentFootnote 9. However, these hypotheses cannot yet be directly confirmed, as the microdata files required for this type of analysis are currently neither integrated nor accessible to ESDC.
Finally, the CBA does not consider the “displacement effect” (for example, Dahlberg & Forslund, 2005): participants may take away jobs that would otherwise be obtained by other unemployed individuals.
7. Sensitivity analysis
The CBA is based on a number of assumptions about the input parameters, which are considered to be plausible in the current context. However, there will always be uncertainty involved, and therefore we conducted a sensitivity analysis to determine the effect of a reasonable variation in the specific inputs. Table 10 below presents net present value and rate of return over 11 years under various scenarios from all perspectives.
7.1 Economic assumptions
Discount rate: Whereas the principal analysis relied on a discount rate of 5%, the sensitivity analysis examines the variation in the NPV under discount rates of 3%, and 8%. As well, we examine discount rates in combination with different MSCPF scenarios and time horizons for costs and benefits. These alternative rates are in line with the interim Treasury Board Secretariat of Canada (2007) guide for Cost-Benefit Analysis (the “TBS Guide”), which suggests a social discount rate of 3% and 8% percent depending on the circumstances.
As per table 10, cost-benefit outcome indicators show some inverse sensitivity to discount rate assumptions from all perspectives. For instance, both net present value increases when discount rate decreases from 5% to 3% (while keeping MSCPF fixed at 20%) since we are discounting at a lower rate (dividing the future cash flow by a smaller value).
The MSCPF: In the principal analysis, the MSCPF was calculated as 20% of the program cost. For testing a different MSCPF scenario, it is critical to take into account that when youth reach their full potential, Canadians, government and the Canadian economy benefit. Because youth represent one third of the Canadian population, investing in programs that help youth overcome barriers to employment, improves participation in this rapidly growing job market.
Due to the sensitive nature of MSCPF to taxes, we assumed a lower MSCPF of 10% for the sensitivity analysis. Table 10 shows that this change in MSCPF assumption only changes outcomes from a Government perspective, since MSCPF is only added to government costs. Decreasing the MSCPF by 10% (from 20% to 10%), decreases government costs, which positively affects the net present value (net present value being the difference between net benefit present value and net cost present value).
7.2 Field of study
As discussed in Section 5, the net incremental impacts on earnings were highly dependent on field of study. Therefore, we conducted a complementary CBA to determine the corresponding variation in the economic benefits arising from participation, for those who worked in STEM and non-STEM industries. Because industry was itself a sensitivity factor, we did not vary the other input parameters (that is, the original 5% discount rate and a MSCPF of 20% were used).
As discussed in section 5.2, the field of study greatly influences the net incremental impact on employment income. Participants who worked in STEM related industries experienced a much higher impact on income compared to those who worked in non-STEM industries. These impacts translated into a higher net present value and rate of return, as shown in Table 7. Relative to both the non-STEM industry scenario and the overall scenario for all Career Focus participants, the net present value and social rate of return improves substantially under the STEM scenario, and from all perspectives.
| Scenario | Discount rate | MSCPF | Participant Net Present Value over 11 years |
Government Net Present Value over 11 years |
Society Net Present Value over 11 years |
Total social rate of return | Annual social rate of return |
|---|---|---|---|---|---|---|---|
| Base | 5% | 20% | $42,271 | $4,021 | $46,293 | 542.8% | 18.4% |
| Scenario 1 | 5% | 10% | $42,271 | $4,874 | $47,146 | 552.8% | 18.6% |
| Scenario 2 | 3% | 20% | $45,911 | $5,411 | $51,322 | 601.8% | 19.4% |
| Scenario 3 | 3% | 10% | $45,911 | $6,264 | $52,175 | 611.8% | 19.5% |
| Scenario 4 | 8% | 20% | $37,713 | $2,284 | $39,997 | 469% | 17.1% |
| Scenario 5 | 8% | 10% | $37,713 | $3,137 | $40,850 | 479% | 17.3% |
Notes
- Timeframe is 10-years post participation plus 1-year in-program period.
- EAS- Comparison Group.
| Scenario | Discount rate | MSCPF | Participant Net Present Value over 11 years |
Government Net Present Value over 11 years |
Society Net Present Value over 11 years |
Total social rate of return | Annual social rate of return |
|---|---|---|---|---|---|---|---|
| STEM | 5% | 20% | $69,789 | $17,199 | $86,988 | 1,020% | 24.6% |
| non-STEM | 5% | 20% | $25,908 | -$1,036 | $24,873 | 292% | 13% |
Notes
- Timeframe is 10-years post participation plus 1-year in-program period.
- EAS- Comparison Group.
8. Conclusion
Overall, the results indicate that participating in Career Focus leads to a substantial gain in earnings and employment. The analysis by subgroups (Annex C) shows that there was some heterogeneity among CF participants. Whereas all subgroups had very strong earnings and employment gains, these impacts were greater in some subgroups.
The main estimation method used to determine the incremental impacts was propensity score kernel matching combined with the difference-in-differences technique. The econometric model was based on rich information about individuals’ labour market experience, including socio-demographic characteristics as well as labour market history. Other personal and environmental factors, such as motivation, poor self and behavioural management, criminal history, drug use, and lack of social supports can also affect both participation and outcomes. However, these factors are not captured in the available data, and therefore may induce some bias in the results to the extent that they may not be equally distributed into the treatment and comparison groups.
Participants experienced considerable and sustained increases in earnings and employment relative to their comparison group. These findings are consistent with the previous literature and evaluation studies. Programs such as Career Focus can play a role in easing the transition of recent graduates into the labour market, with associated positive long-term impacts.
Moreover, cost-benefit analysis showed that over the 10-year post participation period, the Career Focus program resulted in a significant net positive return on investment from all perspectives. The sensitivity analyses, which used industry of work as a proxy for fields of study, showed large variation in results. However, changing the economic assumptions of the CBA produced only minor fluctuations in the results.
References
- Benach, J et al. (2010). A Micro-level Model of Employment Relations and Health Inequities. International Journal of Health Services. Volume 40 Number 2, 223-227.
- Bjerk, D. (2004). Youth criminal participation and household economic status. Department of Economics Working Paper. Hamilton, ON: McMaster University.
- Butler-Jones, D. (2008). The Chief Public Health Officer’s Report on the State of Public Health in Canada, 2008. Ottawa, ON: Public Health Agency of Canada.
- Caliendo, M., and S. Kopeinig (2005): “Some Practical Guidance for the Implementation of Propensity Score Matching,” Discussion Paper No. 1588, IZA
- Calmfors, L., & Lang, H. (1993). Macroeconomic effects of active labour market programmes- the basic theory. Stockholm, Sweden: Institute for International Economic Studies
- Canadian Institute for Health Information (2018). National Health Expenditure Trends, 1975 to 2018. Ottawa, ON: CIHI.
- Dahlberg, M., & Forslund, A. (2005). Direct displacement effects of labour market programs. Scandinavian Journal of Economics, 107, 475-94.
- Dahlby, B & Ferede, E. (2011). What Does It Cost Society to Raise a Dollar of Tax Revenue?, The Marginal Cost of Public Funds. C.D. Howe Institute, No. 324.
- Dhakal, S.P., Connell, J., & Burgess, J. (2018). Inclusion and work: addressing the global challenges for youth employment. Equality, Diversity and Inclusion: An International Journal, 37(2), 110-120. doi: 10.1108/EDI-12-2017-0290
- Duncan, G. (2005). Income and child well-being. Geary Lecture at the Economic and Social Research Institute. Dublin, Ireland.
- ESDC (2015), Summative evaluation of the Horizontal Youth Employment Strategy https://www.canada.ca/en/employment-social-development/corporate/reports/evaluations/2015-youth-employment.html
- Grün, C., Hauser, W., & Rhein, T. (2010). Is any job better than no job? Life satisfaction and reemployment. Journal of Labor Research, 31(3), 285-306.
- Haveman, R.H., & Weimer, D.L. (2015). Public Policy Induced Changes in Employment: Valuation Issues for Benefit-Cost Analysis. Journal of Benefit-Cost Analysis, 6(1), 112-153.
- Heckman, J. J. and J. A. Smith (1999): “The Pre-Program Earnings Dip and the Determinants of Participation in a Social Program: Implications for Simple Program Evaluation Strategies,” Economic Journal, 109(457), 313–348.
- Hoskins, B., Leonard, P., & Wilde, R.J. (2018). Negotiating uncertain economic times: Youth employment strategies in England. British Educational Research Journal, 44(1), 61–79. doi: 10.1002/berj.3318
- https://www.canada.ca/en/treasury-board-secretariat/corporate/reports/review-methodologies-determine-discount-rates.html#toc5
- International Journal of Health Services, Volume 40, Number 2, Pages 195–207, 2010 © 2010, Baywood Publishing Co., Inc.
- Jackson, P. R., & Warr, P. B. (1984). Unemployment and psychological ill-health: The moderating role of duration and age. Psychological Medicine, 14(3), 605-614.
- Jaison R. Abel & Richard Deitz & Yaquin Su, 2014. "Are recent college graduates finding good jobs?,"Current Issues in Economics and Finance, Federal Reserve Bank of New York, vol. 20.
- Kalleberg, A. L. (2020). Labor Market Uncertainties and Youth Labor Force Experiences: Lessons Learned. The ANNALS of the American Academy of Political and Social Science, 688(1), 258–270.
https://doi.org/10.1177/0002716220913861 - Kluve, J. Youth Labor Market Interventions. IZA World of Labor 2014: 106 doi: 10.15185/izawol.106
- Kluve, J, Puerto, S et al. 2016, Interventions to Improve the Labour Market Outcomes of Youth: a systematic review of training, entrepreneurship promotion, employment services and subsidized employment interventions, Campbell systematic reviews, ILO, Geneva, viewed 27 Feb 2020.
https://www.ilo.org/employment/Whatwedo/Publications/WCMS_508938/lang--en/index.htm - Krahn, H. J., Howard, A. L., & Galambos, N. L. (2015). Exploring or Floundering? The Meaning of Employment and Educational Fluctuations in Emerging Adulthood. Youth & Society, 47(2), 245–266. https://doi.org/10.1177/0044118X12459061
- Lechner, M. (2019) "Modified Causal Forests for Estimating Heterogeneous Causal Effects," Economics Working Paper Series 1901, University of St. Gallen, School of Economics and Political Science.
- Lechner, M. and C. WUNSCH (2011) “Sensitivity of Matching-Based Program Evaluations of the Availability of Control Variables,” CESifo Working Paper No. 3381.
- Leung, A. (2004). The Cost of Pain and Suffering from Crime in Canada. Research and Statistics Division, Department of Justice Canada. Retrieved from:
https://www.justice.gc.ca/eng/rp-pr/cj-jp/victim/rr05_4/rr05_4.pdf - Mason, G., Buchel, A., Haddad, T., & Unruh, D. (2013). Assessing the value for money of active labour market programming for persons with disabilities. The Canadian Journal of Program Evaluation, 27(2), 21–38.
- Mason & Tereraho (2007). Value-for-money analysis of active labour market programs. The Canadian Journal of Program Evaluation. 22(1), 1–29.
- McKee-Ryan, F., Song, Z., Wanberg, C. R., & Kinicki, A. J. (2005). Psychological and physical well-being during unemployment: a meta-analytic study. Journal of Applied Psychology, 90(1), 53-76.
- Mendolia, S. (2014). The impact of husbands’ job loss on partners’ mental health. Review of Economics of the Household. 12(2), 277-94.
- Ministère et de la Solidarité Sociale Québec (2006). Étude sur le rendement de l’investissement relié à la participation aux mesures actives offertes aux individus par Emploi-Québec. Rapport d’évaluation.
- Oreopolos, P., Page, M., & Stevens, A. (2005). The intergenerational effect of worker displacement. National Bureau of Economic Research Working Paper, no. 1587.
- Price, R. (1992). Psychological impact of job loss on individuals and families. Current Directions in Psychological Science. 1(1), 9-10.
- Public Health Agency of Canada. 2016. The Direct Economic Burden of Socio-Economic Health Inequalities in Canada: An Analysis of Health Care Costs by Income Level.
http://publications.gc.ca/collections/collection_2018/aspc-phac/HP35-38-2014-eng.pdf - Refrigeri, L., & Aleandri, G. (2013). Educational policies and youth unemployment. Procedia - Social and Behavioral Sciences, 93, 1263–1268. doi: 10.1016/j.sbspro.2013.10.026
- Rosalie Wyonch, 2020. "Work-Ready Graduates: The Role of Co-op Programs in Labour Market Success," C.D. Howe Institute Commentary, C.D. Howe Institute, issue 562, January 2020.
- Rosenbaum, P. R. and D. B. Rubin (1983): “The Central Role of the Propensity Score in Observational Studies for Causal Effects,” Biometrika, 70(1), 41–50.
- Social Research and Demonstration Corporation (2002). Making Work Pay. Final Report on the Self-Sufficiency Project for Long-Term Welfare Recipients. Retrieved from:
http://www.srdc.org/media/11007/SSP54.pdf - Treasury Board Secretariat of Canada (2007). Canadian Cost-Benefit Analysis Guide: Regulatory Proposals. (Catalogue Number: BT58-5/2007). Retrieved from:
https://www.tbs-sct.gc.ca/rtrap-parfa/analys/analys-eng.pdf - Wyonch, Rosalie. Work-Ready Graduates: The Role of Co-op Programs in Labour Market Success. C.D. Howe Institute Commentary 562.
https://www.cdhowe.org/sites/default/files/attachments/research_papers/mixed/Commentary%20562.pdf - Yeung, W.-J. J., & Yang, Y. (2020). Labor Market Uncertainties for Youth and Young Adults: An International Perspective. The ANNALS of the American Academy of Political and Social Science, 688(1), 7–19.
https://doi.org/10.1177/0002716220913487
Appendix A: Additional methodology details
Propensity score matching methods
Program impacts were measured by using a propensity-score based weighting approach to equate the participant and comparison groups on observed characteristics. Kernel matching was the primary method used to match participants to comparison cases based on their propensity scores. Kernel matching uses the entire control group and re-weights control group members each time they are compared with a new participant, based on propensity-score differentials. The weights are assigned according to a probability density function, called the “kernel” such that small differentials result in large weights, and vice versa.
Inverse Probability Weighting (IPW) and Nearest Neighbour matching approach were used as an alternative method for validation purposes. Note that all of these methods were combined with Difference-in–Differences (DID). DID estimation allows for removing bias from time-invariant unobserved characteristics, by assuming common time trends in the pre- and post-participation period in these unobservable characteristics.
Propensity score model
The first step involved in conducting a matching approach is to estimate the propensity scores of both program participants and comparison cases. Development of a propensity score is based on a logistic regression model to predict the likelihood of participating in CF, based on the background characteristics of CF participants and the comparison group members.
The propensity score model is based on a rich set of background variables (see Table 8 for a summary), including socio-demographic variables, labour market history of individuals (including EI benefits, incidence of employment, and employment earnings in the 5 years preceding program entry). All of the variables included in the estimation of the propensity score are considered to be influential for the participation decision, based on economic theory.
| Socio-Demographics variables | Labour market characteristics |
|---|---|
|
|
*Disaggregating these variables can potentially provide up to 75 more granular variables, for use in the propensity score model.
Machine learning to select a subset of EAS participants as comparison group
As mentioned, the comparison group for Career Focus participants consisted of individuals who shared the same eligibility criteria as CF participants, but had received only minor interventions via EAS as part of the LMDAs. EAS clients may have received a wide range of one-on-one interventions to support their return to work, including computer training, career advice and employment counselling, job preparation and job search supports, job-finding clubs, and short-term training such as first aid certification or food safety.
To identify a comparison group (that is, EAS) of individuals with similar socio-demographics and labour market characteristics as Career Focus participants, a machine learning approach called ‘K-Nearest Neighbor (KNN) discriminative analysis’ was used. K-Nearest Neighbor is a supervised machine learning method that is used to classify individuals with similar characteristics into different groups. The variables used as input to the KNN algorithms were the same set used in the propensity score model. The final set of comparison group members selected for the Career Focus stream includes 5,610 EAS participants.
Balancing test results before and after matching
To ensure that impact estimates are reliable, balancing property tests were carried out on each of the covariates used in the propensity score models before and after matching. Tests for equality of means (t-test) and the standardized differences test (Rosenbaum and Rubin, 1985) were used. The summary of the balancing test results are displayed in Table 3 below. Based on the values of Pseudo R2 and the Mean Bias, the results suggest that, before matching, there were some small differences between the participants and the comparison cases. However, after matching, all of the significant differences virtually disappeared. In addition, the test of standardized differences confirmed that there were no large differences in the covariates between participants and comparison cases in the original sample (that is, before matching), showing that KNN procedure was highly successful in the initial identification of the comparison group. Only a small number of the variables had standardized difference values greater than 20% which is the rule of thumb used by Rosenbaum and Rubin (1985). After matching, the results show a considerable reduction in the standardized difference values for many of the covariates. It should also be noted that three participants were outside of the common support region (that is, their propensity scores were extreme and thus non-overlapping with the rest of the cases), and therefore excluded from the analysis, as no comparable matches for them could be found in the comparison group.
| Program | # Participants before matching |
# Participants after Matching* |
Pseudo R2 before matching |
Pseudo R2 after matching |
Mean Bias before matching |
Mean Bias after matching |
Off-CS** |
|---|---|---|---|---|---|---|---|
| CF | 2,744 | 2,741 | 0.13 | 0.01 | 6.8 | 1.9 | 3 |
- *Number of CF participants remaining after the common support restriction applied (2-step algorithm).
- **Number of CF participants deleted due to the common support restriction (after the 2-step algorithm).
- Standardised bias is defined as the difference of sample means in participant group and matched comparison case subsamples as a percentage of the square root of the average of sample variances in both group.
Appendix B: Cost-benefit conceptual framework
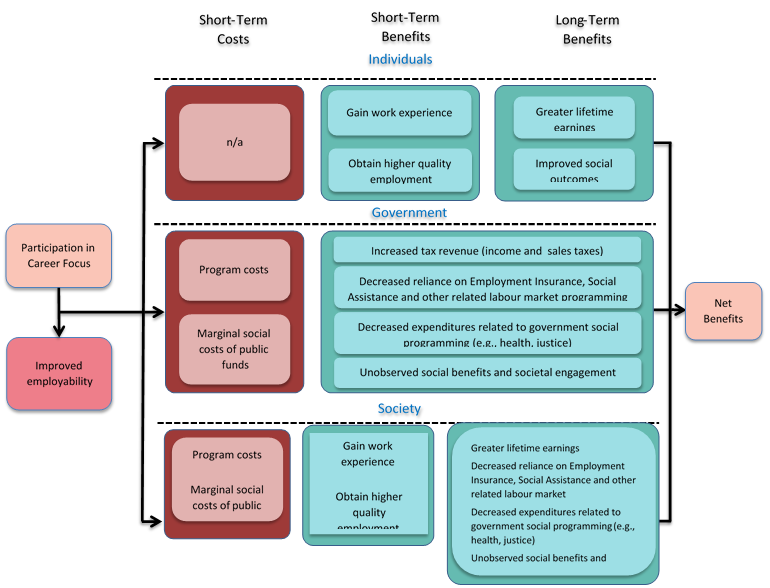
Figure 4: Net Social Cost-Benefit
Text description of figure 4
Figure 4 presents a conceptual framework for how costs and short and long-term benefits might accrue from participation in the Career Focus program for individual, government, and society.
For individual:
- there are no short-term costs
- the short-term benefits are:
- gain work experience
- obtain higher quality employment
- the long-term benefits are:
- greater lifetime earnings
- improved social outcomes
For government:
- the short-term costs are:
- program costs
- marginal social costs of public funds
- the short and long-term benefits are:
- increased tax revenue from income and sales tax
- decreased reliance on employment insurance, social assistance and other related labour market programming
- decreased expenditures related to government social programming (for example, health, justice)
- unobserved social benefits and societal engagement
For society (that is both government and individuals):
- the short-term costs are:
- program costs
- marginal social costs of public funds
- the short-term benefits are:
- gain work experience
- obtain higher quality employment
- the long-term benefits are:
- greater lifetime earnings
- decreased reliance on employment insurance, social assistance and other related labour market programming
- decreased expenditures related to government social programming (for example, health, justice)
- unobserved social benefits and societal engagement
This graphic presents a conceptual framework for how costs and benefits might accrue from participation in the Career Focus program. While not intended to be exhaustive, it includes elements that are not part of the net benefit analysis due to insufficient information on how to quantify the specific cost or benefit, such as the gains from potential improvements to health outcomes, but are reasonably expected to have an effect.
Appendix C: Subgroup incremental impact results
| Indicators | Program start year (0) |
1 yr post-program (1) |
2 yr post-program (2) |
3 yr post-program (3) |
4 yr post-program (4) |
5 yr post-program (5) |
Cumulative post-program (1-5) |
Annual average post-program |
|---|---|---|---|---|---|---|---|---|
| Employment Income ($) | 8552*** | 8784*** | 7370*** | 7259*** | 9052*** | 9956*** | 42423*** | 8484*** |
| Total reported earnings ($) | 8646*** | 8928*** | 7467*** | 7478*** | 9064*** | 9996*** | 42935*** | 8587*** |
| Incidence of employment (pp) | 7.28*** | 7.28*** | 3.34** | 4.16*** | 3.84** | 3.02* | N/A | 5.04*** |
| EI benefits ($) | -566*** | 138 | 35 | 20 | -19 | -173 | -27 | -6 |
| SA benefits ($) | -135*** | -138*** | -121*** | -134*** | -140*** | -115*** | -647*** | -130*** |
| Dependence on income support (pp) | -5.46*** | -2.59*** | -1.63** | -1.72*** | -1.59** | -3.06*** | N/A | -2.22*** |
- Significant level ***1% **5% *10%
- Notes:
- Total Employment Income consists of: T4 earnings, Self-employment earnings, Net farming, Net fishing, Net commission, Net professional earnings, Indigenous earnings, and Other employment income.
- Total reported earnings: Reported on T4
| Indicators | Program start year (0) |
1 yr post-program (1) |
2 yr post-program (2) |
3 yr post-program (3) |
4 yr post-program (4) |
5 yr post-program (5) |
Cumulative post-program (1-5) |
Annual average post-program |
|---|---|---|---|---|---|---|---|---|
| Employment Income ($) | 5857*** | 4656*** | 2900*** | 2972*** | 3192*** | 3056*** | 16777*** | 3355*** |
| Total reported earnings ($) | 5941*** | 4678*** | 2938*** | 2992*** | 2988*** | 2840*** | 16438*** | 3287*** |
| Incidence of employment (pp) | 7.21*** | 6.26*** | 2.89** | 1.73 | 2.39 | 2.71* | N/A | 3.29*** |
| EI benefits ($) | -310*** | 91 | 116 | 128 | -30 | 83 | 445 | 89 |
| SA benefits ($) | -141** | -254*** | -134* | -130** | -213*** | -164*** | -926** | -186** |
| Dependence on income support (pp) | -4.1*** | -2.04* | -1.48 | -1.33 | -2.08** | -2.71** | N/A | -1.82** |
- Significant level ***1% **5% *10%.
- Notes:
- Total Employment Income consists of: T4 earnings, Self-employment earnings, Net farming, Net fishing, Net commission, Net professional earnings, Indigenous earnings, and Other employment income.
- Total reported earnings: Reported on T4.
| Indicators | Program start year (0) |
1 yr post-program (1) |
2 yr post-program (2) |
3 yr post-program (3) |
4 yr post-program (4) |
5 yr post-program (5) |
Cumulative post-program (1-5) |
Annual average post-program |
|---|---|---|---|---|---|---|---|---|
| Employment Income ($) | 6769*** | 6337*** | 4709*** | 4611*** | 6443*** | 7295*** | 29396*** | 5879*** |
| Total reported earnings ($) | 6895*** | 6543*** | 4860*** | 4605*** | 6216*** | 7066*** | 29292*** | 5858*** |
| Incidence of employment (pp) | 7.39*** | 4.26*** | 0.07 | 2.37* | 2.46* | 1.18 | N/A | 2.25* |
| EI benefits ($) | -231*** | 105 | -50 | -37 | -112 | -207* | -402 | -81 |
| SA benefits ($) | -127*** | -188** | -141*** | -86** | -142*** | -107** | -732*** | -147*** |
| Dependence on income support (pp) | -4.54*** | -1.12 | -2.15*** | -1.55** | -2.04*** | -3.17** | N/A | -2.24*** |
- Significant level ***1% **5% *10%.
- Notes:
- Total Employment Income consists of: T4 earnings, Self-employment earnings, Net farming, Net fishing, Net commission, Net professional earnings, Indigenous earnings, and Other employment income.
- Total reported earnings: Reported on T4.
| Indicators | Program start year (0) |
1 yr post-program (1) |
2 yr post-program (2) |
3 yr post-program (3) |
4 yr post-program (4) |
5 yr post-program (5) |
Cumulative post-program (1-5) |
Annual average post-program |
|---|---|---|---|---|---|---|---|---|
| Employment Income ($) | 7253*** | 6034*** | 3805*** | 3790*** | 4033*** | 4315*** | 21978*** | 4395*** |
| Total reported earnings ($) | 7324*** | 5953*** | 3794*** | 4112*** | 4168*** | 4293*** | 22322*** | 4464*** |
| Incidence of employment (pp) | 8.04*** | 6.42*** | 4.56*** | 3.13** | 4.08*** | 4.09*** | N/A | 4.86*** |
| EI benefits ($) | -651*** | 120 | 238* | 21 | -92 | 167 | 482 | 96 |
| SA benefits ($) | -129*** | -216*** | -139*** | -108** | -162*** | -137*** | -812*** | -163*** |
| Dependence on income support (pp) | -6.57*** | -2.44*** | -0.71 | -1.06 | -1.77** | -1.4* | N/A | -1.68** |
- Significant level ***1% **5% *10%.
- Notes:
- Total Employment Income consists of: T4 earnings, Self-employment earnings, Net farming, Net fishing, Net commission, Net professional earnings, Indigenous earnings, and Other employment income.
- Total reported earnings: Reported on T4.