
Incremental impact analysis of the Youth Employment Strategy – Skills Link Stream
Technical report prepared under the Fourth Summative Evaluation of the Youth Employment Strategy (YES)
By: Andy Handouyahia, Essolaba Aouli, Leeroy Rikhi and Azadeh Heydarirad.
On this page
- List of acronyms
- List of tables
- List of figures
- Executive summary
- 1. Introduction
- 2. Previous research and evaluation studies
- 3. Methodology
- 4. Participant’s profile and outcome trends
- 5. Incremental impact
- 6. Conclusion
- References
- Annex A – Skills Link mapping strategy
- Annex B – Detailed methodology
- B.1 Scope
- B.2 Data
- B.3 Unit of analysis
- B.4 Outcome indicators
- B.5 Methods for estimating incremental impacts
- B.6 Propensity score matching methods
- B.7 Propensity score model
- B.8 Machine learning to select a subset of EAS participants as comparison group
- B.9 Robustness check for Skills Link - Using Group-Based Employability Skills participants as an alternative comparison group
- B.10 Balancing test results before and after matching
- B.11 Strengths and limitations
- Annex C – Detailed profiles and outcomes
- Annex D – Subgroup incremental impact analysis
List of acronyms
- YES
- Youth Employment Strategy
- SL
- Skills Link
- CF
- Career Focus
- SWE
- Summer Work Experience
- GBES
- Group-Based Employability Skills
- ESWE
- Employability Skills Work Experience
- WE
- Work Experience
- ESEN
- Employability Skills Entrepreneurship
- ISE
- Individual Skills Enhancement
- CSGC
- Common Systems Grants and Contributions
- AP
- Action Plan
- SEB
- Skills and Employment Branch
- POB
- Program Operation Branch
- SA
- Social Assistance
- EI
- Employment Insurance
- SIN
- Social Insurance Number (masked)
- CRA
- Canada Revenue Agency
- PIF
- Participant Information Form
- STEM
- Science, Technology, Engineering, and Mathematics
- EAS
- Employment Assistance Service
List of tables
- Table 1a: Gender distribution of SL participants by intervention type
- Table 1b: Age distribution of SL participants by intervention type
- Table 1c: Education level of SL participants by intervention type
- Table 1d: Other characteristics of SL participants by intervention type
- Table 1e: Province of residence of SL participants by intervention type
- Table 1f: Action plan outcomes of SL participants by intervention type
- Table 1g: Labour market characteristics of SL participants by intervention type
- Table 2: Overall incremental impact for Skills Link, 2010 to 2011 Cohort (n=28,993)
- Table 3: Incremental impact for GBES, 2010 to 2011 Cohort (n=16,181)
- Table 4: Incremental impact for ESWE, 2010 to 2011 Cohort (n=8,832)
- Table 5 : Incremental impact for WE, 2010 to 2011 Cohort: (n=2,245)
- Table 6: Incremental impact for Individual Skills Enhancement (ISE), 2010 to 2011 Cohort (n=1,425)
- Table 7: Incremental impact for Employability Skills Entrepreneurship (ESEN), 2010 to 2011 Cohort (n=310)
- Table 8: YES – Skills Link Intervention to Evaluation Intervention Types
- Table 9: Summary of propensity Score Model variables*
- Table 10: Machine learning KNN to better classify comparison group into appropriate YES interventions
- Table 11: Mean standardized bias and Pseudo R² before and after the matching
- Table 12a: Gender distribution of SLparticipants (T) and their EAS-Only Comparison Group (C)
- Table 12b: Age distribution of SL participants (T) and their EAS-Only Comparison Group (C)
- Table 12c: Education level of SL participants (T) and their EAS-Only Comparison Group (C)
- Table 12d: Other characteristics of SL participants (T) and their EAS-Only Comparison Group (C)
- Table 12e: Province of residence of SL participants (T) and their EAS-Only Comparison Group (C)
- Table 12f: Labour market characteristics of SL participants (T) and their EAS-Only Comparison Group (C)
- Table 13: GBES clusters' differentials in labour market indicators (1-year pre vs. average over 5 years post participation)
- Table 14a: Male (n=1,337) subgroup incremental impact for Work Experience participants using EAS as comparison group
- Table 14b: Female (n=901) subgroup incremental impact for Work Experience participants using EAS as comparison group
- Table 14c: Youth under 19 (n=605) subgroup incremental impact for Work Experience participants using EAS as comparison group
- Table 14d: Youth between 20 to 24 (n=994) subgroup incremental impact for Work Experience participants using EAS as comparison group
- Table 14e: Youth between 25 to 30 (n=646) subgroup incremental impact for Work Experience participants using EAS as comparison group
- Table 14f: Secondary incomplete (n=932) subgroup incremental impact for Work Experience participants using EAS as comparison group
- Table 14g: Secondary complete (n=579) subgroup incremental impact for Work Experience participants using EAS as comparison group
- Table 14h: Post Secondary complete (n=461) subgroup incremental impact for Work Experience participants using EAS as comparison group
- Table 14i: Indigenous (n=621) subgroup incremental impact for Work Experience participants using EAS as comparison group
- Table 15a: Male (n=6778) subgroup incremental impact for Group-Based Employability Skills participants using EAS as comparison group
- Table 15b: Female (n=9,326) subgroup incremental impact for Group-Based Employability Skills participants using EAS as comparison group
- Table 15c: Youth under 19 (n=5,991) subgroup incremental impact for Group-Based Employability Skills participants using EAS as comparison group
- Table 15d: Youth between 20 to 24 (n=6,847) subgroup incremental impact for Group-Based Employability Skills participants using EAS as comparison group
- Table 15e: Youth between 25 to 30 (n=3,322) subgroup incremental impact for Group-Based Employability Skills participants using EAS as comparison group
- Table 15f: Secondary incomplete (n=8,850) subgroup incremental impact for Group-Based Employability Skills participants using EAS as comparison group
- Table 15g: Secondary complete (n=3,950) subgroup incremental impact for Group-Based Employability Skills participants using EAS as comparison group
- Table 15h: Post Secondary incomplete (n=975) subgroup incremental impact for Group-Based Employability Skills participants using EAS as comparison group
- Table 15i: Post Secondary complete (n=1,757) subgroup incremental impact for Group-Based Employability Skills participants using EAS as comparison group
- Table 15j: Indigenous (n=2,788) subgroup incremental impact for Group-Based Employability Skills participants using EAS as comparison group
- Table 16a: Male (n=5,193) subgroup incremental impact for Employability Skill Work Experience participants using EAS as comparison group
- Table 16b: Female (n=3,589) subgroup incremental impact for Employability Skill Work Experience participants using EAS as comparison group
- Table 16c: Youth under 19 (n=2,858) subgroup incremental impact for Employability Skill Work Experience participants using EAS as comparison group
- Table 16d: Youth between 20 to 24 (n=4,025 subgroup incremental impact for Employability Skill Work Experience participants using EAS as comparison group
- Table 16e: Youth between 25 to 30 (n=1,930) subgroup incremental impact for Employability Skill Work Experience participants using EAS as comparison group
- Table 16f: Secondary incomplete (n=4,534) subgroup incremental impact for Employability Skill Work Experience participants using EAS as comparison group
- Table 16g: Secondary complete (n=2,364) subgroup incremental impact for Employability Skill Work Experience participants using EAS as comparison group
- Table 16h: Post Secondary incomplete (n=523) subgroup incremental impact for Employability Skill Work Experience participants using EAS as comparison group
- Table 16i: Post Secondary complete (n=1,033) subgroup incremental impact for Employability Skill Work Experience participants using EAS as comparison group
- Table 16j: Indigenous (n=1,675) subgroup incremental impact for Employability Skill Work Experience participants using EAS as comparison group
- Table 17a: Male (n=932 subgroup incremental impact for Individual Skills Enhancement participants using EAS as comparison group
- Table 17b: Female (n=470) subgroup incremental impact for Individual Skills Enhancement participants using EAS as comparison group
- Table 17c: Youth under 19 (n=366) subgroup incremental impact for Individual Skills Enhancement participants using EAS as comparison group
- Table 17d: Youth between 20 to 24 (n=658) subgroup incremental impact for Individual Skills Enhancement participants using EAS as comparison group
- Table 17e: Youth between 25 to 30 (n=380) subgroup incremental impact for Individual Skills Enhancement participants using EAS as comparison group
- Table 17f: Secondary incomplete (n=766) subgroup incremental impact for Individual Skills Enhancement participants using EAS as comparison group
- Table 17g: Secondary complete (n=398) subgroup incremental impact for Individual Skills Enhancement participants using EAS as comparison group
- Table 17h: Indigenous (n=614) subgroup incremental impact for Individual Skills Enhancement participants using EAS as comparison group
List of figures
- Figure 1: Trends in average earnings over the 1-year pre-program, in-program, and 5–year post-program period for Skills Links interventions
- Figure 2: Robustness Check - Incremental Impact by Skills Link Intervention Type using GBES as comparison group
- Figure 3: Main characteristics of GBES participants by clusters
Executive summary
This report presents the results of the fourth summative evaluation of the Skills Link stream of the Youth Employment Strategy (YES) program. It includes the socio-economic profiles of participants, medium-term labour market outcomes, and incremental impacts. YES is a horizontal initiative led by ESDC and delivered in collaboration with 10 federal departments and agencies. Skills Link targeted youth who were facing barriers to employment, providing them with opportunities to gain employment experience and acquire knowledge and skills. Under Skills Link, local and regional organizations from various sectors received funding. In 2017 to 2018, about 19,000 + youth participated in Skills Link; and ESDC provided $170M to organizations in funding.
The YES consists of 3 program streams. These involved youth aged 15 to 30, but each having distinct objectives and targeting specific segments of youth.
- Career Focus (CF) aims to provide youth, who were completing or had completed their post-secondary education, with Career-related work experiences
- Skills Link (SL) intends to help youth who had barriers to employment, and
- Summer Work Experience (SWE) focuses on creating work opportunities for students
In accordance with the Financial Administration Act and the Treasury Board’s Policy on Results, the summative evaluation of the YES was completed and approved in spring 2020. Note that the analyses of these 3 streams are split into 3 separate reports. The current technical report focuses only on youth who participated in ESDC-funded initiative under the Skills Link stream of the YES.
The previous YES evaluation conducted by ESDC in 2015 indicated that overall, the ESDC Skills Link initiative had negative impacts on average income. The evaluation also showed weak evidence of positive impacts on incidence of employment. Although informative, these findings could only be derived for the initiative overall, with no possible distinction between the specific types of interventions received by the participants. The current Summative Evaluation of YES addressed this gap by capitalizing on the more recent availability of information on the different Skills Link interventions.
This study includes participants who started a Skills Link intervention during the period of January 2010 to December 2011. It addresses the following evaluation questions:
- did Skills Link reach its target population (eligible participants)? What are the profiles (socioeconomic characteristics) of Skills Link participants?
- to what extent does Skills Link participants improve their labour market participation (par example, employed, unemployed, self-employed, or returned to school)?
- what impacts do Skills Link interventions have on supporting participants to obtain employment, increase their income, and decrease reliance on Employment Insurance (EI) or Social Assistance (SA)? Do impacts vary by region, target group, program, and duration, or type of intervention?
Methodology
For the Skills Link stream, we used the period of January 1, 2010 to December 31, 2011 to define the participant cohorts for the analysis of profiles (that is, socio-economic characteristics), labour market outcomes, and incremental impacts. The incremental impacts were analyzed for the overall population and for each intervention separately, relative to a subset of individuals aged 15 to 30. These individuals had the same observed socioeconomic characteristics as the Skills Link participants but had received only a limited level of treatment through minor Employment Assistance Services (EAS) interventions as part of the Labour Market Development Agreements (LMDA), during the same reference period.
We assessed the net impacts of Skills Link over a 6-year span. For the following 5 labour market indicators, we examined post-program results in terms of average and cumulative 5-year impacts:
- total reported earnings (T4 earnings)
- incidence of employment (proportion employed)
- annual amount of EI benefits collected
- annual amount of Social Assistance benefits used
- dependence on government income support (EI and SA as proportion of total income)
Key findings for Skills Link
The key results of this study are as follows:
- about 29,000 youth participated in Skills Link interventions funded by ESDC between January 1, 2010, and December 31, 2011
- Group-Based Employability Skills and Employability Skills through Work Experience represented the majority, respectively, 56% and 30% of all Skills Link interventions provided
- in terms of age, 44% of participants were between 20 to 24
- the analysis showed that 59% of participants were male. This same trend applies to all types of Skills Link interventions except for Employability Skills through Work Experience, which attracted almost equal proportions of males (51%), and females (49%)
- 52% of participants had not completed their secondary education
- the incremental impact of Skills Link interventions on labour market outcomes shows that active labour market programmes may increase earnings and employment. However, there is substantial variability in the effects according to program type and design. These results are consistent with findings in the international literature (Kluve, 2014)
- youth who participated in Employability Skills Work Experience and Work Experience increased their incidence of employment respectively by 2.3 and 5.9 % more than their comparison groups
- except for Work Experience, none of the Skills Link interventions showed evidence of an improvement in participants’ earnings. Youth who participated in Employability Skills through Work Experience, Group Based Employability Skills, and Employability Skills Entrepreneurship showed, respectively, average yearly decreases in their earnings of $677, $1323, and $3032 relative to the comparison group over the post-program 5-year period
- Work Experience participants increased their average yearly incomes. But, these impacts were neither statistically nor economically significant, at an average of only $103 per year over 5 years
- participation in any Skills Link interventions either lowered reliance on social assistance, or did not change social assistance use. In the case of Group-Based Employability Skills, reliance on social assistance increased over the 5-year post-participation period
We validated the results using alternative estimation techniques and a rigorous sensitivity analysis. The alternative estimation techniques included Inverse Probability Weighting and Nearest Neighbour methods in addition to traditional Kernel Matching. This triangulation exercise confirmed that the results were not sensitive to the choice of estimator. We conducted an additional sensitivity analysis using Group-Based Employability Skills (GBES) participants as an alternative comparison group for the other Skills Link intervention types. The findings conclusively suggest that the Skills Link participants have better outcomes from interventions such as Work Experience, Employability Skills Work Experience, and Individual Skills Enhancement compared to GBES. The advantage of using GBES as an alternative comparison group to conduct a sensitivity analysis is that GBES is one type of the intervention under Skills Link stream. Participants are more likely to be similar to those in the other Skills Link interventions in terms of unobservable barriers to gaining and sustaining employment.
1. Introduction
The ESDC-led, horizontal Youth Employment StrategyFootnote 1 represents the government’s commitment to helping to equip youth – especially those facing barriers to employment – with the skills, work experience and abilities they need to successfully transition into the labour market. In accordance with Financial Administration Act and the Treasury Board’s Policy on Results, this evaluation will assess whether and to what extent the program is meeting these objectives.
The current technical evaluation report presents the results of the fourth summative evaluation of the YES. This report examines the socio-economic profiles of participants, medium-term labour market outcomes, and incremental impactsFootnote 2. The analyses and results presented in this report focus on the Skills Link streams of YESFootnote 3.
The report is structured as follows:
- section 1 describes the core components of Skills Link and recent modernization efforts
- section 2 provides a literature review summarizing past evaluations of YES, and discusses available international evidence on the effectiveness of youth employment programs
- section 3 describes the data sources and main statistical techniques used for the analysis, and the associated strengths and limitations of the methodology
- section 4 presents the results of the analysis on the participant profiles and outcomes
- section 5 presents results for the incremental impacts
1.1 YES program overview
The Youth Employment Strategy is a horizontal initiative led by ESDC and delivered in collaboration with 10 other federal departments and agencies. The YES received approximately $520M in 2017 to 2018. In order to be eligible to participate in YES, youth must meet all of the following criteria:
- be between 15 and 30 years of age
- be a Canadian citizen, permanent resident, or person who has been granted refugee status in Canada
- be legally able to work in Canada, and
- not be currently receiving Employment Insurance (EI) benefits
The Skills Link (SL) initiative of YES provides funding for employers and organizations. This funding is used to help youth facing barriers to employment develop the broad range of skills and knowledge needed to participate in the labour market. These barriers include but are not limited to challenges faced by: recent immigrant youth, youth with disabilities, single parent youth, youth who have not completed high school, Indigenous youth, and youth living in rural or remote areas. Whereas the Career Focus and Summer Work Experience streams consist of single types of interventions, Skills Link is comprised of the following 5 interventions that target the needs of specific clients:Footnote 4
- Group-Based Employability Skills (GBES) offers pre-employment activities for youth who need some additional development before advancing to an actual work experience. The maximum duration for this intervention is 24 weeks. It must always be combined with at least one intervention providing a paid work experience (that is, Employability Skills through Work Experience, Employability Skills through Entrepreneurship or Work Experience)
- Employability Skills through Work Experience (ESWE) combines employability skills and activities focused on exposing participants to the labour market. Workshops that help build participants’ employability skills are blended with periods where participants work directly with employers. Interventions are typically 52 weeks in length (and thus may be a participant’s sole intervention), but may be longer or shorter, depending on participants’ needs
- Employability Skills through Entrepreneurship (ESEN) aims to equip youth with the entrepreneurial skills required to establish an enterprise and become capable business persons. The maximum duration for this intervention is 52 weeks in length (and thus may be a participant’s sole intervention). Interventions of shorter duration are permitted, as long as participants’ needs are met (determined based on the caseworker’s judgment of progress)
- Work Experience (WE) provides youth with opportunities to develop and enhance their employability and occupational skills through practical, on-the-job experience. The typical intervention duration is 52 weeks (and thus may be a participant’s sole intervention), but may be longer or shorter depending on the needs of the participant
- Individual Skills Enhancement (ISE) provides youth with funding that enables them to participate in short-term university, college, or technical courses that fill specific, identified gaps in their educational and skills development. The funding also takes into consideration labour market needs. The maximum contribution per participant is $10,000 per 12-week course, which is comprised of: (1) a maximum allotment of $5,000 for course-related costs including tuition, books, and mandatory student fees; and (2) a maximum allotment of $5,000 where there is evidence of the need for income support, transportation, travel and/or dependent care
1.2 Modernization of the Youth Employment Strategy program
ESDC has re-designed the YES program to address multiple labour market challenges faced by youth, particularly those facing barriers to employment. The new initiative, which began in June 2019, is called the Youth Employment and Skills Strategy (YESS) program. The YESS continues to be led by ESDC and delivered in conjunction with 10 departments and agencies across the Government of Canada. YESS aims to provide more flexible employment services tailored to each individual and enhanced supports for all young Canadians. It also aims to broaden eligibility and offer a wider range of programs to help young people gain the skills, abilities, and experience they need to obtain good-quality jobs.
2. Previous research and evaluation studies
How successful have active labour market programs (ALMPs) for youth, both in Canada and elsewhere, been in addressing such challenges? In their recent meta-analysis of the impact of youth employment interventions on labour market outcomes, (Kluve et al. 2017), showed that the effectiveness of ALMPs for youth is highly contextual. The impact on earnings and employment vary substantially by country, income levels, the design and implementation of interventions, and the profiles of program participants. For example, being unemployed or unskilled in a high-income country, where labour demand is skill-intensive, puts unskilled youth at a distinct disadvantage relative to cohorts that are well-educated. Although ALMPs in high-income countries can help integrate disadvantaged young people into the labour market, they are not able to fully compensate for a lack of skills or fully address skill gaps. In high-income countries, skills training appears to be slightly more effective compared to other intervention types.
In an earlier paper, (Kluve 2014) synthesized evaluations assessing the impact of youth program in OECD countries. The evidence from this analysis shows that active labor market programs for disadvantaged youth are significantly less likely to produce positive impacts (compared to the situation without the program). In addition, successful youth intervention programs require a comprehensive approach, including multiple targeted components, such as job-search assistance, counseling, training, and placement services (Kluve 2014).
In Canada, there have been 2 previous summative evaluations of the youth employment strategy, which focused on the 2003 to 2006 and 2008 to 2009 program cohorts. The overarching findings from these studies were that YES achieved its objectives, with the exception of the Skills Link stream. Specifically, Skills Link participants experienced a decrease in their average earnings (versus their comparison group) in the post-program period. However, the main limitation of the previous evaluations was that no net impact analyses were conducted for the different types of Skills Link interventions. There was insufficient data available to distinguish between the interventions. Therefore, the impact of Skills Link could only be analyzed at the global level. This made it impossible to discern which interventions were impactful. The current Summative Evaluation of YES addressed this gap by capitalizing on the more recent availability of finer-grained information on the different Skills Link interventions.
In the last section of this report, the net impact findings for the Skills Link streams will be further contextualized and interpreted in light of international and Canadian literature on the effectiveness of youth-focused ALMPs.
3. Methodology
3.1 Scope
One of the key objectives of this study is to measure the incremental impacts resulting from participation in Skills Link. The program effect is determined through a “counterfactual” approach – the participants’ labour market outcomes are compared to what would have happened had they not received YES interventions. This study also includes a statistical analysis of participants’ socioeconomic profiles and outcome trends for both streams of YES.
This study focuses on participants in ESDC-funded Skills Link interventions, who received an intervention between January 2010 and December 2011. This reference period allows for program impacts on labour market outcomes to be measured over a period of at least 5 years following the completion of the intervention (up to calendar year 2016, which is the most recent year for which tax information is available).
The following evaluation questions were examined as part of this study:
- did Skills Link reach its target population (eligible participants)? What are the profiles (socioeconomic characteristics) of Skills Link?
- to what extent did Skills Link participants improve their labour market outcomes? Following participation, have they become employed, unemployed, self-employed, or returned to school?
- what impacts do Skills Link interventions have on supporting participants to obtain employment, decrease reliance on EI or SA, and improve income? Do these impacts vary by region, target group, duration in program or type of intervention?
We addressed questions 1 and 2 by examining descriptive statistics on the socio-demographic characteristics and labour market outcomes of the participants. We addressed question 3 by conducting an incremental impact analysis on employment earnings, incidence of employment, use of social assistance, use of EI benefits, and dependence on income support.
3.2 Data and unit of analysis
We used the integrated Labour Market Program Data Platform (LMPDP) as our primary data source. It contains program administrative data collected at the intervention and project level through the Common System for Grants and Contributions, linked to the EI benefits databank and Canada Revenue Agency (CRA) taxation files.
The Platform includes a large number of variables that are closely linked to individuals’ labour market experiences, such as socio-demographic characteristics of participants and comparison cases (for example. age, gender, education, marital status, disability), as well as their province of residence, background qualifications (par example, occupational group, industry codes), and labour market history (par example, use of EI benefits, employment/self-employment earnings, use of social assistance, and incidence of employment in the 5-year pre-participation period). The current evaluation of YES is the first to be able to assess impacts for the different types of Skills Link interventions. It does this by capitalizing on the availability of more granular program data for participants.
Throughout this report, the unit of analysis was the individual, with respect to their specific YES intervention. This approach was largely consistent with the program data, as the vast majority of clients (90%) received only one intervention. Relatively few clients engaged in multiple interventions. In these cases, the intervention with the longest duration was considered the most representative of program participation.
3.3 Outcome indicators
Outcome trends and incremental impacts were measured for the following individual-level labour market indicators:
- employment earnings: the total annual earnings from paid employment and, or self-employment, captured in Canada Revenue Agency (T4) data
- incidence of employment: the incidence of non-zero annual earnings from employment and/or self-employment, based on T4 data. This variable takes on the value “1” if the individual is employed within a calendar year (that is, non-zero earnings are recorded in either the pre- or post-participation period), and “0” otherwise
- social Assistance benefits used: measures the average amount of Social Assistance received, which is captured in CRA data
- amount of EI benefits received: measures the average amount of EI benefits received, which is captured in EI Part I data
- dependence on income support: defined as the ratio:
- (EI benefits + Social Assistance benefits)
- (EI benefits + Social Assistance benefits + total earnings)
3.4 Methods for estimating incremental impacts
We used propensity-score based weighting approach to measure the program impacts. This approach aims to ensure that the participants and comparison group are balanced in terms of background factors (that is, socio-demographic and labour market history variables) prior to estimating the program impacts. We applied the kernel matching technique, which uses the entire control group and re-weights control group members each time they are compared with a new participant, based on propensity-score differentials. We used Inverse Probability Weighting (IPW) and Nearest Neighbour matching as alternative methods to validate the results. Note that these methods were combined with Difference- in–Differences (DID) estimation of program impacts. The DID method allows for the treatment and comparison groups to differ on time-invariant unobserved characteristics, by assuming common time trends in the pre- and post-participation period in these characteristics. Additionally, in order to assess the sensitivity of the estimated impacts to selection bias, a “limited treatment” comparison group, consisting of participants who received minimal assistance via GBES, was used as an alternative counterfactual for participants who received the more intensive Skills Link interventions (that is, ESWE, WE, ESEN, and ISE).
We provided details on estimation methods as well as the various validation tests in Annex B.
3.5 Machine learning to select a subset of EAS participants as comparison group
The comparison pool members for Skills Link participants consisted of individuals who shared the same eligibility criteria as YES participants. However, they had received minor interventions via Employment Assistance Services (EAS) as part of the Labour Market Development Agreements (LMDA). EAS clients may have received a wide range of one-on-one interventions to support their return to work. These include computer training, career advice and employment counselling, job preparation and job search supports, job finding clubs, and short-term training such as first aid certification or food safety.
In order to identify among EAS clients, individuals with similar socio-demographics and labour market characteristics for each Skills Link intervention types, machine learning K-Nearest Neighbor (KNN) discriminative analysis was used. K-Nearest Neighbor is a supervised machine learning method that is used to classify individuals with similar characteristics into different groups. The variable used to compute the K-Nearest Neighbor algorithms are based entirely on the propensity score model. The final set of comparison group pool members selected for each intervention is shown in Table 10 in Annex B.
3.6 Strengths and limitations
The strength of this study is its reliance on the rich administrative data in the Labour Market Program Development Platform, which allows for numerous socioeconomic and labour characteristics to be accounted for during the analysis. We used a combination of machine learning and econometric techniques to build an appropriate comparison group. The group is closely matched to YES participants for each of the intervention types. In addition, we used rigorous statistical tests and 2 incremental impact estimation methods to validate the results and help ensure robustness. Moreover, this is the first evaluation of YES that supports drawing inference about the impacts of the ESDC Skills Link initiative at the intervention-specific level.
A limitation of this study is that it only covers ESDC’s Youth Employment Strategy participants. It does not cover those supported by the other departments involved in delivering the Strategy. Therefore, the results should not be generalized to the entire population of Skills Link participants. Second, it must be acknowledged that the collected participant data may not fully capture other information related to the sequence of Skills Link interventions (for example, a GBES intervention followed by a WE intervention). Therefore, some of the estimated impacts on outcomes for a particular intervention could have potentially captured the effects of subsequent interventions not captured in the data. The inability to see the full sequence of interventions taken by participants could complicate the interpretation of intervention effects.
An additional limitation is that the universal eligibility of the YES creates challenges for comparison group selection. This is because there is no baseline or untreated population available in the ESDC data from which to draw comparison group members. For example, in the case of the LMDAs, some EI claimants participate in interventions. The claimants who do not naturally form a baseline to create a comparison group.
Finally, although the EAS and SL cases were matched on a wide variety of socio-demographic and labour market history variables, there is the possibility that unobserved variables may have affected the impact results. Using labour market indicators in assessing program effectiveness falls short of measuring unobservable characteristics that youth with barriers might encounter (low confidence, criminal record, mental health issues, drug and alcohol abuse, etc.). These unobserved confounders might affect participation and outcomes, and may not be as prevalent in the EAS comparison group, resulting in imbalances. DID estimation allows for between-group differences in unobservable factors, but these must be stable over time. Of the factors listed above, criminal history is the only one that does not change with time. However, the personal and environmental influences underlying criminal behaviour are time-varying or dynamic, so these would potentially pose a problem for DID estimation. Therefore, the heavier burden of possibly dynamic barriers to labour market integration within the SL relative to EAS group may have resulted in some underestimation of the estimated impacts.
4. Participant’s profile and outcome trends
4.1 Skills Link participants’ profile
The socio-demographic profiles of participants in the Skills Link interventions are presented in Table 1 below.
Skills Link participants were more likely to be male (59%) than female (41%). We observed this trend for all types of Skills Link interventions. Moreover, 53% of all Skills Link participants did not have a high school diploma. This is in line with the program’s objective of reaching youth who face barriers to employment. The Skills Link program was able to reach more vulnerable subpopulations, such as persons with disabilities (11%), Indigenous youth (20%), visible minorities (19%), and recent immigrants (6%). The highest participation rate is among youth aged 20 to 24 (44%), followed by the 15 to19 age group. Immediate results based on Action Plan outcomes showed that overall, 42% of the participants were employed following program completion, 15% returned to school, and 25% remained unemployed.
| Gender | GBES (N=16,181) |
ESWE (N=8,832) |
WE (N=2,245) |
ESEN (N=310) |
ISE N=1,425) |
SL-Overall (N=28,993) |
|---|---|---|---|---|---|---|
| Male | 58% | 59% | 59% | 58% | 66% | 59% |
| Female | 42% | 41% | 40% | 40% | 33% | 41% |
| Age | GBES (N=16,181) |
ESWE (N=8,832) |
WE (N=2,245) |
ESEN (N=310) |
ISE (N=1,425) |
SL-Overall (N=28,993) |
|---|---|---|---|---|---|---|
| Under 20 | 37% | 33% | 27% | 15% | 26% | 34% |
| 20-24 | 42% | 46% | 45% | 50% | 47% | 44% |
| 25 and over | 21% | 22% | 28% | 34% | 27% | 22% |
| Education Level | GBES (N=16,181) |
ESWE (N=8,832) |
WE (N=2,245) |
ESEN (N=310) |
ISE N=1,425) |
SL-Overall (N=28,993) |
|---|---|---|---|---|---|---|
| Secondary incomplete | 55% | 51% | 42% | 38% | 55% | 53% |
| Secondary complete | 24% | 27% | 26% | 33% | 29% | 26% |
| Post-Secondary incomplete | 6% | 6% | 7% | 13% | 4% | 6% |
| Post-Secondary complete | 11% | 12% | 20% | 14% | 6% | 12% |
| Missing/unknown | 4% | 4% | 5% | 3% | 7% | 4% |
| Characteristic | GBES (N=16,181) |
ESWE (N=8,832) |
WE (N=2,245) |
ESEN (N=310) |
ISE N=1,425) |
SL-Overall (N=28,993) |
|---|---|---|---|---|---|---|
| Married/common Law | 9% | 10% | 13% | 6% | 10% | 9% |
| Separated / divorced | 1% | 2% | 1% | 2% | 2% | 1% |
| Single | 72% | 75% | 75% | 76% | 70% | 73% |
| Person with disability | 9% | 13% | 14% | 5% | 10% | 11% |
| Indigenous status | 17% | 19% | 27% | 11% | 44% | 20% |
| Visible minority | 21% | 16% | 17% | 37% | 7% | 19% |
| Immigration status | 6% | 6% | 9% | 4% | 1% | 6% |
| Province/Territory | GBES (N=16,181) |
ESWE (N=8,832) |
WE (N=2,245) |
ESEN (N=310) |
ISE N=1,425) |
SL-Overall (N=28,993) |
|---|---|---|---|---|---|---|
| Newfoundland and Labrador | 2% | 2% | 4% | 0% | 0% | 2% |
| Prince Edward Island | 2% | 1% | 0% | 0% | 0% | 1% |
| Nova Scotia | 1% | 5% | 1% | 0% | 1% | 3% |
| New Brunswick | 3% | 3% | 2% | 0% | 0% | 3% |
| Quebec | 25% | 14% | 14% | 0% | 1% | 20% |
| Ontario | 37% | 41% | 30% | 96% | 53% | 39% |
| Manitoba | 6% | 4% | 10% | 0% | 6% | 6% |
| Saskatchewan | 5% | 3% | 10% | 1% | 1% | 5% |
| Alberta | 11% | 11% | 13% | 2% | 20% | 11% |
| British Columbia | 8% | 15% | 14% | 1% | 17% | 11% |
| The North | 0% | 0% | 1% | 0% | 0% | 0% |
| Outcome | GBES (N=16,181) |
ESWE (N=8,832) |
WE (N=2,245) |
ESEN (N=310) |
ISE N=1,425) |
SL-Overall (N=28,993) |
|---|---|---|---|---|---|---|
| Employed | 39% | 48% | 53% | 68% | 22% | 42% |
| Unemployed | 26% | 23% | 24% | 15% | 34% | 25% |
| Return to school | 18% | 13% | 8% | 4% | 6% | 15% |
| Result unknown | 14% | 12% | 11% | 6% | 35% | 14% |
| Characteristic | GBES (N=16,181) |
ESWE (N=8,832) |
WE (N=2,245) |
ESEN (N=310) |
ISE N=1,425) |
SL-Overall (N=28,993) |
|---|---|---|---|---|---|---|
| No earnings (1-yr prior) | 47% | 45% | 43% | 38% | 44% | 46% |
| Had earnings (1-yr prior) | 53% | 55% | 57% | 62% | 56% | 54% |
| No earnings (2-yrs prior) | 48% | 46% | 44% | 35% | 45% | 47% |
| Had earnings (2-yrs prior) | 52% | 54% | 56% | 65% | 55% | 53% |
| Received EI 1-year Prior | 3% | 3% | 3% | 4% | 3% | 3% |
| Received EI 2-year prior | 3% | 3% | 3% | 3% | 3% | 3% |
| Received SA 1-year prior | 24% | 26% | 22% | 28% | 24% | 25% |
| Received SA 2-year prior | 18% | 19% | 16% | 20% | 19% | 18% |
4.2 Heterogeneous group in Skills Link – GBES intervention: Machine learning clustering analysis
Given that the GBES participants represented more than half of the Skills Link population, we performed a data mining exercise to uncover potential heterogeneous groups present within this population. We replicated this analysis for the ESWE and WE interventions; however, we did not observe definitively distinct groups for these intervention types.
We identified 5 distinct groups (clusters) – see Figure 3 in Annex B – among GBES participants using a combination of principal components and unsupervised machine learning k-means analysis. The first group (cluster 1) profile was very similar to the entire GBES population. The second group (cluster 2) was the most labour market-attached of the 5, and much older on average vs. the overall GBES population. The GBES participants in cluster 3 were heavily reliant on social assistance and were more likely to be female. Those in the cluster 4 were immigrants with higher levels of education, and participants in cluster 5 were the youngest, with the lowest level of education.
We also performed a detailed analysis on the labour market indicators by cluster. The results are presented in Annex C.
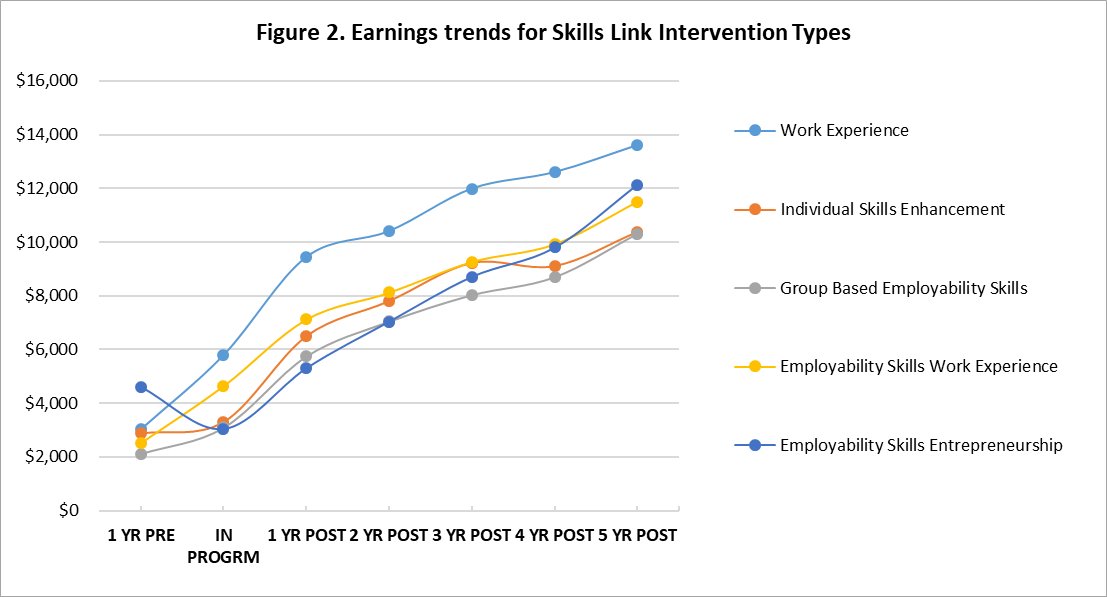
4.3 Skills Link intervention outcome trends
Figure 1 below shows the average trends in earnings for all Skills Link intervention types from 1-year pre-program throughout the 5-year post-program period. Overall, average earnings increased steadily following the program start year, for each of the Skills Link interventions. Among the Skills Link intervention types, Work Experience participants showed the largest post-participation average increase in earnings. Although these trends indicate that participants’ earnings are improving, these increases can result from many factors (for example, maturity of participants) in addition to program participation. The net impact analysis will attempt to isolate how much of the increase was due to participation in the Skills Link program. This is done by taking into account numerous sociodemographic and labour market history variables.
Figure 1: Trends in average earnings over the 1-year pre-program, in-program, and 5–year post-program period for Skills Links interventions.
Text description of figure 1
| Period | Work Experience | Individual Skills Enhancement | Group-Based Employability Skills | Employability Skills Work Experience | Employability Skills Entrepreneurship |
|---|---|---|---|---|---|
| 1 year pre | $3,046 | $2,876 | $2,125 | $2,533 | $4,598 |
| In program | $5,807 | $3,304 | $3,100 | $4,651 | $3,037 |
| 1 year post | $9,449 | $6,496 | $5,748 | $7,126 | $5,303 |
| 2 year post | $10,412 | $7,799 | $7,042 | $8,122 | $7,037 |
| 3 year post | $11,988 | $9,218 | $8,027 | $9,267 | $8,707 |
| 4 year post | $12,602 | $9,104 | $8,695 | $9,925 | $9,795 |
| 5 year post | $13,602 | $10,367 | $10,301 | $11,499 | $12,133 |
5. Incremental impact
5.1 Skills Link: Overall incremental impact results
The incremental impact analysis for the ESDC Skills Link initiative shows that participants experienced a decrease in both employment earnings and incidence of employment in the post program period, relative to the EAS comparison group (see Table 2 below). In addition, the results suggest a slight increase in reliance on SA and a negligible impact on the receipt of EI Benefits. Moreover, Skills Link participants were more likely than the comparison group to depend on government-provided income support after the program start year.
| Indicators | Program start year (0) |
1 year post-program (1) |
2 year post-program (2) |
3 year post-program (3) |
4 year post-program (4) |
5 year post-program (5) |
Annual average post-program (1-5) |
Cumulative in & post-program (0-5) |
|---|---|---|---|---|---|---|---|---|
| Total reported earnings ($) | -125 | -600*** | -873*** | -983*** | -1005** | -1090*** | -910*** | -4548*** |
| Incidence of employment (pp) | 7.3*** | 3.8*** | -0.6 | -1.4** | -1.1* | -1.6** | -0.2 | N/A |
| EI benefits ($) | -118*** | -6 | 10 | -26 | -26 | -20 | -14 | -67 |
| SA benefits ($) | -196*** | -106*** | 28 | 50 | 123*** | 55 | 30 | 153 |
| Dependence on income support (pp) | -3.8*** | -0.7 | 1.3*** | 1.2*** | 1.7*** | 1.2*** | 1.0*** | N/A |
- Significance level ***1% **5% *10%.
- Total Reported Earnings: Reported on T4 Earnings.
- pp : percentage point.
- The cumulative post-program impact and the 5-year annual average post-program impact may not be a simple sum/average of the yearly post-program impact. This is due to the fact that there are individuals with missing values on certain indicators for certain years, and the kernel matching algorithm ignored them when computing the net impact. Researchers have suggested that when computing the impact on multiple outcomes with some missing values, kernel matching should be performed separately for each of the outcomes.
The following sections present the incremental impact analyses for the specific types of Skills Link interventions. Subgroup analyses are also performed at the intervention level (but not for the overall Skills Link stream). Only the main subgroup findings are presented for each Skills Link intervention type. The full set of results for each outcome is available in Annex B.
5.2 Group-Based Employability Skills
Consistent with the previous results for the full ESDC Skills Link cohort, the incremental impact analysis of the GBES intervention points to negative effects. Participants experienced a loss in average employment income, total reported earnings and a lower incidence of employment, and a slight increase in SA use (see Table 3 below). Although participants reduced their reliance on EI benefits, the unfavourable impacts on income and SA use resulted in a slightly higher dependency on income support among GBES participants, relative to the comparison group.
| Indicators | Program start year (0) |
1 year post-program (1) |
2 year post-program (2) |
3 year post-program (3) |
4 year post-program (4) |
5 year post-program (5) |
Annual average post-program (1-5) |
Cumulative in & post-program (0-5) |
|---|---|---|---|---|---|---|---|---|
| Total reported Earnings ($) | -633*** | -966*** | -1132*** | -1408*** | -1410*** | -1514*** | -1314*** | -7200*** |
| Incidence of employment (pp) | 2.6*** | 2.5*** | -1.1 | -2.0*** | -1.1 | -1.9** | -1.3* | N/A |
| EI benefits ($) | -110*** | -109*** | -53* | -63* | -79** | -98** | -80*** | -509*** |
| SA benefits ($) | -186*** | -70 | 101** | 138*** | 155*** | 105** | 87** | 251 |
| Dependence on income support (pp) | -2.7*** | -0.6 | 1.7*** | 1.8*** | 1.9*** | 1.2** | 1.2** | N/A |
- Significance level ***1% **5% *10%.
- Total Reported Earnings: Reported on T4 Earnings.
- pp : percentage point.
- The cumulative post-program impact and the 5-year annual average post-program impact may not be a simple sum/average of the yearly post-program impact. This is due to the fact that there are individuals with missing values on certain indicators for certain years, and the kernel matching algorithm ignored them when computing the net impact. Researchers have suggested that when computing the impact on multiple outcomes with some missing values, kernel matching should be performed separately for each of the outcomes.
Group-Based Employability Skills subgroup main findings
The main findings presented for the subgroups for all interventions are based on the average impact observed over the 5-year period following an intervention. For GBES, participants generally had inferior labour market outcomes than their comparison group. The exception being youth between 25 to 30, who exhibited a 3.22 % increase in incidence of employment.
- Among males, there was a net decrease of $869 in earnings, and an increase of 2 % in dependence on government-provided income support
- For females, there was a net decrease of $2,240 in earnings, and a net increase of 1 % in dependence on government-provided income support
- Among youth under 19 years of age, there was a net decrease of $1,420 in earnings
- Regarding net impacts according to educational attainment, the participants with incomplete secondary, incomplete post-secondary, and completed post-secondary education experienced net decreases of $600, $2,360, and $2,590, respectively
- Further, those who graduated from high school were less likely than the comparison group to be dependent on government-provided income support. Whereas participants who did not complete post-secondary education were more likely to be dependent on it
- Indigenous participants had a negligible increase in the incidence of employment earnings, and a negligible decrease in the earnings
5.3 Employability Skills Work Experience
The incremental impact analysis for ESWE shows unfavourable 5-year post-participation results for average employment income and total reported earnings relative to the comparison group. But, there was an increase in the incidence of employment concentrated in the first 2 years post-program. Further, there were slight increases in EI benefits, SA use and Dependence on Income Support.
| Indicators | Program start year (0) |
1 year post-program (1) |
2 year post-program (2) |
3 year post-program (3) |
4 year post-program (4) |
5 year post-program (5) |
Annual average post-program (1-5) |
Cumulative in & post-program (0-5) |
|---|---|---|---|---|---|---|---|---|
| Total reported Earnings ($) | 599*** | -267* | -783*** | -732*** | -715*** | -831*** | -666*** | -2726*** |
| Incidence of employment (pp) | 16.1*** | 7.9*** | 1.4* | 0.2 | -0.3 | -0.1 | 2.3*** | N/A |
| EI benefits ($) | -112*** | 108*** | 51* | -2 | -19 | 41 | 36* | 71 |
| SA benefits ($) | -190*** | -150*** | 32 | 51 | 179*** | 70 | 37 | 5 |
| Dependence on income support (pp) | -5.4*** | -0.7 | 1.7*** | 1.5** | 1.8*** | 1.6*** | 1.2*** | N/A |
- Significance level ***1% **5% *10%.
- Total Reported Earnings: Reported on T4 Earnings.
- pp : percentage point.
- The cumulative post-program impact and the 5-year annual average post-program impact may not be a simple sum/average of the yearly post-program impact. This is due to the fact that there are individuals with missing values on certain indicators for certain years, and the kernel matching algorithm ignored them when computing the net impact. Researchers have suggested that when computing the impact on multiple outcomes with some missing values, kernel matching should be performed separately for each of the outcomes.
Employability Skills Work Experience subgroup main findings
All subgroups of ESWE participants were more dependent on government income support, except for those who had completed secondary school. All groups experienced a decrease in employment earnings over the program period.
- There was net increase of 2.5% and 1.8% in the incidence of employment respectively for males and females. Males and females had, on average, a net decrease in earnings of $985 and $562, respectively
- Among youth under 19, there was a net decrease of 2.4% in the incidence of employment. Youth between 20 to 24 had an increase of 1.3% (not significant) in the incidence of employment. Youth aged between 25 to 30 years experienced a significant increase of 4.2% in employment
- Regarding net impacts according to educational attainment, participants who did not complete secondary school had an increase of 1.9% in the incidence of employment
- Participants who completed secondary education were less dependent on government-provided income support (decrease of 1.8%). Participants who completed post-secondary education experienced an increase of 2.4 % in dependence on government-provided income support
- Indigenous participants had an increase (2.4%) in the incidence of employment and a modest decrease in the earnings ($224). However, the results were not statistically significant
5.4 Work Experience
Overall, participation in the WE intervention resulted in favourable impacts on the majority of the indicators as seen in Table 5. There was a statistically significant increase in average incidence of employment (5.9%), but a tendency towards increased use of EI benefits. In addition, participants were less reliant on SA and government-provided income support compared to the non-participants. Relative to the comparison group, there were increases of $103 in participants’ 5-year average total employment income (result is not statistically significant).
| Indicators | Program start year (0) |
1 year post-program (1) |
2 year post-program (2) |
3 year post-program (3) |
4 year post-program (4) |
5 year post-program (5) |
Annual average post-program (1-5) |
Cumulative in & post-program (0-5) |
|---|---|---|---|---|---|---|---|---|
| Total reported Earnings ($) | 856*** | 135 | -118 | 166 | 54 | -93 | 103 | 1395 |
| Incidence of employment (pp) | 17.2*** | 8.9*** | 4.2*** | 4.7*** | 4.7*** | 3.5** | 5.9*** | N/A |
| EI benefits ($) | -76* | 373*** | 164** | 22 | 122 | 21 | 141*** | 635*** |
| SA benefits ($) | -227*** | -310*** | -195* | -192* | -57 | -169 | -170* | -1068** |
| Dependence on income support (pp) | -6.2*** | -1.3 | -0.8 | -0.7 | 1.3 | -0.3 | -0.4 | N/A |
- Significance level ***1% **5% *10%.
- Total Reported Earnings: Reported on T4 Earnings.
- pp : percentage point.
- The cumulative post-program impact and the 5-year annual average post-program impact may not be a simple sum/average of the yearly post-program impact. This is due to the fact that there are individuals with missing values on certain indicators for certain years, and the kernel matching algorithm ignored them when computing the net impact. Researchers have suggested that when computing the impact on multiple outcomes with some missing values, kernel matching should be performed separately for each of the outcomes.
Work Experience subgroup main findings
Participants in WE experienced, on average, a modest decrease in earnings and a higher increase in the incidence of employment earnings over the 5-year program period.
- There was a net increase of 4.5% and 3.2% in the incidence of employment earnings respectively for males and females
- Among youth between 20 to 24 years of age, there was a net increase of 3.5% in the incidence of employment earning. For youth between 25 and 30 years of age, there was an increase of 12.0% in incidence of employment earnings
- Regarding the impact of intervention by education level, there was a net (non-significant) increase in earnings of $384 and $470 for individuals who did not complete secondary school and those who completed post-secondary school, respectively
- Participants who completed secondary school had, on average, an increase of $1,900 in earnings. Both participants who did not complete secondary school and those who completed secondary school were less dependent on government-provided income support with a decrease of 3.6% and 4.6%, respectively
- Indigenous participants experienced a net increase of 5.1% in dependence on government-provided income support
5.5 Individual Skills Enhancement
The incremental impact analysis of ISE seen in Table 6 revealed that during the intervention and the 5-year follow-up period, participants underperformed relative to their comparison group in terms of employment income, total reported earnings, and incidence of employment. Similarly, participants relied on more EI and SA benefits, and were more likely to be dependent on government-provided income support than non-participants. However, these differences are neither statistically nor economically significant.
| Indicators | Program start year (0) |
1 year post-program (1) |
2 year post-program (2) |
3 year post-program (3) |
4 year post-program (4) |
5 year post-program (5) |
Annual average post-program (1-5) |
Cumulative in & post-program (0-5) |
|---|---|---|---|---|---|---|---|---|
| Total reported earnings ($) | -641*** | -533* | -1509*** | -1532*** | -1382*** | -1125** | -804** | -4674** |
| Incidence of employment (pp) | -3.1* | -4.5*** | -15.7*** | -13.2*** | -2.8 | -7.2*** | -2.1 | N/A |
| EI benefits ($) | -153*** | 27 | 233*** | 43 | 61 | 18 | 56 | 104 |
| SA benefits ($) | -83 | -30 | -68 | 85 | 70 | 169 | 47 | 161 |
| Dependence on income support (pp) | -2.1* | 0.1 | 0.8 | 0.4 | 0.8 | 1.0 | 0.6 | N/A |
- Significance level ***1% **5% *10%.
- Total Reported Earnings: Reported on T4 Earnings.
- pp : percentage point.
- The cumulative post-program impact and the 5-year annual average post-program impact may not be a simple sum/average of the yearly post-program impact. This is due to the fact that there are individuals with missing values on certain indicators for certain years, and the kernel matching algorithm ignored them when computing the net impact. Researchers have suggested that when computing the impact on multiple outcomes with some missing values, kernel matching should be performed separately for each of the outcomes.
Individual Skills Enhancement subgroup main findings
Participants in ISE interventions experienced a net loss of earnings over the 5-year program period, except for participants who completed secondary school.
- Both males and females had a decrease of 2.5% and 3.4% in the incidence of employment, respectively
- Among youth under 19 and those between 20 to 24 years of age, there was a net decrease of 11.3% and 2.1% in the incidence of employment, respectively. Both groups experienced a net increase of 3.4% and 1.7% in dependence on government-provided income support respectively. The results were not statistically significant for the latter group
- Among participants who did not complete secondary school, there was a significant decrease in earnings and an increase in dependence on government-provided income support
- Among those who did not complete secondary school, there was a net decrease of $1,403 and an increase of 2.5% in dependence on government-provided income support. Participants who completed secondary school had an increase in earnings and were less dependent on government-provided income support. However, the results were not statistically significant
- Indigenous participants experienced a net decrease in both total earnings and in employment earnings
5.6 Employability Skills Entrepreneurship
The incremental impact analysis of ESE (Table 7) showed that during the intervention and the 5-year, follow-up period, participants underperformed their comparison-group counterparts on all labour market indicators. The exception is reliance on EI benefits and dependence on income support. Given the small sample size for this intervention, an analysis of subgroups was not performed.
| Indicators | Program start year (0) |
1 year post-program (1) |
2 year post-program (2) |
3 year post-program (3) |
4 year post-program (4) |
5 year post-program (5) |
Annual average post-program (1-5) |
Cumulative in & post-program (0-5) |
|---|---|---|---|---|---|---|---|---|
| Total reported earnings ($) | -2799*** | -3608*** | -4056*** | -2602** | -2948** | -2177 | -3128*** | -18404*** |
| Incidence of employment (pp) | -5.1 | -3.1 | -13.8*** | -16.0*** | -17.1*** | -14.4*** | -3.4 | N/A |
| EI benefits ($) | -160** | -412*** | -207 | -280*** | -109 | -428** | -311*** | -1805*** |
| SA benefits ($) | 502* | 172 | -147 | -153 | 293 | 337 | 91 | 863 |
| Dependence on income support (pp) | 3.3 | 1.7 | -1.9 | -3.8 | 1.5 | -0.5 | -0.9 | N/A |
- Significance level ***1% **5% *10%.
- Total Reported Earnings: Reported on T4 Earnings.
- pp : percentage point.
- The cumulative post-program impact and the 5-year annual average post-program impact may not be a simple sum/average of the yearly post-program impact. This is due to the fact that there are individuals with missing values on certain indicators for certain years, and the kernel matching algorithm ignored them when computing the net impact. Researchers have suggested that when computing the impact on multiple outcomes with some missing values, kernel matching should be performed separately for each of the outcomes.
6. Conclusion
Unlike previous evaluations, where limited data collection only allowed for an examination of the overall impact of the Skills Link program (that is, the global impact obtained from an analysis where participants from all interventions were pooled together), this evaluation assessed the effectiveness of each of the 5 different intervention types. The improved granularity of data available for the cohort examined here allowed a more refined approach to developing the counterfactual scenarios. This granularity allowed comparison groups to be chosen separately for each Skills Link intervention type using robust machine learning methods. These methods helped to identify better comparison groups whose observed characteristics reflected the target population of each Skills Link intervention.
The main estimation method used to determine the incremental impacts was propensity score kernel matching combined with the difference-in-differences technique. The econometric model was based on rich information about individuals’ labour market experience, including socio-demographic characteristics as well as labour market history. Other personal and environmental factors, such as criminal history, drug use, and lack of social supports can also affect both participation and outcomes. However, these factors are not captured in the available data, and therefore may induce some bias in the results.
Overall, the evidence from the net impact results suggest that the Skills Link interventions did not sufficiently prepare participating youth for long-term success in the labour market. The exception being the Work Experience intervention, for which there was some, albeit small, evidence of positive gains throughout the post-program period. The next best-performing Skills Link intervention was Employability Skills Work Experience, where there was evidence of benefits during the in-program period. Though small negative impacts throughout the post-program period. For the other Skills Link interventions, the results indicated negative earnings impacts; however, the magnitude varies by intervention type. The subgroup analyses (see Annex B) showed that there was some heterogeneity among Skills Link participants by different demographic factors such as age or education level.
The limited earnings impacts are consistent with the previous literature and previous evaluation findings. Being unemployed or unskilled in a high-income country such as Canada where labour demand is skill-intensive, puts youth at a distinct disadvantage. Particularly those facing other personal barriers such as low educational attainment. The results from the net impact analysis do indicate that some interventions helped to integrate disadvantaged youth into the labour market. Evidenced by the positive gains in the incidence of employment. However, the prevalence of negative results suggests that the program is not able to fully compensate for a lack of skills or address gaps in education for these youth. Any gains made during participation tend to dissipate by the fifth year after participation for all intervention types except for Work Experience.
References
- Caliendo, M., and S. Kopeinig (2005): “Some Practical Guidance for the Implementation of Propensity Score Matching,” Discussion Paper No. 1588, IZ
- ESDC (2015), Summative evaluation of the Horizontal Youth Employment Strategy
- Dhakal, S.P., Connell, J., and J. Burgess (2018): “Inclusion and work: addressing the global challenges for youth employment,” Equality, Diversity and Inclusion: An International Journal, 37(2), 110-120. doi: 10.1108/EDI-12-2017-0290
- Heckman, J. J. and J. A. Smith (1999): “The Pre-Program Earnings Dip and the Determinants of Participation in a Social Program: Implications for Simple Program Evaluation Strategies,” Economic Journal, 109(457), 313–348.
- Hing, P.Y.P., Hong, R., and S. CHOI (2020): “Validation of the Employment Hope Scale (EHS) among summer youth employment program participants,” Children and Youth Services Review, 111, 104811.
https://doi.org/10.1016/j.childyouth.2020.104811 - Hoskins, B., Leonard, P., and P.J. Wilde (2018): “Negotiating uncertain economic times: Youth employment strategies in England,” British Educational Research Journal, 44(1), 61–79. doi: 10.1002/berj.3318
- Kluve, J. Youth labor market interventions. IZA World of Labor 2014: 106. doi: 10.15185/izawol.106
- Kluve, J, Puerto, S et al. 2016, Interventions to improve the labour market outcomes of youth: a systematic review of training, entrepreneurship promotion, employment services and subsidized employment interventions, Campbell systematic reviews, ILO, Geneva, viewed 27 Feb 2020,
http://www.ilo.org/employment/Whatwedo/Publications/WCMS_508938/lang--en/index.htm - Lechner, M. (2019) "Modified Causal Forests for Estimating Heterogeneous Causal Effects," Economics Working Paper Series 1901, University of St. Gallen, School of Economics and Political Science
- Lechner, M. and C. Wunsch (2011) “Sensitivity of Matching-Based Program Evaluations of the Availability of Control Variables,” CESifo Working Paper No. 3381
- Refrigi, L. and G. Aleandri (2013): “Educational policies and youth unemployment,” Procedia - Social and Behavioral Sciences, 93, 1263–1268. doi: 10.1016/j.sbspro.2013.10.026
- Wyonch, R. (2020): "Work-Ready Graduates: The Role of Co-op Programs in Labour Market Success," C.D. Howe Institute Commentary, C.D. Howe Institute, Issue 562, January 2020
- Rosenbaum, P. R. and D. B. Rubin (1983): “The Central Role of the Propensity Score in Observational Studies for Causal Effects,” Biometrika, 70(1), 41–50
- Treasury Board Secretariat of Canada (2007). Canadian Cost-Benefit Analysis Guide: Regulatory Proposals. (Catalogue Number: BT58-5/2007).
Retrieved from: https://www.tbs-sct.gc.ca/rtrap-parfa/analys/analys-eng.pdf - Yeung, W.-J. J., and Y. Yang (2020): “Labor Market Uncertainties for Youth and Young Adults: An International Perspective,” The ANNALS of the American Academy of Political and Social Science, 688(1), 7–19
https://doi.org/10.1177/0002716220913487
Annex A – Skills Link mapping strategy
Table 8 describes the rationale of regrouping the original intervention types observed in the data to 5 main types.
| Interventions defined for the Youth Employment Strategy (YES) | Common System Grant and Contribution (CSGC) files: intervention type codes | Core Intervention for Evaluation Purposes | Final Mapped Code and Justification(s) |
|---|---|---|---|
1. The Group-Based Employability Skills intervention is a pre-employment activity for young people who are not yet prepared to enter the world of work, or who need some additional development before advancing to a work experience. Interventions will be up to 24 weeks in length and must involve life and/or employability skills as defined by the Conference Board of Canada (see Appendices I and J). This group-based intervention offers young people the opportunity to participate in workshops to learn or enhance skills transferable to the workplace, such as leadership, teamwork and communication skills, as well as develop personal qualities, including self-esteem and self-reliance. |
Intervention type: 40 Group-Based Employability Skills (GBES) |
1 – GBES | Category 1:
|
2. The development of life and employability skills through community service is often appropriate for young people who face greater barriers to entering the labour market, and who are not yet ready for a work experience with an employer. The intervention provides participants with an opportunity to develop skills and apply them as a member of a team while providing service to others. In serving others, participants are provided not only with a venue for applying new skills but also a means to experience personal development and growth. They contribute to the building of better, stronger communities by addressing issues of local concern and fostering a greater awareness of community needs. This experience enables them to strengthen their sense of accomplishment, self-reliance and self-esteem. |
Intervention type: 41 Employability Skills - Community Service (GBES) |
1 – GBES | Category 1:
|
3. The Employability Skills through Work Experience intervention provides employability skills within an activity focused on the exposure of participants to the world of work. Workshops that help build participants’ employability skills are blended with periods where participants work directly with employers. This intervention can be used for an individual or for a group of young people. Because the focus is on exposure to work, the majority of the participants’ time is dedicated to work experience. |
Intervention type: 42 Employability Skills - Work Experience (ESWE) |
2- ESWE | Category 2:
|
4. Work Experience activities provide youth with opportunities to develop and enhance employability and occupational skills through practical on-the-job experience. Ideally, work experiences are supported by workplace coaching to maximize the benefit to be gained by the participant. The appropriateness of this intervention for a young person depends on the needs that have been identified through the assessment process and the employment action plan that has been developed. As well, there must be a determination that the participant is ready to work with an employer. Work Experience agreements can be for an individual work placement or can involve a group of young people who are at a point in their progress where they would gain from work experience activities. |
Intervention type: 43 Work Experience (WE) |
3 - WE | Category 3:
|
5. Consists of activities that help youth facing barriers to employment obtain skills, ranging from basic to advanced skills, through direct assistance to individuals. Individual Skills Enhancement enables youth to participate in short-term courses (a maximum of 12 weeks) that fill specific, identified gaps in their education and skill development, taking into consideration labour market needs. |
Intervention type: 47 Skills Link - Individual Work Experience (WE) |
3 - WE | Category 3:
|
6. The employability skills-entrepreneurship provides activities designed to enable youth to gain work experience (including entrepreneurial activities) which would include mentorship, coaching and support in advancing an action plan. |
Intervention type: 45 Employability Skills – Entrepreneurship (ESE) |
4 - ESE | Category 4:
|
7. The Individual Skills Enhancement (ISE) intervention enables youth to participate in short term courses that fill specific, identified gaps in their education and skill development. It is to be used when there is no other means of support available to meet the individual’s identified skill needs. Courses supported under ISE will likely be pre-employment in nature, or entry-level courses that are pre-requisites for longer term programs of study. |
Intervention type: 49 Skills Link - Individual Skills Enhancement (ISE) |
5 - ISE | Category 5:
|
8. The Individual Skills Enhancement (ISE) intervention enables youth to participate in short term courses that fill specific, identified gaps in their education and skill development. It is to be used when there is no other means of support available to meet the individual’s identified skill needs. Courses supported under ISE will likely be pre-employment in nature, or entry-level courses that are pre-requisites for longer term programs of study. |
Intervention type: 50 Skills Link - Individual Skills Enhancement Community Coordinator |
5 - ISE | Category 5:
|
Annex B – Detailed methodology
B.1 Scope
The main objective of this study is to measure the incremental impacts resulting from participation in Skills Link. The program effect is determined through a “counterfactual” approach – the participants’ labour market outcomes are compared to what would have happened had they not received YES interventions. This study also includes a statistical analysis of participants’ socioeconomic profiles and outcome trends for both streams of YES.
This study focuses on participants in ESDC-funded Skills Link interventions, who received an intervention between January 2010 and December 2011. This reference period allows for program impacts on labour market outcomes to be measured over a period of at least 5 years following the completion of the intervention (up to calendar year 2016, which is the most recent year for which tax information is available).
The following evaluation questions were examined as part of this study:
- did Skills Link reach its target population (eligible participants)? What are the profiles (socioeconomic characteristics) of Skills Link?
- to what extent did Skills Link participants improve their labour market outcomes? Following participation, have they become employed, unemployed, self-employed, or returned to school?
- what impacts do Skills Link interventions have on supporting participants to obtain employment, decrease reliance on EI or SA, and improve income? Do these impacts vary by region, target group, duration in program or type of intervention?
Questions 1 and 2 are addressed by examining descriptive statistics on the socio-demographic characteristics and labour market outcomes of the participants. Question 3 is addressed by conducting an incremental impact analysis on employment earnings, incidence of employment, use of social assistance, use of EI benefits, and dependence on income support.
B.2 Data
All data used for the current analysis comes from the integrated Labour Market Program Data Platform (LMPDP). This contains program administrative data collected at the intervention and project level through the Common System for Grants and Contributions, linked to the EI benefits databank and Canada Revenue Agency (CRA) taxation files.
The Platform includes a large number of variables that are closely linked to individuals’ labour market experiences. Variables such as socio-demographic characteristics of participants and comparison cases (for example, age, gender, education, marital status, disability), as well as their province of residence, background qualifications (for example, occupational group, industry codes), and labour market history (for example, use of EI benefits, employment/self-employment earnings, use of social assistance, and incidence of employment in the 5-year pre-participation period).
Moreover, the current evaluation of YES is the first to be able to assess impacts for the different types of Skills Link interventions. Capitalizing on the current availability of more program data on the action plans prepared for participants. In collaboration with the program area, the Evaluation Directorate used this data to map the Skills Link interventions into 5 main categories: Group Based Employability Skills (GBES), Employability Skills Work Experience (ESWE), Work Experience (WE), Individual Skills Enhancement (ISE), and Employability Skills Entrepreneurship (ESEN).
B.3 Unit of analysis
Throughout this report, the unit of analysis was the individual, with respect to their specific YES intervention. This approach was largely consistent with the program data, as the majority of clients received only one intervention. Relatively few clients engaged in multiple interventions. In these cases, the intervention with the longest duration was considered the most representative of program participation.
B.4 Outcome indicators
Outcome trends and incremental impacts were measured for the following individual-level labour market indicators:
- employment earnings: the total annual earnings from paid employment and/or self-employment, captured in Canada Revenue Agency (T4) data
- incidence of employment: the incidence of non-zero annual earnings from employment and/or self-employment, based on T4 data. This variable takes on the value “1” if the individual is employed within a calendar year (that is, non-zero earnings are recorded in either the pre- or post-participation period), and “0” otherwise
- Social Assistance benefits used: measures the average amount of Social Assistance received, which is captured in CRA data
- amount of EI benefits received: measures the average amount of EI benefits received, which is captured in EI Part I data
- dependence on income support: defined as the ratio:
- (EI benefits + Social Assistance benefits)
- (EI benefits + Social Assistance benefits + total earnings)
B.5 Methods for estimating incremental impacts
The methodological framework used in this study is built on the one developed for the evaluation of the Labour Market Development Agreements (LMDA). As is the case with EI Part II measures more broadly, the assignment of YES clients to the different interventions is not random. Quasi-experimental evaluation methods are needed to determine the incremental impacts. Briefly, the procedure used here measures the effectiveness of the program by comparing the actual outcomes for the participants to their counterfactual outcomes (that is, the outcomes that they would have experienced in the absence of an intervention). Since one cannot measure a given individual’s outcomes under both participation and non-participation in a YES intervention, an appropriate comparison group is needed to “stand in” as the counterfactual. Specialized statistical methods must be used to render the comparison group as similar as possible to the program group. All observable factors that can influence both program participation and outcome, so that the only difference remaining between the 2 groups is participation itself. This exchangeability criterion is what allows the estimated impacts to be attributed to program participation, rather than differences in other factors across the 2 groups (that is, differences in pre-existing socioeconomic characteristics and labour market histories). The following subsections describe the specific statistical methods used to achieve exchangeability.
Based on the available data, 2 approaches for building a comparison group were considered for the Skills Link evaluation. In line with the same strategy applied in previous ESDC evaluations, the first approach used a subset of individuals aged 15 to 30 who have the same characteristics as Skills Link participants, but had received only a limited level of treatment through minor Employment Assistance Services (EAS) interventions as part of the Labour Market Development Agreements (LMDA).
The second approach, which was applied for Skills Link interventions, was used as a robustness check for the first approach, and relied on a discrete subset of Group-Based Employability Skills (GBES) participants. Participants were selected to be as similar as possible to the participants in each of the other Skills Link intervention types. The advantage of the second approach is to assess the sensitivity of the net impact results to unobserved variables. GBES participants are more likely to be similar to those in the other Skills Link streams in terms of unobservable barriers to gaining and sustaining employment. Based on consultation with external academic experts (peer reviewers), this dual comparison group approach was deemed the optimal choice in order to account for the possible effects of unobserved variables and strengthen the conclusions of the evaluation. Although there were differences in the magnitude of the net impact estimates across the 2 comparison group scenarios, the relative direction of the effects was the same. Therefore, the conclusions remain the same where most interventions yielded better results than GBES alone. Additionally, other matching methods such as inverse probability weighting and nearest neighbour were used to assess the sensitivity of the estimates to the choice of matching method. This triangulation exercise confirmed that the net impact results were not sensitive to the estimation method. More details about this additional analysis are available upon request.
For all counterfactual comparisons, the net impact results were produced using a state of-the-art combination of difference-in-differences estimation. Propensity score kernel matching methods (Heckman et al., 1997, and Caliendo, 2005) were also used. Given the breadth of background variables available in the linked data files, one can be reasonably confident that the impact estimates are robust (Lechner & Wunsch, 2013) in the context of ALMP evaluations. However, given that the population of Skills Link participants are youth facing barriers to employment, there may be some unobserved characteristics (par example. confidence, criminal record, mental health, drugs/alcohol abuse, etc.) not captured in the data.
This study also investigated how the incremental impact of participating in Skills Link interventions varied among subgroup such as male, female, and education level etc. Subgroup analysis allowed us to check the heterogeneity of the impact results among participants. The core methodology used is the same as described above. Except that the data was split in such a way that each group is homogenous in terms of participant and comparison group. For instance, male participants are compared with male non-participants. Note that this approach can only be used for descriptive purposes, and cannot be used to compare the estimated program impact between subgroups.
B.6 Propensity score matching methods
Program impacts were measured by using propensity-score based weighting approach. Kernel matching was the main estimation method. Kernel matching uses the entire control group and re-weights control group members each time they are compared with a new participant, based on propensity-score differentials. The weights are assigned according to a probability density function, called the “kernel” (typically the normal or Epanechnikov density) such that small differentials (signifying close similarities) result in large weights, and vice versa.
Inverse Probability Weighting (IPW) and Nearest Neighbour matching approach were used as an alternative method for validation purposes. Note that these methods were combined with Difference in Difference. Allowing for time-invariant unobserved characteristics by assuming common time trends in the pre- and post-participation period in these characteristics.
B.7 Propensity score model
The first step involved in using a matching approach is to measure the propensity scores of both program participants and comparison cases, relating these to characteristics thought to be relevant to participation decisions. Development of a propensity score is based on a logistic regression model. YES participants were pooled with the potential comparison cases. Logistic models (logic or probit) were developed to predict the likelihood of participating in YES based on the background characteristics of YES participants and the comparison group members.
The propensity score model is based on a rich set of variables (Table 9), including socio-demographic variables, labour market history of individuals (including EI benefits, incidence of employment, and employment earnings in the 5 years preceding the program entry). The latter point is most important since previous empirical studies have emphasized the importance of labour market history (see Heckman, LaLonde, and Smith (1999) and Lechner and Wunch (2011)). It is important to note that all the variables included in the estimation of the propensity score are theoretically considered as having an influence on the participation decision.
| Socio-demographics variables | Labour market characteristics |
|---|---|
|
|
B.8 Machine learning to select a subset of EAS participants as comparison group
As mentioned, the comparison pool members for Skills Link participants consisted of individuals who shared the same eligibility criteria as YES participants. However, pool members had received minor interventions via Employment Assistance Services (EAS) as part of the Labour Market Development Agreements (LMDA). EAS clients may have received a wide range of one-on-one interventions to support their return to work. These include computer training, career advice and employment counselling, job preparation and job search supports, job finding clubs, and short-term training such as first aid certification or food safety.
In order to identify among EAS clients, individuals with similar socio-demographics and labour market characteristics for each Skills Link intervention types, machine learning K-Nearest Neighbor (KNN) discriminative analysis was used. K-Nearest Neighbor is a supervised machine learning method that is used to classify individuals with similar characteristics into different groups. The variable used to compute the KNN algorithms are based entirely on the propensity score model. The final set of comparison group pool members selected for each intervention is shown in Table 10 below.
| Interventions | Participants | Appropriate comparison group selected from EAS full population* |
|---|---|---|
| GBES | 16,181 | 25,642 |
| WE | 2,245 | 6,756 |
| ESWE | 8,832 | 19,339 |
| ISE | 1,425 | 5,355 |
| ESEN | 310 | 945 |
Note: EAS full comparison population (N=259,866).
B.9 Robustness check for Skills Link - Using Group-Based Employability Skills participants as an alternative comparison group
The incremental impacts of each Skills Link intervention maintained a similar ranking in terms of effectiveness under the 2 comparison group strategies: a limited-treatment EAS versus a Group-Based Employability Skills comparison group. Under the GBES comparison group, the incremental impacts of the other Skills Link interventions on both earnings and incidence of employment (for the in-program year and the 5-year, post-participation average) are summarized in Figure 2. In particular, under both comparison group approaches, Skills Link interventions that included a work experience component (that is, the ESWE and WE interventions) led to better labour market impacts. Participants in Individual Skills Enhancements (ISE) interventions showed significant positive impacts for earnings relative to a GBES intervention. But they did not show improvements in incidence of employment. Those participating in the Employability Skills Entrepreneurship (ESEN) intervention showed no evidence of improvement in earnings or other labour market indicators when compared to GBES or EAS persons.
B.10 Balancing test results before and after matching
To ensure that impact estimates are reliable, balancing property tests were carried out on each of the covariates used in the propensity score models before and after matching. Tests for equality of means (t-test) and the standardized differences test (Rosenbaum and Rubin, 1985) were used. Before matching, there were some differences between the participants and the comparison cases overall as seen from the Pseudo R2 (lower is better) and the Mean Bias (lower is better) in Table 11 below. After matching, differences among the matching covariates were significantly reduced. A test of standardized differences (Mean Bias) confirmed that there were no large differences in the covariates between participants and comparison cases in the original sample (that is, before matching). Few of the variables had standardized difference values greater than 20% after matching, which is the rule of thumb used by Rosenbaum and Rubin (1985).
| Interventions categories | Participants | Pseudo R2 | Mean Bias | Off-CS** | |||
|---|---|---|---|---|---|---|---|
| Before | After | Before | After | Before | After | ||
| GEBS | 16,181 | 16,160 | 0.10 | 0.01 | 4.1 | 1.3 | 21 |
| ESWE | 8,832 | 8,812 | 0.70 | 0.01 | 3.5 | 1.1 | 20 |
| WE | 2,245 | 2,214 | 0.12 | 0.01 | 5.7 | 1.5 | 31 |
| ISE | 1,425 | 1,416 | 0.15 | 0.01 | 8.1 | 1.8 | 9 |
| ESEN | 310 | 258 | 0.16 | 0.06 | 8.1 | 3.1 | 52 |
| SL-overall | 28,991 | 28,950 | 0.11 | 0.01 | 4.8 | 1.1 | 41 |
- *Number of YES participants remaining after the common support restriction applied (2 step algorithm).
- **Number of YES participants deleted due to the common support restriction (after the 2 step algorithm).
- -Standardised bias is defined as the difference of sample means in participant group and matched comparison case subsamples as a percentage of the square root of the average of sample variances in both group.
Figure 2: Robustness check - Incremental impact by Skills Link intervention type using GBES as comparison group
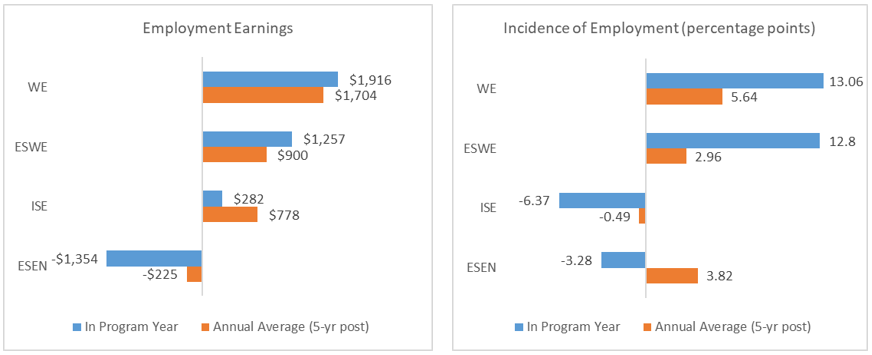
Text description of figure 2
| Interventions categories | Employment earnings in program | Employment earnings annual average (5-year post) |
Incidence of employment (percentage points) in program |
Incidence of employment (percentage points) annual average (5-year post) |
|---|---|---|---|---|
| ESWE | $1,257 | $900 | 12.8 | 2.96 |
| WE | $1,916 | $1,704 | 13.06 | 5.64 |
| ISE | $282 | $778 | -6.37 | -0.49 |
| ESEN | -$1,354 | -$225 | -3.28 | 3.82 |
B.11 Strengths and limitations
The strength of this study is its reliance on the rich administrative data in the Labour Market Program Development Platform. The data allows for numerous socioeconomic and labour characteristics to be accounted for during the analysis. A combination of machine learning and econometric techniques were used to build an appropriate comparison group that is closely matched to YES participants for each of the intervention types. In addition, for the specific Skills Link interventions, rigorous statistical tests and 2 incremental impact estimation methods were used to validate the results and help ensure robustness. Moreover, this is the first evaluation of YES that supports drawing inference about the impacts of the ESDC Skills Link initiative at the intervention-specific level.
A potential limitation of this study is the interpretation of Skills Link results, as the collected data may not fully capture other information related to the sequence of Skills Link interventions. Another limitation is that the universal eligibility of YES creates challenges for comparison group selection since there is no baseline case from which we can draw comparison group members. For example, in the case of the LMDAs, some EI claimants move on to take interventions. The claimants who do not naturally form the comparison group. Moreover, one major limitation of this study is that it only covers ESDC’s Youth Employment Strategy participants.
Lastly, using labour market indicators in assessing program effectiveness falls short of measuring unobservable characteristics that youth with barriers might encounter. These include low confidence, criminal record, mental health issues, drug and alcohol abuse, etc. These unobserved confounders might affect participation and outcomes. Of the factors listed, criminal history is the only one that does not change with time. However, the personal and environmental influences underlying criminal behaviour are time-varying or dynamic. These would potentially pose a problem for DID estimation, which relies on temporal stability of unobserved influences.
Annex C – Detailed profiles and outcomes
C.1 Skills Link participants’ profile
The socio-demographic profiles of participants in the Skills Link interventions are presented in Table 12a below.
Skills Link participants were more likely to be male (59%) than female (41%), a trend that was observed for all types of Skills Link. Moreover, 53% of all Skills Link participants did not have a high school diploma. This is in line with the program’s objective of reaching youth who face barriers to employment. The highest participation rate is among youth aged 20-24 (44%), followed by the 15-19 age group. Immediate results based on Action Plan outcomes showed that overall, 42% of the participants were employed following program completion, 15% returned to school, and 25% remained unemployed.
| Gender | GBES N=16,181 |
GBES C n=25,630 |
ESWE T N=8,832 |
ESWE C n=19,254 |
WE T N=2,245 |
WE C n=6,733 |
ESEN T N=310 |
ESEN C n=880 |
ISE T n=1,425 |
ISE C 5,236 |
SL-overall T N=28,950 |
SL-overall C n=37,458 |
|---|---|---|---|---|---|---|---|---|---|---|---|---|
| Male | 58% | 57% | 59% | 58% | 59% | 59% | 58% | 55% | 66% | 65% | 59% | 58% |
| Female | 42% | 42% | 41% | 42% | 40% | 40% | 40% | 42% | 33% | 34% | 41% | 42% |
| Age | GBES N=16,181 |
GBES C n=25,630 |
ESWE T N=8,832 |
ESWE C n=19,254 |
WE T N=2,245 |
WE C n=6,733 |
ESEN T N=310 |
ESEN C n=880 |
ISE T n=1,425 |
ISE C 5,236 |
SL-overall T N=28,950 |
SL-overall C n=37,458 |
|---|---|---|---|---|---|---|---|---|---|---|---|---|
| Under 20 | 37% | 35% | 33% | 32% | 27% | 25% | 15% | 18% | 26% | 27% | 34% | 33% |
| 20-24 | 42% | 44% | 46% | 46% | 45% | 45% | 50% | 50% | 47% | 47% | 44% | 44% |
| 25 and over | 21% | 21% | 22% | 23% | 28% | 30% | 34% | 32% | 27% | 26% | 22% | 23% |
| Education | GBES N=16,181 |
GBES C n=25,630 |
ESWE T N=8,832 |
ESWE C n=19,254 |
WE T N=2,245 |
WE C n=6,733 |
ESEN T N=310 |
ESEN C n=880 |
ISE T n=1,425 |
ISE C 5,236 |
SL-overall T N=28,950 |
SL-overall C n=37,458 |
|---|---|---|---|---|---|---|---|---|---|---|---|---|
| Secondary incomplete | 55% | 53% | 51% | 50% | 42% | 42% | 38% | 37% | 55% | 53% | 53% | 50% |
| Secondary complete | 24% | 26% | 27% | 27% | 26% | 24% | 33% | 32% | 29% | 30% | 26% | 28% |
| Post-secondary incomplete | 6% | 6% | 6% | 6% | 7% | 8% | 13% | 14% | 4% | 4% | 6% | 6% |
| Post-secondary complete | 11% | 10% | 12% | 11% | 20% | 20% | 14% | 13% | 6% | 5% | 12% | 11% |
| Missing/unknown | 4% | 5% | 4% | 5% | 5% | 6% | 3% | 3% | 7% | 8% | 4% | 5% |
| Characteristic | GBES N=16,181 |
GBES C n=25,630 |
ESWE T N=8,832 |
ESWE C n=19,254 |
WE T N=2,245 |
WE C n=6,733 |
ESEN T N=310 |
ESEN C n=880 |
ISE T n=1,425 |
ISE C 5,236 |
SL-overall T N=28,950 |
SL-overall C n=37,458 |
|---|---|---|---|---|---|---|---|---|---|---|---|---|
| Married/common Law | 9% | 9% | 10% | 9% | 13% | 12% | 6% | 7% | 10% | 10% | 9% | 9% |
| Separated/divorced | 1% | 1% | 2% | 1% | 1% | 1% | 2% | 2% | 2% | 1% | 1% | 1% |
| Single | 72% | 73% | 75% | 75% | 75% | 76% | 76% | 73% | 70% | 72% | 73% | 74% |
| Person with disability | 9% | 10% | 13% | 14% | 14% | 16% | 5% | 6% | 10% | 10% | 11% | 13% |
| Indigenous status | 17% | 17% | 19% | 18% | 27% | 26% | 11% | 10% | 44% | 41% | 20% | 20% |
| Visible minority | 21% | 24% | 16% | 16% | 17% | 17% | 37% | 35% | 7% | 7% | 19% | 21% |
| Immigration status | 6% | 6% | 6% | 6% | 9% | 10% | 4% | 3% | 1% | 1% | 6% | 6% |
| Province/Territory | GBES N=16,181 |
GBES C n=25,630 |
ESWE T N=8,832 |
ESWE C n=19,254 |
WE T N=2,245 |
WE C n=6,733 |
ESEN T N=310 |
ESEN C n=880 |
ISE T n=1,425 |
ISE C 5,236 |
SL-overall T N=28,950 |
SL-overall C n=37,458 |
|---|---|---|---|---|---|---|---|---|---|---|---|---|
| Newfoundland and Labrador | 2% | 2% | 2% | 2% | 4% | 5% | 0% | 0% | 0% | 0% | 2% | 2% |
| Prince Edward Island | 2% | 3% | 1% | 1% | 0% | 0% | 0% | 0% | 0% | 0% | 1% | 2% |
| Nova Scotia | 1% | 2% | 5% | 6% | 1% | 1% | 0% | 0% | 1% | 1% | 3% | 3% |
| New Brunswick | 3% | 3% | 3% | 4% | 2% | 2% | 0% | 0% | 0% | 0% | 3% | 3% |
| Quebec | 25% | 22% | 14% | 13% | 14% | 13% | 0% | 1% | 1% | 1% | 20% | 17% |
| Ontario | 37% | 34% | 41% | 38% | 30% | 29% | 96% | 94% | 53% | 50% | 39% | 36% |
| Manitoba | 6% | 6% | 4% | 4% | 10% | 10% | 0% | 1% | 6% | 6% | 6% | 6% |
| Saskatchewan | 5% | 4% | 3% | 3% | 10% | 10% | 1% | 1% | 1% | 1% | 5% | 5% |
| Alberta | 11% | 12% | 11% | 12% | 13% | 13% | 2% | 2% | 20% | 22% | 11% | 12% |
| British Columbia | 8% | 11% | 15% | 16% | 14% | 16% | 1% | 1% | 17% | 19% | 11% | 14% |
| The North | 0% | 0% | 0% | 0% | 1% | 1% | 0% | 0% | 0% | 0% | 0% | 0% |
| Characteristic | GBES N=16,181 |
GBES C n=25,630 |
ESWE T N=8,832 |
ESWE C n=19,254 |
WE T N=2,245 |
WE C n=6,733 |
ESEN T N=310 |
ESEN C n=880 |
ISE T n=1,425 |
ISE C 5,236 |
SL-overall T N=28,950 |
SL-overall C n=37,458 |
|---|---|---|---|---|---|---|---|---|---|---|---|---|
| No earnings (1-yr prior) | 47% | 47% | 45% | 45% | 43% | 41% | 38% | 40% | 44% | 43% | 46% | 47% |
| Had earnings (1-yr prior) | 53% | 53% | 54% | 55% | 57% | 59% | 62% | 60% | 56% | 57% | 54% | 53% |
| $1 to $5k | 68% | 65% | 64% | 63% | 58% | 58% | 56% | 49% | 59% | 58% | 65% | 62% |
| $5k to $10k | 20% | 22% | 21% | 22% | 22% | 22% | 20% | 26% | 20% | 21% | 21% | 22% |
| $10k to $20k | 10% | 10% | 12% | 12% | 15% | 15% | 15% | 15% | 16% | 17% | 11% | 12% |
| $20k to $40k | 2% | 3% | 3% | 3% | 5% | 5% | 8% | 9% | 4% | 4% | 3% | 3% |
| $40k to $60k | 0% | 0% | 0% | 0% | 0% | 0% | 1% | 1% | 0% | 0% | 0% | 0% |
| Over $60k | 0% | 0% | 0% | 0% | 0% | 0% | 0% | 0% | 0% | 0% | 0% | 0% |
| No earnings (2-yrs prior) | 48% | 47% | 46% | 45% | 44% | 42% | 35% | 37% | 45% | 43% | 47% | 47% |
| Had earnings (2-yrs prior) | 52% | 53% | 54% | 55% | 56% | 58% | 65% | 63% | 55% | 57% | 53% | 53% |
| $1 to $5k | 66% | 64% | 62% | 61% | 58% | 56% | 55% | 56% | 57% | 56% | 64% | 61% |
| $5k to $10k | 20% | 20% | 21% | 21% | 21% | 23% | 19% | 19% | 22% | 22% | 20% | 21% |
| $10k to $20k | 11% | 12% | 12% | 13% | 15% | 16% | 17% | 17% | 16% | 17% | 12% | 14% |
| $20k to $40k | 3% | 3% | 4% | 4% | 5% | 5% | 7% | 6% | 4% | 5% | 3% | 4% |
| $40k to $60k | 0% | 0% | 0% | 0% | 0% | 0% | 1% | 1% | 0% | 0% | 0% | 0% |
| Over $60k | 0% | 0% | 0% | 0% | 0% | 0% | 0% | 0% | 0% | 0% | 0% | 0% |
| Received EI 1-year Prior | 3% | 3% | 3% | 4% | 3% | 3% | 4% | 3% | 3% | 3% | 3% | 4% |
| Received EI 2-year prior | 3% | 3% | 3% | 3% | 3% | 2% | 3% | 2% | 3% | 3% | 3% | 3% |
| Received SA 1-year prior | 24% | 24% | 26% | 26% | 22% | 23% | 28% | 25% | 24% | 24% | 25% | 25% |
| Received SA 2-year prior | 18% | 18% | 19% | 19% | 16% | 16% | 20% | 18% | 19% | 19% | 18% | 18% |
C.2 Heterogeneous group in Skills Link – GBES intervention: Machine learning clustering analysis
As the participants taking GBES represented more than half of the population of Skills Link, a data mining exercise was conducted to uncover the heterogeneous groups present within this population using machine-clustering analysis. The analysis was also performed for the ESWE and WE interventions. However, no definitively distinct groups were observed for these intervention types.
To conduct the analysis, an unsupervised machine learning method called k-means was used to partition observations into clusters such that the observations within a cluster are similar to each other but meaningfully different from observations in other clusters. Before implementing k-means clustering, we performed a Principal Component Analysis (PCA) to reduce the large volume of raw data on the various socioeconomic characteristics, measured prior to starting the intervention, to a smaller subset of uncorrelated components (linear composite of covariates), on which each individual was assigned a score. Using these PCA scores rather than the original raw covariate data as input for the k-means clustering makes the clustering exercise more analytically feasible. That is, for a given case, the k-means procedure only needs to process a single value on each PC, rather than the full array of covariate information for that person. In this way, PCA improves the performance of the k-means algorithm by enhancing the ability of the algorithm to form distinct clusters. Ultimately, we find that the population of GBES participants can be divided into 5 distinct groups (See Figure 3 below).
Figure 3: Main characteristics of GBES participants by clusters
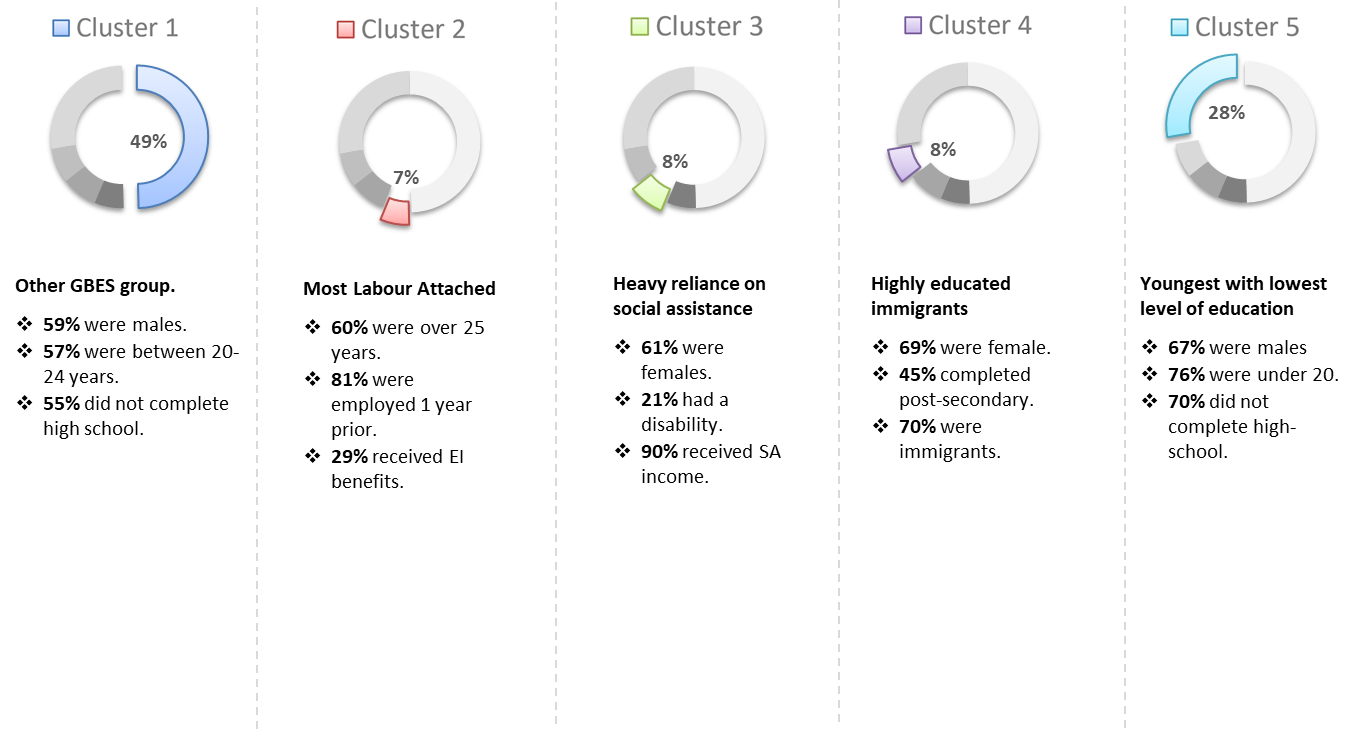
Text description of figure 3
| Detail | Percentage |
|---|---|
| Male | 59% |
| 20-24 years | 57% |
| Did not complete High school | 55% |
| Detail | Percentage |
|---|---|
| Over 25 years | 60% |
| Employed 1 year prior | 81% |
| Received EI Benefits | 29% |
| Detail | Percentage |
|---|---|
| Female | 61% |
| Disability | 21% |
| Received SA inc | 90% |
| Detail | Percentage |
|---|---|
| Female | 69% |
| Completed post-secondary | 45% |
| Were immigrants | 70% |
| Detail | Percentage |
|---|---|
| Male | 67% |
| Under 20 | 76% |
| Did not complete high-school | 70% |
For each of the 5 clusters (groups) and GBES overall, Table C.2 below shows the differences between the labour market outcomes (that is, earnings, EI use and SA use) measured 1-year prior to participation and 5-year, post-participation averages. As shown in Table 5, whereas the pre-post differences in outcomes for some clusters were similar to those of the overall GBES, others did not follow the same trend. For instance, although the pre-post increase in earnings for Cluster 2 (most labour attached) is in line with the overall results for GBES, this group decreased their average EI benefit usage compared to the pre-participation year. Further, Cluster 3 (heavy reliance on social assistance) substantially reduced their reliance on Social Assistance, and Cluster 4 (highly educated immigrants) substantially increased their employment earnings. Although we cannot attribute these results to YES entirely (given the unavailability of matched comparison group for the different clusters), the evidence suggests that participation may have served as a gateway to employment. Further research will be required to determine the exact mechanisms that facilitated this purported transition. Participants might have taken relatively more intensive YES interventions or provincially administered programs such as the LMDA, or could simply have found employment.
| Outcome | Other GBES group | Most labour attached | Heavy reliance on social assistance | Highly educated immigrants | Youngest with lowest level of education | GBES overall |
|---|---|---|---|---|---|---|
| Earnings | $5,758*** | $5,602*** | $3,149*** | $14,632*** | $5,341*** | $5,837*** |
| EI use | $465*** | $-697*** | $301*** | $795*** | $285*** | $350*** |
| SA use | $776*** | $285** | $-2034*** | $94* | $1338*** | $563*** |
- Significance level ***1% **5% *10%.
- Source: Labour Market Program Data Platform.
Annex D – Subgroup incremental impact analysis
Tables 14 to 17 provide the detailed results for the subgroup analysis by intervention type for reach indicator and post program year. The main results from each table can be found in Section 5.
| Indicators | Program start year (0) |
1 year post-program (1) |
2 year post-program (2) |
3 year post-program (3) |
4 year post-program (4) |
5 year post-program (5) |
Annual average post-program (1-5) |
Cumulative in & post-program (0-5) |
|---|---|---|---|---|---|---|---|---|
| Employment income ($) | 423 | -516 | -404 | -568 | -589 | -967 | -568 | -2837 |
| Total reported earnings ($) | 316 | -494 | -389 | -421 | -492 | -804 | -487 | -2433 |
| Incidence of employment (pp) | 11.42*** | 6.75*** | 2.92 | 4.38** | 5.3** | 3.35* | 4.53*** | N/A |
| EI benefits ($) | 11 | 321*** | 125 | 97 | 123 | 91 | 150* | 752* |
| SA benefits ($) | -259*** | -276*** | -175 | -179 | -95 | -258* | -187 | -932* |
| Dependence on income support (pp) | -5.1*** | -0.98 | 0.58 | 0.53 | 1.32 | -0.09 | 0.27 | N/A |
- Significance level ***1% **5% *10%.
- Total Reported Earnings: Reported on T4 Earnings.
- pp : percentage point.
- The cumulative post-program impact and the 5-year annual average post-program impact may not be a simple sum/average of the yearly post-program impact. This is due to the fact that there are individuals with missing values on certain indicators for certain years, and the kernel matching algorithm ignored them when computing the net impact. Researchers have suggested that when computing the impact on multiple outcomes with some missing values, kernel matching should be performed separately for each of the outcomes.
| Indicators | Program start year (0) |
1 year post-program (1) |
2 year post-program (2) |
3 year post-program (3) |
4 year post-program (4) |
5 year post-program (5) |
Annual average post-program (1-5) |
Cumulative in & post-program (0-5) |
|---|---|---|---|---|---|---|---|---|
| Employment income ($) | 1008*** | 164 | -776 | -255 | -261 | -408 | -202 | -1010 |
| Total reported earnings ($) | 990*** | 151 | -765* | -367 | -211 | -470 | -195 | -972 |
| Incidence of employment (pp) | 18.31*** | 7.47*** | 0.77 | 1.36 | 0.67 | 0.56 | 3.24 | N/A |
| EI benefits ($) | -27 | 431*** | -44 | -222** | 10 | -227 | -7 | -37 |
| SA benefits ($) | -286** | -509*** | -182 | -116 | -2 | 119 | -111 | -551 |
| Dependence on income support (pp) | -5.65*** | -2.57* | -1.87 | -1.55 | 1.81 | 1.67 | -0.53 | N/A |
| Indicators | Program start year (0) |
1 year post-program (1) |
2 year post-program (2) |
3 year post-program (3) |
4 year post-program (4) |
5 year post-program (5) |
Annual average post-program (1-5) |
Cumulative in & post-program (0-5) |
|---|---|---|---|---|---|---|---|---|
| Employment income ($) | 601* | -136 | -733 | -192 | -467 | -1243 | -364 | -1817 |
| Total reported earnings ($) | 527 | -66 | -843 | -386 | -469 | -1261 | -397 | -1985 |
| Incidence of employment (pp) | 11.68*** | 4.26 | -2.05 | -2.8 | 2.08 | -1.92 | 0.2 | N/A |
| EI benefits ($) | 64*** | 229* | 18 | 252** | 114 | 132 | 135 | 677 |
| SA benefits ($) | -275** | -387** | 13 | 151 | 177 | 247 | -1 | -1 |
| Dependence on income support (pp) | -8.83*** | -2.94 | 1.5 | 1.41 | 1.66 | 3.85* | 1.07 | N/A |
| Indicators | Program start year (0) |
1 year post-program (1) |
2 year post-program (2) |
3 year post-program (3) |
4 year post-program (4) |
5 year post-program (5) |
Annual average post-program (1-5) |
Cumulative in & post-program (0-5) |
|---|---|---|---|---|---|---|---|---|
| Employment income ($) | 1010*** | -466 | -650 | -861 | -331 | 29 | -408 | -2039 |
| Total reported earnings ($) | 865*** | -507 | -685 | -662 | -110 | 246 | -306 | -1529 |
| Incidence of employment (pp) | 13.81*** | 7.06*** | 2.74 | 3.81 | 1.79 | 2.09 | 3.53** | N/A |
| EI benefits ($) | 95 | 503*** | 175* | 1 | 158 | 46 | 175*** | 877*** |
| SA benefits ($) | -399*** | -437*** | -292* | -172 | -166 | -39 | -226 | -1126 |
| Dependence on income support (pp) | -6.32*** | -1.38 | -2.31 | 0.79 | 1.68 | 1.11 | -0.02 | N/A |
| Indicators | Program start year (0) |
1 year post-program (1) |
2 year post-program (2) |
3 year post-program (3) |
4 year post-program (4) |
5 year post-program (5) |
Annual average post-program (1-5) |
Cumulative in & post-program (0-5) |
|---|---|---|---|---|---|---|---|---|
| Employment income ($) | 529 | -256 | -1014 | -331 | -565 | -943 | -552 | -2760 |
| Total reported earnings ($) | 517 | -240 | -847 | -349 | -512 | -789 | -475 | -2372 |
| Incidence of employment (pp) | 23.04*** | 14.46*** | 8.14*** | 9.73*** | 9.65*** | 7.05** | 12.07*** | N/A |
| EI benefits ($) | -193** | 374*** | 327** | -166 | 113 | -78 | 137 | 689 |
| SA benefits ($) | 107 | -354* | -240 | -275 | -15 | -384* | -266 | -1326 |
| Dependence on income support (pp) | -3.42 | 0.1 | -0.28 | -3.26 | 1.35 | -2.99 | -1.03 | N/A |
| Indicators | Program start year (0) |
1 year post-program (1) |
2 year post-program (2) |
3 year post-program (3) |
4 year post-program (4) |
5 year post-program (5) |
Annual average post-program (1-5) |
Cumulative in & post-program (0-5) |
|---|---|---|---|---|---|---|---|---|
| Employment income ($) | 1114*** | 679 | 315 | 435 | 176 | 441 | 333 | 1669 |
| Total reported earnings ($) | 1101*** | 663* | 284 | 549 | 314 | 563 | 384 | 1923 |
| Incidence of employment (pp) | 19.68*** | 11.62*** | 4.74** | 3.32 | 4.7* | 4.4* | 6.87*** | N/A |
| EI benefits ($) | 94* | 359*** | 147 | -90 | 174 | -32 | 113 | 565* |
| SA benefits ($) | -655*** | -940*** | -495*** | -408** | -296 | -366* | -554*** | -2766** |
| Dependence on income support (pp) | -11.7*** | -6.41*** | -3.47 | -3.18 | -0.76 | -4.42** | -3.62** | N/A |
| Indicators | Program start year (0) |
1 year post-program (1) |
2 year post-program (2) |
3 year post-program (3) |
4 year post-program (4) |
5 year post-program (5) |
Annual average post-program (1-5) |
Cumulative in & post-program (0-5) |
|---|---|---|---|---|---|---|---|---|
| Employment income ($) | 643 | 661 | 43 | 1844* | 3238*** | 2402* | 1819* | 9098* |
| Total reported earnings ($) | 514 | 647 | 109 | 1996* | 3280** | 2671** | 1937** | 9686** |
| Incidence of employment (pp) | 12.83*** | 5.46 | -0.64 | 1.89 | 1.94 | -4.29 | 0.53 | N/A |
| EI benefits ($) | -103 | 596*** | 284** | 129 | 275 | 220 | 334*** | 1670*** |
| SA benefits ($) | 60 | -255 | -807** | -657*** | -592** | -562 | -719** | -3591** |
| Dependence on income support (pp) | -3.98 | -2.26 | -5.75** | -8.66*** | -3.67 | -3.25 | -4.66* | N/A |
| Indicators | Program start year (0) |
1 year post-program (1) |
2 year post-program (2) |
3 year post-program (3) |
4 year post-program (4) |
5 year post-program (5) |
Annual average post-program (1-5) |
Cumulative in & post-program (0-5) |
|---|---|---|---|---|---|---|---|---|
| Employment income ($) | 1385* | 1524 | 617 | -186 | 68 | 349 | 490 | 2452 |
| Total reported earnings ($) | 1295* | 1419 | 760 | -49 | -153 | 306 | 471 | 2357 |
| Incidence of employment (pp) | 12.85*** | 2.92 | 7.35* | 3.5 | 5.23 | 3.23 | 4.79 | N/A |
| EI benefits ($) | 37 | 279** | 360** | 29 | 179 | -24 | 171* | 858 |
| SA benefits ($) | -154 | -207 | -227 | 12 | -132 | -163 | -144 | -717 |
| Dependence on income support (pp) | -2.89* | -1.48 | -0.65 | 0.72 | 1.08 | -1.52 | 0.02 | N/A |
| Indicators | Program start year (0) |
1 year post-program (1) |
2 year post-program (2) |
3 year post-program (3) |
4 year post-program (4) |
5 year post-program (5) |
Annual average post-program (1-5) |
Cumulative in & post-program (0-5) |
|---|---|---|---|---|---|---|---|---|
| Employment income ($) | -265 | 302 | -583 | -1552* | -1587* | -1469 | -917 | -4581 |
| Total reported earnings ($) | -525 | 225 | -616 | -1490* | -1361 | -1168 | -805 | -4023 |
| Incidence of employment (pp) | 17*** | 19.23*** | 3 | 0.91 | -3.78 | 0.22 | 4.22 | N/A |
| EI benefits ($) | 201** | -220 | 36 | 176 | 170 | 279 | 42 | 213 |
| SA benefits ($) | -118 | 45 | -136 | 332 | 572** | 182 | 266 | 1331 |
| Dependence on income support (pp) | 0.11 | -3.95 | -2.46 | 9.73* | 12.62*** | 9.94* | 5.12* | N/A |
| Indicators | Program start year (0) |
1 year post-program (1) |
2 year post-program (2) |
3 year post-program (3) |
4 year post-program (4) |
5 year post-program (5) |
Annual average post-program (1-5) |
Cumulative in & post-program (0-5) |
|---|---|---|---|---|---|---|---|---|
| Employment income ($) | -420*** | -492*** | -827*** | -1085*** | -1074*** | -1161*** | -904*** | -4516*** |
| Total reported earnings ($) | -510*** | -516*** | -762*** | -1029*** | -994*** | -1162*** | -869*** | -4341*** |
| Incidence of employment (pp) | 4.24*** | 3.74*** | -0.34 | -1.05 | -0.61 | -0.95 | 0.19 | N/A |
| EI benefits ($) | -115*** | -107*** | -34 | -20 | -79* | -114** | -71*** | -353*** |
| SA benefits ($) | -216*** | -71 | 83 | 199** | 236*** | 297*** | 146** | 730** |
| Dependence on income support (pp) | -2.48*** | -0.83 | 1.99** | 3.23*** | 3.09*** | 2.68*** | 2.06*** | N/A |
- Significance level ***1% **5% *10%
- Total Reported Earnings: Reported on T4 Earnings
- pp : percentage point
- The cumulative post-program impact and the 5-year annual average post-program impact may not be a simple sum/average of the yearly post-program impact. This is due to the fact that there are individuals with missing values on certain indicators for certain years, and the kernel matching algorithm ignored them when computing the net impact. Researchers have suggested that when computing the impact on multiple outcomes with some missing values, kernel matching should be performed separately for each of the outcomes.
| Indicators | Program start year (0) |
1 year post-program (1) |
2 year post-program (2) |
3 year post-program (3) |
4 year post-program (4) |
5 year post-program (5) |
Annual average post-program (1-5) |
Cumulative in & post-program (0-5) |
|---|---|---|---|---|---|---|---|---|
| Employment income ($) | -844*** | -1866*** | -2013*** | -2396*** | -2491*** | -2489*** | -2233*** | -11162*** |
| Total reported earnings ($) | -919*** | -1896*** | -2008*** | -2401*** | -2496*** | -2497*** | -2241*** | -11204*** |
| Incidence of employment (pp) | 1.36 | -0.23 | -2.89*** | -3.36*** | -2.2** | -2.52** | -1.43 | N/A |
| EI benefits ($) | -128*** | -106*** | -81** | -108*** | -65 | -79 | -88*** | -437*** |
| SA benefits ($) | -205*** | -104** | 86 | 90 | 70 | -32 | 21 | 106 |
| Dependence on income support (pp) | -2.68*** | -0.4 | 1.64** | 1.82*** | 1.67** | 0.85 | 1.08** | N/A |
| Indicators | Program start year (0) |
1 year post-program (1) |
2 year post-program (2) |
3 year post-program (3) |
4 year post-program (4) |
5 year post-program (5) |
Annual average post-program (1-5) |
Cumulative in & post-program (0-5) |
|---|---|---|---|---|---|---|---|---|
| Employment income ($) | -412*** | -804*** | -1123*** | -1701*** | -1500*** | -1399*** | -1415*** | -7072*** |
| Total reported earnings ($) | -500*** | -838*** | -1134*** | -1710*** | -1488*** | -1371*** | -1418*** | -7089*** |
| Incidence of employment (pp) | 0.35 | -1.37 | -4.92*** | -5.91*** | -4.92*** | -4.66*** | -3.93*** | N/A |
| EI benefits ($) | -23 | -35 | 24 | -15 | -32 | -61 | -24 | -117 |
| SA benefits ($) | -300*** | -202*** | 21 | 128 | 131 | 26 | 8 | 40 |
| Dependence on income support (pp) | -5.39*** | -1.39* | 2.06** | 1.99** | 2.24*** | 0.47 | 1.01 | N/A |
| Indicators | Program start year (0) |
1 year post-program (1) |
2 year post-program (2) |
3 year post-program (3) |
4 year post-program (4) |
5 year post-program (5) |
Annual average post-program (1-5) |
Cumulative in & post-program (0-5) |
|---|---|---|---|---|---|---|---|---|
| Employment income ($) | -662*** | -1141*** | -1281*** | -1556*** | -1739*** | -1983*** | -1549*** | -7741*** |
| Total reported earnings ($) | -742*** | -1158*** | -1252*** | -1536*** | -1714*** | -2007*** | -1541*** | -7703*** |
| Incidence of employment (pp) | 1.89* | 2.38** | -1.07 | -1.14 | -1.23 | -2.04* | -0.75 | N/A |
| EI benefits ($) | -123*** | -141*** | -60 | -7 | -21 | -71 | -60** | -298** |
| SA benefits ($) | -223*** | -130** | -64 | -3 | 63 | 76 | -17 | -84 |
| Dependence on income support (pp) | -1.99*** | -1.4* | -0.26 | 0.96 | 1.24 | 1.19 | 0.32 | N/A |
| Indicators | Program start year (0) |
1 year post-program (1) |
2 year post-program (2) |
3 year post-program (3) |
4 year post-program (4) |
5 year post-program (5) |
Annual average post-program (1-5) |
Cumulative in & post-program (0-5) |
|---|---|---|---|---|---|---|---|---|
| Employment income ($) | -543** | -938** | -1029** | -949* | -1259** | -891 | -1101*** | -5502*** |
| Total reported earnings ($) | -694*** | -1006*** | -967** | -906* | -1189** | -835 | -1065*** | -5322*** |
| Incidence of employment (pp) | 7.65*** | 5.78*** | 1.86 | 1.01 | 3.21** | 0.88 | 3.22* | N/A |
| EI benefits ($) | -247*** | -120** | -139* | -294*** | -140* | -250*** | -188*** | -940*** |
| SA benefits ($) | -52 | -14 | 159 | 212* | 132 | 12 | 93 | 465 |
| Dependence on income support (pp) | -1.28 | -0.2 | 1.84 | 1.52 | 1.53 | 0.04 | 0.86 | N/A |
| Indicators | Program start year (0) |
1 year post-program (1) |
2 year post-program (2) |
3 year post-program (3) |
4 year post-program (4) |
5 year post-program (5) |
Annual average post-program (1-5) |
Cumulative in & post-program (0-5) |
|---|---|---|---|---|---|---|---|---|
| Employment income ($) | -278*** | -457*** | -706*** | -916*** | -715*** | -490* | -657*** | -3281*** |
| Total reported earnings ($) | -363*** | -487*** | -688*** | -904*** | -732*** | -500* | -661*** | -3303*** |
| Incidence of employment (pp) | 4.36*** | 3.41*** | -0.46 | 1.92* | -0.18 | -0.42 | -0.35 | N/A |
| EI benefits ($) | -92*** | -91*** | -43 | -52 | -33 | -138*** | -71*** | -355*** |
| SA benefits ($) | -308*** | -180*** | 110 | 145** | 83 | -30 | 26 | 134 |
| Dependence on income support (pp) | -3.73*** | -1.43* | 2.13** | 2.75*** | 1.67** | -0.01 | 1.04 | N/A |
| Indicators | Program start year (0) |
1 year post-program (1) |
2 year post-program (2) |
3 year post-program (3) |
4 year post-program (4) |
5 year post-program (5) |
Annual average post-program (1-5) |
Cumulative in & post-program (0-5) |
|---|---|---|---|---|---|---|---|---|
| Employment income ($) | -414* | -557 | -885* | -573 | -146 | -306 | -504 | -2517 |
| Total reported earnings ($) | -528** | -587 | -827* | -481 | -71 | -223 | -446 | -2228 |
| Incidence of employment (pp) | 0.5 | 2.36 | 0.52 | -0.63 | 0.2 | -0.4 | -1.02 | N/A |
| EI benefits ($) | -294*** | -121* | -8 | -24 | -11 | 19 | -29 | -143 |
| SA benefits ($) | -194** | -365*** | -572*** | -570*** | -529*** | -460*** | -493*** | -2461*** |
| Dependence on income support (pp) | -2.57** | -3.05** | -4.08*** | -2.62* | -2.87** | -2.27 | -2.93 | N/A |
| Indicators | Program start year (0) |
1 year post-program (1) |
2 year post-program (2) |
3 year post-program (3) |
4 year post-program (4) |
5 year post-program (5) |
Annual average post-program (1-5) |
Cumulative in & post-program (0-5) |
|---|---|---|---|---|---|---|---|---|
| Employment income ($) | -1432*** | -2542*** | -1610* | -2111** | -2351** | -2864*** | -2360*** | -11800*** |
| Total reported earnings ($) | -1621*** | -2469*** | -1725** | -2045** | -2331** | -2943*** | -2361*** | -11803*** |
| Incidence of employment (pp) | 3.24 | 0.36 | 1.39 | -1.31 | -0.46 | -2.93 | -2.29 | N/A |
| EI benefits ($) | -157** | -134 | -169 | 24 | -169 | -257* | -141* | -703* |
| SA benefits ($) | -260* | 148 | 253 | 265 | 282* | 394** | 268* | 1341* |
| Dependence on income support (pp) | -3.42** | 2.6 | 1.75 | 4.27** | 3.2* | 3.9** | 3.09** | N/A |
| Indicators | Program start year (0) |
1 year post-program (1) |
2 year post-program (2) |
3 year post-program (3) |
4 year post-program (4) |
5 year post-program (5) |
Annual average post-program (1-5) |
Cumulative in & post-program (0-5) |
|---|---|---|---|---|---|---|---|---|
| Employment income ($) | -1214** | -2340** | -2345** | -2563* | -2859* | -3146** | -2688** | -13436** |
| Total reported earnings ($) | -1274** | -2369** | -2234* | -2545* | -2677* | -2878* | -2588** | -12939** |
| Incidence of employment (pp) | -5.08 | 1.97 | -4.25 | -3.09 | -2.36 | -1.05 | -4.7 | N/A |
| EI benefits ($) | -23 | -61 | -8 | -73 | 180 | 158 | 39 | 198 |
| SA benefits ($) | 78 | -23 | -71 | -75 | 206 | 36 | -48 | -238 |
| Dependence on income support (pp) | -2.55 | -0.54 | 0.51 | 1.17 | 5.62*** | 2.02 | 1.41 | N/A |
| Indicators | Program start year (0) |
1 year post-program (1) |
2 year post-program (2) |
3 year post-program (3) |
4 year post-program (4) |
5 year post-program (5) |
Annual average post-program (1-5) |
Cumulative in & post-program (0-5) |
|---|---|---|---|---|---|---|---|---|
| Employment income ($) | -391* | 550* | -499 | -599 | -648 | -271 | -525 | -2622 |
| Total reported earnings ($) | -484** | -636* | -547 | -567 | -602 | -284 | -541 | -2703 |
| Incidence of employment (pp) | 3.2 | 1.94 | -0.13 | -0.27 | -0.72 | -0.64 | 0.61 | N/A |
| EI benefits ($) | -56 | -143*** | -81 | 2 | -18 | -199** | -88* | -437* |
| SA benefits ($) | -107 | -116 | -13 | -36 | 133 | 66 | -15 | -74 |
| Dependence on income support (pp) | -3.92*** | -2.99** | -1.74 | -1.91 | 0.38 | -1.49 | -1.7 | N/A |
| Indicators | Program start year (0) |
1 year post-program (1) |
2 year post-program (2) |
3 year post-program (3) |
4 year post-program (4) |
5 year post-program (5) |
Annual average post-program (1-5) |
Cumulative in & post-program (0-5) |
|---|---|---|---|---|---|---|---|---|
| Employment income ($) | 510*** | -845*** | -1066*** | -1005*** | -1062*** | -1095*** | -1015*** | -5071*** |
| Total reported earnings ($) | 427*** | -832*** | -1075*** | -978*** | -1019*** | -1022*** | -985*** | -4923*** |
| Incidence of employment (pp) | 14.3*** | 5.81*** | 1.03 | -0.21 | 0.16 | -0.49 | 2.57*** | N/A |
| EI benefits ($) | -123*** | 117*** | 8 | 10 | 28 | 60 | 45 | 229 |
| SA benefits ($) | -229*** | -161*** | -28 | -17 | 160 | 3 | -3 | -15 |
| Dependence on income support (pp) | -5.57*** | -0.42 | 1.32* | 1.46* | 1.5** | 1.41** | 1.04* | N/A |
- Significance level ***1% **5% *10%.
- Total Reported Earnings: Reported on T4 Earnings.
- pp : percentage point.
- The cumulative post-program impact and the 5-year annual average post-program impact may not be a simple sum/average of the yearly post-program impact. This is due to the fact that there are individuals with missing values on certain indicators for certain years, and the kernel matching algorithm ignored them when computing the net impact. Researchers have suggested that when computing the impact on multiple outcomes with some missing values, kernel matching should be performed separately for each of the outcomes.
| Indicators | Program start year (0) |
1 year post-program (1) |
2 year post-program (2) |
3 year post-program (3) |
4 year post-program (4) |
5 year post-program (5) |
Annual average post-program (1-5) |
Cumulative in & post-program (0-5) |
|---|---|---|---|---|---|---|---|---|
| Employment income ($) | 746*** | 194 | -712*** | -689*** | -673** | -881*** | -552** | -2759** |
| Total reported earnings ($) | 694*** | 219 | -691*** | -697*** | -709** | -929*** | -562** | -2806** |
| Incidence of employment (pp) | 17.22*** | 9.08*** | 0.64 | -0.73 | -2.77** | -1.07 | 1.85* | N/A |
| EI benefits ($) | -113*** | 104*** | 105*** | -34 | -70 | 2 | 21 | 107 |
| SA benefits ($) | -217*** | -154** | 97 | 172** | 261*** | 208** | 119* | 597* |
| Dependence on income support (pp) | -5.72*** | -1.21 | 1.89** | 1.76* | 2.14** | 1.71* | 1.21* | N/A |
| Indicators | Program start year (0) |
1 year post-program (1) |
2 year post-program (2) |
3 year post-program (3) |
4 year post-program (4) |
5 year post-program (5) |
Annual average post-program (1-5) |
Cumulative in & post-program (0-5) |
|---|---|---|---|---|---|---|---|---|
| Employment income ($) | 519*** | -409** | -992*** | -1285*** | -1490*** | -1367*** | -1108*** | -5540*** |
| Total reported earnings ($) | 467*** | -435** | -978*** | -1258*** | -1434*** | -1297*** | -1080*** | -5400*** |
| Incidence of employment (pp) | 10.16*** | 2.21* | -3.37*** | -4.63*** | -6.05*** | -4.57*** | -2.41** | N/A |
| EI benefits ($) | -5 | 131*** | 40 | 71 | 81 | 47 | 73** | 367** |
| SA benefits ($) | -220*** | -199* | -10 | 38 | 58 | 46 | 1 | 9 |
| Dependence on income support (pp) | -4.96*** | 0.06 | 2** | 2.69*** | 2.84*** | 2.15** | 1.96*** | N/A |
| Indicators | Program start year (0) |
1 year post-program (1) |
2 year post-program (2) |
3 year post-program (3) |
4 year post-program (4) |
5 year post-program (5) |
Annual average post-program (1-5) |
Cumulative in & post-program (0-5) |
|---|---|---|---|---|---|---|---|---|
| Employment income ($) | 834*** | -140 | -725*** | -774** | -532 | -751** | -585** | -2921** |
| Total reported earnings ($) | 793*** | -129 | -728*** | -771** | -554* | -739* | -584** | -2918** |
| Incidence of employment (pp) | 15.01*** | 6.79*** | 0.67 | -0.43 | -1.28 | -0.62 | 1.35 | N/A |
| EI benefits ($) | -113*** | 145*** | 75* | 2 | -65 | 4 | 33 | 166 |
| SA benefits ($) | -195*** | -187*** | -75 | -6 | 327** | 126 | 40 | 202 |
| Dependence on income support (pp) | -5.08*** | -0.78 | 0.74 | 0.71 | 1.32 | 0.93 | 0.52 | N/A |
| Indicators | Program start year (0) |
1 year post-program (1) |
2 year post-program (2) |
3 year post-program (3) |
4 year post-program (4) |
5 year post-program (5) |
Annual average post-program (1-5) |
Cumulative in & post-program (0-5) |
|---|---|---|---|---|---|---|---|---|
| Employment income ($) | 283 | -1032** | -1461*** | -831 | -1326** | -1601** | -1250** | -6248** |
| Total reported earnings ($) | 143 | -966** | -1503*** | -811 | -1276** | -1556** | -1222** | -6109** |
| Incidence of employment (pp) | 18.38** | 10.48*** | 3.38* | 2.34 | 2.02 | 0.79 | 4.21*** | N/A |
| EI benefits ($) | -266*** | 32 | 45 | -231*** | -38 | 36 | -31 | -152 |
| SA benefits ($) | -212** | -113 | 296*** | 211* | 99 | 74 | 116 | 580 |
| Dependence on income support (pp) | -6.6*** | -0.88 | 3.33*** | 0.73 | 1.29 | 1.74 | 1.2 | N/A |
| Indicators | Program start year (0) |
1 year post-program (1) |
2 year post-program (2) |
3 year post-program (3) |
4 year post-program (4) |
5 year post-program (5) |
Annual average post-program (1-5) |
Cumulative in & post-program (0-5) |
|---|---|---|---|---|---|---|---|---|
| Employment income ($) | 654*** | -32 | -553** | -575** | -593** | -396 | -430** | -2147** |
| Total reported earnings ($) | 615*** | -75 | -555** | -583** | -598** | -396 | -442** | -2206** |
| Incidence of employment (pp) | 18.1*** | 8.74*** | 0.83 | -0.05 | -0.01 | -0.36 | 1.99* | N/A |
| EI benefits ($) | -79*** | 48 | -47 | -39 | -24 | -39 | -21 | -103 |
| SA benefits ($) | -211*** | -136* | 121 | 70 | 233 | 33 | 62 | 312 |
| Dependence on income support (pp) | -6.17*** | -1.14 | 1.91** | 1.83** | 1.6* | 0.04 | 0.81 | N/A |
| Indicators | Program start year (0) |
1 year post-program (1) |
2 year post-program (2) |
3 year post-program (3) |
4 year post-program (4) |
5 year post-program (5) |
Annual average post-program (1-5) |
Cumulative in & post-program (0-5) |
|---|---|---|---|---|---|---|---|---|
| Employment income ($) | 1120*** | 418 | -281 | 393 | 750 | 201 | 296 | 1484 |
| Total reported earnings ($) | 976*** | 421 | -257 | 425 | 775 | 240 | 321 | 1605 |
| Incidence of employment (pp) | 14.66*** | 7.7*** | 2.25 | 0.81 | 1.27 | 1.89 | 2.74 | N/A |
| EI benefits ($) | -156*** | 163** | 142* | 38 | 11 | 242** | 121** | 608** |
| SA benefits ($) | -305*** | -325*** | -424*** | -368*** | -312** | -228* | -327*** | -1635*** |
| Dependence on income support (pp) | -5.46*** | -2.69** | -2.43* | -2.45* | -2.37* | -0.54 | -1.81* | N/A |
| Indicators | Program start year (0) |
1 year post-program (1) |
2 year post-program (2) |
3 year post-program (3) |
4 year post-program (4) |
5 year post-program (5) |
Annual average post-program (1-5) |
Cumulative in & post-program (0-5) |
|---|---|---|---|---|---|---|---|---|
| Employment income ($) | 173 | -834 | -1515* | -1233 | -1995* | -1867* | -1489* | -7442* |
| Total reported earnings ($) | 202 | -756 | -1526* | -1104 | -1918* | -1790 | -1419* | -7092* |
| Incidence of employment (pp) | 9.46*** | 4.87 | -1.57 | -1.23 | -3.74 | -2.23 | 0.66 | N/A |
| EI benefits ($) | -71 | 177* | 116 | 168 | -201 | -15 | 43 | 217 |
| SA benefits ($) | -171 | -238 | -19 | 167 | 203 | 12 | 30 | 152 |
| Dependence on income support (pp) | -2.33 | 1.35 | 3.41* | 4.59** | 1.98 | 2.22 | 2.77* | N/A |
| Indicators | Program start year (0) |
1 year post-program (1) |
2 year post-program (2) |
3 year post-program (3) |
4 year post-program (4) |
5 year post-program (5) |
Annual average post-program (1-5) |
Cumulative in & post-program (0-5) |
|---|---|---|---|---|---|---|---|---|
| Employment income ($) | 738 | -1074 | -2135** | -1920 | -1722 | -1795 | -1729* | -8644* |
| Total reported earnings ($) | 596 | -1034 | -2155** | -1886 | -1765 | -1729 | -1714* | -8566* |
| Incidence of employment (pp) | 12.83*** | 6.95** | -1.51 | -1.47 | -4.09 | -2.97 | 0.2 | N/A |
| EI benefits ($) | -186* | 210* | 196 | 93 | 178 | 113 | 157* | 788* |
| SA benefits ($) | -189 | -158 | 95 | -77 | 134 | -44 | -24 | -119 |
| Dependence on income support (pp) | -4.66*** | 1.13 | 5.15*** | 2.22 | 4.21** | 0.15 | 2.43* | N/A |
| Indicators | Program start year (0) |
1 year post-program (1) |
2 year post-program (2) |
3 year post-program (3) |
4 year post-program (4) |
5 year post-program (5) |
Annual average post-program (1-5) |
Cumulative in & post-program (0-5) |
|---|---|---|---|---|---|---|---|---|
| Employment income ($) | 364 | -81 | -310 | -453 | -384 | 64 | -233 | -1162 |
| Total reported earnings ($) | 237 | -90 | -288 | -379 | -396 | 36 | -224 | -1117 |
| Incidence of employment (pp) | 18.21*** | 9.41*** | 0.9 | 0.65 | -0.1 | 0.8 | 2.41 | N/A |
| EI benefits ($) | -67 | 0 | -15 | -76 | 17 | -5 | -17 | -81 |
| SA benefits ($) | 57 | -68 | 15 | 54 | 176 | 160 | 73 | 369 |
| Dependence on income support (pp) | -2.44* | -0.23 | -0.86 | 0.05 | 2.13 | 1.67 | 0.71 | N/A |
| Indicators | Program start year (0) |
1 year post-program (1) |
2 year post-program (2) |
3 year post-program (3) |
4 year post-program (4) |
5 year post-program (5) |
Annual average post-program (1-5) |
Cumulative in & post-program (0-5) |
|---|---|---|---|---|---|---|---|---|
| Employment income ($) | -564* | -540 | -1529*** | -1180* | -1358* | -1106 | -835 | -4174 |
| Total reported earnings ($) | -630** | -517 | -1451*** | -1105* | -1153* | -903 | -781 | -3903 |
| Incidence of employment (pp) | -2.79 | -5.64*** | -15.99*** | -12.72*** | -1.65 | -8.75*** | -2.51 | N/A |
| EI benefits ($) | -135** | 54 | 188 | 93 | 254** | 126 | 124** | 624** |
| SA benefits ($) | 80 | 136 | -4 | -22 | -41 | 25 | 8 | 41 |
| Dependence on income support (pp) | -0.46 | 1.24 | 0.56 | -0.92 | 0.78 | 0.89 | 0.52 | N/A |
- Significance level ***1% **5% *10%.
- Total Reported Earnings: Reported on T4 Earnings.
- pp : percentage point.
- The cumulative post-program impact and the 5-year annual average post-program impact may not be a simple sum/average of the yearly post-program impact. This is due to the fact that there are individuals with missing values on certain indicators for certain years, and the kernel matching algorithm ignored them when computing the net impact. Researchers have suggested that when computing the impact on multiple outcomes with some missing values, kernel matching should be performed separately for each of the outcomes.
| Indicators | Program start year (0) |
1 year post-program (1) |
2 year post-program (2) |
3 year post-program (3) |
4 year post-program (4) |
5 year post-program (5) |
Annual average post-program (1-5) |
Cumulative in & post-program (0-5) |
|---|---|---|---|---|---|---|---|---|
| Employment income ($) | -364 | -1129*** | -2188*** | -3004*** | -2746*** | -2776*** | -1631*** | -8151*** |
| Total reported earnings ($) | -612** | -1238*** | -2070*** | -2826*** | -2524*** | -2665*** | -1680*** | -8397*** |
| Incidence of employment (pp) | -3.23 | -6.29** | -16.49*** | -17.14*** | -5.73** | -8.04*** | -3.44 | N/A |
| EI benefits ($) | -78 | -11 | -30 | -99 | -285*** | -216* | -118* | -587* |
| SA benefits ($) | -434** | -107 | -10 | 71 | 142 | 149 | 74 | 374 |
| Dependence on income support (pp) | -5.13** | 0.72 | 2.29 | 0.6 | -0.15 | -0.85 | 0.58 | N/A |
| Indicators | Program start year (0) |
1 year post-program (1) |
2 year post-program (2) |
3 year post-program (3) |
4 year post-program (4) |
5 year post-program (5) |
Annual average post-program (1-5) |
Cumulative in & post-program (0-5) |
|---|---|---|---|---|---|---|---|---|
| Employment income ($) | -804** | -1374** | -958 | -1460* | -1506 | -1915** | -1844*** | -9216*** |
| Total reported earnings ($) | -833*** | -1414*** | -929 | -1380** | -1376* | -1826** | -1687*** | -8435** |
| Incidence of employment (pp) | -12.44*** | -6.02** | -12.37*** | -13.42*** | -12.94*** | -15.98*** | -11.31*** | N/A |
| EI benefits ($) | 11 | 62 | 41 | 141 | 84 | 135 | 43 | 218 |
| SA benefits ($) | -176* | -236 | -55 | -1 | 388* | 330 | 111 | 556 |
| Dependence on income support (pp) | -2.75* | -1.3 | 2.6 | 3.18 | 6.94*** | 5.5** | 3.43** | N/A |
| Indicators | Program start year (0) |
1 year post-program (1) |
2 year post-program (2) |
3 year post-program (3) |
4 year post-program (4) |
5 year post-program (5) |
Annual average post-program (1-5) |
Cumulative in & post-program (0-5) |
|---|---|---|---|---|---|---|---|---|
| Employment income ($) | -415 | -174 | -857 | -837 | -1131* | -1223 | -545 | -2724 |
| Total reported earnings ($) | -543* | -174 | -669 | -653 | -921 | -1021 | -490 | -2446 |
| Incidence of employment (pp) | -0.89 | -4.62** | -4.63* | -4.81* | -3.42 | -6.32** | -2.11 | N/A |
| EI benefits ($) | -171*** | -11 | 111 | -99 | -18 | -88 | -21 | -103 |
| SA benefits ($) | -192 | 149 | 43 | 212 | 203 | 328 | 156 | 781 |
| Dependence on income support (pp) | -0.61 | 2.66 | 2.23 | 0.87 | 2.18 | 1.75 | 1.78 | N/A |
| Indicators | Program start year (0) |
1 year post-program (1) |
2 year post-program (2) |
3 year post-program (3) |
4 year post-program (4) |
5 year post-program (5) |
Annual average post-program (1-5) |
Cumulative in & post-program (0-5) |
|---|---|---|---|---|---|---|---|---|
| Employment income ($) | -218 | -1082 | -2328*** | -1259 | -809* | -1342 | -1271 | -6351 |
| Total reported earnings ($) | -362 | -1097 | -2304*** | -1349 | -1497 | -1174 | -1181 | -5902 |
| Incidence of employment (pp) | -0.56 | 1.41 | -1.48 | 1.56 | 5.04 | 4.66 | 5.38* | N/A |
| EI benefits ($) | -257* | -12 | 319 | -28 | 119 | -19 | 125 | 629 |
| SA benefits ($) | 120 | -78 | 49 | 129 | 143 | -58 | 16 | 81 |
| Dependence on income support (pp) | -1.37 | 0.66 | -0.6 | -1.47 | 1.34 | -3.87 | -1.1 | N/A |
| Indicators | Program start year (0) |
1 year post-program (1) |
2 year post-program (2) |
3 year post-program (3) |
4 year post-program (4) |
5 year post-program (5) |
Annual average post-program (1-5) |
Cumulative in & post-program (0-5) |
|---|---|---|---|---|---|---|---|---|
| Employment income ($) | -563 | -812* | -2011*** | -2275*** | -2001*** | -1747*** | -1458** | -7289*** |
| Total reported earnings ($) | -786** | -820* | -1878*** | -2213*** | -1754*** | -1605** | -1403** | -7012*** |
| Incidence of employment (pp) | -8.09*** | -4.73** | -19.12*** | -15.37*** | -5.15** | -6.22** | -2.88 | N/A |
| EI benefits ($) | -54 | 48 | 186* | 52 | 71 | 3 | 27 | 135 |
| SA benefits ($) | -100 | 20 | 93 | 106 | 266 | 256 | 144 | 722 |
| Dependence on income support (pp) | -0.56 | 2.38 | 2.99* | 2.56 | 3.73* | 1.43 | 2.57* | N/A |
| Indicators | Program start year (0) |
1 year post-program (1) |
2 year post-program (2) |
3 year post-program (3) |
4 year post-program (4) |
5 year post-program (5) |
Annual average post-program (1-5) |
Cumulative in & post-program (0-5) |
|---|---|---|---|---|---|---|---|---|
| Employment income ($) | -679 | -304 | 3 | -51 | 119 | 90 | 321 | 1606 |
| Total reported earnings ($) | -703* | -306 | 62 | 91 | 427 | 387 | 443 | 2216 |
| Incidence of employment (pp) | 5.91 | -1.46 | -6.25** | -9.1*** | 1.2 | -7.19** | 0.75 | N/A |
| EI benefits ($) | -155** | 77 | -57 | 36 | 45 | 190 | 33 | 169 |
| SA benefits ($) | -20 | -104 | -561** | -376 | -460 | -277 | -372* | -1856* |
| Dependence on income support (pp) | -1.05 | -1.8 | -3.56* | -3.97* | -3.22 | 0.71 | -2.35 | N/A |
| Indicators | Program start year (0) |
1 year post-program (1) |
2 year post-program (2) |
3 year post-program (3) |
4 year post-program (4) |
5 year post-program (5) |
Annual average post-program (1-5) |
Cumulative in & post-program (0-5) |
|---|---|---|---|---|---|---|---|---|
| Employment income ($) | -945* | -1429*** | -1808*** | -2441*** | -2780*** | -2378*** | -2134*** | -10668*** |
| Total reported earnings ($) | -1298*** | -1470*** | -1653*** | -2282*** | -2430*** | -2132*** | -1934*** | -9669*** |
| Incidence of employment (pp) | -4.73 | -5.79* | -6.3*** | -3.71 | -4.32 | -4.31 | -3.4 | N/A |
| EI benefits ($) | -86 | 33 | -143 | -58 | 35 | -47 | -41 | -201 |
| SA benefits ($) | -268* | -25 | -65 | -53 | 179 | 248 | 57 | 289 |
| Dependence on income support (pp) | -3.54* | 0.59 | -0.14 | -1.69 | 0.25 | 0.64 | -0.05 | N/A |