Canada Disability Savings Program: 2022 Key Statistics
From: Employment and Social Development Canada
On this page
Alternate formats
Large print, braille, MP3 (audio), e-text and DAISY formats are available on demand by ordering online or calling 1 800 O-Canada (1-800-622-6232). If you use a teletypewriter (TTY), call 1-800-926-9105.
List of abbreviations
- CDSP
- Canada Disability Savings Program
- RDSP
- Registered Disability Savings Plan
- CDSB
- Canada Disability Savings Bond
- CDSG
- Canada Disability Savings Grant
- DTC
- Disability Tax Credit
List of figures
- Figure 1: RDSP take-up rate by geography and age groups, 2022
- Figure 2: RDSP take-up rate by geography and gender, 2022
- Figure 3: Number (in thousands) of RDSP beneficiaries by gender, December 2022
- Figure 4: Number (in thousands) and percentage (%) of RDSP beneficiaries by age groups, December 2022
- Figure 5: Number (in thousands) of RDSP beneficiaries by geography, December 2022
Introduction
The Canada Disability Savings Program (CDSP) comprises the Registered Disability Savings Plan (RDSP), the Canada Disability Savings Bond (CDSB), and the Canada Disability Savings Grant (CDSG). The program supports persons with disabilities approved for the Disability Tax Credit (DTC) to save for the future.
Limited program results including the take-up rate and beneficiary numbers have been made available on an annual basis. However, detailed CDSP statistics have not been published since the 2017 statistical review. The current report presents a summary of the 2022 CDSP annual statisticsFootnote 1. These include the RDSP take-up rates, the number of RDSP beneficiaries, and the values of CDSB, CDSG, contributions, and total assets. This overview also provides the national RDSP take-up rate of the past ten years. Starting in 2024, the program will release comprehensive CDSP statistics on an annual basis, sharing reports and open data for the preceding calendar years, including retroactive information.
1. RDSP take-up rate
The RDSP take-up rate is a percentage of DTC-approved individuals, aged 0-49, that have an RDSP as of the end of the year. As of December 31, 2022, the national RDSP take-up rate was 36.3%. Table 1, Figure 1, and Figure 2 provide information on the 2022 RDSP take-up rate by geography, by age groups, and by gender. Table 2 includes the reported national RDSP take-up rates of the past ten years.Footnote 2
| Geography | Take-up rate (%) |
|---|---|
| Canada | 36.3 |
| Newfoundland and Labrador | 25.7 |
| Prince Edward Island | 32.0 |
| Nova Scotia | 28.3 |
| New Brunswick | 24.0 |
| Quebec | 35.6 |
| Ontario | 37.2 |
| Manitoba | 33.2 |
| Saskatchewan | 34.0 |
| Alberta | 35.4 |
| British Columbia | 42.7 |
| Yukon | 28.4 |
| Northwest Territories | 21.0 |
| Nunavut | 8.1 |
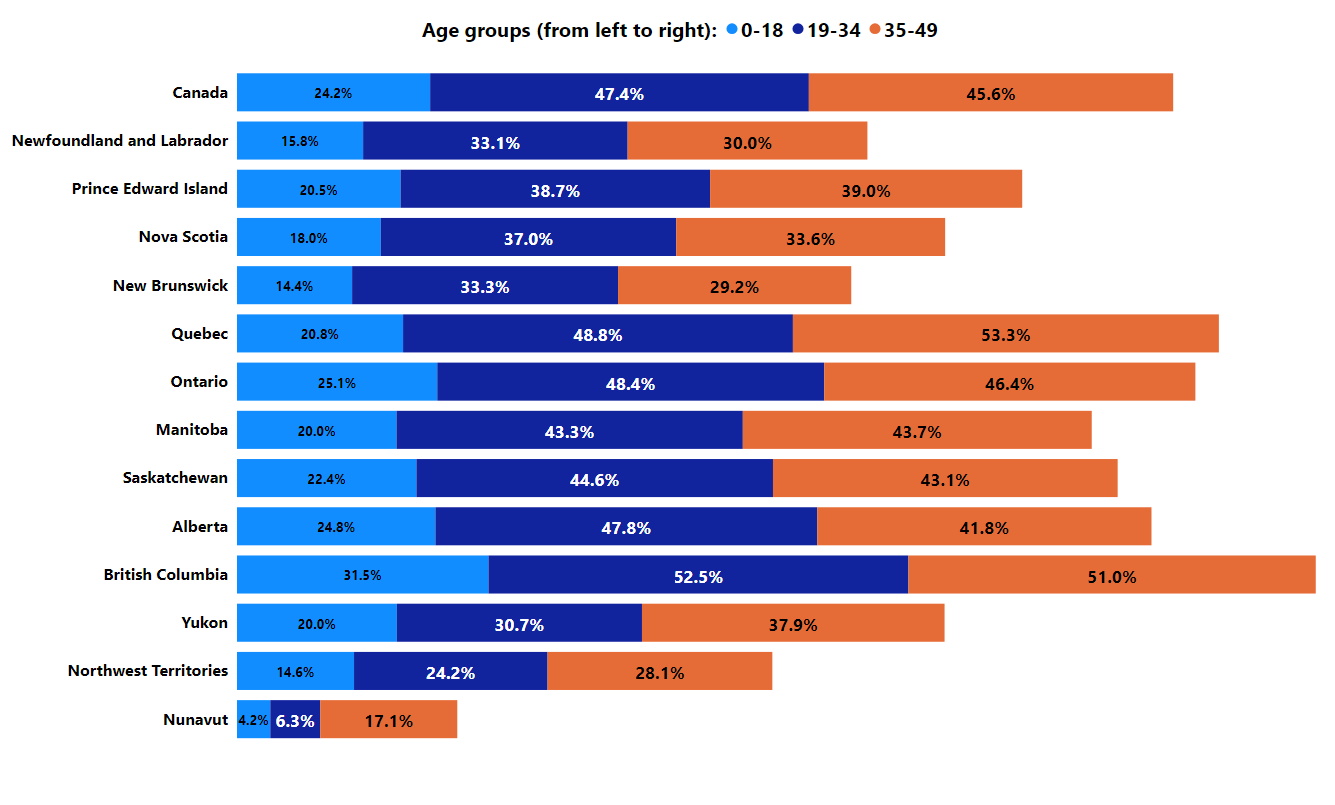
Text description - Figure 1
| Geography | 2022 RDSP take-up rate (%) of ages 0 to 18 years | 2022 RDSP take-up rate (%) of ages 19 to 34 years | 2022 RDSP take-up rate (%) of ages 35 to 49 years |
|---|---|---|---|
| Canada | 24.2 | 47.4 | 45.6 |
| Newfoundland and Labrador | 15.8 | 33.1 | 30.0 |
| Prince Edward Island | 20.5 | 38.7 | 39.0 |
| Nova Scotia | 18.0 | 37.0 | 33.6 |
| New Brunswick | 14.4 | 33.3 | 29.2 |
| Quebec | 20.8 | 48.8 | 53.3 |
| Ontario | 25.1 | 48.4 | 46.4 |
| Manitoba | 20.0 | 43.3 | 43.7 |
| Saskatchewan | 22.4 | 44.6 | 43.1 |
| Alberta | 24.8 | 47.8 | 41.8 |
| British Columbia | 31.5 | 52.5 | 51.0 |
| Yukon | 20.0 | 30.7 | 37.9 |
| Northwest Territories | 14.6 | 24.2 | 28.1 |
| Nunavut | 4.2 | 6.3 | 17.1 |
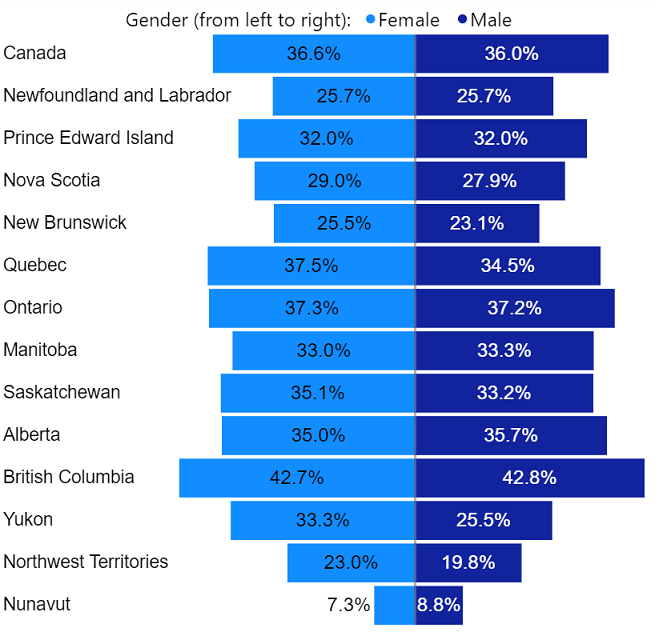
Text description - Figure 2
| Geography | 2022 RDSP take-up rate (%) of female | 2022 RDSP take-up rate (%) of male |
|---|---|---|
| Canada | 36.6 | 36.0 |
| Newfoundland and Labrador | 25.7 | 25.7 |
| Prince Edward Island | 32.0 | 32.0 |
| Nova Scotia | 29.0 | 27.9 |
| New Brunswick | 25.5 | 23.1 |
| Quebec | 37.5 | 34.5 |
| Ontario | 37.3 | 37.2 |
| Manitoba | 33.0 | 33.3 |
| Saskatchewan | 35.1 | 33.2 |
| Alberta | 35.0 | 35.7 |
| British Columbia | 42.7 | 42.8 |
| Yukon | 33.3 | 25.5 |
| Northwest Territories | 23.0 | 19.8 |
| Nunavut | 7.3 | 8.8 |
| Year | 2013 | 2014 | 2015 | 2016 | 2017 | 2018 | 2019 | 2020 | 2021 | 2022 |
|---|---|---|---|---|---|---|---|---|---|---|
| RDSP take-up rate (%) | 16.4 | 22.1 | 24.3 | 29.0 | 31.2 | 33.7 | 34.7 | 35.1 | 36.7 | 36.3 |
2. Number of RDSP beneficiaries
| Description | Persons (in thousands) |
|---|---|
| Cumulative number of RDSP beneficiaries | 280.8 |
| Number of beneficiaries with active RDSPs as of December 31, 2022 | 262.7 |
| Number of new RDSP beneficiaries registered in 2022 | 22.4 |
2.1 Cumulative number of RDSP beneficiaries
This number is the distinct count of persons with disabilities who have had an RDSP some time between the start of the program in 2008 and December 31, 2022. This includes individuals who had an RDSP before but closed later, as well as individuals who have an RDSP that remains open. These individuals are counted once in the cumulative number of RDSP beneficiaries. As of December 31, 2022, 280,803 persons with disabilities have had an RDSP since the start of the program.
2.2 Number of beneficiaries with active RDSPs as of December 31, 2022
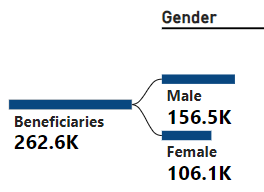
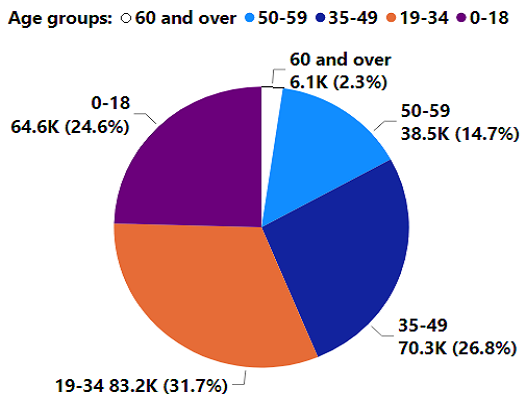
This number is the distinct count of persons with disabilities who have an RDSP that remains open on December 31, 2022. This number was 262,722. Figures 3 to 5 show the characteristics of these beneficiaries by gender (figure 3), age groups (figure 4) and geography (figure 5), as of December 31, 2022.
- Note: K represents 1,000.
Text description - Figure 3
| Gender | Number of RDSP beneficiaries as of December 31, 2022 (in thousands) |
|---|---|
| Male | 156.6 |
| Female | 106.1 |
| Total | 262.7 |
- Note: K represents 1,000. Totals may not add up due to rounding.
Text description - Figure 4
| Age groups | Number of RDSP beneficiaries (in thousands) | Proportion of RDSP beneficiaries (%) |
|---|---|---|
| 60 and over | 6.1 | 2.3 |
| 50 to 59 | 38.5 | 14.7 |
| 35 to 49 | 70.3 | 26.8 |
| 19 to 34 | 83.2 | 31.7 |
| 0 to 18 | 64.6 | 24.6 |
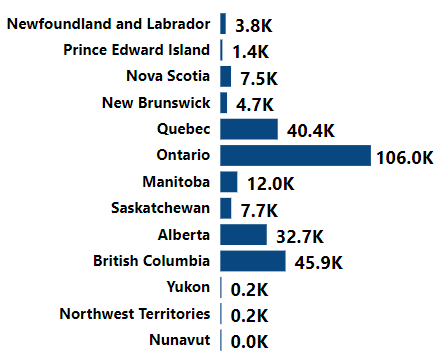
- Note: K represents 1,000.
Text description - Figure 5
| Geography | Number of RDSP beneficiaries (in thousands) |
|---|---|
| Newfoundland and Labrador | 3.8 |
| Prince Edward Island | 1.4 |
| Nova Scotia | 7.5 |
| New Brunswick | 4.7 |
| Quebec | 40.4 |
| Ontario | 106.0 |
| Manitoba | 12.0 |
| Saskatchewan | 7.7 |
| Alberta | 32.7 |
| British Columbia | 45.9 |
| Yukon | 0.2 |
| Northwest Territories | 0.2 |
| Nunavut | 0.0 |
2.3 Number of new RDSP beneficiaries registered in 2022
This number is the distinct count of persons with disabilities who have an RDSP newly registered during 2022. This number does not include existing beneficiaries with RDSPs opened as a result of transferring their plans between financial organizations. During the 2022 calendar year, 22.4 thousand new RDSPs were registered for beneficiaries.
3. CDSP financial summary
| Description | Amount ($ billions) |
|---|---|
| Cumulative total amount of CDSB issued | $1.7 |
| Cumulative total amount of CDSG issued | $4.0 |
| Cumulative total amount of contributions | $2.6 |
| Total RDSP assets | $8.8 |
3.1 Cumulative total amount of CDSB issued
Since the start of the program in December 2008, to December 31, 2022, the Government of Canada has issued a total of $1.7 billion of CDSB to the RDSPs of beneficiaries. This total has not been adjusted with amounts repaid.
3.2 Cumulative total amount of CDSG issued
Since the start of the program in December 2008, to December 31, 2022, the Government of Canada has issued a total of $4.0 billion of CDSG to the RDSPs of beneficiaries. This total has not been adjusted with amounts repaid.
3.3 Cumulative total amount of contributions
Since the start of the program in December 2008, to December 31, 2022, individuals have contributed a total of $2.6 billion to the RDSPs.
3.4 Total RDSP assets
RDSP assets include all private contributions, CDSB, CDSG, and earnings, less any fees and withdrawals. As of December 31, 2022, the fair market value of all active RDSPs totalled $8.8 billion.
