
2011 FDR - Section 1: Defining seniors with disabilities
Age groups of seniors
Generally, in Canada, people are considered seniors when they reach 65 years of age.
Age 65 and over
In Canada, the age of 65 is the most common benchmark for retirement. When people turn 65, they can access senior-specific income supports such as Old Age Security and the Guaranteed Income Supplement. At 65, many people who were receiving disability-specific income supports move from disability programs into senior-specific income support programs.
Three age subgroups
It is useful to subdivide seniors into subgroups to understand the differences between younger and older seniors. Seniors aged 65 to 74 have different health experiences, different interests and different lifestyles than those aged 75 to 84. Even larger differences are found when comparing younger seniors with those aged 85 and over.
Age 55 to 64
In addition to seniors, this report looks at adults aged 55 to 64 to help paint a picture of what happens when people are on the way to becoming seniors. Including these older adults allows comparisons to be drawn with seniors.
Data in this section come from the 2006 Participation and Activity Limitation Survey (PALS).
Definition of disability
The definition of disability from surveys used in this report is based on the World Health Organization’s framework of disability provided by the International Classification of Functioning (ICF). This framework defines disability as impairment, activity limitation or participation restriction that is the result of the interaction between contextual factors (personal and environmental) and health conditions. The ICF is a multi-dimensional classification that takes into account both the medical and social model of disability.
Perception plays a role
Beliefs or attitudes about disability vary depending on age, culture, location and many other factors. In general, no two individuals experience the same disability in the same way. In fact, the same individual may well experience a disability differently if it were to occur at different times during his or her life. Another factor to keep in mind is that some seniors may not feel that they have disabilities, but may instead consider problems to be a natural part of aging.
Number of seniors with disabilities
Of all seniors in Canada, about 43 percent have disabilities.
In 2006, nearly 31 million people lived in Canada. Of these, approximately 4.4 million (or 14 percent) reported having a disability.
The senior population of Canada consists of approximately 4.05 million people; 1.76 million of whom have a disability. Disability is more prevalent among seniors than any other age group. For example, the disability rate for seniors is 43 percent, nearly double what it is for the 55 to 64 age group (23 percent). Overall, the disability rates are higher for senior women than for senior men (45 percent versus 41 percent respectively).
Figure 1.1 shows that seniors make up 13 percent of the Canadian population. Almost half have a disability. In other words, 6 percent of all Canadians are seniors with disabilities.
Figure 1.1 Proportion of seniors with disabilities in Canada (%), 2006

Figure 1.1 Text Description
Figure 1.1 depicts two pie graphs. Data presented in these pie graphs are from the 2006 Participation and Activity Limitation Survey. The pie graph on the left represents the total population of Canada, and the pie graph on the right represents the population of seniors with disabilities.
For the left pie graph titled Population of Canada, there are four sections. The largest section, children and working age adults without disabilities, accounts for 78 percent of the population of Canada. Children and working-age adults with disabilities account for 9 percent of the population. Seniors without disabilities accounts for 7 percent and seniors with disabilities accounts for 6 percent of the total population.
For the right pie graph titled Seniors with Disabilities, there are two sections broken down by gender. 58 percent of seniors with disabilities are women, compared to 42 percent that are men.
Source: 2006 Participation and Activity Limitation Survey
People are more likely to have disabilities as they get older. Figure 1.2 shows the increase in the disability rate as people age. The disability rate triples from 23 percent among individuals age 55 to 64 to 73 percent among individuals age 85 and older.
Figure 1.2 Disability rates, by age group (%), 2006
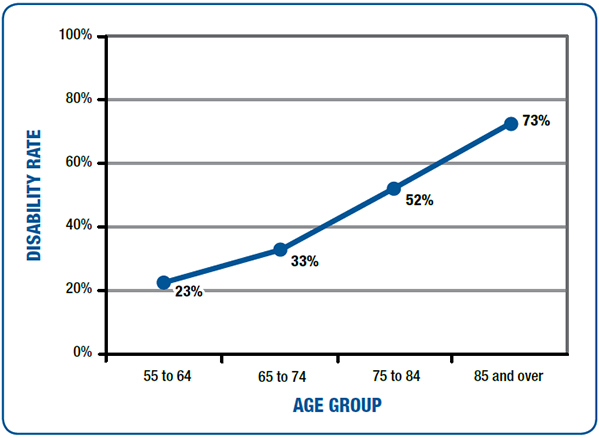
Figure 1.2 Text Description
This line graph presents data from the 2006 Participation and Activity Limitation Survey. It illustrates the disability rates by age group by percentage.
This line graph is divided into four sections, each section representing an age category. The vertical axis lists the disability rate. On the horizontal axis from left to right are the following age group categories:
- 55 to 64
- 65 to 74
- 75 to 84
- 85 and over
The vertical axis is measured in percentages and increases in increments of 20 from 0 to 100.
In the 55 to 64 age group the disability rate is 23 percent.
In the 65 to 74 age group the disability rate is 33 percent.
In the 75 to 84 age group the disability rate is 52 percent.
In the 85 and over age group the disability rate is 73 percent.
Source: 2006 Participation and Activity Limitation Survey
The disability rate among Canadian Aboriginal people is higher than the overall disability rate. Regardless of age, Aboriginal Canadians are more likely to have disabilities than Canadians who are not Aboriginal. Among Aboriginal seniors, 49 percent have disabilities, compared to 43 percent of non-Aboriginal seniors.
Types of disabilities
The most common disabilities experienced by seniors include mobility, agility and pain disabilities.
Seniors experience a wide range of disabilities. To illustrate this, the table below describes the different types of disabilities seniors may have and what someone with each disability may experience in daily life.
| Disability type | Description | Information |
|---|---|---|
| Mobility disability |
|
|
| Agility disability |
|
|
| Pain disability |
|
|
| Hearing disability |
|
|
| Seeing disability |
|
|
| Memory disability |
|
|
| Communication disability |
|
|
| Learning disability |
|
|
| Emotional disability |
|
|
Table Text Description
This table describe the type of disability (in rows) with description and information (in two separate columns).
The columns provide description and information on types of disabilities.
The rows describe the different types of disabilities.
For mobility disabilities
- A person with a mobility disability might have difficulty walking up and down a flight of stairs, standing in one spot for 20 minutes or moving from one room to another.
- Mobility disabilities are the most common disability type among seniors, and are more likely to be experienced by women than men.
For agility disabilities
- A person with an agility disability might have difficulty bending down, dressing or undressing, getting in and out of bed or grasping small objects.
- Agility disabilities are the second most common type of disability among seniors, and are more common in women than in men.
For pain disabilities
- A person with a pain disability might have constant pain or recurring periods of pain resulting in a notable reduction in the amount or kind of activities someone can do.
- Pain disabilities are the third most common type of disability among seniors, and are more common in women then in men.
For hearing disabilities
- A person with a hearing disability often has a hard time hearing when trying to talk with other people or talk on the telephone.
- With age, hearing disabilities become more and more common: almost half of seniors aged 85 and over have a hearing disability. Hearing disabilities are more common among men.
For seeing disabilities
- A person with a seeing disability might have a hard time seeing the face of someone across the room even when wearing glasses.
- With age, seniors are much more likely to develop a seeing disability. Seeing disabilities are slightly more common among women.
For memory disabilities
- A person with a memory disability has a hard time doing daily activities because they get confused or forget things.
- With age, memory disabilities become increasingly common.
For communication disabilities
- A person with a communication disability often has a hard time getting other people to understand what they are saying.
- Most seniors who have a communication disability also have other types of disabilities, such as memory and mobility.
For learning disabilities
- A person with a learning disability has a hard time learning new things and may have been diagnosed with conditions such as ADHD or dyslexia.
- Among seniors, learning disabilities are not as common as other disabilities. However, seniors aged 85 and over do have higher rates of learning disabilities. Rates are equal among men and women.
For emotional disabilities
- A person with an emotional disability might find it hard to do daily activities because of problems with their mind such as depression or anxiety.
- While seniors generally have higher rates of most types of disabilities, seniors who live independently in their communities are less likely to have emotional disabilities, in comparison to younger adults.
Mobility disabilities are experienced by 17 percent of older Canadians. This statistic increases to 24 percent of seniors aged 65 to 74, and then jumps to 41 percent of seniors aged 75 to 84, and 61 percent of seniors aged 85 and over. This means that for people aged 55 to 64, less than two in ten have mobility disabilities. By the time they are over age 85, six in ten will have mobility disabilities.
Figure 1.3 shows the percentage of older Canadians and seniors who have each type of disability. The likelihood of developing a disability increases with age for almost every type of disability but does so at different rates. For example, while pain disabilities are the third most common type for seniors aged 65 to 74 and seniors aged 75 to 84, at age 85, hearing disabilities become more common than pain disabilities.
| Type of disability | Age group | |||
|---|---|---|---|---|
| 55 to 64 | 65 to 74 | 75 to 84 | 85 and over | |
| Mobility | 17 | 24 | 41 | 61 |
| Agility | 16 | 23 | 38 | 57 |
| Pain | 17 | 23 | 33 | 42 |
| Hearing | 6 | 12 | 21 | 44 |
| Seeing | 4 | 6 | 11 | 25 |
| Memory | 2 | 3 | 5 | 13 |
| Communication | 2 | 2 | 4 | 10 |
| Learning | 3 | 2 | 2 | 6 |
| Emotional | 3 | 2 | 2 | 2 |
Figure 1.3 Text Description
This table presents data from the 2006 Participation and Activity Limitation Survey. It presents the frequency for type of disability (in rows) by age group (in columns) by percentage.
The columns are divided into the following age group sections from left to right:
- 55 to 64
- 65 to 74
- 75 to 84
- 85 and over
The rows describe the type of disabilities.
For the 55 to 64 age group
- 17 percent of the 55 to 64 age group had a mobility disability.
- 16 percent of the 55 to 64 age group had an agility disability.
- 17 percent of the 55 to 64 age group had a pain disability.
- 6 percent of the 55 to 64 age group had a hearing disability.
- 4 percent of the 55 to 64 age group had a seeing disability.
- 2 percent of the 55 to 64 age group had a memory disability.
- 2 percent of the 55 to 64 age group had a communication disability.
- 3 percent of the 55 to 64 age group had a learning disability.
- 3 percent of the 55 to 64 age group had an emotional disability.
For the 65 to 74 age group
- 24 percent of the 55 to 64 age group had a mobility disability.
- 23 percent of the 55 to 64 age group had an agility disability.
- 23 percent of the 55 to 64 age group had a pain disability.
- 12 percent of the 55 to 64 age group had a hearing disability.
- 6 percent of the 55 to 64 age group had a seeing disability.
- 3 percent of the 55 to 64 age group had a memory disability.
- 2 percent of the 55 to 64 age group had a communication disability.
- 2 percent of the 55 to 64 age group had a learning disability.
- 2 percent of the 55 to 64 age group had an emotional disability.
For the 75 to 84 age group
- 41 percent of the 55 to 64 age group had a mobility disability.
- 38 percent of the 55 to 64 age group had an agility disability.
- 33 percent of the 55 to 64 age group had a pain disability.
- 21 percent of the 55 to 64 age group had a hearing disability.
- 11 percent of the 55 to 64 age group had a seeing disability.
- 5 percent of the 55 to 64 age group had a memory disability.
- 4 percent of the 55 to 64 age group had a communication disability.
- 2 percent of the 55 to 64 age group had a learning disability.
- 2 percent of the 55 to 64 age group had an emotional disability.
For the 85 and over age group
- 61 percent of the 55 to 64 age group had a mobility disability.
- 57 percent of the 55 to 64 age group had an agility disability.
- 42 percent of the 55 to 64 age group had a pain disability.
- 44 percent of the 55 to 64 age group had a hearing disability.
- 25 percent of the 55 to 64 age group had a seeing disability.
- 13 percent of the 55 to 64 age group had a memory disability.
- 10 percent of the 55 to 64 age group had a communication disability.
- 6 percent of the 55 to 64 age group had a learning disability.
- 2 percent of the 55 to 64 age group had an emotional disability.
Source: 2006 Participation and Activity Limitation Survey
Figure 1.4 shows mobility and agility disabilities are the most common disabilities experienced by seniors followed by pain and hearing.
Figure 1.4 Frequency of type of disability among seniors (%), 2006
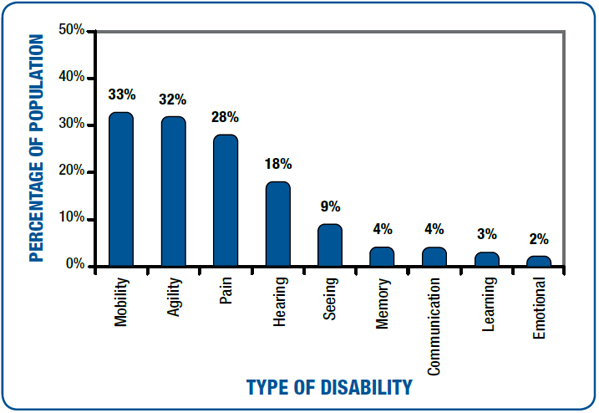
Figure 1.4 Text Description
This vertical bar graph presents data from the 2006 Participation and Activity Limitation Survey. It illustrates the frequency of type of disability for seniors by percentage.
The horizontal axis lists the type of disability. On the axis from left to right are the following disabilities:
- Mobility
- Agility
- Pain
- Hearing
- Seeing
- Memory
- Communication
- Learning
- Emotional
The vertical axis is measured by percentages and increases in increments of 10 from 0 to 50
- 33 percent of seniors have mobility disabilities.
- 32 percent of seniors have agility disabilities.
- 28 percent of seniors have pain disabilities.
- 18 percent of seniors have hearing disabilities.
- 9 percent of seniors have seeing disabilities.
- 4 percent of seniors have memory disabilities.
- 4 percent of seniors have communication disabilities.
- 3 percent of seniors have learning disabilities.
- 2 percent of seniors have emotional disabilities.
Source: 2006 Participation and Activity Limitation Survey
Multiple disabilities
Seniors are more likely to have multiple disabilities as they get older.
Most people in Canada who have disabilities have more than one type of disability. This is also true for seniors with disabilities. Among seniors with disabilities, less than two in ten have only one disability; the remaining eight in ten have two or more disabilities. Multiple disabilities can be caused by a common condition. For example, a person who has arthritis might develop pain, mobility and agility disabilities as a result.
Figure 1.5 shows that many seniors develop multiple disabilities as they grow older. For seniors with disabilities aged 75 to 84, 82 percent have two or more disabilities. This increases to 91 percent or nine in ten for seniors aged 85 and over. Seniors aged 85 and over are more than twice as likely to have five or more disabilities when compared with younger seniors.
| Number of disabilities | Age group | |||
|---|---|---|---|---|
| 55 to 64 | 65 to 74 | 75 to 84 | 85 and over | |
| 1 | 17 | 18 | 18 | 9 |
| 2 | 15 | 18 | 17 | 18 |
| 3 | 31 | 32 | 28 | 21 |
| 4 | 20 | 18 | 23 | 24 |
| 5 and more | 17 | 13 | 14 | 28 |
Figure 1.5 Text Description
This table presents data from the 2006 Participation and Activity Limitation Survey. It presents the number of disabilities (in rows) by age group (in columns) by percentage.
The columns are divided into the following age group sections from left to right:
- 55 to 64
- 65 to 74
- 75 to 84
- 85 and over
The rows describe the number of disabilities.
For the 55 to 64 age group
- 17 percent of the 55 to 64 age group had one disability.
- 15 percent of the 55 to 64 age group had two disabilities.
- 31 percent of the 55 to 64 age group had three disabilities.
- 20 percent of the 55 to 64 age group had four disabilities.
- 17 percent of the 55 to 64 age group had five or more disabilities.
For the 65 to 74 age group
- 18 percent of the 65 to 74 age group had one disability.
- 18 percent of the 65 to 74 age group had two disabilities.
- 32 percent of the 65 to 74 age group had three disabilities.
- 18 percent of the 65 to 74 age group had four disabilities.
- 13 percent of the 65 to 74 age group had five or more disabilities.
For the 75 to 84 age group
- 18 percent of the 75 to 84 age group had one disability.
- 17 percent of the 75 to 84 age group had two disabilities.
- 28 percent of the 75 to 84 age group had three disabilities.
- 23 percent of the 75 to 84 age group had four disabilities.
- 14 percent of the 75 to 84 age group had five or more disabilities.
For the 85 and over age group
- 9 percent of the 85 and over age group had one disability.
- 18 percent of the 85 and over age group had two disabilities.
- 21 percent of the 85 and over age group had three disabilities.
- 24 percent of the 85 and over age group had four disabilities.
- 28 percent of the 85 and over age group had five or more disabilities.
Source: 2006 Participation and Activity Limitation Survey
Figure 1.6 illustrates the percentage of seniors with one to five or more disabilities. Seniors are most likely to have 3 disabilities (29 percent).
Figure 1.6 Number of disabilities for seniors (%), 2006

Figure 1.6 Text Description
This vertical bar graph presents data from the 2006 Participation and Activity Limitation Survey. It illustrates the number of disabilities for seniors by percentage.
The horizontal axis lists the number of disabilities. On the axis from left to right are the following disabilities:
- 1 disability
- 2 disabilities
- 3 disabilities
- 4 disabilities
- 5 and more disabilities
The vertical axis is measured by percentages and increases in increments of 10 from 0 to 50
- 17 percent of seniors with disabilities had one disability.
- 18 percent of seniors with disabilities had two disabilities.
- 29 percent of seniors with disabilities had three disabilities.
- 21 percent of seniors with disabilities had four disabilities.
- 16 percent of seniors with disabilities had five or more disabilities.
Source: 2006 Participation and Activity Limitation Survey
Severity of disabilities
Seniors often develop more severe disabilities as they age.
Severity is a term that is used to discuss how serious people’s disabilities are, or to what extent they are able to do everyday tasks. Some seniors experience mild disabilities while others experience more severe disabilities.
The severity of a disability plays a large role in how it affects people’s lives. For example, one senior with a mobility disability might use a wheelchair to move around, while another might use a cane.
Disability severity can be closely related to the number of disabilities a senior has. As seniors develop more than one type of disability, they are more likely to experience more limitations in everyday life, or increased disability severity.
Figure 1.7 shows that with age, people are more likely to have more severe disabilities. Older adults and seniors have similar disability experiences with respect to severity. Their rates of mild, moderate and more severe disabilities do not change very much. However, age 85 is a turning point for seniors: Seniors aged 85 and over are much more likely to have more severe disabilities.
| Disability severity | Age group | |||
|---|---|---|---|---|
| 55 to 64 | 65 to 74 | 75 to 84 | 85 and over | |
| Mild | 33 | 41 | 36 | 25 |
| Moderate | 25 | 25 | 25 | 17 |
| Severe to very severe | 42 | 34 | 39 | 58 |
Figure 1.7 Text Description
This table presents data from the 2006 Participation and Activity Limitation Survey. It presents the disability severity (in rows) by age group (in columns) by percentage.
The columns are divided into the following age group sections from left to right:
- 55 to 64
- 65 to 74
- 75 to 84
- 85 and over
The rows describe the disability severity.
For the 55 to 64 age group
- 33 percent of the 55 to 64 age group had a mild disability.
- 25 percent of the 55 to 64 age group had a moderate disability.
- 42 percent of the 55 to 64 age group had a severe or very severe disability.
For the 65 to 74 age group
- 41 percent of the 65 to 74 age group had a mild disability.
- 25 percent of the 65 to 74 age group had a moderate disability.
- 34 percent of the 65 to 74 age group had a severe or very severe disability.
For the 75 to 84 age group
- 36 percent of the 75 to 84 age group had a mild disability.
- 25 percent of the 75 to 84 age group had a moderate disability.
- 39 percent of the 75 to 84 age group had a severe or very severe disability.
For the 85 and over age group
- 25 percent of the 85 and over age group had a mild disability.
- 17 percent of the 85 and over age group had a moderate disability.
- 58 percent of the 85 and over age group had a severe or very severe disability.
Source: 2006 Participation and Activity Limitation Survey
Figure 1.8 shows seniors are most likely to have a severe to very severe disability (40 percent).
Figure 1.8 Disability severity among seniors (%), 2006

Figure 1.8 Text Description
This vertical bar graph presents data from the 2006 Participation and Activity Limitation Survey. It illustrates the disability severity among seniors by percentage.
The horizontal axis lists the severity of disability. On the axis from left to right are the following severities:
- Mild
- Moderate
- Severe to very severe
The vertical axis is measured by percentages and increases in increments of 10 from 0 to 50:
- 36 percent of seniors with disabilities have mild disabilities.
- 24 percent of seniors with disabilities have moderate disabilities.
- 40 percent of seniors with disabilities have severe to very severe disabilities.
Source: 2006 Participation and Activity Limitation Survey
Projected population of seniors with disabilities in Canada
By the year 2036, it is expected that there will be between 4.6 million and 5.1 million seniors with disabilities in Canada.
In 2006, there were 1.8 million seniors with disabilities in Canada. Based on what is known about Canadians with disabilities, and what is known about seniors with disabilities, the population of seniors with disabilities will likely increase to somewhere between 4.6 million and 5.1 million by 2036. Figure 1.9 shows that the population of seniors with disabilities in Canada is expected to more than double over the next 25 years, while the overall population of people with disabilities will increase at a slower rate.
| Population | 2006 | 2036 |
|---|---|---|
| Number of people in Canada | 30.9 | 43.8 |
| Number of people with disabilities | 4.4 | 7.7 - 8.7 |
| Number of seniors | 4.0 | 9.9 - 10.9 |
| Number of seniors with disabilities | 1.8 | 4.6 - 5.1 |
Figure 1.9 Text Description
This table presents data from the 2006 Participation and Activity Limitation Survey and Population Projections for Canada, Provinces and Territories, 2009 to 2036. It presents population estimates (in rows) by years (in columns) in millions.
The columns are divided into two years from left to right:
- 2006
- 2036
The rows are divided into four rows:
- Number of people in Canada
- Number of people with disabilities
- Number of seniors
- Number of seniors with disabilities
The rows describe the population estimates for Canada.
For the year 2006
- The number of people in Canada was 30.9 million.
- The number of people with disabilities was 4.4 million.
- The number of seniors was 4.0 million.
- The number of seniors with disabilities was 1.8 million.
For the year 2036
- The number of people in Canada is estimated to be 43.8 million.
- The number of people with disabilities is estimated to be between 7.7 – 8.7 million.
- The number of seniors is estimated to be between 9.9 – 10.9 million.
- The number of seniors with disabilities is estimated to be between 4.6 – 5.1 million.
Source: 2006 Participation and Activity Limitation Survey and Population Projections for Canada, Provinces and Territories, 2009 to 2036
It is likely that the number of people with disabilities in Canada will grow from 4.4 million in 2006 to between 7.7 and 8.7 million in 2036, assuming that disability rates by age and gender do not suddenly change. Seniors with disabilities will make up most of this growth.
Spotlight on Government of Canada Programs:
New Horizons for Seniors Program
The Government of Canada’s New Horizons for Seniors Program helps improve the quality of life for seniors and their communities.
Projects are aimed at enabling seniors to share their knowledge, wisdom and experiences with others, improving facilities for seniors' programs and activities, and raising awareness of elder abuse.
For more information, visit www.hrsdc.gc.ca/eng/seniors/funding/index.shtml.
Spotlight on the Preserving the French Language Literacy Project
Many of Yellowknife’s Francophone residents are retiring and returning south, taking with them their stories and experiences. To prevent the erosion of language, culture and heritage, the Fédération franco-ténoise organized a series of hugely successful literacy events that reached out to the Francophone community’s senior population.
"There is a lot of mobility here; we had to find a way to preserve our history because these are the people who have stories to tell, who know how French Canadians used to live 50 years ago. They are the timekeepers,
" explained Dorice Pinet, the project organizer.
A number of reading and writing activities focused on preserving the seniors’ memories of days gone by in the Northwest Territories and on keeping the French language alive. Classes on writing newspaper stories and learning computer and Internet skills allowed Francophone seniors to enter the world of information technology. An evening dinner theatre with Manitoba storyteller and musician Gérald Laroche, along with Sunday teas, gave seniors a chance to restore their sense of community and share their experiences and needs.
"These activities made me realize that, even at an advanced age, we can still do interesting and rewarding things. Sharing with others, having a sense of humour and our health allow us to enjoy life more. The warmth of the people in the North is contagious. Thanks to the activities organized by the Fédération, I feel less isolated and have made many friends in this lovely part of the country,
" said participant Pierrette Lévesque.
For more information, visit www.hrsdc.gc.ca/eng/seniors/stories/index.shtml.