
2011 FDR - Section 2: Health
Disability and health are closely related. In the past, disability was believed to result directly from health problems. Now, disability is thought of differently—disability results from personal conditions and environmental factors that combine to make everyday life challenging.
Good health facilitates participation in many areas of everyday life. Continuing employment, the ability to travel and participating in civic activities, such as volunteering, are all dependent on good health. In this sense, understanding the challenges for full participation in all areas of everyday life for seniors with disabilities requires an understanding of issues related to health.
Data in this section come from the 2009 Canadian Community Health Survey (CCHS).
General health profile
With age, there is a gradual decline in health.
Regardless of disability status, all seniors are less likely to report good health as they age. However, seniors with disabilities are consistently much less likely to report good health than seniors without disabilities. Almost 40 percent of seniors with disabilities aged 65 to 74 and 50 percent of seniors with disabilities aged 75 and over report their general health as being either fair or poor.
Seniors with disabilities report that their health is getting worse over time. Three in ten seniors (33 percent) who have disabilities report that their health was worse in 2009 than in 2008. In comparison, only one in ten seniors without disabilities (11 percent) report their health as worse.
Older seniors with disabilities are more likely to feel that their health is declining. Nearly four in ten seniors (38 percent) aged 75 and over with disabilities have deteriorating health year after year, compared to fewer than three in ten seniors (29 percent) aged 65 to 74 with disabilities.
Chronic health conditions
Most seniors with disabilities have chronic health conditions, and six in ten have at least three conditions.
A chronic health condition is a health problem that is ongoing, or that does not go away. Chronic health conditions are very common among seniors with disabilities. These conditions often emerge with age.
Figure 2.1 shows some of the most common chronic health conditions experienced by seniors and the percentage of seniors with and without disabilities who experience them.
| Type of chronic condition | Seniors with disabilities | Seniors without disabilities |
|---|---|---|
| Arthritis | 60 | 30 |
| High blood pressure | 54 | 45 |
| Back problems | 42 | 16 |
| Heart disease | 26 | 11 |
| Diabetes | 22 | 15 |
Figure 2.1 Text Description
This table presents data from the 2009 Canadian Community Health Survey. It presents the type of chronic condition for seniors aged 65 and over (in rows) by disability status (in columns) by percentage.
The columns are divided into the following disability status sections from left to right:
- Seniors with disabilities
- Seniors without disabilities
The rows describe the chronic condition.
For seniors with disabilities
- 60 percent of the seniors with disabilities had arthritis.
- 54 percent of the seniors with disabilities had high blood pressure.
- 42 percent of the seniors with disabilities had back problems.
- 26 percent of the seniors with disabilities had heart disease.
- 22 percent of the seniors with disabilities had diabetes.
For seniors without disabilities
- 30 percent of the seniors with disabilities had arthritis.
- 45 percent of the seniors with disabilities had high blood pressure.
- 16 percent of the seniors with disabilities had back problems.
- 11 percent of the seniors with disabilities had heart disease.
- 15 percent of the seniors with disabilities had diabetes.
Source: 2009 Canadian Community Health Survey
These chronic health conditions are often associated with specific types of disabilities. For example, arthritis is a very common underlying cause of mobility, agility and pain disabilities.
Having multiple chronic health conditions increases the likelihood that a senior will have a disability, as the combination of the multiple conditions means the senior is more likely to have difficulties with everyday activities. Figure 2.2 shows that many seniors with disabilities have multiple chronic health conditions—59 percent of seniors with disabilities have at least three, and 20 percent have five or more.
Figure 2.2 Number of chronic conditions for seniors, by disability status (%), 2009
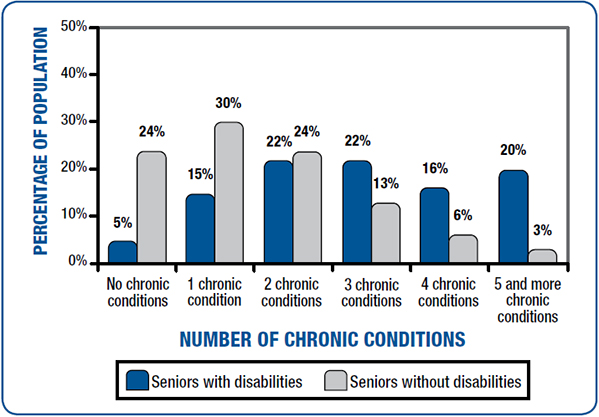
Figure 2.2 Text Description
This vertical bar graph presents data from the 2009 Canadian Community Health Survey. It illustrates the number of chronic conditions for seniors with and without disabilities by percentage.
The horizontal axis lists the number of chronic conditions. On the axis from left to right are the following numbers of chronic conditions:
- No chronic conditions
- 1 chronic conditions
- 2 chronic conditions
- 3 chronic conditions
- 4 chronic conditions
- 5 and more chronic conditions
The vertical axis is measured by percentages and increases in increments of 10 from 0 to 50
For seniors with disabilities
- 5 percent of seniors with disabilities had no chronic conditions.
- 15 percent of seniors with disabilities had one chronic condition.
- 22 percent of seniors with disabilities had two chronic conditions.
- 22 percent of seniors with disabilities had three chronic conditions.
- 16 percent of seniors with disabilities had four chronic conditions.
- 20 percent of seniors with disabilities had five or more chronic conditions.
For seniors without disabilities
- 24 percent of seniors without disabilities had no chronic conditions.
- 30 percent of seniors without disabilities had one chronic condition.
- 24 percent of seniors without disabilities had two chronic conditions.
- 13 percent of seniors without disabilities had three chronic conditions.
- 6 percent of seniors without disabilities had four chronic conditions.
- 3 percent of seniors without disabilities had five or more chronic conditions.
Source: 2009 Canadian Community Health Survey
Mental health
Most seniors with disabilities report they have very good mental health.
This section presents information that focuses on seniors with disabilities who live on their own, in the community. It is important to remember that the data do not include seniors who live in assisted-living residences, nursing homes and long-term care facilities. Past research has shown that seniors living in such facilities have much higher rates of mental illness than seniors who live independently.
Mental health among seniors is an important issue. Good mental health is critical for good quality of life. Seniors with disabilities are most likely to perceive their mental health as very good (34 percent), good (30 percent), or excellent (27 percent), as shown in Figure 2.3. However, compared to seniors without disabilities, seniors with disabilities are more likely to feel that their mental health is only fair or poor.
Figure 2.3 Self-reported mental health status among seniors, by disability status (%), 2009

Figure 2.3 Text Description
This vertical bar graph presents data from the 2009 Canadian Community Health Survey. It illustrates the mental health status for seniors age 65 and over by disability status by percentage.
This vertical bar graph is divided into five sections, each section representing a mental health status. The horizontal axis lists mental health status. On the axis from left to right are the following categories:
- Excellent
- Very good
- Good
- Fair
- Poor
The vertical axis is measured by percentages and increases in increments of 10 from 0 to 50.
- 27 percent of seniors with disabilities report they have excellent mental health.
- 38 percent of seniors without disabilities report they have excellent mental health.
- 34 percent of seniors with disabilities report they have very good mental health.
- 38 percent of seniors without disabilities report they have very good mental health.
- 30 percent of seniors with disabilities report they have good mental health.
- 21 percent of seniors without disabilities report they have good mental health.
- 9 percent of seniors with disabilities report they have fair mental health.
- 3 percent of seniors without disabilities report they have fair mental health.
- 1 percent of seniors with disabilities report they have poor mental health.
- 0 percent of seniors without disabilities report they have poor mental health.
Source: 2009 Canadian Community Health Survey
Seniors with disabilities are more likely to consult a mental health professional compared to seniors without disabilities (9 percent versus 3 percent respectively). On average, seniors with disabilities consult a mental health professional four times per year. For those who consult a professional for mental health issues, the majority seek assistance from a family doctor (64 percent), psychiatrist (18 percent) or psychologist (11 percent).
Stress
High stress can have a negative impact on overall health. More seniors with disabilities report being stressed than seniors without disabilities. Seventeen percent of seniors with disabilities report they have high stress, compared to 8 percent of seniors without disabilities. Similarly, 36 percent of seniors with disabilities consider themselves to be a bit stressed, compared to 29 percent of seniors without disabilities.
Physical activity
Almost seven in ten seniors with disabilities are inactive.
Exercise is an important contributor to good overall health. For the 2009 Canadian Community Health Survey, Statistics Canada created the Leisure Time Physical Activity Index Footnote 1 , which measured the level of physical activity among respondents by asking about the frequency, nature and duration of participation in certain activities such as swimming, bicycling or skating. Respondents were classified as active, moderately active or inactive based on their participation over the three months prior to being surveyed.
Figure 2.4 Physical activity level among seniors, by disability status (%), 2009

Figure 2.4 Text Description
This vertical bar graph presents data from the 2009 Canadian Community Health Survey. It illustrates the physical activity level among seniors by disability status by percentage.
This vertical bar graph is divided into three sections, each section representing a physical activity level. The horizontal axis lists physical activity level. On the axis from left to right are the following categories:
- Active
- Moderately active
- Inactive
For seniors with disabilities
- 13 percent of seniors with disabilities are physically active.
- 18 percent of seniors with disabilities are moderately physically active.
- 69 percent of seniors with disabilities are physically inactive.
For seniors without disabilities
- 23 percent of seniors without disabilities are physically active.
- 27 percent of seniors without disabilities are moderately physically active.
- 50 percent of seniors with disabilities are physically inactive.
Source: 2009 Canadian Community Health Survey
The physical activity levels of seniors are displayed by disability status in Figure 2.4. Seniors with disabilities are significantly more likely to be classified as inactive when compared to seniors without disabilities. In contrast, seniors aged 75 and older with disabilities (not shown in the figure) are also significantly more likely to be classified as inactive compared to younger seniors aged 65 to 74 with disabilities (76 percent versus 63 percent). Older Canadians aged 55 to 64 with disabilities have similar activity levels to those aged 65 to 74 (18 percent active, 22 percent moderately active and 60 percent inactive). Senior men with disabilities are more likely to be active than senior women with disabilities (18 percent versus 9 percent).
Injuries
Seniors with disabilities are more likely to experience injuries as a result of falls.
Seniors with disabilities are more likely to experience an injury than seniors without disabilities (12 percent versus 7 percent). Three in ten seniors with disabilities who have had injuries in the past year have experienced sprains and/or broken bones. Senior men with disabilities are more likely to experience sprains than broken bones, and senior women with disabilities are more likely to experience broken bones.
Seven in ten seniors with disabilities have experienced injuries in the past year as a result of a fall, compared to six in ten seniors without disabilities.
For seniors with disabilities who have experienced injuries, over six in ten (or 65 percent) have experienced injuries in or near their home. Just over three in ten have experienced injuries while walking, and just over two in ten have experienced injuries while doing household chores, outdoor yard maintenance or similar activities. Senior women with disabilities are more likely to experience an injury than senior men (14 percent versus 10 percent).
Medical care
Seniors with disabilities are more likely to have chronic health conditions and an increased need for medical specialists.
Family doctors
Canada's health care system is designed so that the primary point of contact with the medical system is a family doctor. Family doctors are responsible for providing ongoing general medical care to patients, and arranging for specialized medical care where needed. Having a disability does not affect a senior's overall chance of having a family doctor. For both seniors with disabilities and those without, about 95 percent have family doctors.
Having disabilities does, however, seem to have something to do with problems in trying to find a new family doctor. Seniors with disabilities are more likely than seniors without disabilities to require medical care, and those who do not have a doctor are much more likely to be actively trying to find one. For those without a family doctor, 85 percent are trying to find a doctor, compared to 63 percent of those without disabilities. In contrast, 37 percent of seniors without disabilities and 15 percent of seniors with disabilities who do not have family doctors have not tried to contact one.
Medical specialists
Generally, consultations and diagnoses are needed for new and existing health conditions. These medical appointments are in addition to yearly visits to family doctors. Seniors with disabilities are much more likely than those without disabilities to need to visit medical specialists (e.g. cardiologists, allergists, gynaecologists and psychiatrists) for diagnoses or consultations (52 percent versus 31 percent). Those without disabilities are less likely to have chronic health problems, and are therefore less likely to need medical treatment.
Among those who need to see medical specialists, seniors with disabilities are more likely to have difficulty obtaining appointments (19 percent versus 13 percent). The most common problem experienced by seniors with disabilities is that they have to wait too long between booking the appointment and the actual visit—among seniors with disabilities who have problems, 71 percent find they need to wait a long time, compared to 64 percent of seniors without disabilities.
Spotlight on Government of Canada Programs:
Veterans Independence Program
The Veterans Independence Program helps clients remain healthy and independent in their homes and communities. Services include home care (i.e. grounds maintenance, housekeeping, personal care) and health support services. This program is available to people who have needs related to the condition for which they receive a Veterans Affairs Canada disability pension or award and to wartime veterans or overseas civilians who qualify due to low income.
For more information, visit
www.vac-acc.gc.ca/clients/sub.cfm?source=services/vip.
Spotlight on Phil Bradbury
Second World War veteran Phil Bradbury, 85, of Toronto was surprised to learn that in civilian life he'd been missing in action for a couple of decades. Veterans Affairs Canada has been looking for veterans like Bradbury who qualify for, but aren't receiving benefits under the Veterans Independence Program (VIP). The VIP helps aging veterans live independently as long as possible by providing home care support like housecleaning and shovelling walkways, making meals and help with bathing, as well as home adaptation and health support services.
He's been receiving a VAC pension for service-related hearing loss and other injuries for over five decades. He retired in the late 1980s.
For more information, visit
www.legionmagazine.com/en/index.php/2008/11/veterans-independence-program-in-the-name-of-freedom-and-dignity/.