
2011 FDR - Section 3: Caregiving
Many seniors with disabilities need help with everyday activities. Care can be extensive, in which case people receive help with essential everyday functions, such as dressing, eating and moving around in their homes. It can also be occasional, such as help with household chores and yard work.
Seniors with disabilities have even more need for help than younger people with disabilities. This is because seniors with disabilities are more likely to have:
- multiple types of disabilities
- more severe disabilities
- underlying chronic health conditions
Data in this section come from the 2006 Participation and Activity Limitation Survey (PALS).
Need for care
Seven in ten seniors with disabilities have some need for care.
Of the 1.8 million seniors who have disabilities, over 1.2 million (or 72 percent) require help with some of their everyday activities.
Note: This section refers to seniors with disabilities who have expressed a need for care, whether or not they actually receive it.
The need for caregiving increases with age, and senior women with disabilities are more in need for caregiving help than senior men. Figure 3.1 shows that as seniors age the share of seniors with disabilities who require assistance increases continually from 74 to 92 percent for women, and from 50 to 81 percent for men. There are a number of possible reasons to explain why women may have a greater need for help, including the fact that women generally live longer than men.
Figure 3.1 Caregiving need among Canadians with disabilities, by sex and age group (%), 2006

Figure 3.1 Text Description
This line graph presents data from the 2006 Participation and Activity Limitation Survey. It illustrates the caregiving need among Canadians with disabilities by age group and sex by percentage.
This line graph is divided into four sections, each section representing an age category. The horizontal axis lists the age groups. On the axis from left to right are the following categories:
- 55 to 64
- 65 to 74
- 75 to 84
- 85 and over
The vertical axis is measured by percentages and increases in increments of 20 from 0 to 100.
- In the 55 to 64 age group the caregiving need for females is 74 percent.
- In the 55 to 64 age group the caregiving need for males is 50 percent.
- In the 65 to 74 age group the caregiving need for females is 76 percent.
- In the 65 to 74 age group the caregiving need for males is 50 percent.
- In the 75 to 84 age group the caregiving need for females is 82 percent.
- In the 75 to 84 age group the caregiving need for males is 61 percent.
In the 85 and over age group the caregiving need for females is 92 percent. - In the 85 and over age group the caregiving need for males is 81 percent.
Source: 2006 Participation and Activity Limitation Survey
As seniors with disabilities get older and develop multiple and more severe disabilities, the need for care increases—74 percent of those aged 75 to 84 require help, and 88 percent of those aged 85 or older require help. Overall, 93 percent of seniors who have more severe disabilities require help, compared to 58 percent of seniors with mild or moderate disabilities.
Figure 3.2 shows that the most common type of help needed by seniors with disabilities concerns heavy household chores, such as spring cleaning and yard work. Among seniors aged 85 and over, the need for help with all types of everyday activities increases. Help with housework and transportation to appointments and for running errands become very common needs among this age group.
| Type of help needed | Age group | |||
|---|---|---|---|---|
| 55 to 64 | 65 to 74 | 75 to 84 | 85 and over | |
| Heavy household chores | 54 | 53 | 59 | 70 |
| Housework | 35 | 34 | 45 | 67 |
| Appointments and errands | 30 | 32 | 47 | 70 |
| Preparing meals | 21 | 20 | 25 | 40 |
| Finances | 13 | 16 | 26 | 40 |
| Personal care | 9 | 11 | 17 | 33 |
| Medical treatment or nursing | 5 | 5 | 11 | 20 |
| Moving about | 4 | 6 | 8 | 12 |
Figure 3.2 Text Description
This table presents data from the 2006 Participation and Activity Limitation Survey. It presents the types of care needed (in rows) among older Canadians with disabilities by age group (in columns) by percentage.
The columns are divided into the following age group sections from left to right:
- 55 to 64
- 65 to 74
- 75 to 84
- 85 and over
The rows describe the type of help needed.
For heavy household chores
- 54 percent of the 55 to 64 age group needed care.
- 53 percent of the 65 to 74 age group needed care.
- 59 percent of the 75 to 84 age group needed care.
- 70 percent of the 85 and over age group needed care
For housework
- 35 percent of the 55 to 64 age group needed care.
- 34 percent of the 65 to 74 age group needed care.
- 45 percent of the 75 to 84 age group needed care.
- 67 percent of the 85 and over age group needed care
For appointments and errands
- 30 percent of the 55 to 64 age group needed care.
- 32 percent of the 65 to 74 age group needed care.
- 47 percent of the 75 to 84 age group needed care.
- 70 percent of the 85 and over age group needed care.
For preparing meals
- 21 percent of the 55 to 64 age group needed care.
- 20 percent of the 65 to 74 age group needed care.
- 25 percent of the 75 to 84 age group needed care.
- 40 percent of the 85 and over age group needed care.
For finances
- 13 percent of the 55 to 64 age group needed care.
- 16 percent of the 65 to 74 age group needed care.
- 26 percent of the 75 to 84 age group needed care.
- 40 percent of the 85 and over age group needed care.
For personal care
- 9 percent of the 55 to 64 age group needed care.
- 11 percent of the 65 to 74 age group needed care.
- 17 percent of the 75 to 84 age group needed care.
- 33 percent of the 85 and over age group needed care.
For medical treatment or nursing
- 5 percent of the 55 to 64 age group needed care.
- 5 percent of the 65 to 74 age group needed care.
- 11 percent of the 75 to 84 age group needed care.
- 20 percent of the 85 and over age group needed care.
For moving about
- 4 percent of the 55 to 64 age group needed care.
- 6 percent of the 65 to 74 age group needed care.
- 8 percent of the 75 to 84 age group needed care.
- 12 percent of the 85 and over age group needed care.
Source: 2006 Participation and Activity Limitation Survey
There are some gender differences for the types of help needed. Women and men are about equally likely to need help with personal care, medical treatment or nursing and moving about. Women, however, are more likely to need help with heavy household chores, housework, transportation to appointments, running errands, preparing meals and finances.
Seniors with more severe disabilities are more likely to require help than seniors with mild or moderate disabilities. This is especially true in the area of moving about; seniors with more severe disabilities are 17 times more likely to require help than seniors with mild to moderate disabilities.
How well are needs being met?
Half a million seniors with disabilities have unmet caregiving needs.
Just over 1 million seniors with disabilities (or 94 percent) are receiving some form of care. Seniors with disabilities aged 85 and over are highly likely to receive at least some help with everyday activities. With age, seniors are more likely to receive the help they need. However, many seniors with disabilities who are receiving care still have unmet needs. Figure 3.3 shows the level of unmet care needs among those who require help, by age group.
Figure 3.3 Level of unmet care for older Canadians and seniors with disabilities, by age group (%), 2006

Figure 3.3 Text Description
This vertical bar graph presents data from the 2006 Participation and Activity Limitation Survey. It illustrates the level of unmet caregiving need by age group by percentage.
This vertical bar graph is divided into four sections, each section representing an age category. The horizontal axis lists the age groups. On the axis from left to right are the following categories:
- 55 to 64
- 65 to 74
- 75 to 84
- 85 and over
The vertical axis is measured by percentages and increases in increments of 20 from 0 to 100.
- In the 55 to 64 age group, 10 percent receive no caregiving help, but need some.
- In the 55 to 64 age group, 33 percent receive some caregiving help, but need more.
- In the 55 to 64 age group, 57 percent receive all caregiving help needed.
- In the 65 to 74 age group, 9 percent receive no caregiving help, but need some.
- In the 65 to 74 age group, 36 percent receive some caregiving help, but need more.
- In the 65 to 74 age group, 55 percent receive all caregiving help needed.
- In the 75 to 84 age group, 5 percent receive no caregiving help, but need some.
- In the 75 to 84 age group, 35 percent receive some caregiving help, but need more.
- In the 75 to 84 age group, 60 percent receive all caregiving help needed.
- In the 85 and over age group, 2 percent receive no caregiving help, but need some.
- In the 85 and over age group, 36 percent receive some caregiving help, but need more.
- In the 85 and over age group, 62 percent receive all caregiving help needed.
Source: 2006 Participation and Activity Limitation Survey
Figure 3.4 shows 42 percent of seniors with disabilities who need help have unmet needs. These include 6 percent who have none of their needs met, and 36 percent who have some of their needs met. There are just over 500 000 seniors with disabilities who have unmet needs for care.
Figure 3.4 Unmet needs among seniors with disabilities (%), 2006

Figure 3.4 Text Description
This vertical bar graph presents data from the 2006 Participation and Activity Limitation Survey. It illustrates the level of unmet caregiving need among seniors by percentage.
This vertical bar graph is divided into three sections, each section representing a type of need met. The horizontal axis lists needs met. On the axis from left to right are the following categories:
- All needs met
- Some needs met
- No needs met
The vertical axis is measured by percentages and increases in increments of 20 from 0 to 100.
- 58 percent of seniors with disabilities have all caregiving needs met.
- 36 percent of seniors with disabilities have some caregiving needs met.
- 6 percent of seniors with disabilities have no caregiving needs met.
Source: 2006 Participation and Activity Limitation Survey
Figure 3.5 shows the percentage of unmet needs by type. Almost two in ten seniors with disabilities have unmet needs for help with heavy household chores. In contrast, where help is needed with more essential activities, most seniors with disabilities have their needs met. Only two percent of seniors with disabilities have unmet needs for help with medical treatment or nursing.
| Type of help needed | Number of seniors with unmet needs | % |
|---|---|---|
| Heavy household chores | 322 510 | 19 |
| Housework | 199 710 | 12 |
| Appointments and errands | 180 590 | 11 |
| Preparing meals | 78 640 | 5 |
| Personal care | 70 990 | 4 |
| Finances | 48 710 | 3 |
| Moving about | 45 390 | 3 |
| Medical treatment or nursing | 37 810 | 2 |
Figure 3.5 Text Description
This table presents data from the 2006 Participation and Activity Limitation Survey. It presents the type of unmet needs for seniors with disabilities, by type of help needed.
The columns are divided into the following sections from left to right:
- Number of seniors with unmet needs
- Percent (%)
The rows describe the type of help needed.
For the number of seniors with unmet needs:
- 322,510 Canadians with disabilities need help with heavy household chores.
- 199,710 Canadians with disabilities need help with housework.
- 180,590 Canadians with disabilities need help with appointments and errands.
- 78,640 Canadians with disabilities need help with preparing meals.
- 70,990 Canadians with disabilities need help with personal care.
- 48,710 Canadians with disabilities need help with finances.
- 45,390 Canadians with disabilities need help with moving about.
- 37,810 Canadians with disabilities need help with medical treatment or nursing.
For the percentage with unmet needs
- 19 percent of Canadians with disabilities need help with heavy household chores.
- 12 percent of Canadians with disabilities need help with housework.
- 11 percent of Canadians with disabilities need help with appointments and errands.
- 5 percent of Canadians with disabilities need help with preparing meals.
- 4 percent of Canadians with disabilities need help with personal care.
- 3 percent of Canadians with disabilities need help with finances.
- 3 percent of Canadians with disabilities need help with moving about.
- 2 percent of Canadians with disabilities need help with medical treatment or nursing.
Source: 2006 Participation and Activity Limitation Survey
The most common reason why seniors are not receiving the care they need is that obtaining the help is too expensive (24 percent). Other common reasons are that seniors with disabilities do not know where to find the help they need (11 percent) and that informal help is not easily accessible (11 percent).
Caregivers: Who are they?
Family members are the most common caregivers for seniors with disabilities.
In Canada, family members are the most common caregivers for seniors with disabilities. Spouses often care for their partners and children often care for their parents. This type of care is called informal care. Formal care is provided by government agencies, and by non-profit and for-profit organizations, and there is usually a fee for the services. Figure 3.6 illustrates who provides care for seniors with disabilities.
Figure 3.6 Types of caregivers for seniors with disabilities (%), 2006
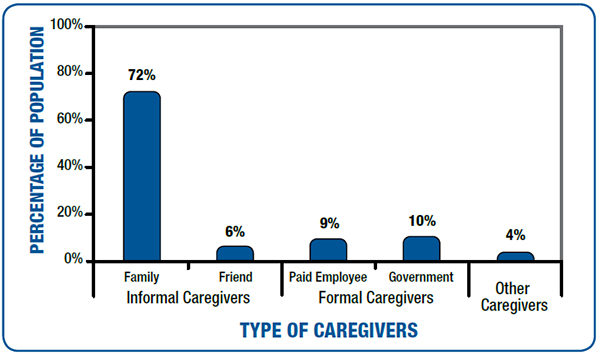
Figure 3.6 Text Description
This vertical bar graph presents data from the 2006 Participation and Activity Limitation Survey. It illustrates the types of caregivers for seniors with disabilities by percentage.
This vertical bar graph is divided into three sections, each section representing a type of caregiver. The horizontal axis lists the types of caregivers by caregiving type. On the axis from left to right are the following categories:
- Informal Caregivers: Family and Friend
- Formal Caregivers: Paid Employees or Government
- Other Caregivers
The vertical axis is measured by percentages and increases in increments of 20 from 0 to 100.
- 72 percent of caregivers for seniors with disabilities are family.
- 6 percent of caregivers for seniors with disabilities are friends.
- 9 percent of caregivers for seniors with disabilities are paid employees.
- 10 percent of caregivers for seniors with disabilities are government.
- 4 percent of caregivers for seniors with disabilities are other.
Source: 2006 Participation and Activity Limitation Survey
About seven in ten of the primary caregivers of seniors with disabilities are family members. Formal caregivers (government and paid employees) provide 19 percent of caregiving help to seniors with disabilities.
Older seniors aged 75 and over are more likely than younger seniors to receive help from sources other than family or friends. Family members are still the most common source of help for older seniors with disabilities (68 percent), but older seniors receive increased levels of care from government or non-profit organizations (12 percent) and paid employees (10 percent).
Spotlight on Government of Canada Programs:
Family Caregiver Tax Credit
Budget 2011 proposed to provide new tax support for caregivers of infirm dependent family members by introducing a new family caregiver tax credit. This 15-percent non-refundable credit on an amount of $2,000 will provide tax relief for caregivers of all types of infirm dependent relatives, including, for the first time, spouses, common-law partners and minor children.
Caregivers will benefit from the family caregiver tax credit by claiming an enhanced amount for an infirm dependant under one of the following existing dependency-related credits: the spousal or common-law partner credit, the child tax credit, the eligible dependant credit, the caregiver credit or the infirm dependant credit. It is estimated that over 500 000 caregivers will benefit from the family caregiver tax credit.
This measure will apply for the 2012 and subsequent taxation years.
Spotlight on families with new relief from the family caregiver tax credit
Manon is a teacher with a young family. Manon’s mother, Claudine, is a low-income senior who lives with Manon’s family. Claudine is infirm and is dependent on Manon’s assistance for her personal needs. In addition to the tax relief that she receives through the existing caregiver credit, Manon will be able to claim the new 15-percent family caregiver tax credit on an amount of $2,000.
For more information, visit www.actionplan.gc.ca/en/blog/family-caregiver-tax-credit-explained.