
EI Monitoring and Assessment Report 2012 II. ASSISTING CANADIANS DURING UNEMPLOYMENT: EI REGULAR BENEFITS
Notice: Refer to the Table of contents to navigate through the EI Monitoring and Assessment Report .
EI regular benefits provide temporary financial assistance to workers who have lost their job through no fault of their own, while they look for work or upgrade their skills, provided that they have contributed to the program and accumulated the required number of insurable hours. In most cases, individuals require between 420 and 700 insured hours to qualify, based on the unemployment rate in the economic region where they reside, to access regular benefits. This feature of the EI program is called the Variable Entrance Requirement (VER).
However, workers who have recently entered the labour market for the first time (new entrants) and those who have limited or no work experience in the last two years (re-entrants) require 910 insured hours, regardless of where they reside. These two groups are collectively known as new-entrants/re-entrants (NEREs).
1. EI Regular Benefits, Claims and Benefit Payments
In 2011/12, there were 1.42 million new EI regular claims established, an increase of 1.8% (+25,410) compared with the previous year. This follows a 13.6% decrease in EI regular claims in 2010/11 and a 1.6% decrease in EI regular claims in 2009/10.
The increase in EI regular claims in 2011/12 was partly attributable to the slowing of the pace of recovery in Canada compared with the previous year, as well as more claimants having exhausted their benefit entitlement due to the conclusion of the temporary EI measures under the Economic Action Plan.
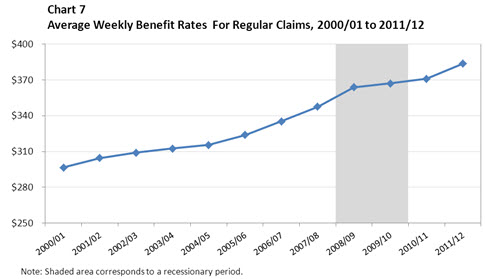
Table equivalent of Chart 7
| Year | Average Weekly Benefit Rate |
|---|---|
| 2000/01 | $297 |
| 2001/02 | $305 |
| 2002/03 | $309 |
| 2003/04 | $312 |
| 2004/05 | $315 |
| 2005/06 | $324 |
| 2006/07 | $335 |
| 2007/08 | $348 |
| 2008/09 | $364 |
| 2009/10 | $367 |
| 2010/11 | $371 |
| 2011/12 | $384 |
Total regular benefit payments decreased by 12.9% to $10.71 billion in 2011/12. Despite this decrease, total payments for regular benefits remained 12.8% higher than they were in 2007/08.
As indicated in Chart 7, after two years of slight increases ($4 in 2010/11 and $3 in 2009/10, respectively), the average weekly benefit rate for regular claims rose significantly by $13 from $371 in 2010/11 to $384 in 2011/12. The increase in 2011/12 is consistent with the annual increases observed during the pre-recession period, when the average weekly benefit rate increased by $16 in 2008/09, $12 in 2007/08 and $11 in 2006/07.
1.1 EI Regular Benefit Claims, by Province and Territory
In 2011/12, seven provinces and territories recorded decreases in the number of new regular claims compared with 2010/11. Among provinces, the most notable decreases occurred in Alberta (-9.5%, -9,200) and British Columbia (-3.4%, -5,490).
The largest provincial increases in the number of new regular claims occurred in Ontario (+4.6%, +18,460), Manitoba (+4.3%, +1,620) and Quebec (+4.2%, +18,670). As shown in Chart 8, these three provinces accounted for 29.3%, 2.7% and 32.4% of all new regular claims, respectively.
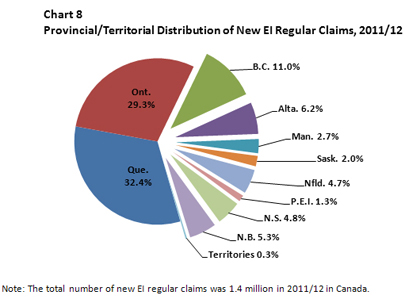
Table equivalent of Chart 8
| Province | EI Regular Claims | % |
|---|---|---|
| Canada | 1,422,270 | 100% |
| Que. | 460,160 | 32.4% |
| Ont. | 416,500 | 29.3% |
| B.C. | 156,450 | 11.0% |
| Alta. | 87,630 | 6.2% |
| Man. | 39,080 | 2.7% |
| Sask. | 28,790 | 2.0% |
| Nfld. | 67,260 | 4.7% |
| P.E.I. | 17,850 | 1.3% |
| N.S. | 68,620 | 4.8% |
| N.B. | 75,310 | 5.3% |
| Territories | 4,620 | 0.3% |
As illustrated in Chart 9, in 2011/12, Newfoundland and Labrador was the only province to record fewer new EI regular claims than it recorded in 2007/08, before the recession (-4.4% between 2007/08 and 2011/12). In all other provinces and territories, claim volumes remained above 2007/08 levels; for example, the number of new regular claims in Alberta and British Columbia remained 51.2% and 27.5% above pre-recession levels, respectively, despite the year-over-year decreases observed in 2011/12.
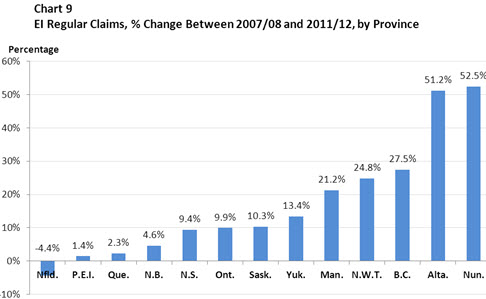
Table equivalent of Chart 9
| Province | 2007/08 | 2011/12 | % Change |
|---|---|---|---|
| Nfld. | 70,340 | 67,260 | -4.4% |
| P.E.I. | 17,600 | 17,850 | 1.4% |
| Que. | 449,700 | 460,160 | 2.3% |
| N.B. | 71,970 | 75,310 | 4.6% |
| N.S. | 62,740 | 68,620 | 9.4% |
| Ont. | 378,920 | 416,500 | 9.9% |
| Sask. | 26,110 | 28,790 | 10.3% |
| Yuk. | 1,790 | 2,030 | 13.4% |
| Man. | 32,240 | 39,080 | 21.2% |
| N.W.T. | 1,330 | 1,660 | 24.8% |
| B.C. | 122,750 | 156,450 | 27.5% |
| Alta. | 57,960 | 87,630 | 51.2% |
| Nun. | 610 | 930 | 52.5% |
1.2 EI Regular Benefit Claims, by Sector and Industry
In 2011/12, there were 534,240 new EI regular claims established in the goods-producing sector, comprising 37.6% of all EI regular claims. As mentioned in Chapter 1, the goods-producing sector comprised 21.9% of employment in 2011/12, indicating that the goods-producing sector was over-represented among EI regular claims.
Although the number of new EI regular claims increased by 0.9% (+4,810) in 2011/12, it remained 1.3% (-7,140) below its 2007/08 level, prior to the recession. As illustrated in Chart 10, the number of EI regular claims in the goods-producing sector peaked at 732,540 claims in 2008/09. As the recovery took hold, the number of regular claims in the sector declined significantly: by 2010/11, it was below the pre-recession level.
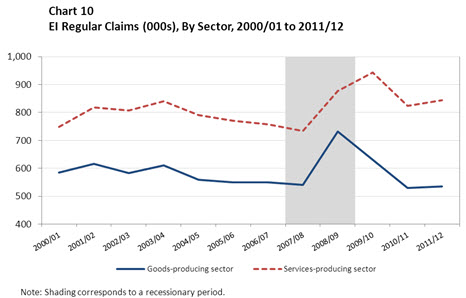
Table equivalent of Chart 10
| Year | All industries | Goods-producing sector | Services-producing sector |
|---|---|---|---|
| 2000/01 | 1,372 | 585 | 748 |
| 2001/02 | 1,480 | 616 | 818 |
| 2002/03 | 1,428 | 584 | 807 |
| 2003/04 | 1,493 | 610 | 840 |
| 2004/05 | 1,394 | 558 | 791 |
| 2005/06 | 1,350 | 550 | 771 |
| 2006/07 | 1,328 | 550 | 757 |
| 2007/08 | 1,294 | 541 | 734 |
| 2008/09 | 1,642 | 733 | 877 |
| 2009/10 | 1,617 | 630 | 944 |
| 2010/11 | 1,397 | 529 | 824 |
| 2011/12 | 1,422 | 534 | 844 |
In addition, EI regular benefit payments to claimants in the goods-producing sector fell by 13.1% in 2011/12, after a 22.9% decrease in 2010/11. The two largest industries in the sector—manufacturing and construction—experienced declines in benefit payments of 22.8% and 7.3%, respectively. More detailed information on EI regular benefit payments by sector and industry can be found in Annex 2.3.
The number of EI regular claims from the services-producing sector peaked at 944,030 claims in 2009/10, comprising 59.3% of all EI regular claims. Footnote 25 As mentioned in Chapter 1, the services-producing sector comprised 78.1% of employment in 2011/12, indicating that the services-producing sector was under-represented among EI regular claims.
The services-producing sector showed a differing trend in 2011/12 compared to the goods-producing sector. In 2010/11, the number of EI regular claims in the sector declined (-12.7%), reflecting the recovery from the recession, but did not return to its pre-recession level. In 2011/12, the number of EI regular claims increased by 2.0% to 844,090 claims, putting further distance between the volume of claims in 2011/12 and the pre-recession level.
Regular benefit payments to claimants in the services-producing sector fell by 13.2% in 2011/12, after a slight decrease of 4.4% in the previous year. The largest decline in benefit payments in the sector occurred in finance and insurance (-22.6%), followed by wholesale trade (-22.4%), and information and cultural (-22.2%) industries.
1.3 EI Regular Benefit Claims, by Gender and Age
In 2011/12, the number of new EI regular claims increased for both men (+1.0%) and women (+3.1 %). The number of new regular claims established remained 9.9% higher for men and 10.4% higher for women than it was before the onset of the recession in 2007/08. As a result of the sharper increase in the number of new regular claims by women, the proportion of regular claims established by women increased by 0.5 percentage points to 39.8%, while that for men decreased by 0.5 percentage points to 60.2% in 2011/12.
Regular benefits paid to men decreased by 13.3% in 2011/12, after decreasing by 17.1% in 2010/11. Meanwhile, benefits paid to women fell by 12.2%, after a decrease of 2.4% in 2010/11. Despite these recent declines, when comparing 2011/12 with 2007/08, total regular benefits paid remained 32.5% higher for men and 38.5% higher for women, respectively.
The number of regular claims rose among core-aged workers (aged 25 to 54) (+1.1%) and older workers (+10.3%) in 2011/12, while it declined among young workers (-7.6%) in comparison to the previous year. Compared with pre-recession figures from 2007/08, the volume of new regular claims remained higher for each age group (+9.1% for young workers, +4.7% for core-aged workers, and +33.9% for older workers).
Youth, core-aged workers and older workers accounted for 10.5%, 69.6% and 19.9% of all regular claims in 2011/12, respectively. Over the past decade, the composition of EI regular claimants has shifted; claimants 55 and older now comprise a greater proportion, while core-aged workers account for a lower proportion.
As illustrated in Chart 11, the proportion of regular claims established by core-aged workers has declined steadily over the last decade (from 76.7% in 2000/01 to 69.6% in 2011/12), while that of older workers has increased (from 10.4% in 2000/01 to 19.9% in 2011/12). The increase among older workers is partly attributable to the continuous increase in their share of the Canadian labour force. They accounted for 36.4% of the labour force in 2011/12, a significant increase from 25.6% in 2000/01. The proportion of regular claims established by youth was high (11.7% in 2009/10) during the late-2000s recession due to a significant loss in employment. As the recovery took hold, it slowly returned its pre-recession level (10.5% in 2011/12).
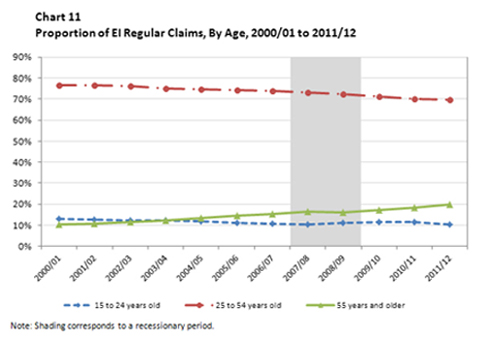
Table equivalent of Chart 11
| Age | 2000/01 | 2001/02 | 2002/03 | 2003/04 | 2004/05 | 2005/06 | 2006/07 | 2007/08 | 2008/09 | 2009/10 | 2010/11 | 2011/12 |
|---|---|---|---|---|---|---|---|---|---|---|---|---|
| Proportion of EI Regular Claims | ||||||||||||
| 15 to 24 years old | 12.9% | 12.7% | 12.2% | 12.3% | 11.9% | 11.2% | 10.8% | 10.6% | 11.2% | 11.7% | 11.6% | 10.5% |
| 25 to 54 years old | 76.7% | 76.5% | 76.2% | 75.2% | 74.6% | 74.3% | 73.8% | 73.1% | 72.5% | 71.2% | 70.0% | 69.6% |
| 55 years and older | 10.4% | 10.7% | 11.7% | 12.5% | 13.5% | 14.5% | 15.4% | 16.3% | 16.3% | 17.1% | 18.4% | 19.9% |
Regular benefit payments fell across all three major age groups in 2011/12. Despite the decreases, regular benefits paid in 2011/12 remained higher than the pre-recession figure in 2007/08 for each age group (+31.2% for youth, +27.2% for core-aged workers and +67.0% for older workers).
1.4 EI Regular Benefit Claims, by EI History
Historically, the EI Monitoring and Assessment Report has included analysis of regular claims based on the claimant's prior use of the EI program. New regular claims were grouped into one of three claimant categories—first-time, occasional, or frequent—based on the number of EI claims in the past five years. These claimant categories were used solely for the purpose of examining the impact and effectiveness of the EI program within the report.
However, effective January 6, 2013, the Employment Insurance Regulations were modified to establish three EI claimant categories that are used to determine claimant responsibilities, in terms of undertaking a reasonable job search for suitable employment. The three new EI claimant categories are: long-tenured workers, frequent claimants and occasional claimants. Footnote 26
The new regulations are part of the broader Connecting Canadians with Available Jobs initiative, which was first announced in Budget 2012. Table 4 provides definitions of the new EI claimant categories, as well as the categories previously used in the report for assessment purposes.
| Previous EI Claimant History Categories | New EI Claimant History Categories | ||
|---|---|---|---|
| First-Time Claimants | Individuals who did not have a claim in the five years prior to their current EI claim | Long-Tenured Workers | Individuals who have paid at least 30% of the annual maximum employee’s EI premiums in 7 of the past 10 years, and who, over the last 5 years, have collected 35 or fewer weeks of EI regular or fishing benefits |
| Frequent Claimants | Individuals who have had three or more EI regular or fishing claims in the five years prior to their current EI claim | Frequent Claimants | Individuals who have had three or more claims for EI regular or fishing benefits, and have collected more than 60 weeks of EI regular or fishing benefits in the past 5 years |
| Occasional Claimants | Individuals who have had one to two EI regular or fishing claims in the five years prior to their current EI claim | Occasional Claimants | Individuals who do not meet the definition of long-tenured workers or frequent claimants |
The following analysis of new EI regular claims is based on the new EI claimant categories. The analysis and number of EI regular claims using the new EI claimant categories are only estimates for 2011/12, as the applicable sections of the EI Regulations were not in force during 2011/12. However, the number of EI regular claims is examined according to the new EI claimant categories in order to support future analysis of the Connecting Canadians with Available Jobs initiative. As these new claimant categories are implemented, future reports will provide further analysis. Chart 12 and Table 5 provide the national distribution and the provincial breakdown of new EI regular claims based on the old and new EI claimant categories.
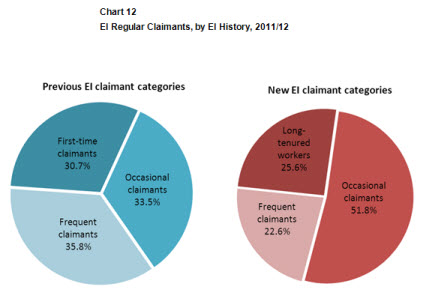
Table equivalent of Chart 12
| Previous EI claimant categories | % |
|---|---|
| Frequent Claimants | 35.8% |
| Occasional Claimants | 33.5% |
| First-Time Claimants | 30.7% |
| New EI claimant categories | % |
| Long-Tenured Workers | 25.6% |
| Occasional Claimants | 51.8% |
| Frequent Claimants | 22.6% |
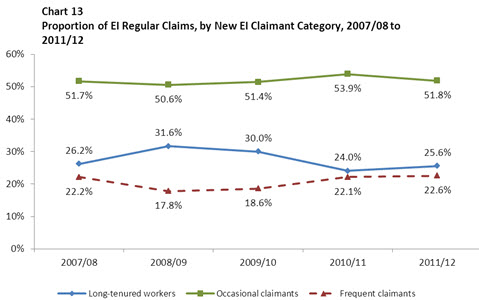
Table equivalent of Chart 13
| Category | 2007/08 | 2008/09 | 2009/10 | 2010/11 | 2011/12 |
|---|---|---|---|---|---|
| Long-tenured workers | 26.2% | 31.6% | 30.0% | 24.0% | 25.6% |
| Occasional claimants | 51.7% | 50.6% | 51.4% | 53.9% | 51.8% |
| Frequent claimants | 22.2% | 17.8% | 18.6% | 22.1% | 22.6% |
Using the new EI claimant categories, in 2011/12, occasional claimants accounted for the largest share of all new EI regular claims. Between 2007/08 and 2011/12, occasional claimants' share of regular claims remained relatively stable at approximately 50%. Long-tenured workers and frequent claimants accounted for 25.6% and 22.6% of all EI regular claims in 2011/12, respectively. Long-tenured workers' share of EI regular claims increased during the recession as a result of the sharp increase in the volume of new regular claims made specifically by long-tenured workers (+53.6% between 2007/08 and 2008/09). However, as the number of new EI regular claims by frequent claimants remained stable, frequent claimants' share of EI regular claims decreased. In the subsequent recovery period, the proportions of regular claims made by long-tenured workers and frequent claimants fell to their pre-recession levels, respectively.
| Old EI Claimant Category | New EI Claimant Category | Total | |||||
|---|---|---|---|---|---|---|---|
| First-Time | Occasional | Frequent | Long-Tenured | Occasional | Frequent | ||
| Claimants | Claimants | Claimants | Workers | Claimants | Claimants | ||
| Newfoundland and Labrador | 8,640 | 15,700 | 42,920 | 5,810 | 22,430 | 39,020 | 67,260 |
| 12.8% | 23.3% | 63.8% | 8.6% | 33.3% | 58.0% | 100.0% | |
| Prince Edward Island | 2,510 | 4,340 | 11,000 | 1,870 | 6,050 | 9,930 | 17,850 |
| 14.1% | 24.3% | 61.6% | 10.5% | 33.7% | 55.6% | 100.0% | |
| Nova Scotia | 15,790 | 19,520 | 33,310 | 11,960 | 30,010 | 26,650 | 68,620 |
| 23.0% | 28.4% | 48.5% | 17.4% | 43.7% | 38.8% | 100.0% | |
| New Brunswick | 13,360 | 19,370 | 42,580 | 10,110 | 31,380 | 33,820 | 75,310 |
| 17.7% | 25.7% | 56.5% | 13.4% | 41.7% | 44.9% | 100.0% | |
| Quebec | 114,870 | 145,400 | 199,890 | 109,480 | 226,060 | 124,620 | 460,160 |
| 25.0% | 31.6% | 43.4% | 23.8% | 49.1% | 27.1% | 100.0% | |
| Ontario | 159,440 | 150,610 | 106,450 | 127,450 | 239,320 | 49,730 | 416,500 |
| 38.3% | 36.2% | 25.6% | 30.6% | 57.5% | 11.9% | 100.0% | |
| Manitoba | 14,500 | 12,680 | 11,900 | 10,830 | 23,080 | 5,170 | 39,080 |
| 37.1% | 32.4% | 30.5% | 27.7% | 59.1% | 13.2% | 100.0% | |
| Saskatchewan | 9,590 | 9,990 | 9,210 | 7,440 | 16,450 | 4,900 | 28,790 |
| 33.3% | 34.7% | 32.0% | 25.8% | 57.1% | 17.0% | 100.0% | |
| Alberta | 38,140 | 35,420 | 14,070 | 33,140 | 47,960 | 6,530 | 87,630 |
| 43.5% | 40.4% | 16.1% | 37.8% | 54.7% | 7.5% | 100.0% | |
| British Columbia | 58,520 | 61,340 | 36,590 | 44,630 | 92,150 | 19,670 | 156,450 |
| 37.4% | 39.2% | 23.4% | 28.5% | 58.9% | 12.6% | 100.0% | |
| Nunavut | 420 | 400 | 110 | 250 | 600 | 80 | 930 |
| 45.2% | 43.0% | 11.8% | 26.9% | 64.5% | 8.6% | 100.0% | |
| Northwest Territories | 640 | 680 | 340 | 440 | 930 | 290 | 1,660 |
| 38.6% | 41.0% | 20.5% | 26.5% | 56.0% | 17.5% | 100.0% | |
| Yukon | 680 | 560 | 790 | 430 | 970 | 630 | 2,030 |
| 33.5% | 27.6% | 38.9% | 21.2% | 47.8% | 31.0% | 100.0% | |
| Canada | 437,100 | 476,010 | 509,160 | 363,840 | 737,390 | 321,040 | 1,422,270 |
| 30.7% | 33.5% | 35.8% | 25.6% | 51.8% | 22.6% | 100.0% | |
1.5 EI Regular Benefit Claims, by Education Level
As discussed in Chapter 1, individuals with higher educational attainment tend to experience more successful labour market outcomes than those with less education. Chart 14 compares the distribution of employment by the educational level required for their occupation with the distribution of EI regular claimants by educational attainment in 2011/12.
Individuals employed in occupations that did not require a high school diploma accounted for 13.2% of employees but represented 21.2% of all EI regular claimants. However, employees in occupations that required a university degree accounted for 18.8% of employment but represented only 7.5% of EI regular claimants. As discussed in previous reports, the inverse relationship between educational attainment and use of EI regular benefits has remained over time.
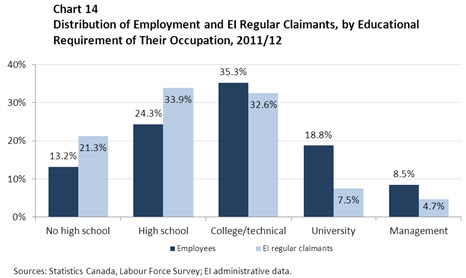
Table equivalent of Chart 14
| No high school | High school | College/technical | University | Management | |
|---|---|---|---|---|---|
| Employees | 13.2% | 24.3% | 35.3% | 18.8% | 8.5% |
| EI regular claimants | 21.3% | 33.9% | 32.6% | 7.5% | 4.7% |
2. Coverage of EI Regular Benefits
The EI program's definition of coverage is similar to that of other insurance programs, in the sense that paying premiums constitutes its most important element. Individuals are considered covered by the EI program if they have paid EI premiums in the previous 12 months.
According to the Employment Insurance Coverage Survey (EICS), Footnote 27 there were 1,344,700 unemployed individuals in Canada (shown as U in Chart 15) in 2011. Footnote 28 This represents a 4.6% drop from the 1,410,200 unemployed individuals reported in 2010, mostly due to the improving economic conditions in 2011, as discussed in Chapter 1.
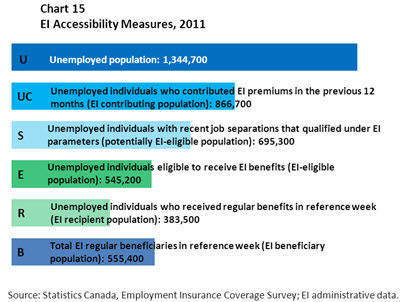
Table equivalent of Chart 15
| Measures | 2011 |
|---|---|
| Unemployed population | 1,344,700 |
| EI contributing population | 866,700 |
| Potentially EI-eligible population | 695,300 |
| EI-eligible population | 545,200 |
| EI recipient population | 383,500 |
| EI beneficiary population | 555,400 |
The 2011 EICS estimated that, among the 1,344,700 unemployed individuals, 866,700 were covered by the EI program, as they had paid EI premiums in the previous 12 months before becoming unemployed (UC in Chart 15). They represented 64.5% of all unemployed people (from Chart 15, UC/U).
Those who had not paid EI premiums in the previous 12 months included individuals with non-insurable employment, individuals who had been unemployed for more than 12 months and people who had never worked. They represented 35.5% (478,000) of the unemployed population. The proportion of unemployed individuals who did not contribute to EI increased slightly from 35.3% in 2010 to 35.5% in 2011. Nevertheless, this proportion remains significantly higher than figures observed before the recession (30.0% in 2007).
The higher share of non-contributors to the EI program was due to the increase in the long-term unemployed population in both 2010 and 2011, which was attributable to the difficult labour market that remained in certain regions, industries and occupations following the late-2000s recession. As shown in Chart 16, 25.0% of the unemployed population in 2011 had not worked during the past year, compared with 17.6% in 2007. In addition, 7.1% of the unemployed population had never worked, and 3.4% of the unemployed population had not paid EI premiums due to the nature of their job, such as self-employment.
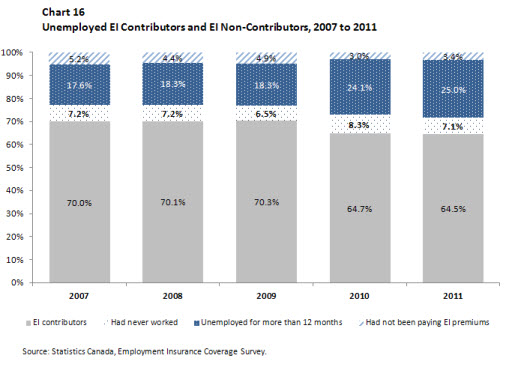
Table equivalent of Chart 16
| Year | EI contributors | Had never worked | Unemployed for more than 12 months | Had not been paying EI premiums |
|---|---|---|---|---|
| 2007 | 70.0% | 7.2% | 17.6% | 5.2% |
| 2008 | 70.1% | 7.2% | 18.3% | 4.4% |
| 2009 | 70.3% | 6.5% | 18.3% | 4.9% |
| 2010 | 64.7% | 8.3% | 24.1% | 3.0% |
| 2011 | 64.5% | 7.1% | 25.0% | 3.4% |
2.1 Coverage of EI Regular Benefits, by Province
The EI coverage rate, which was 64.5% in Canada in 2011, varied from province to province, ranging from 82.6% in the Atlantic provinces and 70.3% in Quebec, to 57.2% in Alberta and 56.4% in Ontario.
The differences in the composition of the unemployed population among the provinces help explain the variation in coverage rates. Those who were unemployed for more than 12 months accounted for the largest share of EI non-contributors in all provinces.
As indicated in Chart 17, in 2011, Ontario had the largest proportion of EI non-contributors (43.6%) among its unemployed population, while the Atlantic provinces had the smallest such proportion (17.4%). In particular, a significant share of Ontario's unemployed population had been unemployed for more than 12 months (30.5%), and a large share of its unemployed population had never worked or had not been paying EI premiums (13.1%).
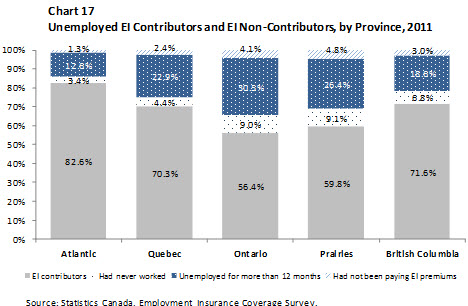
Table equivalent of Chart 17
| Province | EI contributors | Had never worked | Unemployed for more than 12 months | Had not been paying EI premiums | EI non-contributors |
|---|---|---|---|---|---|
| Atlantic | 82.6% | 3.4% | 12.6% | 1.3% | 17.4% |
| Quebec | 70.3% | 4.4% | 22.9% | 2.4% | 29.7% |
| Ontario | 56.4% | 9.0% | 30.5% | 4.1% | 43.6% |
| Prairies | 59.8% | 9.1% | 26.4% | 4.8% | 40.2% |
| British Columbia | 71.6% | 6.8% | 18.6% | 3.0% | 28.4% |
3. Eligibility for EI Regular Benefits
To be eligible for EI regular benefits, individuals must first be covered by the EI program by having paid EI premiums in the previous 12 months before the unemployment spell. In addition, they must have had a recent valid job separation(s), and accumulated enough insurable hours of work before the job separation(s).
3.1 Eligibility for EI Regular Benefits, Among the Unemployed Population
The 2011 EICS estimated that, among the unemployed population in 2011, there were 695,300 individuals who had a valid job separation that met the EI program parameters, making them potentially eligible for EI (potentially EI-eligible population, S in Chart 15). They represented 51.7% of the unemployed population in 2011 (from Chart 15, S/U, see Chart 18).
Among the remaining 48.3% of the unemployed population, there were unemployed individuals who did not contribute premiums to the EI program in the previous 12 months (35.5% of the unemployed population), as discussed in the previous section. However, there were also 171,400 unemployed individuals whose job separation did not meet the EI program's parameters (12.7% of the unemployed population). These included unemployed individuals who quit their job without an acceptable cause Footnote 29 (7.4% of the unemployed population) and those who quit their job to go to school and could not qualify (5.3% of the unemployed population).
Among the 51.7% of the unemployed population who had contributed EI premiums recently and had a recent job separation that qualified under the EI program, 78.4% were eligible to receive EI regular benefits Footnote 30 in 2011 (from Chart 15, E/S), for a total of 545,200 individuals (E in Chart 15). This EI eligibility rate decreased by 5.5 percentage points from 83.9% in 2010 and was the lowest rate reported since 2003, the earliest period for which there are comparable data.
The remaining 21.6% of the unemployed population who had contributed and had a valid job separation (or 11.2% of the unemployed population) had not worked enough insurable hours to qualify for EI benefits. This figure increased by 5.5 percentage points in 2011, from 16.1% in 2010.
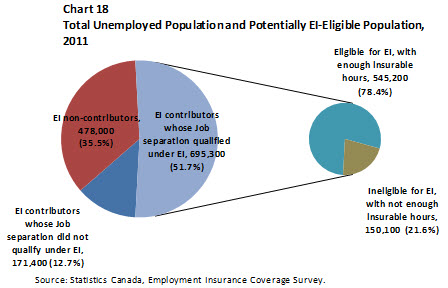
Table equivalent of Chart 18
| All Unemployed | 1,344,700 |
|---|---|
| EI contributors whose job separation did not qualify under EI | 171,400 |
| EI Non-Contributors | 478,000 |
| EI contributors whose job separation qualified under EI | 695,300 |
| Eligible for EI, with enough insurable hours | 545,200 |
| Ineligible for EI, with not enough insurable hours | 150,100 |
3.1.1 EI Eligibility Among the Unemployed Population, by Labour Market Characteristics
Hours-based eligibility for EI is influenced by work patterns and can vary depending on job tenure and individual labour market characteristics.
| 2011 (%) | 2010 (%) | 2009 (%) | 2008 (%) | 2007 (%) | |
|---|---|---|---|---|---|
| EI Eligibility Rate (E/S Ratio) Footnote 31 | 78.4 | 83.9 | 86.2 | 82.2 | 82.3 |
| …for people who had worked full time | 88.5 | 90.3 | 91.2 | 91.1 | 90.0 |
| …for people who had worked part time | 33.4 | 46.4 | 49.5 | 35.8 | 33.6 |
| …for people who had worked full and part time | 67.4 | 76.7 | 83.9 | 70.0 | 81.0 |
| …for people who had worked in a permanent position | 87.2 | 92.4 | 92.2 | 87.6 | 87.8 |
| …for people who had worked in a permanent full-time position | 91.2 | 94.5 | 94.3 | 92.7 | 91.1 |
| …for people who had worked in a permanent part-time position | 54.9 | 74.4 | 68.8 | 47.7 | 56.3 |
| …for people who had worked in a temporary position | 68.3 | 72.3 | 75.3 | 73.5 | 74.1 |
| …for people who had worked in a temporary seasonal position | 81.2 | 83.6 | 81.4 | 85.0 | 84.4 |
| …for people who had worked in a temporary non-seasonal position | 60.0 | 64.7 | 70.5 | 63.8 | 65.2 |
There are several possible explanations for the decrease of the EI eligibility rate in 2011, each closely associated with the labour market characteristics of the unemployed population in 2011. First, the EI eligibility rate rose significantly in 2009 to 86.2%, the highest rate since comparable data were published in 2003.
There was a higher-than-usual proportion of unemployed EI contributors who were previously permanent full-time workers in 2009, as a result of the late-2000s recession. Their share of the population increased sharply during the recession, going from 51.0% of the potentially EI-eligible population in 2008 to 58.4% of the potentially EI-eligible population in 2009. These workers were more likely to have accumulated enough insurable hours to be eligible for the EI program and, as a result, were more likely to be eligible for EI regular benefits, with an EI eligibility rate of 94.3% in 2009. This helped push up the EI eligibility rate of the total unemployed population to a high of 86.2% in 2009.
A recent study Footnote 32 using the Canada Out-of-Employment Panel Survey (COEP) showed that individuals' work patterns influence the likelihood of being eligible for EI regular benefits. The study found that the likelihood of being eligible for EI regular benefits is higher for full-time permanent job separators, while it is lower for temporary non-seasonal non-permanent workers.
However, in 2010 and 2011, there was another shift in the composition of the potentially EI-eligible population. The share of individuals who worked in temporary, non-seasonal or permanent part-time employment grew, and the proportion who worked in permanent full-time employment fell.
As shown in Chart 19, the proportion of temporary non-seasonal workers increased from 19.8% of the potentially EI-eligible population in 2009 to 24.7% in 2010 and a high of 28.1% in 2011. These workers were less likely to have accumulated enough insurable hours to qualify for the EI program and, as a result, were less likely to be eligible for EI regular benefits, with an EI eligibility rate of 60.0% in 2011. Their EI eligibility rate fell in 2011, from 64.7% in 2010 and 70.5% in 2009.
In addition, the proportion of permanent part-time workers increased from 4.6% of the potentially EI-eligible population in 2009 to 6.0% in 2011. These workers were also less likely to have accumulated enough insurable hours to be eligible for the EI program and less likely to be eligible for EI regular benefits, with an EI eligibility rate of 54.9% in 2011. Their EI eligibility rate fell significantly in 2011, from 74.4% in 2010.
Meanwhile, those who worked in permanent full-time employment accounted for 45.3% of the potentially EI-eligible population in 2011, with their share dropping steeply from 58.4% of the potentially EI-eligible population in 2009. As a result of the increase in temporary non-seasonal workers and the decrease in permanent full-time workers as a share of potentially EI-eligible contributors, the EI eligibility rate decreased significantly in 2011.
Furthermore, the average duration of employment for temporary non-seasonal workers has declined recently. Potentially EI-eligible contributors who have fewer than 700 hours of insurable employment risk being ineligible for EI regular benefits. In 2011, core-aged workers who held temporary non-seasonal positions saw a decline in their average number of hours worked, from 840 hours in 2010 to 640 hours in 2011. The number of insurable hours worked is the only measure considered when determining an unemployed individual's eligibility for EI regular benefits. As such, the decrease in the average number of hours worked by these workers contributed significantly to the drop in their EI eligibility rate to 60.0% in 2011.
The shift toward temporary non-seasonal and permanent part-time employment among these potentially EI-eligible contributors, and the decline in the average employment duration of temporary non-seasonal workers, suggest that it has become more difficult to find stable employment in the aftermath of the recession, at least in certain industries, occupations or regions.
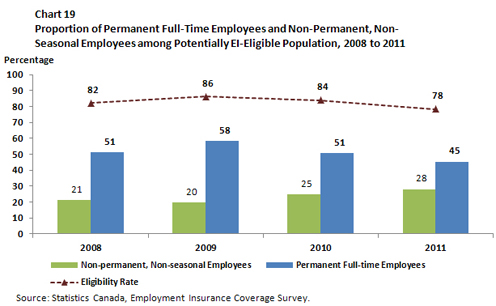
Table equivalent of Chart 19
| 2008 | 2009 | 2010 | 2011 | |
|---|---|---|---|---|
| % of Potentially EI-Eligible Population | ||||
| Permanent Full-time Employees | 51.0% | 58.4% | 50.9% | 45.3% |
| Non-permanent, Non-seasonal Employees | 21.4% | 19.8% | 24.7% | 28.1% |
| EI Eligibility Rate (E/S Ratio) | 82.1% | 86.2% | 83.9% | 78.4% |
3.1.2 EI Eligibility Among the Unemployed Population, by Province
The 2011 EICS data suggest that eligibility rates differ significantly across provinces. For example, in 2011, eligibility rates ranged from lows of 73.5% in Manitoba and 74.3% in Ontario to a high of 93.3% in Newfoundland and Labrador (see Chart 20). The variation in provincial eligibility has existed for several years, but recent results show the most significant variations among provinces in the past decade.
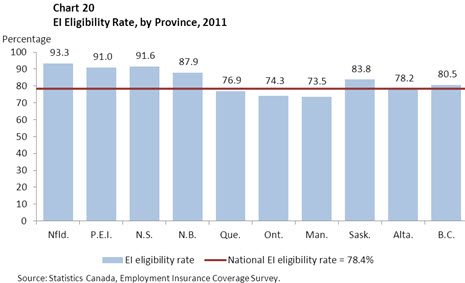
Table equivalent of Chart 20
| Province | EI Eligibility Rate (E/S Ratio) (%) |
|---|---|
| Nfld. | 93.3 |
| P.E.I. | 91.0 |
| N.S. | 91.6 |
| N.B. | 87.9 |
| Que. | 76.9 |
| Ont. | 74.3 |
| Man. | 73.5 |
| Sask. | 83.8 |
| Alta. | 78.2 |
| B.C. | 80.5 |
| Canada | 78.4 |
Compared with 2010 EICS figures, the EI eligibility rate decreased significantly in 6 of the 10 provinces, while it increased in Saskatchewan and British Columbia. It remained essentially unchanged in Newfoundland and Labrador, as well as Prince Edward Island. The largest decreases were observed in Manitoba (73.5% in 2011, from 84.2% in 2010), Alberta (78.2% in 2011, from 88.4% in 2010), Quebec (76.9% in 2011, from 85.4% in 2010) and Ontario (74.3% in 2011, from 81.0% in 2010). As previously explained, the decrease in provincial eligibility rates in 2011 is associated with significant increases in the share of potentially EI-eligible contributors who last worked in temporary, non-standard employment or permanent, part-time employment, as well as a notable decline in the share of potentially EI-eligible contributors who last worked in a permanent, full-time position.
One explanation for the differences in provincial eligibility rates among the unemployed population is the variation in regional unemployment rates. The variable entrance requirements (VER) ensure that the hours necessary to become eligible for EI regular benefits are adjusted to reflect regional unemployment rates. As such, low unemployment rates lead to higher entrance requirements, and high unemployment rates to lower access requirements. In general, Ontario, the Prairies and British Columbia have a higher proportion of low unemployment regions than the Atlantic provinces do, and this helps explain why the Atlantic provinces have a higher EI eligibility rate than other regions do.
3.1.3 EI Eligibility Among the Unemployed Population, by Demographic Group
EI eligibility rates also decreased for all demographic groups (see Chart 21). The EI eligibility rate for women declined from 84.4% in 2010 to 77.0% in 2011, and that for men dropped from 83.6% to 79.4%. As reported in previous EI Monitoring and Assessment Report(s), gender differences in eligibility reflect different employment characteristics among men and women. A higher proportion of men than women hold full-time and/or permanent jobs; women tend to be overrepresented among those working in part-time and/or temporary jobs. A recent study Footnote 33 showed that the gender differences in eligibility rates may be attributable to the fact that a higher proportion of women do not have a valid job separation.
| 2011 | 2010 | 2009 | 2008 | 2007 | |
|---|---|---|---|---|---|
| EI Eligibility Rate (E/S Ratio)(%) Footnote 34 | 78.4 | 83.9 | 86.2 | 82.2 | 82.3 |
| …for unemployed youth | 42.1 | 48.4 | 62.8 | 51.9 | 45.9 |
| …for unemployed adult women | 82.0 | 89.6 | 88.3 | 86.4 | 87.7 |
| …for unemployed adult men | 87.4 | 89.5 | 91.8 | 90.6 | 90.4 |
| …for immigrants | 79.0 | 80.7 | 84.3 | 81.6 | 87.6 |
Workers aged 25 to 45 years old suffered the steepest decline in their EI eligibility rate, from 89.9% in 2010 to 81.7% in 2011. Youth (aged 15 to 24) had the lowest EI eligibility rate (42.1%) among all age groups. Youth eligibility has declined steadily over the last three years; it was 48.4% in 2010 and 62.8% in 2009. The above-mentioned study found that the low eligibility rate for youth may be associated with two factors: many young people quit their job to go to school, and they did not accumulate enough insurable hours to qualify for EI regular benefits.
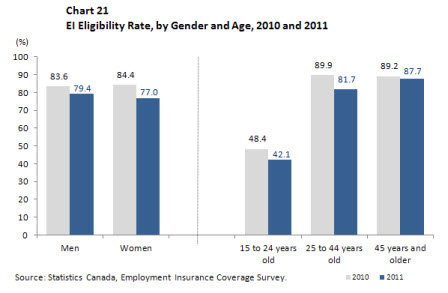
Table equivalent of Chart 21
| EI Eligibility Rate (E/S Ratio) (%), 2010 | |
|---|---|
| Gender | |
| Men | 83.6 |
| Women | 84.4 |
| Age | |
| 15 to 24 years old | 48.4 |
| 25 to 44 years old | 89.9 |
| 45 years and older | 89.2 |
| EI Eligibility Rate (E/S Ratio) (%), 2011 | |
| Gender | |
| Men | 79.4 |
| Women | 77.0 |
| Age | |
| 15 to 24 years old | 42.1 |
| 25 to 44 years old | 81.7 |
| 45 years and older | 87.7 |
3.1.4 EI Eligibility Among the Unemployed Population, from Records of Employment
In addition to the EICS, another source often used to examine the eligibility of unemployed individuals for EI regular benefits is the Record of Employments (ROE). As previously discussed, access to EI benefits is based on the Variable Entrance Requirement (VER). Individuals living in EI economic regions with high unemployment rates require fewer insured hours of employment to qualify for benefits than do people in regions with lower unemployment rates, reflecting their higher probability of being unemployed. The number of hours needed to qualify for regular benefits ranges from 420 hours, in regions where the unemployment rate is 13.1% or higher, to 700 hours, in regions where the unemployment rate is 6% or lower.
An evaluation study Footnote 35 showed that high unemployment regions had a larger proportion of individuals with sufficient accumulated hours to meet the entrance requirements than did low unemployment regions (see Chart 22). In 2011, in regions of 13.1% unemployment or higher, 86.0% of job separations occurred after the individual had accumulated enough hours of work to qualify for EI regular benefits. Conversely, in regions of low unemployment (6.0% or lower), only 70.6% of job separations occurred after the individual had accumulated sufficient hours of work. Footnote 36 This finding suggests that while the VER provision takes regional labour market conditions into account, clients in regions with higher unemployment rates have relatively easier access to EI.
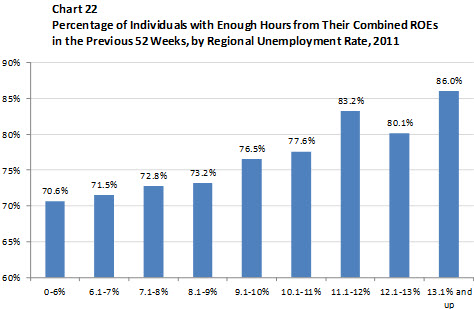
Table equivalent of Chart 22
| Regional Unemployment Rate | % with Enough Hours |
|---|---|
| 0-6% | 70.6% |
| 6.1-7% | 71.5% |
| 7.1-8% | 72.8% |
| 8.1-9% | 73.2% |
| 9.1-10% | 76.5% |
| 10.1-11% | 77.6% |
| 11.1-12% | 83.2% |
| 12.1-13% | 80.1% |
| 13.1% and up | 86.0% |
3.2 EI Eligibility for Regular Benefits, Among the Employed Population
This subsection is mainly based on an analysis of data from the Survey of Labour and Income Dynamics (SLID) Footnote 37 that explores the hours worked by employees based on a hypothetical layoff scenario. This analysis measures the proportion of employees who would have had sufficient insured hours over the qualifying period to meet regional EI entrance requirements—ranging from 420 to 700 hours for most individuals to 910 hours for new entrants and re-entrants (NEREs) Footnote 38 —if all workers had been laid off in December of the year studied.
The SLID-based simulations suggest that 87.8% of individuals who were working as paid employees in December 2010 would have been eligible for regular benefits if they had lost their job at the end of the month. Footnote 39 The eligibility rate among the employed population in 2010 was the same as that in 2009 (87.8%) but slightly lower than that in 2008 (89.3%).
The decline in the regular benefit eligibility rate in comparison to 2008 may be attributable to the increase in the proportion of NEREs and part-time workers among the employed population. NEREs represented 21.8% of all paid workers in 2008, but this proportion increased to 27.0% in 2009. Despite decreasing to 23.0% in 2010, it remained higher than pre-recession levels. Similarly, the proportion of individuals who worked part-time jobs also increased, from 14.9% in 2008 to 17.6% in 2009, with the proportion remaining above pre-recession levels at 16.5% in 2010. Given that both NEREs and part-time workers tend to have lower eligibility rates than non-NEREs and full-time workers, the increased prevalence of these two groups among the employed population contributed to a decline in the overall lower eligibility rate observed in both 2009 and 2010.
According to simulations using SLID, NEREs had a considerably lower regular benefit eligibility rate in 2010 than non-NEREs did (61.1% vs. 95.7%). Their lower eligibility rate is due to their limited work experience and the fact that they are required to accumulate more hours to qualify for EI regular benefits. Compared to 2009, the eligibility rate for NEREs decreased by 3.3 percentage points from 64.4%, while that for non-NEREs dropped slightly by 0.8 percentage points from 96.5%.
Based on SLID data, the proportion of unemployed individuals with sufficient hours to claim regular benefits varied only slightly across the country, ranging from 89.1% in the Atlantic region to 85.4% in British Columbia (see Chart 23). The eligibility rate was highest in Prince Edward Island (91.7%) and Newfoundland and Labrador (90.9%), while the rates for the remaining two Atlantic provinces were closer to the national average. The eligibility rates in Ontario (88.3%), Quebec (88.1%) and Saskatchewan (87.8%) were higher than the national average, while rates were lower than the national average in Manitoba (87.5%), Alberta (87.1%), and British Columbia (85.4%).
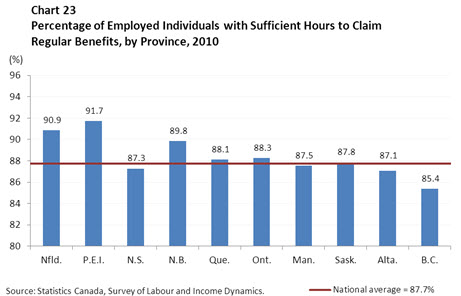
Table equivalent of Chart 23
| Nfld. | 90.9 |
|---|---|
| P.E.I. | 91.7 |
| N.S. | 87.3 |
| N.B. | 89.8 |
| Que. | 88.1 |
| Ont. | 88.3 |
| Man. | 87.5 |
| Sask. | 87.8 |
| Alta. | 87.1 |
| B.C. | 85.4 |
| Canada | 87.7 |
The regular benefit eligibility rate in 2010 was lower for women (85.6%) than for men (89.9%), primarily because women were more likely to be working part-time, and also more likely to be NEREs. However, women had a slightly higher eligibility rate than men (95.0% vs. 94.6%) among individuals who were employed in full-time jobs.
Male part-time workers (50.2%), female part-time workers (58.2%) and youth workers aged 17 to 24 (65.0%) had the lowest regular benefit eligibility rates in 2010. The low eligibility rate for part-time workers is explained by the fact that they work relatively fewer hours compared with full-time workers. In addition, youth and male part-time workers are more likely to be considered NEREs than their older, full-time worker counterparts.
3.3 New Entrant/Re-Entrant Provision
The NERE provision requires individuals who are new to the labour force, as well as those returning after an extended absence, to meet a higher EI eligibility requirement. Specifically, the provision requires NEREs to have 910 hours of insurable employment in their qualifying period, rather than the 420 to 700 hours required for other claimants.
The NERE provision seeks to encourage work attachment and strengthen the relationship between work effort and entitlement to benefits by ensuring workers make a reasonable contribution to the EI program before collecting benefits.
In 2011/12, a total of 6,370 EI regular claimants qualified as NERE claimants, which amounted to 0.4% of all EI regular claimants. Administrative data show that workers aged 25 to 44 and occasional claimants were over-represented among claimants affected by the provision, as these individuals tend to exhibit weaker labour force attachment than older and long-tenured workers do. Of those claimants affected by the NERE provision, 55.9% were aged 25 to 44, while these workers accounted for 44.1% of all EI regular claimants. Similarly, occasional claimants represented 67.7% of NERE claimants, but accounted for 51.8% of all EI regular claimants. Additionally, male claimants accounted for 69.7% of those claimants affected by the NERE provision, whereas they comprised 60.2% of all EI regular claimants.
4. Accessibility to EI Regular Benefits
To access EI benefits, individuals must be covered by the EI program by having paid EI premiums, be targeted by the EI program with a valid job separation under EI regulations, be eligible by having accumulated enough insurable hours, and meet other requirements under EI legislation.
The EI access rate (R/S ratio) can be calculated by dividing the number of unemployed individuals who received regular benefits in the EICS reference week by the number of unemployed individuals with a recent job separation that met the EI program eligibility criteria (from Chart 15, R/S). The R/S ratio is considered more relevant than other accessibility measures, as it considers only the unemployed individuals who fall within the parameters of the program.
Access to EI regular benefits can differ from eligibility for EI for a number of reasons. Footnote 40 For instance, eligible individuals may decide not to establish an EI claim, or individuals may make a claim but decide not to collect EI benefits.
In 2011, among unemployed individuals with a recent job separation that met the EI criteria, 55.1% of the potentially EI-eligible population, or 383,500 individuals (R in Chart 15), received regular benefits during the reference week, compared with 62.7% in 2010 and 59.7% in 2009 (from Chart 15, R/S).
Similar to eligibility for benefits (E/S), accessibility to EI regular benefits (R/S) varies by demographics, labour market characteristics and province. For the first time in several years, the EI access rate was lower for men (55.0%) than for women (55.4%) in 2011. The rate among men decreased significantly in 2011, falling 8.5 percentage points from 63.5% in 2010. This decrease was consistent with the decrease in men's EI eligibility rate, as discussed above in section II. 3.1.3.
Youth (aged 15 to 24) and part-time workers had low EI access rates in 2011, at 28.9% and 14.7%, respectively, particularly when compared with adults (25 years or older) (60.0%) and full-time workers (65.2%). In fact, part-time workers witnessed a significant decrease of 14.5 percentage points in 2011, from 43.4% to 28.9%.
Among provinces, the EI access rate ranged from 50.4% in Ontario to 75.2% in the Atlantic provinces in 2011. Alberta's rate changed by the greatest amount, decreasing from 66.0% in 2010 to 52.2% in 2011 (see Chart 24).
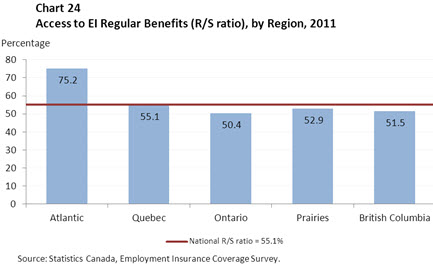
Table equivalent of Chart 24
| Province | EI Access Rate (R/S Ratio) (%), 2011 |
|---|---|
| Atlantic | 75.2 |
| Quebec | 55.1 |
| Ontario | 50.4 |
| Prairies | 52.9 |
| British Columbia | 51.5 |
| Canada | 55.1 |
Another measure, the beneficiaries-to-unemployed ratio (from Chart 15, B/U), is often used as an indicator of accessibility to the EI program. The B/U ratio Footnote 41 has the advantage of simplicity and historical availability. However, it has a number of serious limitations. First, its denominator (the unemployed population) includes many people who are outside the parameters of the EI program, such as individuals who have gone back to school, those who did not pay EI premiums during the last 12 months or those who quit their jobs without just cause. Second, its numerator (total regular beneficiaries in the reference week) includes EI beneficiaries who are not unemployed, such as claimants who received both EI benefits and employment earnings in a given week (see section III of this chapter for more information on the Working While on Claim provision). Third, the numerator and the denominator of the B/U ratio come from two separate sources, as the numerator comes from Statistics Canada's monthly EI Statistics release and the denominator comes from Statistics Canada's Labour Force Survey. The R/S ratio remains a more appropriate measure of EI access than the B/U ratio.
In 2011, the B/U ratio was 41.3%, dropping significantly from 46.4% in 2010. This was the lowest rate reported since the turn of the century. As previously explained, the decrease in 2011 is associated with notable declines in the share of EI contributors with a valid job separation who last worked in a permanent, full-time position.
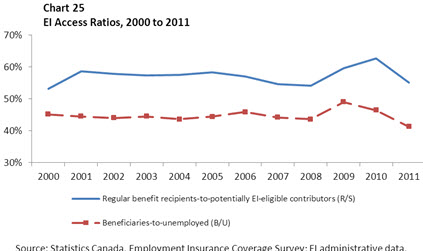
Table equivalent of Chart 25
| Year | Regular benefit recipients-to-potentially EI-eligible contributors (R/S) |
Beneficiaries-to-unemployed (B/U) |
|---|---|---|
| 2000 | 53.2% | 45.1% |
| 2001 | 58.6% | 44.5% |
| 2002 | 57.8% | 44.0% |
| 2003 | 57.3% | 44.5% |
| 2004 | 57.5% | 43.6% |
| 2005 | 58.3% | 44.4% |
| 2006 | 57.0% | 45.9% |
| 2007 | 54.6% | 44.2% |
| 2008 | 54.1% | 43.6% |
| 2009 | 59.7% | 49.0% |
| 2010 | 62.7% | 46.4% |
| 2011 | 55.1% | 41.3% |
5. Level of EI Regular Benefits
Under the Employment Insurance Act, the maximum insurable earnings threshold (MIE) for EI reflects the calculated value of annual average earnings, called the projected annual average earnings value (PAAE). Footnote 42 The PAAE is based on the average weekly earnings of the industrial aggregate in Canada, as published by Statistics Canada.
The MIE was $43,200 in 2010, $44,200 in 2011 and $45,900 in 2012. Accordingly, the maximum weekly benefit was $457 in 2010, $468 in 2011 and $485 in 2012. The proportion of regular claimants receiving the maximum weekly benefit increased from 40.3% in 2010/11 to 41.3% in 2011/12. This increase reverses a two-year decline observed in 2009/10 and 2010/11, which was attributable to the effects of the late-2000s recession on work attachment and to weaker growth in average earnings.
A claimant's history of collecting benefits has an impact on the likelihood that he or she will receive the maximum weekly benefit. In 2011/12, 55.3% of long-tenured workers and 47.1% of frequent claimants who established an EI claim were entitled to the maximum weekly benefit, in contrast to only 41.3% of occasional claimants.
On average, EI regular claimants were entitled to an average weekly benefit of $384 in 2011/12, a 3.5% increase from $371 in 2010/11. Using the new EI history definitions, long-tenured workers were entitled to $416 in average weekly benefits for EI regular benefits, while frequent claimants were entitled to $399 in average weekly benefits in 2011/12. Occasional claimants were entitled to $361 in average weekly benefits.
Men were entitled to $408 and women to $347 on average in weekly benefits for EI regular benefit claims established in 2011/12. While the difference in average weekly regular benefit reflects the earnings gap between men and women, a general trend of strong growth in women's average weekly regular benefit rates means that the gap is gradually closing. In 2011/12, the average weekly regular benefit for women was 84.9% of that for men, compared with 71.1% in 2000/01.
Historically, the average weekly benefit for EI regular benefits has increased every year. However, growth rates of the average weekly benefit have fluctuated in recent years, due in part to the effects from the late-2000s recession (see Chart 26). The average weekly benefit for EI regular benefits increased by 4.9% in 2008/09, but only increased by 0.8% in 2009/10 and 1.1% in 2010/11, due to the weaker growth in average earnings, and the MIE associated with the average earnings, during the recent recession. The growth rate only returned to pre-recession levels in 2011/12, with a 3.5% increase in the average weekly benefit from the previous year.
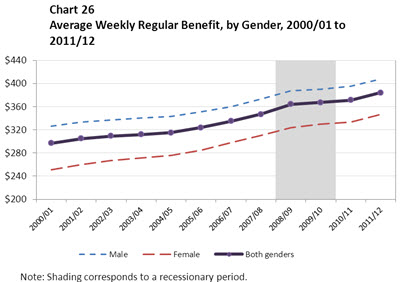
Table equivalent of Chart 26
| Year | Male | Female | Both genders |
|---|---|---|---|
| 2000/01 | $326 | $251 | $297 |
| 2001/02 | $333 | $260 | $305 |
| 2002/03 | $337 | $267 | $309 |
| 2003/04 | $340 | $271 | $312 |
| 2004/05 | $343 | $276 | $315 |
| 2005/06 | $351 | $285 | $324 |
| 2006/07 | $360 | $298 | $335 |
| 2007/08 | $373 | $310 | $347 |
| 2008/09 | $387 | $324 | $364 |
| 2009/10 | $390 | $330 | $367 |
| 2010/11 | $395 | $333 | $371 |
| 2011/12 | $408 | $347 | $384 |
As reported in the 2011 Monitoring and Assessment Report, EI is the most important source of income replacement among EI beneficiaries and helps mitigate the financial hardship of being unemployed. Footnote 43 Another study Footnote 44 on the financial impact of receiving EI concludes that EI reduces the incidence of low income among beneficiaries by half (from 14% to 7%). The study considers different sources of income that unemployed individuals can rely on and concludes that EI is the most significant income-stabilizing factor among beneficiaries. Another study finds that EI tends to mitigate the financial hardship of unemployment and noted that for the period analyzed, 2004 to 2009, benefits were the main source of household income for about half of all EI beneficiaries.
The effective replacement rate, which is the actual proportion of earnings replaced by EI regular benefits, provides further insight into the adequacy of EI benefits. The EI program is designed to replace 55% of previous employment earnings up to the MIE threshold.
A study Footnote 45 based on the SLID and the EICS found that, between 2001 and 2010, the average effective replacement rate was 48% and 50%, according to the EICS and SLID, respectively. The study also found that 62% of regular beneficiaries in 2009 and 2010 received regular benefits that equated to 55% of their previously insured employment earnings.
This study also found that, over a 10-year period (2001–2010), the proportion of beneficiaries receiving 55% of their prior earnings declined every year, by an average of 1.5 percentage points per year. This decline over time is explained by the fact that, for several years, average wage rates increased at a faster pace than the MIE. In fact, the MIE was frozen from 1996 to 2006, but it has increased every year since then. Over the 2001–2010 period, the average effective replacement rate was 48% and 50%, according to the EICS and SLID, respectively.
5.1 Working While on Claim Provision
This section analyzes the Working While of Claim (WWC) provision. As part of Economic Action Plan 2012, a new WWC pilot project has come into effect, under which eligible claimants can keep EI benefits equalling 50% of every dollar earned while on claim. This new pilot project will ensure that EI claimants always benefit from accepting more work by allowing them to keep more of what they earn while on EI and supporting their search for permanent employment. The section also analyses amendments to the provision from the WWC pilot project as it was in place during the 2011/12 fiscal year, before the new WWC pilot project came into effect.
The purpose of the WWC provision is to encourage work attachment by allowing claimants to accept all available work while receiving EI benefits. The provision applies to regular, fishing, parental and compassionate care benefits. Under the provision, claimants may earn the greater of 25% of their weekly benefit or $50, without a reduction in their weekly benefit. Employment earnings above this threshold are deducted dollar-for-dollar from the claimant's weekly benefit. If a claimant's weekly benefit is reduced to zero, that week of entitlement may be deferred for later use within the same benefit period, which generally is one year from the start of the claim.
EI administrative data indicate that 801,100 claimants who established an EI claim in 2010/11 worked while on claim, Footnote 46 representing 43.0% of all EI claims established that year. Almost all of the claimants who worked while on claim (792,660 claimants or 98.5%) claimed regular benefits. Among all individuals who established regular claims in 2010/11, 55.8% worked while on claim. This proportion has remained relatively stable at around 55% for the last four years. The fact that over 50% of regular claimants work while receiving EI suggests that the likelihood of finding employment while on claim remains relatively high.
5.1.1 Working While on Claim Pilot Project
The previous WWC pilot project increased the amount EI claimants could earn while on claim, without a reduction in their benefits, from the greater of $50 or 25% of their weekly benefit (as per the WWC provision in the EI Act) to the greater of $75 or 40%. The WWC pilot project was introduced in 23 EI economic regions, on December 11, 2005, to test whether allowing beneficiaries to earn more income while claiming EI benefits would encourage them to accept all available work while receiving EI benefits. The pilot project was re-introduced in 2008 to all EI economic regions and renewed several times until August 4, 2012. Footnote 47
Frequent claimants are generally more likely to work while on claim than other claimants. In 2010/11, frequent claimants made up 25.9% of regular claimants who worked while on claim. These results reflect the fact that many frequent claimants have sporadic work patterns throughout the year, which are interspersed with periods during which they claim EI benefits. This work pattern may allow them to accumulate sufficient hours during their benefit period to subsequently qualify for another claim. Occasional claimants accounted for 51.0% of all regular claims, while they accounted for 51.2% of regular claimants who worked while on claim. Long-tenured workers accounted for 23.3% of all claims and 22.9% of regular claimants who worked while on claim.
Among the 792,660 regular benefit claimants who established a claim in 2010/11 and worked while on claim, 7.4% received full EI benefits, 20.7% received partial EI benefits, 22.8% received no EI benefits and deferred their weeks of entitlement and almost half (49.1%) received a mix of EI benefit deductions during the weeks they worked while on claim.
For regular claims established in 2010/11, claimants who worked while on claim were entitled to an average of 36.4 weeks of claims and reported earnings for an average of 12.8 of these weeks. Despite the changes to average entitlement and duration of regular benefits in recent years, average weeks of work while on claim have changed little over the last three years.
In terms of EI history, frequent claimants worked while on claim for an average of 16.0 weeks, compared with 11.4 weeks for occasional claimants and 12.4 weeks for long-tenured workers.
Recent amendments to the EI Regulations, from Economic Action Plan 2012, have introduced a new WWC pilot project that reduces a claimant's benefits by 50% of his or her earnings while on claim, starting with the first dollar earned. Specifically, for each dollar that a claimant earns while receiving EI benefits, the claimant's weekly benefit payment will be reduced by 50 cents, until the claimant's earnings reach 90% of the earnings used to establish his or her benefit rate. At that point, the claimant's benefits will be reduced dollar for dollar until benefits are reduced to zero, to ensure claimants do not receive more in earnings and benefits than they would have earned working full time.
Eligible EI claimants who had earnings between August 7, 2011 and August 4, 2012, and were covered by the provisions of the previous WWC pilot project can choose to revert to the rules of the previous WWC pilot project. Footnote 48 The new WWC pilot project will be analysed in future EI Monitoring and Assessment Report(s).
5.2 Small Weeks Provision
EI benefits are calculated using earnings in the 26-week period before the establishment of a claim. During that period, weeks with relatively lower earnings could reduce the benefits claimants receive. The objective of the Small Weeks provision is to encourage individuals to accept all available work by excluding weeks of earnings below $225 from the benefit calculation, provided that the number of weeks of earnings exceeds the minimum divisor, Footnote 49 which encourages workers to accept work beyond the minimum required to qualify for EI.
As noted in the 2010 Monitoring and Assessment Report, the Small Weeks provision was tested through multiple pilot projects from 1997 to 2001. Evaluation results Footnote 50 indicated that the provision increased total duration of work in the 26 weeks prior to job separation and increased the total average income of male and female participants. Based on these evaluation results, Small Weeks was made a permanent provision of the EI program in November 2001. In November 2005, the Best 14 Weeks pilot project replaced the Small Weeks provision in several EI economic regions of high unemployment. The Best 14 Weeks pilot project was renewed from June 26, 2011 to June 23, 2012 and was extended a second time until April 6, 2013. Consequently, the following analysis is based on the EI regions where the Best 14 Weeks pilot project was not in effect. Footnote 51
The Small Weeks provision affected 222,460 of all claims established in 2011/12, or 18.0% of claims in EI regions where the Best 14 Weeks pilot project was not in effect. Small Weeks claimants received, on average, $21 more per week than they would have received had the provision not been in place, as the average weekly benefit for Small Weeks claims would have been $259, rather than $280.
The Small Weeks provision primarily benefits youth, women and occasional claimants, who are proportionally overrepresented in non-standard employment. In 2011/12, it benefited 27.6% of claimants aged 15 to 24, 16.4% of claimants aged 25 to 44 and 18.9% of older claimants. The share of women who benefited was significantly higher than that of men (22.6% vs. 13.7%). In 2011/12, the Small Weeks provision benefited 23.6% of occasional claimants, 15.2% of frequent claimants and 9.9% of long-tenured workers (see Chart 27).
Beginning April 7, 2013, a new legislated Variable Best Weeks approach will be used to calculate weekly EI benefits nationally, as discussed in sub-section 5.3. As a result, the Small Weeks provision will no longer exist and future reports will not report on this provision.
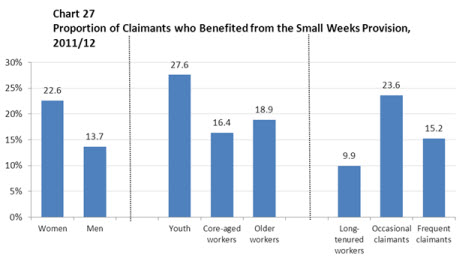
Table equivalent of Chart 27
| Women | 22.6% |
|---|---|
| Men | 13.7% |
| Youth | 27.6% |
| Core-aged workers | 16.4% |
| Older workers | 18.9% |
| Long-tenured workers | 9.9% |
| Occasional claimants | 23.6% |
| Frequent claimants | 15.2% |
5.2.1 Best 14 Weeks Pilot Project
The Best 14 Weeks pilot project tests whether basing claimants' benefit rate on their 14 weeks of highest earnings in the 52 weeks before they claim EI encourages claimants to accept all available work. The pilot calculates benefits based on a claimant's 14 weeks of highest earnings during the 52-week period preceding the start of the claim. This pilot project effectively replaces the Small Weeks provision in the EI pilot project regions. It also extends the rate calculation period, from 26 weeks preceding the claim to 52 weeks preceding the claim.
The Best 14 Weeks pilot project was introduced in 23 EI economic regions on October 30, 2005. It was re-introduced in 25 EI economic regions in 2008 and renewed several times until April 6, 2013. The Government of Canada announced, in Budget 2012, the introduction of a new method for calculating weekly EI benefits based on a new legislated national Variable Best Weeks approach, effective April 7, 2013. Future reports will examine the new rate calculation.
Administrative data indicate that 371,370 claimants received higher weekly benefits due to the Best 14 Weeks pilot project in 2011/12. Claimants benefiting from the pilot project represented 57.4% of all claimants in the EI pilot regions in 2011/12, compared with 58.0% in 2010/11. Women were significantly more likely to benefit from the pilot project; 74.5% of women in the pilot regions benefited from the pilot project compared with 46.0% of men.
Similarly, youth in the pilot regions were more likely to benefit from the pilot project; 72.0% of those under 25 received a higher weekly benefit compared with 56.4% of claimants aged 25 to 44, 55.2% of claimants aged 45 to 55 and 54.8% of older workers. Furthermore, occasional workers (69.0%) were more likely than long-tenured workers (49.9%) and frequent claimants (48.0%) to benefit from the pilot project.
Had the pilot project not been in place, the average weekly benefit of affected claimants in 2011/12 would have been $300, instead of $350. Footnote 52
5.3 Variable Best Weeks Provision
Economic Action Plan 2012 announced a number of changes to the EI program. One of these changes included a new, permanent and legislated approach to the way EI benefits are calculated.
Effective April 2013, EI claimants, with the exception of fishing and self-employed claimants, will have their EI benefit amounts calculated based on the highest weeks of insurable earnings during the qualifying period, which is generally 52 weeks. The number of weeks used for calculating benefit rates will range from 14 to 22, depending on the unemployment rate in the EI economic region where the claimant resides.
The new approach will make the EI program more responsive to changes in local labour markets and will ensure that those living in similar labour market conditions receive similar benefits. Footnote 53
5.4 Benefit Repayment Provision
To better reflect insurance principles, high-earning claimants of regular or fishing benefits who have received at least one week of regular or fishing benefits in the preceding 10 taxation years repay part of the benefits they receive. Footnote 54 In 2010, repeat EI beneficiaries whose net income exceeded $54,000 had to repay the lesser of 30 cents of every dollar in benefits they received or 30 cents for every dollar of net income above the threshold.
For the 2010 taxation year, Footnote 55 184,079 claimants of regular or fishing benefits repaid $210.2 million. The number of claimants who repaid benefits rose by 7.2% and the amount repaid was 6.2% higher than in 2009. On average, claimants repaid $1,142, which is slightly less (-0.9%) than they repaid in 2009 ($1,152). In 2010, claimants who repaid a portion of their benefits were on claim for an average of 11.8 weeks compared with 12.4 weeks in 2009. In 2010, these claimants received $4,915, on average, compared with $5,047 in 2009. The fact that claimants received fewer weeks of EI benefits and had lower repayments, on average, reflects an improvement of labour market conditions during 2010.
Men continued to comprise the vast majority of those who repaid benefits. They accounted for 89.0% of the total in 2010, a share that has remained stable for over a decade. The average repayment women made in 2010 was about 89.1% of that made by men ($1,030 compared with $1,156). This proportion has risen every year since 2006, when it was 80.3%.
The number of men and women who repaid a portion of their benefits increased by 7.3% and 7.2%, respectively. The number of claimants who repaid a portion of their benefits increased for all age groups in 2010. Among all age groups, youth (+43.3%) and older claimants (+11.6%) registered the most significant increases in claimants subject to benefit repayment. Older workers continued to be overrepresented among those who repaid benefits, while youth were underrepresented. Differences in benefit repayment between genders and among age groups reflect differences in pre-claim earnings among members of these groups and their likelihood to be repeat users of EI.
Individuals in the Atlantic provinces who had to repay benefits repaid higher amounts than claimants in the rest of Canada. For instance, claimants in Prince Edward Island who repaid a portion of their benefits were on claim for an average of 19.4 weeks and repaid $1,723, on average, while their counterparts in Ontario had an average claim duration of 10.4 weeks and repaid an average of $984. One factor explaining these differences is that repeat users of EI are overrepresented in Atlantic Canada and underrepresented in Ontario and the Western provinces. Another factor is that even high-income EI claimants require more weeks to find a new job in regions of high unemployment, which are more prevalent in Atlantic Canada, than in regions of low unemployment, which are more prevalent in Ontario and the Western provinces.
6. Entitlement to EI Regular Benefits
Overall, the average entitlement to regular benefits was 33.0 weeks in 2011/12, which is consistent with the six years prior to the late-2000s recession (see Table 8). Average entitlement to regular EI benefits was higher from 2008/09 to 2010/11. This was a result of two factors: automatic adjustments to the EI program, which increased entitlement to regular benefits to reflect higher unemployment rates in local labour markets; and the implementation of a temporary EI measure that provided five additional weeks of regular benefits up to a maximum of 50 weeks (the Extension of EI Regular Benefits). Therefore, the return of the average regular benefit entitlement to pre-recession levels in 2011/12 was expected, considering the overall decline in regional unemployment rates and the end of the temporary EI measures.
Regular benefit claimants have, on average, consistently used between 58% and 62% of their entitlement since 2002/03, which suggests that, despite changes in Canada's economic performance, the program has responded well to the needs of unemployed workers. After remaining almost unchanged for years, the proportion of entitlement used for claims established in 2010/11 increased by 4 percentage points, from 58.1% in 2009/10 to 62.1% in 2010/11. This recent increase is the result of sustained usage levels combined with the recent drop in entitlement levels as discussed above.
As in previous periods, the average percentage of EI benefit entitlement used for regular claims established in 2010/11 was highest in the Atlantic provinces, ranging from 65.4% in New Brunswick to 68.1% in Prince Edward Island. Yukon and Saskatchewan had the lowest percentage of entitlement used, at 52.1% and 57.2%, respectively. Ontario (61.4%) and Quebec (60.8%) registered average percentages of EI regular benefit entitlement used for claims established in 2010/11. Ontario's and Quebec's percentages were slightly lower than those in the previous year.
| Year | Average Regular Entitlement (Weeks) | Proportion of Average Regular Entitlement Used (%) |
|---|---|---|
| 2002/03 | 32.6 | 61.3 |
| 2003/04 | 32.8 | 60.9 |
| 2004/05 | 33.3 | 59.8 |
| 2005/06 | 32.9 | 59.7 |
| 2006/07 | 32.5 | 59.7 |
| 2007/08 | 31.8 | 60.6 |
| 2008/09 | 36.5 | 59.7 |
| 2009/10 | 42.8 | 58.1 |
| 2010/11 | 36.0 | 62.1 |
| 2011/12 | 33.0 | N/A |
Source: EI administrative data
Historically, women and men have used a similar proportion of their EI entitlement. That was also the case for claims established in 2010/11, when men used an average of 61.8% of their entitlement and women used an average of 62.5%.
Older workers (aged 55 years or older) tend to use more of the benefits to which they are entitled. This is due in part to the fact that it takes more time for older workers to find a new job, on average, than it does for members of other age groups. Among all age groups, older workers continued to use the highest percentage of their regular benefit entitlement, at 69.7%, compared with 58.9% for youth (aged 15 to 24), 59.7% for claimants aged 25 to 44, and 62.3% for those aged 45 to 54, based on claims established in 2010/11. All age groups saw their average EI entitlement usage increase when compared with their usage in the previous year. Older workers experienced a 5-percentage-points increase, the highest increase among all age groups.
Long-tenured workers tend to use less of their entitlement when compared with occasional and, especially, frequent claimants. This is consistent with the new definition for each group which is based on the number of EI regular or fishing benefit weeks claimed in the last five years. Footnote 56 For claims established in 2010/11, long-tenured claimants used 53.8% of their entitlement, while occasional claimants used 62.1% and frequent claimants used 71.4%. All three groups used more of their EI regular benefit entitlement for claims established in 2010/11 than they did for claims established in 2009/10. The fact that entitlement use among long-tenured workers remains high when compared with entitlement use over the past three years suggests that this group is continuing to use EI for a significant period while finding suitable employment.
7. Duration of EI Regular Benefits
On average, regular claimants who established a claim in 2010/11 received 21.5 weeks of regular benefits, a decrease of 2.3 weeks from an average of 23.8 weeks for claims established in 2009/10. This decrease in average duration of regular claims comes after two years of increases. It reflects the availability of fewer weeks due to the automatic adjustment of the program, as well as improved prospects in the labour market that makes it easier for claimants to find new employment.
A recent evaluation study Footnote 57 suggested that the effect of the program's automatic adjustments to regular entitlement, combined with the Extension of EI Regular Benefits temporary measure, led to an increase of 2.1 weeks in the duration of claims established between March 2008 and September 2010 and subject to the application of this temporary measure. Footnote 58
The average duration of EI regular benefits declined for all age groups in 2011/12 compared to the previous year. As noted earlier, older workers (individuals aged 55 years or older) tend to collect EI regular benefits for longer periods than members of other age groups. For claims established in 2010/11, older workers received 24.3 weeks of regular benefits on average, a decrease of 2.3 weeks from 2009/10 and 2.8 weeks more than the national average. In contrast, youth received 19.3 weeks of regular benefits on average in 2010/11, a decrease of 1.3 weeks from 2009/10 and 2.4 weeks less that the national average. Those aged 25 to 44 years old received 20.7 weeks on average, while those aged 45 to 54 years old received 22.2 weeks on average or EI regular benefits.
The average duration of EI regular benefits also declined for all EI history categories in 2010/11. Long-tenured workers who claimed regular benefits in 2010/11 received 22.1 weeks, on average, a decrease of 4.1 weeks from 2009/10 and 0.6 weeks more than the national average in 2010/11. Frequent claimants who established a regular claim in 2010/11 received 23.6 weeks on average, down from 24.4 weeks in 2009/10 and 1.1 weeks more than the national average in 2010/11. Occasional claimants who established a claim in 2010/11 received an average of 20.4 weeks, a decrease of 1.1 weeks compared with the previous year and 1.1 weeks below the national average in 2010/11.
7.1 Minimum Divisor Provision
The EI weekly benefit rate is determined by dividing earnings accumulated during the 26-week period before the establishment of the claim by the greater of the number of weeks the claimant worked in this period or the minimum divisor.
The minimum divisor ranges from 14 to 22 weeks Footnote 59 and is two weeks more than the minimum number of weeks a claimant is required to work Footnote 60 in order to qualify for benefits. The minimum divisor encourages workers to accept all available employment and provides claimants with a strong incentive to work beyond what is required to establish a claim, in order to avoid a reduced weekly benefit. Footnote 61
However, the Minimum Divisor provision did not apply in the 25 EI economic regions that were covered by the Best 14 Weeks pilot project in 2011/12, Footnote 62 as this pilot project effectively sets the divisor at 14 weeks in the pilot regions by having the best 14 weeks selected from a qualifying period of 52 weeks.
In 2011/12, the minimum divisor decreased benefits for 2.6% (23,590) of regular benefit claimants and 3.9% (14,460) of special benefit claimants in the non-pilot regions. Had the Best 14 Weeks pilot project not been in place, the divisor would have affected 4.6% of regular claims and 3.0% of special claims in the pilot project regions. Footnote 63
In 2011/12, claimants affected by the divisor received lower average weekly benefits than claimants not affected by the divisor. Regular benefit claimants who were affected by the divisor received an average weekly benefit of $294, compared to the national average of $380. In 2011/12, the divisor was more likely to affect regular EI beneficiaries who were women, older claimants (55 and older) or occasional claimants in the non-pilot regions.
Effective April 7, 2013, a new legislated Variable Best Weeks approach will be used to calculate weekly EI benefits nationally. As a result, the Minimum Divisor provision will no longer exist and future reports will not report on this provision; instead, they will analyse the Variable Best Weeks approach.
7.2 Extended EI Benefits Pilot Project
The Extended EI Benefits pilot project was introduced in 2004 for two years in 24 EI economic regions of high unemployment (10% or higher), to test whether providing more weeks of benefits would reduce the number of seasonal workers facing a gap between the exhaustion of their EI benefits and the resumption of their seasonal employment income. It was also designed to determine whether there would be any associated behavioural effects.
It was re-introduced in 2006 for 18 months in 21 EI economic regions and was later extended until May 31, 2009. The pilot was terminated in February 2009, with the introduction of the Extension of EI Regular Benefits temporary measure, as part of the Economic Action Plan, until September 11, 2010.
| Beneficiaries (Used at Least One Extra Week Provided) | Total EI Regular Claims in Pilot Region | Proportion of Beneficiaries as a Share of Total Regular Claims | |
|---|---|---|---|
| Total | 96,510 | 318,040 | 30.3% |
| Gender | |||
| Male | 59,900 | 220,600 | 27.2% |
| Female | 36,610 | 97,440 | 37.6% |
| Age | |||
| Under 25 years | 10,600 | 36,480 | 29.1% |
| 25 - 44 years | 34,890 | 123,790 | 28.2% |
| 45 - 54 years | 25,000 | 87,360 | 28.6% |
| 55 Years and Older | 26,020 | 70,410 | 37.0% |
| EI History | |||
| Long-Tenured Workers | 5,830 | 38,190 | 15.3% |
| Occasional Claimants | 39,530 | 127,950 | 30.9% |
| Frequent Claimants | 51,150 | 151,900 | 33.7% |
Source: EI administrative data.
The pilot project was then re-introduced, from September 12, 2010, to September 15, 2012, in the same 21 EI economic regions to allow further testing through a period of economic recovery; however, it may be terminated earlier if there is a sustained economic recovery. Footnote 64 Under the Extended EI Benefits pilot project, the maximum number of regular weeks of benefits is increased by five weeks, to a maximum of 45 weeks.
Among claims established in 2010/11 in the 21 pilot regions, Footnote 65 a total of 96,510 claimants used the additional weeks provided by the Extended EI Benefits pilot project, representing 30.3% of all EI regular benefit claimants during this period. These claimants received their benefit payments from this pilot project after they exhausted their regular entitlement, and so, many of these claimants accessed the additional weeks in 2011/12. As shown in Table 9, the pilot project was more likely to benefit women than men and older workers than other age groups.
Occasional claimants and frequent claimants were significantly more likely to benefit from the pilot project than were long-tenured workers.
As of March 31, 2012, $172.8 million in additional benefits had been paid as a result of the Extended EI Benefits pilot project. There were only $2.6 million in benefits paid in 2010/11, as the pilot project began in September 2010 and the claimants needed to exhaust their regular entitlement to receive benefit payments from this pilot project. In 2011/12, there were $170.2 million in additional benefits paid.
| 2010/11 | 2011/12 | Total | |
|---|---|---|---|
| Benefit Payments ($ Million) | 2.6 | 170.2 | 172.8 |
8. Entitlement Exhaustion of EI Regular Benefits
Another way to assess the adequacy of EI benefits is to examine the degree to which claimants exhaust their regular benefit entitlement. Claims are considered exhausted if the claimants use all the regular weeks to which they are entitled.
Among all regular claims established in 2010/11, 29.4% of claimants exhausted their regular benefits. This represents a significant increase for claims established in 2009/10 (24.8%) and 2008/09 (27.0%) respectively. The lower rates of exhaustion for claims established in 2008/09 and 2009/10 were the combined result of automatic adjustments to entitlement levels, linked to higher unemployment rates during the recession, and the EI temporary measures extending the entitlement to regular benefits.
For example, an evaluation study on the effects of the Extended Duration of Regular Benefits temporary measure Footnote 66 found that this measure decreased (by 4.8 percentage points) the likelihood that individuals covered by the measure would exhaust their regular benefits. When looking at the historical trend, the exhaustion rate for claims established in 2010/11 was consistent with those of pre-recession years (see Chart 28).
All provinces and territories (except the Northwest Territories) and all demographic groups shown in Table 11 experienced an increase in entitlement exhaustion rates for regular claims established in 2010/11 compared with claims established in the previous two years. This general increase in entitlement exhaustion rates could be attributed to automatic entitlement adjustments, which were linked to decreases in regional unemployment rates during this period, as well as to the end of the temporary EI measures implemented under the Economic Action Plan. Among provinces, British Columbia exhibited the highest exhaustion rate (35.3%) while Newfoundland and Labrador exhibited the lowest rate (24.6%). Among the territories, Yukon has consistently had very low exhaustion rates; its rate for claims established in 2010/11 was 13.7%.
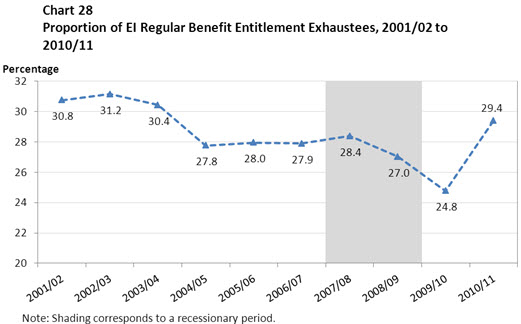
Table equivalent of Chart 28
| Year | Exhaustion Rates |
|---|---|
| 2001/02 | 30.8% |
| 2002/03 | 31.2% |
| 2003/04 | 30.4% |
| 2004/05 | 27.8% |
| 2005/06 | 28.0% |
| 2006/07 | 27.9% |
| 2007/08 | 28.4% |
| 2008/09 | 27.0% |
| 2009/10 | 24.8% |
| 2010/11 | 29.4% |
Men tend to have slightly lower entitlement exhaustion rates than women do. This difference is explained by the fact that, on average, women accumulate fewer insurable hours than men. As a result, women are generally entitled to fewer weeks of regular benefits. Claimants aged 45 to 54 tend to have the lowest rate of entitlement exhaustion, while those aged 55 and older tend to have the highest entitlement exhaustion rate.
The likelihood of exhausting entitlement of EI regular benefits varies for different categories of EI claims history. For claims established in the 2010/11 fiscal year, 32.6% of occasional claimants and 27.8% of frequent claimants exhausted their EI regular benefits, compared with 23.8% of long-tenured workers. Since a claimant's entitlement to EI regular benefits depends on both the number of insurable hours accumulated and the regional unemployment rate at the time of the establishment of the claim, some variation is expected among groups in these categories.
As illustrated in Table 11, entitlement exhaustion rates decrease gradually as the number of accumulated insurable hours increases. For instance, claimants who accumulated between 420 and 559 hours experienced a 59.9% entitlement exhaustion rate, compared with 35.1% for claimants who accumulated between 980 and 1119 insurable hours, and 22.0% for claimants who had accumulated 1,820 or more insurable hours. This difference is explained in part by the fact that, under the EI program, the more insurable hours a claimant has accumulated before claiming EI regular benefits, the higher the number of entitlement weeks available to the claimant. Footnote 67 Claimants who accumulated many insurable hours before claiming EI regular benefits not only have access to more entitlement weeks; they are also more likely to find employment in a shorter period of time.
| 2008/09 | 2009/10 | 2010/11 | |
|---|---|---|---|
| Province or Territory | |||
| Newfoundland and Labrador | 25.6 | 24.4 | 24.6 |
| Prince Edward Island | 32.3 | 25.5 | 31.3 |
| Nova Scotia | 32.5 | 27.4 | 30.6 |
| New Brunswick | 22.6 | 24.0 | 26.8 |
| Quebec | 23.7 | 22.3 | 27.2 |
| Ontario | 29.2 | 25.5 | 30.8 |
| Manitoba | 21.5 | 22.9 | 30.3 |
| Saskatchewan | 20.1 | 21.6 | 26.0 |
| Alberta | 29.2 | 26.7 | 29.6 |
| British Columbia | 31.0 | 28.9 | 35.3 |
| Nunavut | 28.4 | 21.1 | 30.2 |
| Northwest Territories | 22.7 | 24.5 | 22.9 |
| Yukon | 14.2 | 12.1 | 13.7 |
| Gender | |||
| Male | 26.2 | 23.2 | 27.9 |
| Female | 28.5 | 27.3 | 31.8 |
| Age | |||
| Under 25 | 28.3 | 26.4 | 28.9 |
| 25 to 44 | 26.3 | 24.4 | 28.3 |
| 45 to 54 | 25.4 | 22.6 | 27.5 |
| 55 or Older | 31.0 | 28.0 | 35.1 |
| Insurable Hours | |||
| 420–559 Hours | 59.8 | 57.3 | 59.9 |
| 560–699 Hours | 50.7 | 47.6 | 53.1 |
| 700–839 Hours | 43.4 | 40.2 | 46.8 |
| 840–979 Hours | 38.8 | 35.1 | 42.0 |
| 980–1119 Hours | 32.3 | 28.5 | 35.1 |
| 1120–1259 Hours | 26.7 | 22.2 | 26.9 |
| 1260–1399 Hours | 23.0 | 19.1 | 23.1 |
| 1400–1539 Hours | 21.5 | 18.3 | 20.2 |
| 1540–1679 Hours | 21.0 | 17.8 | 20.4 |
| 1680–1819 Hours | 21.5 | 19.0 | 20.5 |
| 1820 or More Hours | 21.4 | 18.2 | 22.0 |
| EI History | |||
| Long-Tenured Workers | 20.3 | 16.1 | 23.8 |
| Occasional Claimants | 31.8 | 30.3 | 32.6 |
| Frequent Claimants | 25.7 | 23.7 | 27.8 |
Chart 29 shows that exhaustion rates vary significantly across regions with different unemployment rates. For instance, for claims established in 2010/11, claimants from regions with an unemployment rate of 6.0% or lower were more likely to have exhaustion rates of under 30%. Claimants from regions with an unemployment rate between 6.1% and 10.0% were likely to have exhaustion rates between 30% and 35%. Claimants from regions with an unemployment rate between 10.1% and 14.0% faced exhaustion rates between 25% and 30%. Finally, claimants from regions with an unemployment rate of 14.1% or higher faced exhaustion rates around 20%.
These differences are partially explained by the fact that the higher the unemployment rate, the higher the number of regular benefit weeks of entitlement available to claimants. For instance, a claimant who resides in an EI region with an unemployment rate of 5.3% has access to a minimum of 14 weeks and a maximum of 36 weeks of regular benefits, depending on the number of insurable hours accumulated. In contrast, a claimant who resides in an EI region with an unemployment rate of 16.5% is entitled to a minimum of 32 weeks and a maximum of 45 weeks of regular benefits.
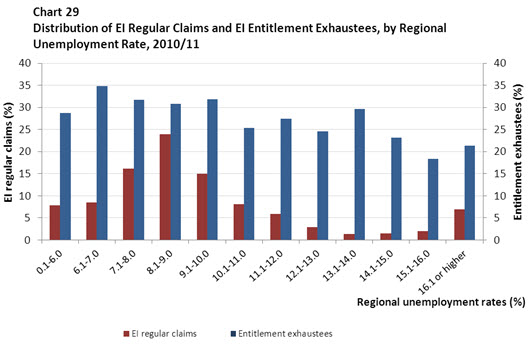
Table equivalent of Chart 29
| Regional unemployment rates (%) | EI regular claims (%) | Entitlement exhaustees (%) |
|---|---|---|
| 0.1-6.0 | 7.9 | 28.8 |
| 6.1-7.0 | 8.5 | 34.9 |
| 7.1-8.0 | 16.1 | 31.7 |
| 8.1-9.0 | 23.9 | 30.8 |
| 9.1-10.0 | 14.9 | 31.8 |
| 10.1-11.0 | 8.1 | 25.4 |
| 11.1-12.0 | 5.9 | 27.5 |
| 12.1-13.0 | 2.9 | 24.6 |
| 13.1-14.0 | 1.4 | 29.7 |
| 14.1-15.0 | 1.5 | 23.1 |
| 15.1-16.0 | 2.1 | 18.4 |
| 16.1 or higher | 7.0 | 21.4 |
9. Income Redistribution of EI Regular Benefits
In a similar manner to the analysis of income redistribution for total EI income benefits, this report also examines the income redistribution of EI regular benefits. The amount of regular benefit payments received by each province or territory, industry, and demographic group is divided by the total amount of EI premiums collected.
9.1 EI Regular Benefits-to-Contributions Ratios, by Province and Territory

Table equivalent of Chart 30
| Nfld. | P.E.I. | N.S. | N.B. | Que. | Ont. | Man. | Sask. | Alta. | B.C. | Nun. | N.W.T. | Yuk. | |
|---|---|---|---|---|---|---|---|---|---|---|---|---|---|
| Adjusted regular B/C ratio | 3.8 | 3.0 | 1.7 | 2.2 | 1.1 | 0.8 | 0.6 | 0.6 | 0.6 | 0.9 | 0.7 | 0.7 | 1.1 |
Sources: Canada Revenue Agency, 2010 T-4s with employment income; EI administrative data; Statistics Canada, Labor Force Survey.
The Atlantic provinces and Quebec continued to be net beneficiaries of regular benefits from the EI program in 2010, as they were in previous years, with adjusted ratios greater than 1.0, while Ontario and the Western provinces remained net contributors, with adjusted ratios below 1.0 (see Chart 30). Footnote 68
Ontario, Alberta and British Columbia, which all saw increases in their adjusted ratio partly due to the late-2000s recession, showed no significant changes in their adjusted regular benefits-to-contributions ratio.
9.2 EI Regular Benefits-to-Contributions Ratios, by Sector and Industry
In 2010, the goods-producing sector was a net beneficiary of regular benefits from the EI program, with an adjusted regular benefits-to-contributions (B/C) ratio of 1.8, while the services-producing sector was a net contributor of regular benefits, with an adjusted ratio of 0.7. As described earlier in Chapter 2, in 2011/12, the goods-producing sector comprised 37.6% of all EI regular claims and 21.9% of employment, indicating that the goods-producing sector was over-represented among EI regular claims. Conversely, the services-producing sector comprised 59.3% of all EI regular claims and 78.1% of employment, indicating that the services-producing sector was under-represented among EI regular claims.
The goods-producing sector includes some industries with a large share of seasonal workers—such as agriculture, forestry, fishing and hunting (regular B/C ratio of 4.5) and construction (2.6)—which continued to be strong net beneficiaries of the program, as they were in 2009.
The arts, entertainment and recreation industry (1.8) witnessed a large increase (+0.4) in its regular B/C ratio in 2010, and the industry had the highest ratio among industries in the services-producing sector. The administrative and support, waste management and remediation services industry also had a high ratio among industries in the services-producing sector.
9.3 EI Regular Benefits-to-Contributions Ratios, by Gender and Age
Older workers (1.2) and men (1.2) were net beneficiaries in 2010, as they were in 2009, according to the adjusted benefits-to-contributions ratios for EI regular benefits. An evaluation study Footnote 69 showed that older workers (aged 55 and older) were generally more likely to be net beneficiaries of EI regular benefits.
Women (0.8) were net contributors to the EI program in 2010 when considering regular benefits only, in contrast to their status when considering all EI income benefits (with a ratio of 1.0, women were neutral in their benefits-to-contributions ratio).
10. EI Regular Benefits and Seasonal Workers
10.1 Seasonal Workers
According to the Labour Force Survey (LFS), there were 456,500 seasonal workers Footnote 70 in 2011/12, a 3.0% increase from 2010/11. Seasonal workers represented 22.7% of all temporary workers and 3.1% of all employees in 2011/12.
The number of seasonal workers has increased significantly over the past 10 years, rising by 25.9% since 2000/01, but the proportion of seasonal workers among all temporary workers has remained stable at around 23% throughout the period. The proportion of seasonal workers among all employees also remained stable at around 3% over the last 10 years.
A recent study Footnote 71 of seasonal workers found that they were more likely to be male, to have less education and to have fewer dependants than workers in general. These workers were also more prominent in the Atlantic provinces and in primary industries.
These findings are supported by another new study Footnote 72 . This study also found that the number of seasonal workers grew steadily and more rapidly than total employment between 1997 and 2011, that the seasonal worker population was aging more rapidly than the total Canadian labour force, and that seasonal workers were more frequently found in firms with fewer than 20 employees.
10.2 Seasonal Claims From EI Regular Benefit Claimants
The number of all EI seasonal claims increased by 7.7% to 441,740 claims in 2011/12. Among these claims, 412,230 claims were from EI regular claimants and 29,510 claims were from EI fishing claimants Footnote 74 .
Historically, labour market conditions have had less of an effect on the volume of seasonal claims than on the volume of non-seasonal regular claims. However, the late-2000s recession and recovery contributed to a recent drop in the share of seasonal claimants among all EI regular claimants and the subsequent increase in 2011/12. EI administrative data show that the number of seasonal claims from EI regular claimants increased by 8.0% to 412,230 in 2011/12. These seasonal claims represented 29.0% of regular claims established in 2011/12, an increase from 27.3% during the previous year. The share of seasonal claimants in 2011/12 is in line with the trend observed before the late-2000s recession, when seasonal claims accounted for about 30% of all EI regular claims.
As illustrated in Table 12, seasonal claimants are more common among workers 45 and older, in the Atlantic provinces and Quebec, and in the goods-producing sector. The construction, manufacturing and education industries account for about half of all EI seasonal claims.
Table 12: EI Regular Benefits Claims and
EI Seasonal Regular Benefits Claims, 2011/12
| EI Seasonal Regular Claims | EI Regular Claims | EI Seasonal Regular Claims as a % of Regular Claims | % of All EI Seasonal Regular Claims | % of All EI Regular Claims | |
|---|---|---|---|---|---|
| Total | 412,230 | 1,422,270 | 29.0% | 100.0% | 100.0% |
| Gender | |||||
| Male | 255,140 | 855,990 | 29.8% | 61.9% | 60.2% |
| Female | 157,090 | 566,280 | 27.7% | 38.1% | 39.8% |
| Age | |||||
| 15 to 24 Years (Youth) | 12,180 | 149,370 | 8.2% | 3.0% | 10.5% |
| 25 to 44 Years | 152,580 | 627,110 | 24.3% | 37.0% | 44.1% |
| 45 to 54 Years | 129,680 | 362,420 | 35.8% | 31.5% | 25.5% |
| 55 years and Older (Older Workers) | 117,790 | 283,370 | 41.6% | 28.6% | 19.9% |
| Province or Territory | |||||
| Newfoundland and Labrador | 33,890 | 67,260 | 50.4% | 8.2% | 4.7% |
| Prince Edward Island | 9,320 | 17,850 | 52.2% | 2.3% | 1.3% |
| Nova Scotia | 27,230 | 68,620 | 39.7% | 6.6% | 4.8% |
| New Brunswick | 34,900 | 75,310 | 46.3% | 8.5% | 5.3% |
| Quebec | 160,020 | 460,160 | 34.8% | 38.8% | 32.4% |
| Ontario | 87,180 | 416,500 | 20.9% | 21.1% | 29.3% |
| Manitoba | 10,390 | 39,080 | 26.6% | 2.5% | 2.7% |
| Saskatchewan | 7,990 | 28,790 | 27.8% | 1.9% | 2.0% |
| Alberta | 11,210 | 87,630 | 12.8% | 2.7% | 6.2% |
| British Columbia | 29,090 | 156,450 | 18.6% | 7.1% | 11.0% |
| Nunavut | 80 | 930 | 8.6% | 0.0% | 0.1% |
| Northwest Territories | 250 | 1,660 | 15.1% | 0.1% | 0.1% |
| Yukon | 680 | 2,030 | 33.5% | 0.2% | 0.1% |
| Sector | |||||
| Goods-producing sector | 183,030 | 534,240 | 34.3% | 44.4% | 37.6% |
| Services-producing sector | 221,530 | 844,090 | 26.2% | 53.7% | 59.3% |
In general, about half of all seasonal claims are established in the third quarter of the fiscal year, between October and December. In 2011/12, the proportion of all new seasonal claims established between October and December was 49.4%. This fact mainly reflects seasonal patterns in the construction and manufacturing industries. On the other hand, the education services industry exhibits a different seasonal trend, as over 90% of new seasonal claims in this industry are made in the first and second quarters of the fiscal year, between April and September.
Although there are seasonal claimants in all provinces, the incidence of these claims is higher in provinces where a large portion of employment is concentrated in seasonal industries. Quebec has the highest incidence of seasonality; the province accounted for 38.8% of total seasonal claims in 2011/12, compared with 32.4% of all regular claims. Conversely, Ontario accounted for 21.2% of seasonal claims, but 29.3% of total regular claims. The disparity is partially explained by differences in the seasonality of their construction industries.
The Atlantic provinces, which rely heavily on seasonal industries, also had high incidences of seasonal claims. The four Atlantic provinces together accounted for 25.6% of seasonal claims but only 16.1% of total regular claims in 2011/12. British Columbia and Alberta, on the other hand, had a lower incidence of seasonal claims (these provinces accounted for only 7.1% and 2.7% of total seasonal claims and 11.0% and 6.2% of all regular claims, respectively).
10.3 Access to EI Regular Benefits Among Seasonal Claimants
The EICS shows that access to regular benefits for seasonal workers is higher than that for other non-standard workers Footnote 75 but lower than that for full-time, permanent workers. A recent study, Footnote 76 based on the Canadian Out-of-Employment Panel Survey (COEP), further confirmed that the likelihood of being eligible for EI regular benefits is lower (by 12 percentage points) for seasonal workers than that for full-time permanent job separators. In 2011, 81.2% of unemployed seasonal workers who had been paying premiums and then were laid off or quit with just cause were eligible for regular benefits. On the other hand, 60.0% of other non-standard workers in that same situation were eligible for regular benefits in 2011 compared with 91.2% of full-time permanent workers.
EI administrative data show that the difference in access to regular benefits between seasonal and full-time permanent workers is due to the lower number of insurable hours seasonal claimants accumulate. Of those who claimed EI regular benefits in 2011/12, almost 94% had a minimum of 700 hours of insurable employment, which is the maximum amount of hours required to qualify for EI benefits. The proportion for seasonal claimants was slightly lower at 91%. Moreover, the above-mentioned study also found that the average number of insurable hours accumulated by seasonal workers was 34.6% lower than that accumulated by full-time permanent workers.
10.4 Entitlement to EI Regular Benefits Among Seasonal Claimants
Seasonal claimants, like all regular claimants, were entitled to more weeks of benefits in 2010/11. In 2011/12, seasonal claimants had an average entitlement of 32.7 weeks of regular benefits, a drop from 34.5 weeks in 2010/11. The number of weeks of entitlement has been decreasing since the recession, when it reached 39.0 weeks in 2009/10. Despite the recent decrease, entitlement to regular benefits is returning to the pre-recession level, which was 31.9 weeks in 2007/08.
Compared with all regular claimants, seasonal claimants tend to use less of their entitlement. However, the gap in the percentage of entitlement that seasonal and regular claimants use fell in 2010/11 in comparison to the gap in 2009/10. Seasonal claimants used, on average, 60.5% of their regular entitlement for claims established in 2010/11 and 55.4% for claims established in 2009/10. Footnote 77 In comparison, regular claimants used 62.1% of their entitlement for claims established in 2010/11 and 58.1% for claims established in 2009/10.
10.5 Duration of EI Regular Benefits Among Seasonal Claimants
Correspondingly, the average duration of regular benefits for seasonal claimants is also shorter than that for all regular claimants. On average, seasonal claimants who established a claim in 2010/11 received 19.9 weeks, while regular claimants received an average of 21.6 weeks. The same holds true for claims established in 2009/10, when seasonal claimants received 20.1 weeks, while regular claimants received 23.8 weeks.
10.6 Exhaustion of EI Regular Benefit Entitlement Among Seasonal Claimants
In addition, the exhaustion rate has always been lower for seasonal claimants than for regular claimants as a whole. This statement also holds true for claims initiated in 2010/11, as 20.0% of seasonal claimants used all the weeks of regular benefits to which they were entitled, while the exhaustion rate for all regular claimants was 29.4%. The exhaustion rate increased by close to 5 percentage points for both seasonal and all regular claimants in 2010/11 in comparison to the rate in 2009/10. The increase in the exhaustion rate can be attributed to two factors: the decrease in the unemployment rate, which decreased the number of weeks of entitlement; and the end of the temporary EI measures under the Economic Action Plan, which provided additional weeks of regular benefits for all claims established in 2009/10 and only some claims established in 2010/11.
The lower use of entitlement, shorter benefit durations and lower exhaustion rates for seasonal claimants are due to the nature of seasonal work. When seasonal claimants are laid off, most have a job lined up for the next season and will return to work at approximately the same time the following year. However, most regular claimants have to look for work once they are laid off. Therefore, non-seasonal regular claimants are more likely to rely on EI for longer periods and are more likely to exhaust their benefits than are their seasonal worker counterparts.
10.7 Seasonal Gapper Claimants
The level of entitlement and duration of regular benefits have a particular impact on seasonal claimants who have a combined work-benefit period of less than 52 weeks per year. This group of claimants is referred to as “seasonal gappers.” These workers may go through a period where neither work income nor EI is available to them, if the seasonal job to which they are returning is not yet available when they exhaust their EI benefits.
Among people who initiated claims in 2010/11, there were 12,100 seasonal gappers, up 40.5% from the 8,610 seasonal gappers who established claims in 2009/10. The number of seasonal gappers has been moving upward since its historical low of 5,830 of 2008/09. However, the number of seasonal gappers remains lower than it was before the recession: 12,970 established in 2007/08 and 20,300 established claims in 2006/07. The seasonal gappers who established claims in 2010/11 averaged 16.6 weeks of work and 28.8 weeks of EI benefits, including the waiting period. This left an average gap of 6.6 weeks during which they had no income, a gap slightly longer than that for claims established in 2009/10 (6.0).
As mentioned in previous reports, the likelihood of becoming a seasonal gapper is higher in regions of high unemployment, where claimants require fewer hours to qualify for benefits. Quebec (39.9%) and the Atlantic provinces (25.0%) are overrepresented in regard to seasonal gappers: they accounted for 65% of seasonal gappers in 2010/11, while representing 31.6% and 16.2% of all regular claims established in 2010/11, respectively. Ontario, on the other hand, while accounting for a large proportion of seasonal gappers (14.1%), is underrepresented, since Ontario accounted for 28.5% of regular claims in 2010/11.
11. EI Regular Benefits and Labour Mobility
A significant movement of labour takes place in Canada, mainly from regions of high unemployment and low wages to regions of lower unemployment and higher wages. However, regional variations in unemployment rates that have persisted for decades continued during the late-2000s recession, which suggests that geographical rigidity exists in the Canadian labour market, at least to some extent. Despite the fact that jobs may be available in other regions of the country, some workers are not able or willing to move. This situation contributes to regional pockets of higher unemployment.
11.1 Interprovincial Labour Mobility
Demographic estimates Footnote 78 from Statistics Canada on interprovincial labour mobility in 2011/12 showed that only two provinces, Alberta and Saskatchewan, had a positive net migration flow of population (+23,580 and +2,054, respectively) within the country. Ontario and Quebec, Canada’s two largest provinces, had the highest negative net migration flows of population (-5,671 and -5,028, respectively).
Alberta attracted 82,052 in-migrants, more than any other province, followed by Ontario with 66,391. Alberta has experienced positive net migration every year since 2000/01 except in 2009/10 (-2,343). The positive net migration of 23,580 was more than four times the figure in 2010/11 (+5,292).

Table equivalent of Chart 31
| Province | In-migrants | Out-migrants |
|---|---|---|
| Nfld. | 8,524 | 9,849 |
| P.E.I. | 2,895 | 3,626 |
| N.S. | 15,064 | 17,654 |
| N.B. | 10,681 | 12,368 |
| Que. | 23,862 | 28,890 |
| Ont. | 66,391 | 72,062 |
| Man. | 12,203 | 16,566 |
| Sask. | 20,464 | 18,410 |
| Alta. | 82,052 | 58,472 |
| B.C. | 46,872 | 50,251 |
As shown in Chart 31, Saskatchewan (+2,054) was the only other province to experience a positive net migration flow in 2011/12. The other provinces showed negative net migration flows in 2011/12, with Ontario (-5,671), Quebec (-5,028), Manitoba (-4,363) and British Columbia (-3,379) witnessing the largest numbers of interprovincial out-migrants compared with the numbers of interprovincial in-migrants.
There are two current trends in labour mobility in Canada: a movement from east to west, and movement among the Western provinces, mostly toward Alberta. According to analysis of interprovincial migration data from Statistics Canada, the majority of workers who moved from the Atlantic provinces in 2011/12 relocated to Ontario or Alberta. Most of the workers moving from Quebec relocated to Ontario (63.5%), while those leaving Ontario moved mainly to Alberta (33%), as well as to Quebec (19.2%) and British Columbia (17.1%).
The data for 2011/12 also show the movement among the provinces in Western Canada. Workers migrating from Western Canada largely favoured Alberta, which took in nearly 30% of migrants from other Western provinces. Most workers who moved from Alberta relocated to British Columbia, but a significant number also relocated to Ontario and Saskatchewan.
11.2 Impact of EI on Labour Mobility
A number of studies in the past decade have looked at the determinants of labour mobility and whether EI plays a role in the decision to migrate for employment. Results of these studies indicate that factors such as personal and labour market characteristics, as well as moving costs, play a key role in mobility decisions, Footnote 79 while EI generosity does not seem to affect mobility decisions. Footnote 80
A new research paper Footnote 81 concluded that there was a negative correlation between the unemployment rate and the proportion of movers but that the lower likelihood of workers leaving high unemployment regions was not explained by the longer EI entitlement available in these regions. The study further stated that if EI entitlement can influence geographical attachment, its effect is small and translates only into slightly more commuting (not less out-migration).
This conclusion is consistent with another recent study Footnote 82 that suggested that EI does not discourage workers from being mobile. EI recipients were found to be more likely than non-EI recipients to commute 30 kilometres or more to go to work and more likely to work outside their census subdivision of residence. Also, following a job loss, EI recipients were more likely than non-EI recipients to move more than 100 kilometres away.
Furthermore, a study Footnote 83 estimated that eliminating regional EI extended benefits and regional EI differences in the VER would increase the volume of migration by less than 1%. In general, the available evidence suggests that EI is generally not a barrier to mobility.