
EI Monitoring and Assessment Report 2012IV. EI SPECIAL BENEFITS
Notice: Refer to the Table of contents to navigate through the EI Monitoring and Assessment Report .
1. Overview and Legislative Changes
In addition to assisting those who are unemployed, EI plays an important role in supporting employees and self-employed individuals (including fishers) who are too sick to work, who stay at home with a newborn or newly adopted child, or who take a temporary leave from work to provide care or support to a gravely ill family member. For a detailed qualitative overview of EI special benefits, please see Chapter 1 of the 2011 EI Monitoring and Assessment Report.
As of January 31, 2010, EI special benefits, including maternity, parental, sickness and compassionate care benefits, were extended to self-employed people, who could opt into the EI program for the first time. Benefits were payable as of January 1, 2011.
Effective July 4, 2010, EI extended the eligibility period for Canadian Forces members who cannot collect all their parental benefits during the standard eligibility period because of an imperative military requirement that either defers or interrupts their parental leave.
On December 14, 2012, the Helping Families in Need Act received Royal Assent, creating a new type of EI benefit for parents of critically ill children (PCIC). Under the PCIC benefits, up to 35 weeks of EI benefits will be available, to be shared among eligible parents who leave work to provide care or support to one or more critically ill children under the age of 18. This benefit will be available to eligible EI contributors and to eligible self-employed individuals who have contributed to EI. The EI PCIC benefits are expected to be available in June 2013.
Access to the new PCIC benefits will be consistent with the existing eligibility requirements for EI special benefits, requiring 600 insurable hours during the qualifying period. Footnote 89 In addition, to qualify for the PCIC benefits, a claimant will need to provide a medical certificate, attesting that the child is critically ill.
The Helping Families in Need Act also amends the Employment Insurance Act to allow insured persons who fall ill or are injured while receiving EI parental benefits to qualify for EI sickness benefits despite not being “otherwise available for work” or, for self-employed persons, “otherwise be working”. These regulatory amendments will come into effect at the same time as the EI PCIC benefits. Future reports will analyze the impact and effectiveness of the Helping Families in Need Act.
The following sections do not include data on maternity and parental benefits in Quebec, for either employees or self-employed individuals, as these benefits are offered under the Quebec Parental Insurance Plan (QPIP). Data on sickness and compassionate care benefits in Quebec are included in their respective sections.
1.1 EI Special Benefits, Claims and Benefit Payments
In 2011/12, there were 508,500 special benefits claims in Canada, which represented a 1.8% increase from 2010/11, and followed a 2.2% decrease from 2009/10 to 2010/11.

Table equivalent of Chart 33
| Year | EI special claims (000s) | EI special benefit payments ($ million) |
|---|---|---|
| 2004/05 | 514 | 3,843.2 |
| 2005/06 | 521 | 3,994.9 |
| 2006/07 | 486 | 3,660.7 |
| 2007/08 | 497 | 3,697.6 |
| 2008/09 | 515 | 3,944.7 |
| 2009/10 | 510 | 4,207.2 |
| 2010/11 | 499 | 4,178.4 |
| 2011/12 | 509 | 4,283.8 |
Total special benefits paid rose by 2.5% to $4.28 billion in 2011/12, from $4.18 billion in 2010/11. This increase followed a slight decrease of 0.7% in 2010/11.
Special benefits are sensitive to demographic shifts, as well as to changes in labour force characteristics. For instance, women, who continue to be a growing part of a growing labour force, continued to make a large proportion of special benefits claims in 2011/12, accounting for 67.5% of total special claims during the fiscal year, and receiving 83.6% of special benefits paid.
1.1.1 EI Special Benefits for Self-Employed Individuals
As of January 31, 2010, EI special benefits—including maternity, parental, sickness and compassionate care benefits—were extended to self-employed people, who could opt into the EI program for the first time. Benefits were payable as of January 1, 2011. Footnote 90
Between the opt-in date of the measure and March 31, 2012, a total of 13,710 self-employed individuals opted into the EI program. Of these, a total of 3,290 individuals subsequently opted out of the EI program.
From January 2011, when self-employed individuals were first eligible to claim EI special benefits, to March 2012, self-employed individuals made a total of 876 claims and received $7.14 million in benefit payments, with 259 claims in 2010/11 and 617 claims in 2011/12. Women accounted for 588, or 95.3%, of the claims in 2011/12. Those aged 25 to 44 years old accounted for 568, or 92.1%, of the claims in 2011/12.
Among the 617 claims from self-employed individuals in 2011/12, 455 of these claims received EI maternity benefits, accounting for $1.82 million in maternity benefit payments in 2011/12. Also, 504 of the 617 claims resulted in EI parental (biological) benefits, accounting for $4.28 million in biological parental benefit payments in 2011/12.
1.1.2 EI Parental Benefits for Military Families
Effective July 4, 2010, EI extended the eligibility period for Canadian Forces members who cannot collect all their parental benefits during the standard eligibility period because of an imperative military requirement that either defers or interrupts their parental leave. The eligibility period during which EI parental benefits can be paid may be extended by one week for each week that an eligible claimant is unable to collect EI parental benefits. The extension is subject to a maximum eligibility period of 104 weeks. Footnote 91
As of March 31, 2012, there have been 37 parental claims resulting from this EI initiative: 28 from Ontario, 7 from Manitoba and 2 from the Atlantic provinces. Canadian Forces members residing in Quebec can apply for parental benefits under the QPIP.
1.2 Eligibility for EI Special Benefits
For employees, access to special benefits is based on 600 hours of insured work during a qualifying period, regardless of the regional unemployment rate. Self-employed fishers can qualify for special benefits with fishing earnings of $3,760 during the qualifying period, while other self-employed individuals who opt into the EI program can qualify to claim special benefits with self-employed earnings of $6,222 during the calendar year, as of January 1, 2012.
Analysis based on the Survey of Labour and Income Dynamics (SLID) suggests that an estimated 90.8% of employees would have had sufficient hours (600 hours) to qualify for special benefits in December 2010, had they applied for them at the time. This eligibility rate is slightly lower than it was in December 2009 (91.0%) but follows the trend that has seen eligibility for special benefits remain consistently over 90% for the past few years.
There is little provincial variation in eligibility rates for special benefits. Newfoundland and Labrador had the highest access rate, with 92.6%, while British Columbia had the lowest rate, at 89.1%. This suggests that the 600-hour eligibility threshold for special benefits is equitable, regardless of the regional unemployment rate insured workers face.
While eligibility for special benefits is fairly consistent across provinces, it does vary by gender and job permanency. According to the SLID data, men had an eligibility rate of 92.3% in December 2010, while women had an eligibility rate of 89.2%. This was due to women being more likely to work part time than men and accumulating fewer insured hours.
Nearly all full-time workers (96.6%) would have had sufficient hours to qualify for special benefits. For those who worked part-time jobs only during 2010, 64.6% would have been eligible to collect EI special benefits. However, for those who worked both full-time and part-time jobs during 2010, 90.4% would have had sufficient hours to qualify for special benefits.
1.3 Level of EI Special Benefits
| 2011/12 ($) |
2010/11 ($) |
Growth (%) |
||
|---|---|---|---|---|
| Parental (Biological) |
Men | 427 | 420 | 1.5 |
| Women | 382 | 375 | 1.9 | |
| Both | 388 | 382 | 1.8 | |
| Parental (Adoption) |
Men | 466 | 440 | 6.0 |
| Women | 426 | 426 | 0.1 | |
| Both | 437 | 429 | 2.0 | |
| Maternity | Men | N/A | N/A | N/A |
| Women | 380 | 371 | 2.2 | |
| Both | 380 | 371 | 2.2 | |
| Sickness | Men | 390 | 379 | 3.1 |
| Women | 326 | 316 | 3.3 | |
| Both | 353 | 342 | 3.3 | |
| Compassionate Care |
Men | 412 | 400 | 3.0 |
| Women | 363 | 351 | 3.5 | |
| Both | 376 | 364 | 3.3 | |
The level of special benefits is less likely to be affected by economic cycles than the level of regular benefits. As illustrated in Table 13, growth in the average weekly benefit rate was positive across special benefits and genders in 2011/12. Almost all average weekly special benefits increased by between 1.5% and 3.5%. This general increase is in line with the increase in average weekly wages and the increase in the MIE from 2010 to 2011.
Another way to assess the adequacy of special benefits is to look at the proportion of special benefit claimants who receive the maximum benefit. In 2011/12, 37.6% of special benefit claimants received the maximum benefit, which was also the case in 2010/11. While this proportion has remained relatively stable between 37% and 38% over the last few years, it is lower than the proportion of regular benefit claimants who received the maximum benefit in 2011/12 (41.3%). This is possibly due to the overrepresentation of men and women among regular and special benefit claimants, respectively, and the earnings gap that exists between them.
1.4 Combining EI Special Benefits
Different types of special benefits can be combined within a single claim, under certain circumstances, to a potential maximum duration of 71 consecutive weeks. Footnote 92
Among new special benefits claims established in 2010/11 Footnote 93 , 32.5% of them combined more than one special benefit in a single claim, with 28.0% of the special benefits claims combining two special benefits and 4.5% combining three special benefits. The vast majority (97.1%) of those combining two special benefits combined maternity and parental benefits.
1.5 Premium Reduction Program
The Premium Reduction Program (PRP) reduces EI premiums for employers if their employees are covered by a short-term disability plan that meets or exceeds certain requirements set by the EI Commission. To be eligible, employers must show how they return the employee share of the premium reduction to workers.
In 2011, there were 34,300 employers participating in the PRP, and the insurable earnings of employees who were eligible for premium reductions were $238.1 billion, or 49% of total insurable earnings in Canada. In 2011, participating employers received a total of $882 million in premium reductions, representing 4.4% of annual gross EI premiums. Footnote 94
2. EI Maternity and Parental Benefits
EI maternity benefits are offered to biological mothers, including surrogate mothers, who cannot work because they are pregnant or have recently given birth. A maximum of 15 weeks of EI maternity benefits is available. The 15 weeks can start as early as eight weeks before the expected date of birth, and can end as late as 17 weeks after the actual date of birth.
EI parental benefits are offered to parents who are caring for a newborn or newly adopted child. A maximum of 35 weeks of parental benefits is available to biological or adoptive parents. The two parents can share these 35 weeks of benefits.
For assessment purposes, various time periods in EI administrative data are used to ensure accuracy in the analysis of the duration of EI special benefits. To assess the average duration of EI parental benefits, only claims established in the first half of 2011/12 are used, to ensure data are based on as many completed EI parental claims as possible. Given the shorter duration of maternity benefits, all claims established in 2011/12 are used.
2.1 EI Maternity and Parental Benefits, Claims and Benefit Payments
2.1.1 EI Maternity Benefits, Claims and Benefit Payments
In 2011/12, there were 167,540 maternity claims, a 0.6% decrease from the previous year. However, maternity benefit payments increased by 0.4% to $933.6 million in 2011/12. Self-employed women made 455 maternity claims, accounting for $1.82 million in maternity benefit payments in 2011/12.
In general, the vast majority of maternity claims were made by women aged 25 to 44 who accounted for 88.0% of all maternity claims in 2011/12. Women under 25 accounted for another significant share of maternity claims (11.7%).
Maternity claims decreased in most provinces, with the sharpest decreases in Nova Scotia (-5.4%) and Manitoba (-4.2%). The two provinces with the largest increases in the number of maternity claims were Prince Edward Island (+20.8%) and Newfoundland and Labrador (+10.4%).
Among the 167,540 maternity claims in 2011/12, the majority (159,610 or 95.3%) were followed by biological parental claims. In addition, among the 161,530 biological parental claims made by women, 98.8% or 159,610 were preceded by maternity claims.
2.1.2 EI Parental (Biological) Benefits, Claims and Benefit Payments
In 2011/12, the number of parental claims made by biological parents also decreased by 0.6% to 187,090; however, parental benefits payments for biological parents rose slightly, by 2.0%, to $2.20 billion in 2011/12. Self-employed individuals made 504 parental claims, which accounted for $4.28 million in biological parental benefit payments in 2011/12.
As in previous years, women comprised the vast majority (86.3%) of the 187,090 biological parental claims in 2011/12. Women made nearly the same number of claims (-0.2%) as they did in 2010/11, while the number of claims from men fell by 3.0% from 2010/11.
The large majority of biological parental claims come from women aged 25 to 44, and they continued to form a large majority in 2011/12, accounting for 76.2% of all biological parental claims. Men aged 25 to 44 accounted for 12.3% of all biological parental claims in 2011/12. Men and women under 25 also accounted for a significant share (10.6%) of biological parental claims.
The majority of provinces saw a decline in the number of biological parental claims in 2011/12 compared with the previous year, with the sharpest decreases in Manitoba (-3.2%) and Alberta (-2.3%). However, Prince Edward Island (+20.8%) and Newfoundland and Labrador (+17.3%) showed large increases in 2011/12, similar to the large increases in maternity claims.
2.1.3 EI Parental (Adoptive) Benefits, Claims and Benefit Payments
The number of parental claims made by adoptive parents increased in 2011/12 to 1,840 (+19.5%). However, benefit payments for adoptive parental claims fell slightly by 2.8% to $18.7 million in 2011/12. There were no parental adoptive claims from self-employed individuals in 2011/12.
2.2 Accessibility to EI Maternity and Parental Benefits
According to the 2011 Employment Insurance Coverage Survey (EICS), the number of mothers with a child up to 12 months old increased by 1.1% in 2011, to 401,930. Over three-quarters of these mothers (76.6%) had insurable income before giving birth or adopting their child. Among these insured mothers, 88.6% received maternity or parental benefits. Overall, over two-thirds (67.9%) of all mothers with a child up to 12 months old received special benefits in 2011.
The proportion of fathers who claimed or intended to claim parental benefits decreased to 29.3% in 2011 from 29.6% in 2010. However, this proportion has nearly doubled since 2005, when 15.0% of fathers claimed or intended to claim parental benefits. This increase is attributed, in part, to the trend in Quebec following the introduction of the QPIP on January 1, 2006. The proportions reported above originate from the EICS and include parents in Quebec receiving benefits from the provincial program.
id="h2.3-h3.3">2.3 Level of EI Maternity and Parental Benefits
The average weekly benefit for maternity benefits continued to rise in 2011/12, reaching $380 (+2.2%), up from $371 in 2010/11 and $360 in 2009/10.
Similarly, the average weekly benefit for parental (biological) benefits rose by 1.8% to $388 in 2011/12, compared with $382 in the previous year. The average weekly benefit for adoptive parental claims rose by 2.0% to $437 in 2011/12. These increases are in line with the increase in average weekly wages and the increase in the MIE from 2010 to 2011.
2.4 Duration of EI Maternity and Parental Benefits
As in previous fiscal years, in 2011/12, parents used almost all of the EI maternity and parental weeks to which they were entitled. Although the vast majority of mothers received the full 15 weeks to which they were entitled, the average duration of maternity benefits remained around 14.6 weeks.
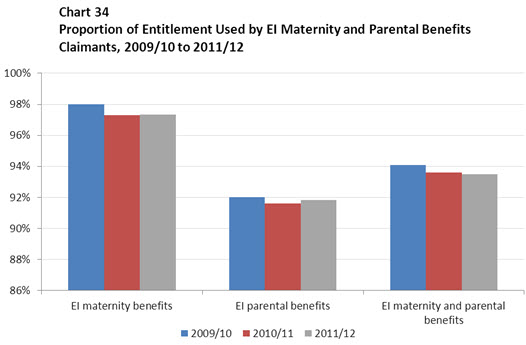
Table equivalent of Chart 34
| Year | EI maternity benefits | EI parental benefits | EI maternity and parental benefits |
|---|---|---|---|
| 2009/10 | 98.0% | 92.0% | 94.1% |
| 2010/11 | 97.3% | 91.6% | 93.6% |
| 2011/12 | 97.3% | 91.8% | 93.5% |
The average duration for parental benefits, as calculated on a per-claim basis, was 29.6 weeks for biological parents and 25.1 weeks for adoptive parents in 2011/12.
However, the average duration of parental claims can be adjusted to reflect the fact that parents often share the 35 weeks of parental benefits available to them. The average duration of biological parental claims, as calculated on a per-child basis, was 32.1 weeks for parents who decided to share the parental benefits, and this has remained stable over several years.95,96
Claimants who received both maternity and parental benefits used 47.2 weeks, or 94.4% (see Chart 34), of the 50 weeks of maternity and parental benefits available to them on average in 2011/12, a proportion similar to that of the previous year (94.0%).
Low-income claimants receiving maternity and parental benefits as well as the Family Supplement collected an average of 47.2 weeks of maternity and parental benefits, identical to the number of weeks collected by higher-income claimants not receiving the Family Supplement. This shows that the level of income does not significantly affect the duration of parental and maternity benefits used.
Similarly, the decision to share parental (biological) benefits has a limited effect on the average duration of the claim, as parents who shared parental benefits used 32.6 weeks of benefits combined, compared with 32.1 weeks used by parents who did not share parental benefits in 2011/12.
The average duration of EI adoptive parental claims was 25.1 weeks per claim in 2011/12. Parents who adopted used 85.2% of the full 35 weeks available to them, on average, up slightly from 84.9% in 2010/11. The average duration and proportion of all weeks used for adoptive parental claims were lower than those for biological parental claims.
3. EI Sickness Benefits
EI provides up to 15 weeks of sickness benefits to help claimants who are unable to work due to a short-term illness, injury or quarantine.
3.1 EI Sickness Benefits, Claims and Benefit Payments
In 2011/12, the number of new sickness claims increased by 3.2% to 331,220 claims. Of these, 107 claims were made by self-employed individuals. Sickness benefits payments rose by 4.8% to $1.12 billion. Sickness claims from self-employed individuals accounted for $0.30 million in sickness benefit payments in 2011/12.
Women made 58.2% of EI sickness claims, which was similar to the proportion in previous years. Similarly, older workers represented 23.0% of all EI sickness claims, while they represented only 17.9% of national employment. The proportion of sickness benefits claims made by older workers continues to increase (up from 20.9% in 2009/10 and 21.7% in 2010/11). Older workers were also overrepresented among those who collected the maximum 15 weeks of benefits.
The 55 and older group showed the largest increase in sickness claims (+9.7%) in 2011/12, reflecting the continued increase in employment for workers in this age group and, more generally, the aging of Canada’s population. Claims from those aged 25 to 44 (+1.5%) and those aged 45 to 54 (+3.2%) showed less of an increase in 2011/12.
Six provinces saw an increase in the number of sickness claims in 2011/12, with the sharpest increases in Newfoundland and Labrador (+7.4%) and Prince Edward Island (+5.7%). However, four provinces showed a decrease, with Saskatchewan (-6.0%) and New Brunswick (-1.8%) showing the sharpest decreases.
3.2 Level of EI Sickness Benefits
The average weekly benefit for sickness claims rose by 3.3% to $353 in 2011/12, compared with $342 in the previous year. This increase was consistent with the increase in average wages in 2011/12.
3.3 Duration of EI Sickness Benefits
In 2011/12, sickness claimants received benefits for an average of 9.4 weeks, a figure comparable to the average in 2010/11 and representing 62.6% of the maximum entitlement of 15 weeks. In addition, 31.1% of sickness claimants collected the maximum 15 weeks of benefits, which was similar to the proportion in 2010/11 (31.2%).
4. EI Compassionate Care Benefits
The EI program provides six weeks of EI compassionate care benefits (CCB) to persons who have to be away from work temporarily to provide care or support to a family member who is gravely ill with a significant risk of death.
A study Footnote 97 indicated that the majority of employed Canadians had care-giving responsibilities. In 2001, just over one in four (27.8%) employed Canadians cared for elderly dependents, twice as many had childcare responsibilities (54.2%), and one in six (16.8%) had responsibilities for both childcare and eldercare—in other words, they had dual demands at home in addition to the demands of being employed. The study finds that those who have childcare responsibilities alone are under less pressure than those caring for elders (either elders alone or elders in combination with children), although they still face substantive challenges related to the need to balance work and childcare.
4.1 EI Compassionate Care Benefits, Claims and Benefit Payments
In 2011/12, there were 5,975 claims for EI compassionate care benefits, a 0.9% decrease over 2010/11. Compassionate care benefits payments amounted to $11.0 million in 2011/12, a 0.7% increase from 2010/11.
Women made 74.5% of compassionate care claims. The number of compassionate care claims made by women remained stable, while the number made by men declined (‑3.2%). The number of claims made by those aged 55 and older increased significantly (+4.4%) in 2011/12, while those made by people aged 45 to 54 showed a decrease (-1.3%).
4.2 Accessibility to EI Compassionate Care Benefits
To make a compassionate care benefit claim, claimants must indicate their relationship with the family member they are caring for, and provide a medical certificate proving the family member is gravely ill and at significant risk of death. As shown in Table 14, the vast majority (81.5%) of applicants filed for compassionate care benefits to take care of their gravely ill parent or spouse in 2010/11. Individuals applied for compassionate care benefits to take care of a gravely ill child (their own child, the child of a spouse or the child of a common-law partner) in 7.1% of all cases. These proportions were consistent with those reported in 2009/10.
| Type of Relationship | (%) |
|---|---|
| Mother or father | 57.4 |
| Spouse or partner | 24.1 |
| Other | 7.3 |
| Child | 7.1 |
| Sister or brother | 4.0 |
| Total | 100.0 |
In June 2006, a regulatory change broadened the eligibility criteria to allow siblings, grandparents, grandchildren, in-laws, aunts, uncles, nieces, nephews, foster parents, wards and any other individuals considered family members by the gravely ill person—or his or her representative—to be eligible for compassionate care benefits. Administrative data show that the broadened eligibility resulted in additional applications in 2010/11 (the “other” and “sister or brother” categories in Table 14), representing approximately 11.3% of all compassionate care benefit applicants. Since the implementation of the broadened eligibility criteria, both the number and proportion of applicants who fall into these two categories have been increasing every year.
Among the compassionate care benefit applications in 2010/11, 82.8% were deemed eligible for compassionate care benefits, and 76.0% of the eligible compassionate care benefit applications went on to become established and paid. Footnote 99 According to a recent study on compassionate care benefits, the main reasons applicants did not receive compassionate care benefits included; failure to provide a medical certificate, and the fact that the family member was not at significant risk of death.
4.3 Level of EI Compassionate Care Benefits
In 2011/12, the average weekly benefit for compassionate care benefits increased to $376 (+3.3%). This increase is in line with the increase in average weekly wages and the increase in the MIE from 2010 to 2011.
4.4 Duration of EI Compassionate Care Benefits
On average, claimants used 4.7 weeks of compassionate care benefits or 78.2% of the maximum entitlement of 6 weeks in 2011/12, which is consistent with the previous year. The proportion of compassionate care claimants who used all of their entitlement was 74.0% in 2011/12, slightly lower than the proportion in 2010/11 (75.0%). Although family members can share the 6 weeks of entitlement, 97.7% chose not to do so in 2011/12.
According to a recent study, Footnote 100 the main reason a claimant does not receive the entire six weeks of benefits is that the care recipient passes away while the claimant is receiving compassionate care benefits. The study also found that those caring for a spouse are more likely to use the entire six-week period than those caring for another type of family member, and those living with the gravely ill care recipient are more likely to use the entire six-week period than those who do not live with the care recipient. Finally, claimants who combine compassionate care benefits with another type of EI benefit are less likely to use the full six weeks available to them than are those who only receive compassionate care benefits.