
Employment Insurance Monitoring and Assessment Report for the fiscal year beginning April 1, 2016 and ending March 31, 2017
Chapter II - 4. Employment Insurance fishing benefits
On this page
4. Employment Insurance fishing benefits
Employment Insurance (EI) also provides fishing benefits to eligible self-employed fishers who are actively seeking work. Under the Fishing Regulations, a "fisher" is defined as a self-employed person engaged in fishing and includes a person engaged, other than under a contract of service or for their own or another person’s sport, in:
- making a catch;
- any work incidental to making or handling catch, whether the work consists of loading, unloading, transporting or curing the catch made by the crew of which the person is a member, or of preparing, repairing, dismantling or laying up the fishing vessel or fishing gear used by that crew in making or handling the catch, where the person engaged in any such incidental work is also engaged in making the catch; or
- the construction of a fishing vessel for his or her own use or for the use of a crew of which the person is a member in making a catch.
To be entitled to receive fishing benefits, applicants must meet the definition of self-employed fishers, must be unemployed and available for work with respect to their fishing activities, and must pay EI premiums during their qualifying period (defined as either the 31 weeks prior to the new claim’s establishment or since the establishment of a previous claim, whichever is shorter). In addition, they must not qualify for regular benefits and must have earned $2,500 to $4,200 in insurable earnings from fishing activities, depending upon the regional employment rate in the EI region where they live, as shown in Table 36.,Footnote 85,Footnote 86 These income thresholds have not changed since 1996.
Any claimant who qualifies for fishing benefits may receive a maximum entitlement of 26 weeks of EI benefits per claim within the fixed benefit period, with the possibility of establishing two claims per year.
| Required insurable earnings | Earnings divisor | ||
|---|---|---|---|
| 0.1% to 6.0% | $4,200 | 22 | |
| 6.1% to 7.0% | $4,000 | 21 | |
| 7.1% to 8.0% | $3,800 | 20 | |
| 8.1% to 9.0% | $3,600 | 19 | |
| 9.1% to 10.0% | $3,400 | 18 | |
| 10.1% to 11.0% | $3,200 | 17 | |
| 11.1% to 12.0% | $2,900 | 16 | |
| 12.1% to 13.0% | $2,700 | 15 | |
| 13.1% or higher | $2,500 | 14 | |
Note: Divisor is applied to the insurable earnings during the qualifying period to determine the equivalent weekly earnings that will be subject to the standard 55% replacement rate.
Indeed there are two separate benefit periods for fishing benefits: a winter qualifying period for which a claim can be established from the week of April 1 to December 15 and a summer qualifying period for which a claim can be established from October 1 to the week of June 15. These weeks of benefits may be received consecutively or intermittently, but are limited by the fixed starting and ending dates of the benefit period.
For the purposes of this section, EI fishing claims refer to EI claims for which at least one dollar of EI fishing benefits was paid.
4.1 Employment Insurance fishing claims and benefits paid
The number of new fishing claims increased to 28,900 during the reporting period, up 2.3% from the previous year (See Chart 30). This was the third consecutive year-over-year increase since the 14-year low registered in FY1314 (27,200 new claims). However, it should be noted that since 2004 there is a general downward trend in the number of new fishing claims established. This trend is correlated with the overall decrease in the number of commercial fishing licences issued, which has consistently decreased between 2004 (28,800) and 2014 (21,400), followed by the first increase of 6.9% in 2015 (22,900).Footnote 87
During each month of FY1617, there were on average 11,600 beneficiaries receiving fishing benefits,Footnote 88 slightly up from the previous year (+1.5%). They represented 1.4% of EI beneficiaries during the reporting period.
Along with the increase in the number of fishing claims, the amount paid in fishing benefits grew by 3.9% to $282.9 million in FY1617. Both new fishing claims and the amount paid in fishing benefits represent around 1.5% of the total for all EI benefits types.
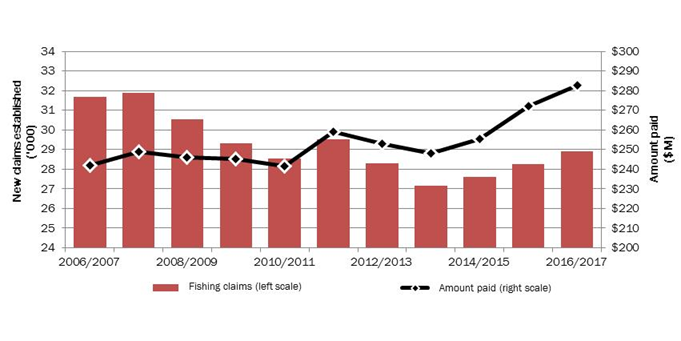
Text description of Chart 30
| 2006/2007 | 2007/2008 | 2008/2009 | 2009/2010 | 2010/2011 | 2011/2012 | 2012/2013 | 2013/2014 | 2014/2015 | 2015/2016 | 2016/2017 | |
|---|---|---|---|---|---|---|---|---|---|---|---|
| Fishing claims in thousands- left scale | 31.7 | 31.9 | 30.5 | 29.3 | 28.5 | 29.5 | 28.3 | 27.2 | 27.6 | 28.3 | 28.9 |
| Amount paid ($ millions) - right scale | $242.1 | $248.9 | $246.2 | $245.1 | $241.7 | $259.2 | $252.8 | $247.9 | $255.6 | $272.2 | $282.9 |
*Includes claims for which at least $1 of fishing benefits was paid.
Source: Employment and Social Development Canada, Employment Insurance (EI) administrative data. Data are based on a 100% sample of EI administrative data.
During the reporting period, the number of new fishing claims increased in all provinces with a significant fishing industryNote de bas de page 89, except British Columbia, which witnessed a slight decrease of -0.7% over the previous year (see Table 37). Similar to the previous year, claimants in the Atlantic provinces accounted for the largest share of new claims established (81,0%), with Newfoundland and Labrador leading with 40.8%, followed by Nova Scotia (18.8%), Prince Edward Island (10.7%), and New Brunswick (10.6%). They were followed by British Columbia (10.1%) and Quebec (4.9%). Claimants in the Atlantic provinces received roughly 80.6% of fishing benefits paid to self-employed fishers in Canada, with Newfoundland and Labrador accounting for around 39.4%. The amount of fishing benefits paid increased in all provinces with a significant fishing industry, except British Columbia and Quebec which witnessed decreases of -4.1% and -4.6%, respectively.
During the reporting period, the number of new fishing claims for both male (+1.6%) and for female (+5.5%) self-employed fishers increased, as well as the amount of fishing benefits they collected (see Table 37). As in the previous year, fishing claims were predominantly established by men (81.2%), who also received the largest share of benefits paid (81.1%).
| Claims established | Amount paid ($ millions) | |||||
|---|---|---|---|---|---|---|
| 2015/2016 | 2016/2017 | Change (%) | 2015/2016 | 2016/2017 | Change (%) | |
| Region | ||||||
| Newfoundland and Labrador | 11,469 | 11,819 | +3.1% | $108.1 | $111.4 | +3.0% |
| Prince Edward Island | 2,981 | 3,108 | +4.3% | $26.2 | $28.4 | +8.5% |
| Nova Scotia | 5,327 | 5,448 | +2.3% | $53.0 | $57.2 | +8.0% |
| New Brunswick | 2,977 | 3,066 | +3.0% | $29.3 | $31.1 | +6.2% |
| Quebec | 1,409 | 1,425 | +1.1% | $12.5 | $12.0 | -4.1% |
| British Columbia | 2,940 | 2,919 | -0.7% | $31.3 | $29. 9 | -4.6% |
| Other provinces and Territories | 1,168 | 1,149 | -1.6% | $11.8 | $12.9 | +8.6% |
| Gender | ||||||
| Men | 23,121 | 23,502 | +1.6% | $223.9 | $229.5 | +2.5% |
| Women | 5,150 | 5,432 | +5.5% | $48.4 | $53.4 | +10.3% |
| Age category | ||||||
| 24 years old and under | 1,380 | 1,460 | +5.8% | $11.6 | $14.0 | +21.5% |
| 25 to 44 years old | 8,327 | 8,335 | +0.1% | $78.6 | $82.1 | +4.5% |
| 45 to 54 years old | 8,184 | 8,171 | -0.2% | $81.4 | $79.9 | -1.8% |
| 55 years old and over | 10,380 | 10,968 | +5.7% | $100.7 | $106.9 | +6.1% |
| EI claimant category * | ||||||
| Long-tenured worker | 254 | 279 | +9.8% | $1.8 | $2.0 | +8.4% |
| Occasional claimant | 3,277 | 3,543 | +8.1% | $29.6 | $35.3 | +19.1% |
| Frequent claimant | 24,740 | 25,112 | +1.5% | $240.8 | $245.7 | +2.0% |
| Canada | 28,271 | 28,934 | +2.3% | $272.3 | $282.9 | +3.9% |
Note: Data may not add up to the total due to rounding. Percentage change is based on unrounded numbers. Includes all claims for which at least $1 in EI fishing benefits was paid.
*See Annex 2.1 for definitions of claimant categories.
Source: Employment and Social Development Canada, Employment Insurance (EI) administrative data. Data are based on a 100% sample of EI administrative data, except for amount paid, which is based on a 10% sample.
The number of new claims established increased for every age category except claimants aged 45 to 54 years, who witnessed a slight decrease of 0.7% over the previous year. Youth (24 years old and under) experienced the greatest increase in new fishing claims compared to the previous year (+5.8%), followed closely by older fishers (55 years old and over) with 5.7% of growth. Since the early 2000s, the share of fishing claims established by older fishers has consistently increased every year, which reflects the aging labour force in regions where the fishing industry is more important. As for fishing claims established by fishers aged 25 to 54 years old, they remained unchanged from the previous year. They accounted for the greatest share (57.0%) of new fishing claims established, followed by older fishers (55 years old and over) and younger fishers (24 years old and under) with 37.9% and 5.1% of all new fishing claims, respectively.
The distribution of fishing benefits paid to fishers by age groups shows a pattern similar to new claims. Younger fishers (24 years old and under) witnessed the greatest increase in fishing benefits paid (21.5%), followed by older fishers (55 years old and over) with 6.1%. These latter accounted for the largest share of fishing benefits paid with 37.9%, followed by claimants aged between 25 to 44 years (29.0%), 45 to 54 years (28.2%), and less than 25 years (5.0%). Similar to new fishing claims established, since the beginning of 2000s, the share of benefits paid collected by older fishers has consistently increased every year.
The number of new fishing claims increased in each claimant category. Almost 9 out of 10 claims (86.8 %) in FY1617 were established by frequent claimants, whereas 12.2% of claims were by occasional claimants and only 1.0% by long-tenured workers. The distribution of amounts paid in benefits was similar to that for new claims. Frequent claimants collected 86.8% of fishing benefits, whereas occasional claimants and long-tenured workers received 12.0 % and 0.7% respectively.
The average weekly fishing benefit rate increased by 2.1%, from $494 in the previous year to $505 during the reporting period (see Annex 2.10.3) and continues to be well above the average weekly regular benefit rate ($449). The average weekly fishing benefit rate increased in every province with an important fishing industry. The rate tends to be the highest in Prince Edward Island, Quebec, Nova Scotia and New Brunswick. The proportion of fishing claimants who received the maximum weekly benefit decreased slightly from 76.6% in the previous year to 75.5% during the prevailing reporting period, but remained much higher than the proportion of regular claimants who received the maximum benefit rate (46.1% in FY1617). This is partly attributable to the fact that 75.3% of fishers who established a fishing claim resided in an economic region with an unemployment rate higher than 13% (minimum divisor of 14) and only needed $13,822 in insurable earnings over their qualifying period to receive the maximum weekly benefit rate of $543. Similarly to the previous year, almost six out of seven fishing claims were established with insurable earnings of $13,000 or more (see Chart 31).

Text description of Chart 31
| Insurable earnings | New claims established (Percentage share) |
|---|---|
| Less than $5,500 | 1.1% |
| $5,500 to $6,999 | 1.3% |
| $7,000 to $8,499 | 1.9% |
| $8,500 to $9,999 | 2.3% |
| $10,000 to $11,499 | 3.4% |
| $11,500 to $12,999 | 4.8% |
| $13000 to $14,499 | 65.3% |
| $14,500 to $15,999 | 2.9% |
| $16,000 to $17,499 | 2.4% |
| $17,500 or more | 14.6% |
| Total | 100.0% |
*Includes claims for which at least $1 of fishing benefits was paid.
Source: Employment and Social Development Canada, Employment Insurance (EI) administrative data. Data are based on a 100% sample of EI administrative data
4.2 Seasonal component of Employment Insurance fishing benefits
The 28,900 new fishing claims established during the reporting period originated from only 20,700 fishers, reflecting the fact that fishing benefits are available for two fishing seasons a year (winter and summer). The number of fishers that established at least one claim during the reporting period increased for a third year in a row (+537 or +2.7%) compared to a low of 19,300 fishers in FY1314.
Most self-employed fishers who established only one claim in FY1617 did so for earnings during the summer qualifying period (9,700) compared to those in the winter qualifying period (2,700) (see Table 38). Around 40.0% of fishers (8,300 fishers) established a fishing claim for each season in FY1617. The Atlantic provinces and Quebec accounted for 98.2% of all fishers who established multiple fishing claims. Fishers from Newfoundland and Labrador (55.2%) and Quebec (67.6%) were the most likely to be active in both seasons.
| 2012/2013 | 2013/2014 | 2014/2015 | 2015/2016 | 2016/2017 | |
|---|---|---|---|---|---|
| One Season | 11,873 | 11,460 | 11,880 | 11,996 | 12,398 |
| Winter | 2,763 | 2,559 | 2,596 | 2,605 | 2,720 |
| Summer | 9,110 | 8,901 | 9,284 | 9,391 | 9,678 |
| Two Season | 8,207 | 7,856 | 7,852 | 8,132 | 8,267 |
| Canada | 20,080 | 19,316 | 19,732 | 20,128 | 20,665 |
Source: Employment and Social Development Canada, Employment Insurance (EI) administrative data. Data are based on a 100% sample of EI administrative data.
In FY1617, fishers who established a claim received an average of $10,961 in fishing benefits, while fishers who established two claims during the previous year received an average of $10,140 for the first claim and of $9,556 for the second claim, averaging a total of $19,696. This compares to $7,253 in EI regular benefits to the average EI regular benefit claimant.
4.3 Duration of Employment Insurance fishing benefits
Regardless of a claimant’s region of residence (or local labour market conditions), the maximum duration for fishing benefits is 26 weeks per claim. Actual duration of fishing benefit periods varies very little over time. During the reporting period, it was 20.8 weeks, an increase of 0.3 week over the previous year. Among provinces with an important fishing industry, British Columbia historically had the most fishing benefit weeks used on average, with 23.0 weeks. The average weeks of fishing benefits used for the Atlantic provinces and Quebec varied between 19.7 and 21.2 weeks per claim.
Fishers who established a single claim in FY1617 received an average of 22.9 weeks of fishing benefits, unchanged from the previous year. As for fishers who established two claims, they received fishing benefits for an average of 19.9 weeks for their first claim and 18.5 weeks for the second claim, which represents a combined average of 38.4 weeks.
| Average duration (weeks) | ||
|---|---|---|
| 2015/2016 | 2016/2017 | |
| One season / one claim | 22.9 | 22.9 |
| Two seasons / two claims | 37.3 | 38.4 |
| First claim | 19.9 | 19.9 |
| Second claim | 17.4 | 18.5 |
Source: Employment and Social Development Canada, Employment Insurance (EI) administrative data. Data are based on a 100% sample of EI administrative data.