
Employment Insurance Monitoring and Assessment Report for the fiscal year beginning April 1, 2016 and ending March 31, 2017
Chapter IV - Program administration
From: Employment and Social Development Canada
On this page
4. Program administration
This chapter provides an overview of the delivery of Employment Insurance (EI) services to Canadians during FY1617. It follows the steps of the EI process from a client perspective, starting with general information gathering, through processing, to the end of the benefit period, focusing on interactions with both employees and employers along the way. Additionally, it outlines avenues of recourse for claimants via the EI Requests for Reconsideration and Appeals process and ESDC's role with respect to the Social Security Tribunal (SST). This chapter also touches on the reporting and quality measures used to monitor EI program delivery and contributions.
In addition to this overview, ESDC conducts supplemental studies to evaluate specific elements of the EI program and its service delivery to Canadians. One such study focusing on EI's support of Apprenticeship Training during FY1617 was recently completed and can be found in Annex 6.
Information note:
This chapter refers to both claimants and clients. Claimants include individuals who have submitted an EI claim (whether successful or unsuccessful) as well as those currently receiving benefits. Clients include claimants, employers and other interested parties.
Also, “FY1617” will be used throughout this chapter to refer to the period starting on April 1, 2016 and ending on March 31, 2017.
4.1 Introduction and context of Employment Insurance service delivery
EI claimants rely on ESDC for information and guidance throughout the whole claims process resulting in timely and accurate benefit payments.
Claimants and employers can access Service Canada online, by phone or in-person. The processing and payment of EI benefits occurs through a service delivery network made up of processing sites and EI Specialized Call Centres located across the country. This service delivery network addresses seasonal fluctuations in workload while adjusting to unanticipated spikes caused by economic conditions or major disruptions such as natural disasters.
Canadians' needs and expectations drive ESDC efforts to improve service delivery. The Government of Canada's commitment in Budget 2016 to improve service for all EI claimants paved the way for legislative changes, funding to hire call center agents, particularly for the EI Specialized Call centre, and led to the launch of the EI Service Quality Review (SQR). These efforts build on the progress of the last decade to introduce more automation, simplify the process, and reduce manual paperwork for claimants, employers and ESDC agents. These changes have already started to show results. The number of application errors for example has decreased, bringing the payment accuracy rate up to 95.4% this reporting period, from the previous year's 93.9%. Processing speeds have also improved; meeting the annual target of over 80% of claims paid out or responded to within 28 calendar days (see section 4.3.3. Claims Processing for more information). Processing activities have been distributed across the national network taking better advantage of capacity where it exists, and paper has been virtually eliminated. Efforts continue to increase claims processing automation and optimize the electronic services available to individuals and businesses.
Employment Insurance Service Quality Review (SQR)
In May 2016, the Government launched the EI Service Quality Review (SQR), a nationwide consultation process with key stakeholders and the public to seek their input on ways to improve services to EI claimants.
Led by three members of Parliament, the SQR Panel asked Canadians from coast to coast to coast how to improve services to EI claimants. Canadians were consulted via stakeholder roundtables and an online questionnaire. To support this review, the Department conducted a client experience survey using a randomly selected sample of EI clients. This survey focused exclusively on EI clients and yielded an overall satisfaction score of 78%. The results of the client experience survey were published in March 2017 and are available publicly on Canada.ca.
Based on the feedback received, the SQR Panel developed ten recommendations, along five key themes which address the issues and concerns raised regarding the service quality of the EI program. The themes include an increased client-centric focus, employee engagement, operational improvements, the modernization of existing technology, and policy modifications.
Recommendations emphasize that a greater client-centric focus can be achieved through more engagement and communication with clients throughout the service improvement process. Similarly, the SQR report addresses employee engagement by pointing to opportunities to involve employees more directly in service improvement initiatives.
Operational improvements were also highlighted as possible areas of focus for improvement, particularly the delays associated with having claims and appeals processed, and questions answered at first point of contact. One suggestion was to reduce delays and the administrative burden on employers by advancing work on a solution that would allow real-time payroll information to be shared with Government.
Finally the SQR report recommended that some of the technologies in place to deliver EI services are outdated and should be modernized to improve the quality of services, and to meet client expectations. The Call Centre Improvement Strategy section of this chapter provides details about some of the work underway to address these recommendations, particularly the move to a new telephony system (see Section 4.4.1), and efforts to modernize online services (see Section 4.3.1).
The complete SQR report, including the full recommendations and panel findings, entitled "Making Citizens Central", was published on February 1, 2017, and is available publically on Canada.ca.
Adapting service delivery to fit the situation
Unexpected natural disasters and economic downturns can lead to sudden periods of large scale unemployment. Claimants and employers rely on ESDC to be well-prepared to deliver the services they need, when they need them the most, particularly when special planning is required to adapt the program quickly to fit the situation.
On May 1, 2016, a wildfire began southwest of Fort McMurray, Alberta. It swept through the community, destroying approximately 2,400 houses and buildings, forcing 80,000 people from their homes, including ESDC employees. It is the costliest disaster ever faced by Canada and is the largest wildfire evacuation in Canadian history.
Since many individuals were displaced from their homes and in temporary locations during the height of the fires, leniency and flexibility were applied when evaluating claimant availability for work. Furthermore, since many employers were not in a position to issue records of employment (ROEs), Service Canada used interim ROEs to finalize EI claims in order to avoid delays in the receipt of benefits.
Individuals affected by the fires made 30,510 calls to the EI Specialized Call Centres that were answered using a dedicated line which provided priority access.
Most individuals who contacted the EI Specialized call centre were making enquiries about claim-specific issues, notably (where the breakdown was available) about:
- initial claim: 56% of enquiries
- change of address, access code or payment issued by mail: 25% of enquiries
- renewal claim: 6% of enquiries; and
- other reasons for the call: 13% of enquiries
Almost 1,400 individuals impacted by the evacuation, found themselves suddenly unemployed and contacted 1 800 O-Canada for more general information and assistance. Although the service provides information on behalf of all federal programs and services, EI-related calls were predominant.
Individuals were also able to speak with agents in-person in the evacuation centres set up across Alberta. More than 18,000 clients benefited from speaking to an agent at one of the evacuation centres. In addition, three mobile command centres (RVs) crisscrossed Northern Alberta to support those who were not close to an evacuation centre.
In total, approximately 31,000 EI applications were submitted and handled by a dedicated processing team.
4.2 Accessing information on Employment Insurance
Chapter Two outlines the various benefits available to EI contributors, whereas this section focuses on how clients can get information about the various benefits. EI-related information, like eligibility requirements and the application process, is available online, by telephone and in person, so that Canadians can access what they need, when they need it, using their preferred method. This section provides an in-depth analysis of the management of these channels.
4.2.1 On-line
Clients use Canada.ca and ESDC's secure applications to access information and make online transactions.
Canada.ca
In January 2017, the move of EI information to the new Canada.ca website was completed. As part of this move, EI web pages were re-organized to be found more easily by clients. They are now sorted under several Canada.ca themes, including Jobs and the Workplace, Benefits, and Business, as well as through the Service Canada profile page. EI tasks are among the most commonly used GC services. 44% of visitors who viewed ESDC content on Canada.ca looked at EI pages, while more broadly, EI content was viewed by 32% of all Canada.ca visitors.
The most viewed page this reporting year on Canada.ca was the My Service Canada Account (MSCA) page. Clients who looked at EI content viewed 62,578,681 pages overall which is consistent with previous years. In descending order, the most viewed EI pages were:
- EI Benefits – 51.6%
- Internet reporting service – 39.9%
- EI Regular Benefits – Overview – 12.1%
- access Record of Employment on the Web (ROE Web) – 7.3%; and
- applying for EI benefits online – 4.6%
To provide clients with a consistent experience, information about all services and benefits on Canada.ca, including EI, is presented in the same simple, accessible, step by step format, with the same look and feel. Since this change, 70% of visitors who reported coming to Canada.ca to complete an EI-related task (for example, applying for EI, submitting a biweekly report, or checking the status of their claim) were either satisfied or very satisfied with their online experience. As well, across all EI tasks presented in a new Service Initiation Template, 40% of clients who viewed the first step (the "Overview" page) progressed directly to the "Apply" page (instead of reading through the more detailed steps). ESDC will continue its review of EI pages on Canada.ca to improve clarity, findability and overall client experience.
My Service Canada Account
Service Canada provides claimants with a secure transactional portal to view and update their EI, Canada Pension Plan (CPP), and Old Age Security (OAS) information. The "My Service Canada Account" (MSCA) portal contributes to more accessible, accurate and timely services for Canadians.
Each month, over 500,000 users log into MSCA to access EI services such as:
- obtaining current and past claims information, payment information, and correspondence;
- submitting new information, signing up for or changing Direct Deposit service;
- viewing or printing an ROE and/or tax slips;
- accessing EI Applications On-line (also known as AppliWeb) and the Internet Reporting Service; as well as
- visiting the Canada Revenue Agency portal (My Account for Individual) within the same secure session.
MSCA posts an ongoing exit survey to a random selection of account users who have completed their visit to the portal. The survey asks users what tasks on MSCA they had wanted to complete during their session, and for each of these, whether or not they were able to complete it. Tasks for EI included changing information (for example, address or direct deposit), viewing Records of Employment (ROE), and viewing information such as latest and past claims. During FY1617, 1,771 surveyed MSCA users indicated they had attempted one of these EI-related tasks, and overall, 81% of respondents indicated being able to complete their task during the session.
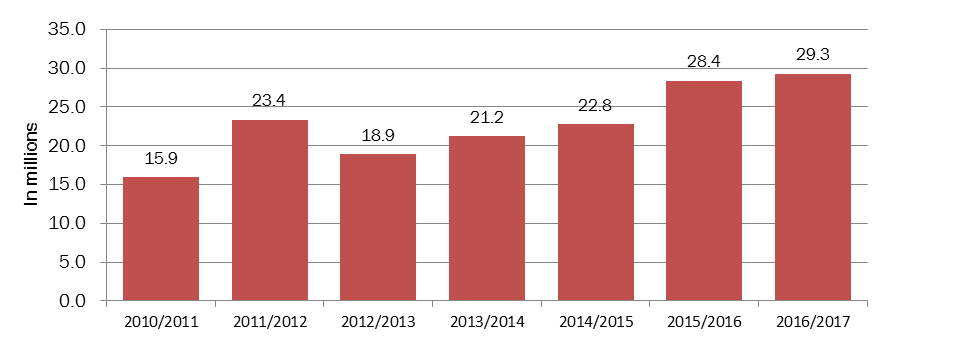
Canadians logged into MSCA 29.3 million times during this reporting period; an increase of 3.4% over the previous year (see Chart 1). MSCA logins have continued to increase since 2010 to 2011. There are now 5.2 million accounts (total estimated active user base), an increase of 1 million over 2015 to 2016, which includes 793,058 new registrations.
- Source: My Service Canada Account administrative data.
Show data table
| Year | In Millions |
|---|---|
| 2010 to 2011 | 15.9 |
| 2011 to 2012 | 23.4 |
| 2012 to 2013 | 18.9 |
| 2013 to 2014 | 21.2 |
| 2014 to 2015 | 22.8 |
| 2015 to 2016 | 28.4 |
| 2016 to 2017 | 29.3 |
The ability to self-serve on the status of an application request is a common service available within the private sector and as such, the ability to check the status of an EI application was identified as a valuable addition to the program's service strategy. While the application intake process for the program is largely electronic, prior to this reporting period an EI claimant could not obtain any detailed information on the status of their application once submitted (from the time of submission until a decision was taken). The lack of a viable e-solution to provide meaningful and timely claim specific data (during the time between application submitted and decision taken) continued to create channel churn as claimants must rely on agent-assisted services to obtain details on claim status.
The ability for clients to enquire as to the status of their claim was identified as a major obstacle to overcome. To address the situation, the Department introduced new functionalities into the existing My Service Canada Account (MSCA) portal. They are:
- Check Status – To present users with timely and meaningful information on their claim status in a secure environment over the internet. (November 2016)
- Message Centre –A secure mailbox within MSCA where messages related to the claim can be posted and retrieved by the claimant. These messages are system or agent generated based on claim transactions. (November 2016)
4.2.2 By telephone (call)
EI clients frequently contact 1 800 O-Canada for general enquiries related to EI. For more complex and client-specific enquiries EI clients have the choice of calling the EI Specialized Call Centre or logging into the My Service Canada Account (MSCA).
1 800 O-Canada
1 800 O-Canada acts as the first point of contact for all GC programs and services, supports GC advertising and communication activities, and supports GC communication needs in crisis situations. Available in more than 60 countries, the 1 800 O-CanadaFootnote 1 line is available Monday to Friday, with service in both official languages, for callers in Canada, from 8:00 a.m. to 5:00 p.m. in each time zone; and for callers outside of Canada from 8:00 a.m. to 8:00 p.m. Eastern standard time. The service delivery standard is to answer calls within 18 seconds (or within three rings), 80% of the time. During FY1617, 1 800 O-Canada answered 82% of calls within 18 seconds.
1.79 million individuals made calls answered by 1 800 O-Canada agents, a 17.9% decrease as compared to the previous reporting year. This translated into the service answering 2.28 million enquiries (more than one enquiry may be asked per call). 19.4% or 442,111 of those enquiries related to EI. When compared to the previous year, the number of EI-related enquiries decreased by 26.9%.
1 800 O-Canada is equipped to provide general information on EI programs and how to access them, including:
- an overview of the benefits and eligibility criteria;
- application process and forms;
- general information on payment datesFootnote 2 (not applicable for the EI benefits as payment information is case specific);
- direct deposit information; and
- referral of contacts to specific programs, including the pertinent EI web pages and links necessary to complete their service delivery journey.
Clients that have case-specific enquiries are advised to access the MSCA website, or contact the EI Specialized Call Centers, or the Employer Contact Centre as required.
Most EI-related enquiries continue to require a referral to the EI Specialized Call Centres or to the program's web-site for more detailed, complex and client-specific enquiries. During this reporting period, 82.2% of the EI-related enquiries handled by
4.2.3 In person (visit)
The third option for Canadians to obtain information on Service Canada services is in-person.
As of March 31, 2017, there were 558 Service Canada points of service (320 Service Canada Centres and 238 Scheduled Outreach sites) where citizens could access general information on the EI application process and eligibility criteria. Service Canada employees in these locations help claimants to complete the online application and perform other support functions for the EI program, which include authenticating identity, validating supporting documents, and verifying information for completeness.
The in-person points of service fall under two categories:
- Service Canada Centres (SCC) are full-time or part-time offices, open up to five days a week, managed and staffed by Service Canada employees, offering general information and transactional services. SCCs may be stand alone or co-located with other organizations; and
- Scheduled Outreach Sites are points of service that are physically located outside an SCC but offer similar services. Service Canada employees (from a nearby SCC) travel to a pre-determined location regularly (for example, one day per week) to deliver services. Outreach is typically available in rural or remote locations, offered at partner premises (such as band councils, provincial or territorial offices), and managed through service contracts and/or memoranda of understanding.
ESDC aims to ensure that 90% of Canadians have access to a Service Canada point of service (SCC or Scheduled Outreach site) within a 50-kilometre driving distance from where they live. The number or network of offices can fluctuate and is adjusted based on needs and demand for service. Over the last five years, this target has been met consistently, and exceeded in the current reporting period with a rate of 96.2%.
Clients made over 4.4 million EI-related service requestsFootnote 3 to an in-person point of service during FY1617; representing 30% of all interactions handled at in-person offices. Of these, EI-related visits to Scheduled Outreach sites across the country accounted for more than 56,000 service requests.
Types of EI assistance provided by in-person services in this reporting year included the following interactions:
- 33.4% for follow-up assistance;
- 33.4% to provide general information;
- 31.8% to use Citizen Assisted Workstations;
- 1.4% to accept or provide assistance with applications; and
- 0.1% to provide processing support.
Mobile Outreach Services
Service Canada also uses Mobile Outreach Services (MOS) to connect with communities across the country. MOS complements the services provided at SCCs and Outreach sites, and increases awareness of Service Canada programs and service offerings by providing general information such as:
- EI information at mass layoff sites;
- Youth program information in locations such as schools;
- Senior programs (namely, CPP, OAS) in retirement homes; and,
- Other Government of Canada programs and services to community service organizations.
The following information sessions on EI were delivered through Mobile Outreach ServicesFootnote 4 during this reporting year:
- 409 EI information sessions to citizens facing layoffs, with a total of 8,161 participants;
- 190 EI information sessions to workers on Work Sharing, with a total of 3,275 participants; and
- 407 EI information sessions to employers, with 755 companies and organizations participatingFootnote 5.
Chart 2 breaks down the Mobile Outreach Services (MOS) information sessions delivered to claimants by region, including employees facing layoffs and work sharing sessions.

- Source: Mobile Outreach administrative data.
Show data table
| Region | 2011 to 2012 | 2012 to 2013 | 2013 to 2014 | 2014 to 2015 | 2015 to 2016 | 2016 to 2017 |
|---|---|---|---|---|---|---|
| Atlantic | 219.00 | 209.00 | 114.00 | 119.00 | 133.00 | 115.00 |
| Quebec | 582.00 | 461.00 | 425.00 | 586.00 | 395.00 | 277.00 |
| Ontario | 1021.00 | 1003.00 | 1029.00 | 632.00 | 470.00 | 381.00 |
| Western | 306.00 | 318.00 | 202.00 | 282.00 | 177.00 | 152.00 |
Yearly targets are not set for MOS EI information sessions as they are offered on demand. Since 2011 to 2012, there has been a steady decline at the national level in the number of MOS EI information sessions delivered to citizens. This decline is partly explained by: changes in the economy and local priorities; reduced need since more EI information is available on-line; and, the new capabilities allowing claimants to make changes directly to their EI personal information on-line.
The number of sessions delivered was 21% lower in this reporting period as compared to the previous one, due to less demand.
When Service Canada receives news of a mass layoff, regional offices initiate contact with employers to organize an EI information session. Working with partners, potential claimants receive on-site workshops on resumé writing, job search techniques, interview skills, as well as, EI and available provincial support programs. Sessions are usually planned on very short notice and often in remote areas.
Service Canada also delivers EI information sessions in times of duress, and may adapt processes and create partnerships to more effectively meet clients' needs with regard to EI. While some Service Canada employees make proactive calls to employers affected by a tragedy to establish their needs, others simply ensure potential claimants who lose their jobs can get the information required to submit their EI application.
For example, during the Fort McMurray fire and aftermath, Service Canada attempted to reach the majority of employers in the affected region to determine areas of support including recovery plans to get staff back to work, work-sharing options where required, and other ways that Service Canada could support them. This included Temporary Foreign Workers who were encouraged to apply for EI as employers' determined contingency plans for future employment.
Employers who came to a Service Canada Center or one of the evacuation centers were provided information on EI services; transfers to the Employer Contact Centre were assisted as required and/or the number was provided to the employer for future use.
In response to the anticipated unemployment increase caused by the Alberta wildfires this year, eleven (11) Emergency Evacuation Centers were opened to serve clients in British Columbia, including Kelowna, Clearwater, Kamloops, Prince George, Surrey, Princeton and Vemon. Over 1,200 affected clients visited a Service Canada centre to apply for, or enquire about, EI. Service Canada employees from across British Columbia, Alberta, and Saskatchewan were brought in to support these efforts and ensure that evacuees received timely services in the evacuation centres.
4.3 Application intake and claim processing
This section provides an overview of the activities related to application intake and claims processing, focusing on both the claimant and employer.
4.3.1 Services for clients
Claimants can initiate service requests for benefits via the internet using the online form (AppliWeb), or in-person at any Service Canada centre. Introduced nationally in 2002, AppliWeb allows claimants to apply for EI benefits 24 hours a day, seven days a week, from anywhere they can access the internet. Over the last nine years, usage has remained well above 95%, and it continues to be the prevalent method chosen by claimants applying for EI benefits, with 98.4% of applications submitted via Appliweb during this reporting year (See Annex 4.6.1).
Claim volumes
2.96 million EI applications were received in FY1617, representing an increase of 0.57% from the previous year (see Table 1). Since the 2008 to 2009 recession, there has been an increase in claims as compared to the pre-recession volume of 2.6 million claims. This increase has primarily impacted Western Canada and the Territories which received 60,990 more claims than the previous year; an increase of 6.9%, driven largely by continued high unemployment in Alberta as a result of the commodities downturn and the Fort McMurray wildfires in May 2016.
| - | 2012 to 2013 | 2013 to 2014 | 2014 to 2015 | 2015 to 2016 | 2016 to 2017 |
|---|---|---|---|---|---|
| Canada | 2,759,570 | 2,778,769 | 2,800,865 | 2,942,271 | 2,959,128 |
- * An initial claim is an application for benefits received to establish a new claim (benefit period) for Employment Insurance
- ** A Renewal claim is an application for benefits received to renew or reactivate an existing claim that has already been established and is still in effect, such as where a claimant stops claiming benefits for a period of time (returns to work) and wants to renew that claim
- Source: Employment Insurance administrative data.
Electronic reporting
To receive EI benefits, most claimants must complete and submit biweekly reports, using the telephone reporting service or the internet reporting service. Claimants answer a series of questions which help determine on a week by week basis whether they continue to be eligible for the type of EI benefits they are claiming. 77.1% of claimants used the internet reporting service to submit biweekly reports (see Chart 3 below).

- Source: Mobile Outreach administrative data.
Show data table
| Year | % |
|---|---|
| 2012 to 2013 | 68.4% |
| 2013 to 2014 | 70.6% |
| 2014 to 2015 | 73.1% |
| 2015 to 2016 | 75.5% |
| 2016 to 2017 | 77.1% |
4.3.2 Services for employers
Service Canada works with employers to ensure that the EI program is administered fairly and efficiently. With services supported by the Employer Contact Centre (ECC) and the Canada.ca website, employers can obtain guidance and access to the most up-to-date information regarding the EI program to help them understand their responsibilities and learn about the various services and programs available to them.
Record of Employment (ROE)
ESDC uses the information provided on the ROE to determine if a person qualifies for EI benefits, the benefit rate and the claim duration. Each year, more than 9.9 million ROEs are issued.
To improve the automation of the EI program, ESDC actively encourages the use of electronic ROEs (eROEs) which create organizational efficiencies and reduce administrative burden – employers no longer need to order or store paper ROE forms or send copies to ESDC and their employees. The Department is continuing efforts to reach out to employers and target industry sectors identified as being large paper ROE users. This targeted approach resulted in an increase of eROE submissions by 4.0 percentage points, from 84.1% to 88.1% (see Chart 4).

- Source: Employment Insurance administrative data.
Show data table
| - | 2012 to 2013 | 2013 to 2014 | 2014 to 2015 | 2015 to 2016 | 2016 to 2017 |
|---|---|---|---|---|---|
| Electronic Records of Employment Issued | 6.247235 | 6.868995 | 7.490971 | 8.122245 | 8.726202 |
| Total Records of Employment | 8.966935 | 9.158195 | 9.335571 | 9.656245 | 9.910238 |
| Percentage of ROEs Submitted Electronically | 69.7% | 75.0% | 80.2% | 84.1% | 88.1% |
In the fall of 2016, ESDC successfully decommissioned five outdated ROE Web formats. The decommissioning of these old format ROEs ensured that the ROE Web Application is keeping pace with industry standards. Benefits for employers include fewer errors on the ROE which translates to fewer follow-up calls for additional payroll information.
In an effort to continuously improve services to employers, a feedback function, as suggested by employers, was introduced in the ROE Web Application in October 2016. This new feature allows employers to communicate their service preferences and influence the functionality available within the ROE Web Application. During this reporting period, a total of 9,168 respondents completed the ROE Web questionnaire with 86% of respondents indicated being "Very satisfied" or "Satisfied" with the ROE Web application.
4.3.3 Claims processing
EI benefits are delivered through a national network comprised of processing agents across Canada, working in tandem with automated EI claims processing and workload management systems. The network triages, assesses and adjudicates new applications, applications to reactivate an existing claim, as well as revised claims that are created when new information is received during the claim lifecycle.
Inventory Reduction Strategy
Over the last decade, the Government of Canada has taken steps to make it easier for Canadians to receive their EI benefits through a range of processing modernization and automation efforts. However, EI claim volumes have historically exceeded the funded capacity which has led to a significant increase in the inventory of pending claims. To improve service to Canadians by reducing the pending volume of claims and increasing the level of client service, Service Canada implemented a 24-month inventory reduction strategy beginning in October 2014.
Despite many challenges the Department faced in terms of increased claim volumes resulting from the commodities downturn and the wildfires in Fort McMurray, as well as the implementation of Budget 2016 legislative changes, the target was successfully achieved on September 29, 2016. In 24 months the EI claims inventory had been reduced by 75% from a high of 471,000 to 122,000 claims.
Speed of Payment
Speed of Payment (SOP) refers to the percentage of initial and renewal claims for which the Department sends a payment or non-payment notification to a claimant within 28 calendar days of filing. The performance target is to pay (or notify of non-payment) an annual average of 80% of claims within 28 calendar days of filing. This service standard is used by the Department to measure its ability to process claims in a timely manner.
Of all the initial and renewal claims received during this reporting year, 83.2% were responded to within the 28 day target, and 92% were answered within 1-35 days (see Chart 5, below for details).

- Source: Employment Insurance administrative data.
Show data table
| Speed of payment (in days) | % |
|---|---|
| 1 to 28 days | 83.20% |
| 29 to 35 days | 8.80% |
| 36 to 42 days | 3.70% |
| 43 to 49 days | 2.30% |
| 50+ days | 1.90% |
There is a range of factors that affect EI processing performance—most notably seasonal fluctuations in workload demands where the Department experiences a higher than normal intake of claims. Other factors that can delay the payment of benefits beyond 28 days include incomplete applications requiring clarification of information, and complex applications requiring fact-finding with employers and third parties to render a fair and equitable decision.
While an increasing share of applications is automated by the system, there are still some applications that require agent intervention to address specific issue(s) before a claim can be processed. These manual interventions can create delays in the delivery of EI benefits. Issues include delays in receiving the record of employment (ROE), discrepancies between the application and the ROE, and employers failing to issue ROEs. In addition, unanticipated economic factors or events such as mass layoffs and natural disasters may have an impact on EI processing performance in any given year.
4.3.4 Quality monitoring
ESDC uses a series of checks and balances to ensure that claimants are approved for benefits when appropriate and receive the right payments.
Claimants are supported via prompts, guidelines, and Service Canada employees on-site, throughout the process of submitting EI applications to avoid unnecessary mistakes and delays, and in turn minimize the number of errors. Service Canada employees have been organized into teams working to ensure that EI contributions go where they are supposed to, and that claims are handled correctly the first time. The EI program has worked to adopt a quality by design approach, meaning that some key quality assurance measures have been built right into the first steps of the system to check and validate the information and applications being submitted. This approach provides support to both claimants and employers.
Claimants receiving benefits have the added reassurance of internal verifications run after payments are made to ensure that the calculated amounts were accurate. ESDC's main reviews include the Employment Insurance Payment Accuracy Review (EI PAAR), the Employment Insurance Processing Accuracy Review (EI PRAR), the Individual Quality Feedback (IQF) review, and the National Quality Coaching Program for Call Centres (see Section 4.4.3).
Quality by design
Claimants and employers submitting information and applications are supported by systems designed to provide more help and specific guidance at the beginning, and to notice and alert them to possible missing or incorrect details. This approach, known as quality by design, aims to avoid unnecessary errors and delays.
For example, the EI mobile outreach sessions described above (see Section 4.2.3) proactively provide potential claimants with information about their eligibility, tools to help them find new employment, and guide them through the first phases of submitting an EI application. Similarly, ESDC's ongoing efforts to encourage the move from paper ROEs to eROEs help to reduce error because of real-time submission, and automatic alerts which prompt the user when a required field has been left blank.
Employment Insurance Payment Accuracy Review (PAAR)
In an effort to reduce errors at the start of the claim's process, system edits are in place to validate the information provided by the claimant. It is also important to review claims once they are established to ensure that the benefits paid are accurate and that no mistakes are made while the claimant is in receipt of benefits. Despite best efforts, errors do occur.
Using a Monetary Unit Sampling methodology, the EI Payment Accuracy Review (EI PAAR) estimates the accuracy of EI benefit payments based on a statistically valid number of files each year to identify undetected errors that result in mispayments.
ESDC has an established target rate of 95% Footnote 6 accuracy in benefit payments per year.Footnote 7 This cumulative accuracy level collectively accounts for claimant, employer and ESDC errors. Together, claimants, employers and the Department have maintained an accuracy level of over 93.9% for the last decade, and achieved 95% or more for at least six of those years. During this reporting period the overall accuracy rate reached 95.4%, up from 93.9% the previous year (see Table 2). Annual results can be found in the financial audit of the EI account, reported each year in the Public Accounts of Canada by the Office of the Auditor General.
| - | 2015 to 2016 | 2016 to 2017 | ||
|---|---|---|---|---|
| Total EI benefit payout | $17.8 billion | $19.1 billion | ||
| EI Payment Accuracy Rate | 93.9% | 95.4% | ||
| - | 2015 to 2016 | 2016 to 2017 | ||
|---|---|---|---|---|
| - | Estimated Financial Impact ($M) | Estimated Error Rate | Estimated Financial Impact ($M) | Estimated Error Rate |
| - | $1,100 million | 6.1% | $887.7 million | 4.7% |
| Errors by source: | - | - | - | - |
| Employer | $427.5 | 2.4% | $286.6 | 1.5% |
| Claimant | $519.3 | 2.9% | $361.7 | 1.9% |
| ESDC | $149.3 | 0.8% | $239.5 | 1.3% |
- Note: Estimated financial impacts are the sum of overpayments and underpayments.
- Source: Employment and Social Development Canada.
As noted in Table 2 above, the overall payment accuracy rate of all EI claims increased by 1.5%. In response to an audit by the Office of the Auditor General (OAG), the EI Quality Task Force was formed in November of 2016. The mandate of the Task Force was to analyze the EI PAAR error trends and determine the causes of the increased value of the errors and recommend actions to address them. As a result, a number of recommendations were made and are in the process of being implemented. For example, fact sheets are being created to support users (employers and clients) and processing agents, and quality monitoring and training for the most common Service Canada errors remains an ongoing focus.
Changes made to simplify the application process help reduce claimant errors. This year, the claimant error rate decreased, from 2.9% last fiscal year to 1.9%. The most common claimant errors occur after the claim is established and include claimants failing to report earnings, claimants and failing to report the refusal of a job, quitting a job, or being dismissed from a job while in receipt of benefits.

- Note: Results are provided with a level of confidence of 95% and a margin of error of ± 5%.
- Source: Employment and Social Development Canada.
Show data table
| Year | % |
|---|---|
| 2002 to 2003 | 0.79% |
| 2003 to 2004 | 2.10% |
| 2004 to 2005 | 1.35% |
| 2005 to 2006 | 2.03% |
| 2006 to 2007 | 1.40% |
| 2007 to 2008 | 1.77% |
| 2008 to 2009 | 1.21% |
| 2009 to 2010 | 1.37% |
| 2010 to 2011 | 2.98% |
| 2011 to 2012 | 2.03% |
| 2012 to 2013 | 2.29% |
| 2013 to 2014 | 2.37% |
| 2014 to 2015 | 2.22% |
| 2015 to 2016 | 2.91% |
| 2016 to 2017 | 1.89% |
The employer error rate also decreased this year, from 2.4% to 1.5%. This decrease could be related to the increase in electronic ROEs (eROEs), which contain comparably fewer errors than traditional paper ROEs. To clarify, in order to identify employer errors, all ROEs used to establish a claim under review are validated with the employer. As detailed in Table 3, the percentage of eROEs reviewed in the EI PAAR sample continues to increase year over year, from 65.1% in 2014 to 80.6% in 2017, while the paper ROEs continue to decrease. Of importance to note this fiscal year, eROEs accounted for over three-quarters of ROEs in the PAAR sample, a slight increase over the previous year; however, paper ROEs were still over twice as likely to contain a monetary error. ESDC is committed to encouraging employers to move to eROEs, and to incorporate more tools which will help to eliminate possible sources of error during the first steps of information and application submission. Ongoing analysis will also continue in order to understand employer errors and to raise awareness within the employer community about why these mistakes happen, the financial value, and possible ways to avoid them.
| - | 2013 to 2014 | 2014 to 2015 | 2015 to 2016 | 2016 to 2017 | ||||
|---|---|---|---|---|---|---|---|---|
| Count | Percentage by ROE type | Count | Percentage by ROE type | Count | Percentage by ROE type | Count | Percentage by ROE type | |
| Number of eROEs validated | 503 | 65.1% | 589 | 73.3% | 589 | 76.4% | 621 | 80.6% |
| Number of paper ROEs validated | 270 | 34.9% | 214 | 26.7% | 182 | 23.6% | 149 | 19.4% |
| Total ROEs validated | 773 | 100.0% | 803 | 100.0% | 771 | 100.0% | 770 | 100.0% |
| Incorrect eROEs | 37 | 7.4% | 30 | 5.1% | 61 | 10.4% | 46 | 7.4% |
| Incorrect paper ROEs | 38 | 14.1% | 21 | 9.8% | 38 | 20.9% | 26 | 17.4% |
- Source: Employment and Social Development Canada.
ESDC's efforts and progress towards automation have contributed to maintaining low levels of error (see Chart 7 Service Canada Errors). Periods of higher claim volume can shift the emphasis to speed and require more manual data entry. Nearly half of all ESDC errors found this year, were caused by clerical, or more specifically, transcription and manual entry mistakes. The error rate increased to 1.3% from last year's 0.8%. The Department continues to explore opportunities for improvement including increasing automation and identifying other ways to help limit the chances of error.

- Note: Results are provided with a level of confidence of 95% and a margin of error of ± 5%.
- Source: Employment and Social Development Canada.
Show data table
| Year | % |
|---|---|
| 2002 to 2003 | 2.7% |
| 2003 to 2004 | 2.3% |
| 2004 to 2005 | 2.0% |
| 2005 to 2006 | 2.3% |
| 2006 to 2007 | 2.8% |
| 2007 to 2008 | 2.2% |
| 2008 to 2009 | 1.6% |
| 2009 to 2010 | 1.1% |
| 2010 to 2011 | 1.9% |
| 2011 to 2012 | 1.0% |
| 2012 to 2013 | 0.9% |
| 2013 to 2014 | 0.5% |
| 2014 to 2015 | 1.0% |
| 2015 to 2016 | 0.8% |
| 2016 to 2017 | 1.3% |
Employment Insurance Processing Accuracy Review (PRAR)
Claims must be processed in a fair and equitable way, following all of the approved processes and policies. The EI Processing Accuracy Review (EI PRAR) randomly samples 3,080 claims per fiscal year, adjudicated since the April of that reporting period and provides an estimated rate of conformity.
Fully Automated Claims Processing has been 100% accurate since the 2010 to 2011 fiscal yearFootnote 8. Despite meeting the target every year since 2008, the processing accuracy rate for partially automated claims and/or decisions requiring manual intervention decreased to 85.5% this year, from 90.8% the previous year.
Individual Quality Feedback
The Individual Quality Feedback (IQF) review assesses Service Canada employee processing accuracy on an ongoing basis. Reviewers sample an average of 10 to 20 case files handled by each agent to verify accuracy and consistency. These results of these reviews identify when training and coaching, are required or appropriate.
4.4 Specialized Call Centres
Clients and employers may have questions that cannot be answered by the general information provided on the website or by calling 1 800 O-Canada. In these instances, clients can reach out to the Employment Insurance specialized call centres with more specific questions and employers can turn to the Employer Contact Centre (ECC) for specific guidance. This section describes the availability of the specialized call centres to respond to specific questions.
4.4.1 Employment Insurance Specialized Call Centres
Consisting of ten call centres, the EI Specialized Call CentreFootnote 9 network is the primary point of contact for EI client specific enquiries relating to the application process and application status, as well as benefit eligibility and delivery. Calls are distributed across the network, based on availability of resources, regardless of where they originate.
Overview of call centre performance
Call centres are equipped with an Interactive Voice Response (IVR) system, which enables clients to self-serve for transactions such as application status, obtaining payment details and completing bi-weekly declarations. The total EI call volume reached almost 30.6 million calls during the current reporting year. Almost 61% of these calls (18.6 million) were resolved in the IVR without the need to speak to an agent, compared to 55% the previous year.
Specialized agents are available to support clients for enquiries that cannot be resolved by self-serve (specifically, declaring receipt of specific types of earnings, including wage loss insurance and severance pay). While the majority of clients' telephone enquiries are resolved at the call centre, requests that are not well-suited to be handled efficiently within a call centre environment (for example, when a claimant reports having been dismissed from a job) are communicated to the processing area for appropriate follow-up.
Budget 2016 increased EI Specialized Call Centre funding in order to improve accessibility by increasing the number of call centre agents, reducing waiting times to ensure that clients are able to access the information and support they need, and that claimants receive their EI benefits as quickly as possible.
This temporary additional funding allowed EI call centres to hire new staff making it possible to handle significantly more enquiries from citizens. During this reporting year, 4.0 million calls were answered by an agent, 542,914 more calls than the previous year. Not only were agents able to answer more calls, they were able to do it more quickly. The service level target for the EI specialized call centres is to answer 80% of calls within 10 minutes. During this reporting year, 48% of calls were answered within this 10-minute timeframe, an increase from the previous year's 37%.
Also due to the additional funding from Budget 2016, a significant reduction in call blockageFootnote 10 was achieved, again because of increased staffing. More clients were able to get through to a call centre agent: blocked calls to agents decreased from roughly 10.3 million to 6.9 million, which resulted in 3.4 million fewer blocked calls as compared to the previous reporting year. Furthermore, 1.1 million calls were abandonedFootnote 11, 21,008 fewer than last year (See Table 4).
| Fiscal Year | 2014 to 2015 | 2015 to 2016 | 2016 to 2017 |
|---|---|---|---|
| Call answered by an agent | 3,789,171 | 3,418,976 | 3,961,890 |
| Blocked calls | 12,005,794 | 10,272,442 | 6,870,008 |
| Abandoned calls | 1,097,282 | 1,107,348 | 1,086,340 |
- Source: Employment and Social Development Canada.
During this reporting year, 83.7% of calls were resolved by call centre agents with no additional follow-up required. The resolution rate is lower than the previous year 86.3%Footnote 12. This result may have been affected by changes made to the call tracking tool, which now allows ESDC to obtain more information about call resolution. When looking at resolution rates over a longer period, FY1617 results are slightly higher than recent historical trends; the average resolution rate of the previous 4 years is 83.5%.
The top five reasons clients requested agent assisted services were:
- enquiries regarding the status of a claim (includes claims within or not the timeframes, as well as Initial, revised, renewals);
- enquiries about entitlement conditions for EI benefits, unrelated to a claim;
- guidance on how to file their application;
- claimants declaring a condition that affects their availability; and
- clarification on how their claim was calculated as well as their weeks of entitlement and benefit rate.
Call Centre Improvement Strategy
With the current telephony system at its end-of-life, a telephony platform that provides access to new functionality is critical for continued call centre modernization. ESDC has been working closely with Shared Services Canada who was mandated to acquire a new and hosted contact centre solution (HCCS) on behalf of the Government of Canada. The implementation contract for this platform was awarded and ESDC was given access to the contract/vendor in April 2017.
Pre-migration readiness activities are well underway to support the migrations of the Specialized Call Centre network to the HCCS platform. In particular, a Call Centre Improvement Strategy was developed to frame the transformation work in call centres resulting from the migration to HCCS, Budget 2016 investments, and the recommendations stemming from the Service Quality Review. The Strategy will enhance the client experience by leveraging industry best practices and implementing ongoing business and technology improvements to increase accessibility.
One of the initial activities associated with this strategy was a consultative workshop with various call centre staff, including client-facing agents, to discuss ways to reduce call handle time. Shorter calls are less onerous on clients, and also allow an agent to serve more clients in a day. Some of the strategies implemented following this workshop were a revised client greeting, changes to the process for assisting claimants with electronic claimant reports, and the revision of select reference procedures for call centre agents. The Call Centre has evaluated each implemented measure and initial time savings have already been identified; further measures remain to be implemented and comprise key components of the Call Centre Improvement Strategy for the next year.
ESDC conducted a call driver root cause analysis as part of the Call Centre Improvement Strategy. Call tracking information for the previous fiscal year (2015 to 2016) was reviewed and analyzed to better understand who calls and why, with the goal of enhancing service delivery to avoid forcing clients to contact the call centre unnecessarily. Recommendations emerging from this root cause analysis have also been used to shape call centres' planning for next fiscal year.
4.4.2 Employer Contact Centre (ECC)
Launched in June 2011, the Employer Contact Centre (ECC) provides enhanced services to employers through an accessible, national, single point of contact. The three ECC sites are located in Vancouver BC, Bathurst NB and Sudbury ON.
Employers contact the ECC currently to obtain information and assistance on the following service offerings:
- ROE advice and guidance;
- paper ROE orders;
- ROE Web (technical support);
- Grants and Contributions Online Services (technical support);
- Report on Hirings (Data Gateway support);
- work-sharing;
- Automated Earnings Reporting System (Data Gateway support);
- General information on the Temporary Foreign Worker Program (TFWP) (excluding jobs in Quebec, but including in home caregiver positions and the Global Talent Stream in Quebec); and
- Job Bank for Employers (see Chapter 2 for more information)
The ECC continues to assess its client service model and the best way to support additional service offerings. To expand further, the ECC will introduce an interactive voice response system which will be available through the migration to the new government wide call centre telephony platform.
The ECC answered a total of 558,596 calls as compared with the 536,702 calls in the previous year. Like the specialized EI Call Centre, the ECC has a target of answering 80% of calls within 10 minutes. During this reporting year, the ECC exceeded the target and answered 96% of calls within 10 minutes.
The top five reasons employers called the ECC to speak to an agent for assistance were the same as in the previous year:
- to order paper ROE forms;
- to enquire about ROE Web;
- for guidance on completing/submitting a ROE;
- for information on the TFWP; and
- for referrals to other programs or departments (for example, calls from employees).
In a study about the nature of employers' EI enquiries referenced in last year's Monitoring and Assessment Report, the ECC committed to continuing to monitor call driver trends as promotion of electronic services continues, and the resulting impact on paper ROE demands. Although still the highest call driver, a decrease in calls for paper ROE orders was observed. As orders decreased, calls related to ROE Web increased. It can therefore be reasonably assumed that ROE Web promotion in the employer community has been effective.
4.4.3 National Quality Coaching Program for Call Centres
The National Quality Coaching Program (NQCP) ensures that clients receive consistent high quality service from specialized call centres, through the regular monitoring and coaching of agents.
Agent calls are monitored on an ongoing basis and regular feedback is provided, including coaching and training plans tailored to individual needs. Additional monitoring can then be done as part of these plans to ensure continued performance improvements. A statistically valid sample of calls is verified to confirm that agents provide accurate and complete information. National calibration sessions are held on a regular basis to make sure that monitoring criteria are being applied the same way across all call centres.
Evaluations of responses to calls to the EI Specialized Call Centres include multiple elements such as whether accurate and complete information are provided and the agent's tone of voice. Each element is categorized as meeting, partially meetingFootnote 13, or not meeting quality expectations. 86% percent of the reviewed calls had an overall call score of meeting or exceeding quality expectations, or partially meeting expectations with only minor improvements requiredFootnote 14. For the specific element "Provides Accurate and Complete Information" which is a key indicator of the result achieved for the client, 89% of calls met or partially met quality expectations, with only minor improvements required.
Agent responses to calls to the Employer Call Centres are assessed using similar elements. 89% of calls monitored from the Employer Call Centre, had an overall call score that was categorized as meeting or exceeding quality expectations, or partially meeting expectations with only minor improvements required. 94% of calls met or partially met quality expectations for providing "Accurate and Complete Information" with only minor improvements required.
The National Quality Coaching Program for Call Centres is part of the system of checks and balances that ESDC uses to make sure that clients are receiving high quality service. It is also complemented by the PRAR review which assesses the accuracy of transaction processing (see section 4.3.4). EI call centre agents had a processing accuracy rate of 90% this reporting year, well surpassing the target of 80%.
4.5 Recourse
Should claimants, employers and other persons not be in agreement with Service Canada decisions, they may initiate a "Request for Reconsideration". If the individual remains unsatisfied with the reconsidered decision, he or she may file an appeal with the Social Security Tribunal of Canada (SST). This arms-length administrative tribunal will then review and determine the merits of the decision. Information about recourse processing is available in this section. For more information about the management of the SST, please visit Social Security Tribunal of Canada.
4.5.1 Employment Insurance Requests for Reconsideration
Claimants, employers and other persons affected by a claim related decision that disagree, have the right to request a formal reconsideration within 30 days from the date the decision was communicated, or at a later time as permitted by the EI Commission. A formal request for reconsideration of the decision allows the person to ask for a review, and provides an opportunity to submit new or additional information, if applicable. The Commission will review its decision to ensure that it is based on the accurate interpretation of legislation, program policies and jurisprudence, and is supported by complete information. The review is performed by a different Service Canada employee than the one who made the initial decision.
Out of a total 2,968,597 initial and renewal claims adjudicated during FY1617, the Commission received 55,214 requests for reconsideration (See Table 5). The Commission aims to complete all reviews within 30 days from receipt of the request. The average time for completion was 35 days, with 59.6% of requests completed within the 30 day target (details provided in Table 5 below).
At the beginning of the reporting period, the inventory of pending requests for reconsideration was 6,400 files. In order to meet the service standard of processing 70% of EI Requests for Reconsideration within 30 calendar days from receipt of the request, a "Request for Reconsideration Inventory Reduction Strategy" was implemented. From April 2, 2016, to December 31, 2016, the pending inventory was reduced from 6,440 to 2,400; representing a decrease of 60.1%.
| Types of Requests | Totals |
|---|---|
| Requests received from claimants | 54,179 |
| Requests received from employers | 904 |
| Requests received from other clients* | 131 |
| Total requests received | 55,214 |
| Standards | Performance achieved |
| Requests completed | 58,194 |
| Percentage of requests completed within 30 days | 59.6% |
| Average time for completion (days) | 35 |
| Percentage of initial decisions reversed following review | 38.7% |
| Percentage of initial decisions adjusted following review | 11.9% |
- *Other client is any person who is subject to a decision of the Commission and is not a claimant or an employer.
- Source: Employment and Social Development Canada.
The EI Act allows claimants to seek recourse on almost any decision related to a claim for benefits. While there are over 50 types of decisions or issues that can be subject to recourse, the five most frequently challenged issues are shown in the pie chart below (See Chart 8). These issues generally involve a complete denial of benefits, such as a disqualification for voluntarily leaving employment without just cause, or a financial sanction for misrepresentation.

- Source: Employment Insurance administrative data.
Show data table
| Issues | Percentage |
|---|---|
| Voluntary leaving without just cause | 25.4% |
| Benefit period not established | 11.5% |
| Misconduct | 9.5% |
| Misrepresentation-Penalty | 8.7% |
| Non-availability for work | 8.9% |
4.5.2 Employment Insurance appeals to the Social Security Tribunal of Canada
The Social Security Tribunal of Canada is an independent administrative tribunal that makes quasi-judicial decisions on matters relating to the Canada Pension Plan, the Old Age Security Act and the Employment Insurance Act. The Tribunal's mandate is to offer fair, transparent, credible and impartial appeal processes that are efficient and effective.
The Tribunal is made up of a General Division (GD) and an Appeal Division (AD). The GD is comprised of two sections – one for addressing employment insurance (GD-EI) and the other for income security (GD-IS). For the purposes of this report, only the GD-EI is examined.
General Division – Employment Insurance Section (GD-EI)
A claimant or employer who disagrees with a decision made by Service Canada regarding eligibility for EI benefits can file an appeal of the reconsideration decision to the Tribunal's General Division, Employment Insurance Section (GD-EI). However, they must do so within 30 calendar days of receipt of the reconsideration decision.
Service Canada's role in the appeal process at this stage is to provide the Tribunal with the "reconsideration file" containing all of the documents in its possession relevant to the decision(s) being appealed. Service Canada's "reconsideration file" includes all original materials used in making and reviewing its initial decision. Service Canada will also, when requested, answer any questions or requests for additional information from the Tribunal member and may participate in appeal hearings.
Service standards and performance
Service Canada is required to provide its representation on the issues under appeal and file the information with the Tribunal within 7 days from the time it is notified of an appeal.
With regard to standard casesFootnote 15, the Tribunal respects a service standard that 85% of final decisions be made within 90 days of the appeal being filed as of September 1, 2015. However, to align with the Social Security Tribunal Regulations, the Tribunal aims to issue its decisions within 30 days after the day of the hearing.
For the purposes of performance measurement, the Tribunal manages and tracks Employment Insurance appeals in two categories: regular and group appeals. In contrast to an individual claimant appeal, a "group appeal" constitutes when more than one claimant appeals the decision rendered concerning the same or a similar matter. In this situation, for example where multiple claimants of the same former employer lost their jobs under similar circumstances, the Tribunal considers the appeals as one appeal.
As such, group appeals tend to be more complex and require more time to complete.
Over this reporting period, Service Canada sent a total of 3,633 reconsideration files to the Tribunal's General Division, 99% of which within the legislated 7 days. The tribunal then took 36 days to complete the appeal file, and on average, issued a decision within 184 days.
On April 1, 2016, the Tribunal's GD-EI Section had 1,816 active appeals in its inventory. It received 4,116 appeals from claimants, employers and other clients, of which 192 were group appeals (see Chart 10).
Of the files received (see Table 6), the Tribunal concluded 3,531 cases (see Chart 9), leaving an active inventory of 2,400 on March 31, 2017. 173 were group appeals.
During this reporting period, the average age of active files increased from 95 days to 117 days.
| Appeals | Total |
|---|---|
| Appeals received including group appeals | 4,116 |
| Group appeals | 192 |
| Appeals concluded | 3,531 |
| Percentage of appeals decided: allowed (favorable to appellants) | 26% |
| Percentage of appeals concluded: summarily dismissed (no reasonable chance of success) | 3.5% |
Source: Employment Insurance administrative data.
The percentage of issues most frequently appealed to the Tribunal's GD-EI Section was generally very similar to those challenged through the request for reconsideration process (see Table 7). However, when the Tribunal receives a large group appeal, the percentage of appeals for a specific issue can vary considerably.
| Types of Appeals | Total | Percentage |
|---|---|---|
| Voluntary leaving – without just cause | 1,064 | 26.8% |
| Misconduct | 536 | 13.5% |
| Earnings | 497 | 12.5% |
| Benefit period not established | 315 | 7.9% |
| Availability for work | 262 | 6.6% |
| Total | 3,963 | 67.3% |
Source: Employment Insurance administrative data.

- Source: Employment Insurance administrative data.
Show data table
| Types of Outcomes | Number of times the outcome occurred |
|---|---|
| Dismissed | 2163 |
| Allowed | 844 |
| Withdrawn/other | 282 |
| Summary dismissals | 118 |
| Concession | 54 |

- Source: Employment Insurance administrative data.
Show data table
| Types of Outcomes | Number of times the outcome occurred |
|---|---|
| Dismissed | 21 |
| Allowed | 128 |
| Withdrawn/other | 38 |
| Concession | 5 |
Appeal division – Employment Insurance Section (AD-EI)
When a party to the appeal disagrees with the decision made by the Tribunal's General Division, the party may file a request for leave to appeal before the Tribunal's Appeal Division, the second level of appeal. The party may include Service Canada on behalf of the Canada Employment Insurance Commission.
With the exception of appeals from summary dismissals, the first step is to file an application for leave to appeal. This means asking the Appeal Division for permission to appeal when the appellant is of the view that the GD-EI Section:
- failed to observe a principle of natural justice or otherwise acted beyond or refused to exercise its jurisdiction; or
- erred in law in making its decision, whether or not the error appears on the face of the record; or,
- based its decision on an erroneous finding of fact that it made in a perverse or capricious manner or without regard for the material before it.
Service standards and performance
Service Canada is responsible for sending their written representation within 45 days of the "leave to appeal decision" in cases where the Tribunal's Appeal Division grants leave to appeal.
As of September 1, 2015Footnote 16, the Tribunal implemented the following service standards:
- on Decisions on Leave to Appeal, 85% of decisions on leave to appeal will be made within 60 days from filing of leave –application; and
- on Final Decisions (where leave has been granted), 85% of final decisions will be made within 7 months from the date leave to appeal was granted.
Service Canada sent a total of 186 reconsideration files to the Tribunal's Appeal Division during FY1617, 97% of which were sent within the legislated 45 days.
On April 1, 2016, the Tribunal's Appeal Division had 1,692 active EI appeals in its inventory. It received 339 EI appeals and concluded 1,386 EI cases, of which 971 were group appeals and 2 were case transfers from the Office of the Umpire (the predecessor of the Appeal Division). Of the active inventory, 1,445 were from a group appeal. The resulting active inventory was 645 EI appeals on March 31, 2017 (see Table 8). This constituted a reduction of 62%. Furthermore, the AD-EI reduced the average age of its active caseload from 233 days to 172 days – a 26% reduction.
| Types of appeals | Total |
|---|---|
| Total applications for leave to appeal and appeals received | 339 |
| Total applications for leave to appeal and appeals completed | 1,386 |
| Applications for leave to appeal denied | 151 |
| Appeals withdrawn, dismissed or concluded for other reasons | 692 |
| Appeals allowed (decision favorable to appellant) | 545 |
Source: Employment Insurance administrative data.
Additional information on the Tribunal
All Appeal Division decisions and a selection of General Division decisions rendered by the Social Security Tribunal of Canada are available on the following sites:
For detailed information about the Tribunal's performance and activities during this reporting period, and the Social Security Tribunal Appeal Service Improvement, please refer to the Tribunal's Achievement Report 2016 to 2017.
On March 7, 2017, a review of the Tribunal was commissioned by the Minister of Families, Children and Social Development to improve the Tribunal's processes and to ensure it meets the needs of vulnerable Canadians through a fair, objective, and responsive appeal process, while respecting the Tribunal's decision-making independence. Although outside of the scope of the current reporting period, the report was completed in October 2017, and has been made available online at Canada.ca.
4.6 Integrity services
Canadians expect sound stewardship and accountability from the EI program. ESDC has well-established activities, processes, and tools in place to prevent, detect and manage error, fraud and abuse so that the right benefits are paid to the right person, in the right amount. These efforts strengthen the integrity of ESDC programs and demonstrate effective and prudent stewardship of public resources
4.6.1 Administrative reviews and investigations
Integrity activities in ESDC focus primarily on detection activities using a variety of approaches and measures to help identify and address error, fraud and abuse. The most significant of these activities are directed towards conducting administrative reviews and investigations.
During the reporting year, close to 320,000 administrative reviews and investigations were conducted into suspected error, fraud and abuse of the EI program. These efforts found that the most common type of unintentional error was made when claimants incorrectly declared their work and earnings, while the most common type of intentional error was when a claimant knowingly failed to declare their work, earnings, or self-employment income; failed to declare periods when unavailable for work; and/or failed to report absences from Canada.
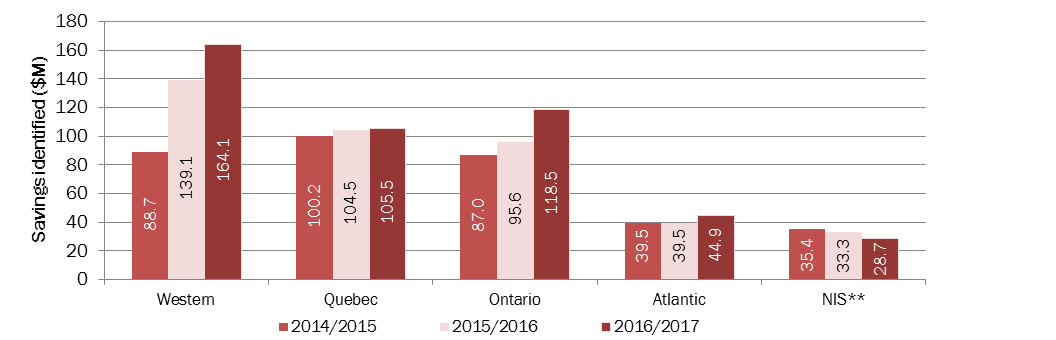
Combined, these administrative reviews and investigations resulted in identified net savings totalling $461.7 million to the EI Operating Account (see Chart 11). The savings amount reflects a combination of overpayments, penalties, as well as, the prevention of future ineligible payments. These efforts benefit both employee and employer payers of EI premiums as the savings reduce the overall cost of the EI program when overpayments are recouped.
ESDC uses several methods to recover funds from EI claimants who have been overpaid. This includes the automatic recovery of monies from active EI benefit claims (either the full amount or an agreed upon partial deduction), voluntary cash payments or the collection of the debt by the Canada Revenue Agency (CRA) through an agreed upon repayment schedule. When the claimant is capable of paying but collection efforts have failed, ESDC can recover monies owing through an income tax refund or income tax reversal, a garnishment of wages and other income, or bank deposits. As a last resort, ESDC can seek federal court certification where the court converts the money owing from an EI overpayment into a civil judgment debt, recoverable by a seizure of assets.
- Note: The numbers ($M) have been rounded to the nearest hundred thousand. The national amounts have been calculated using the raw data.
- ** NIS: National Investigative Services (NIS). Cases dealing with unreported absences from Canada while on Employment Insurance, and the Report on Hirings program are centrally managed through Integrity's NIS centre in Miramachi, NB.
- Source: Employment Insurance administrative data.
Show data table
| Region | Year | ||
|---|---|---|---|
| 2014 to 2015 | 2015 to 2016 | 2016 to 2017 | |
| Western | 88.7 | 139.1 | 164.1 |
| Quebec | 100.2 | 104.5 | 105.5 |
| Ontario | 87.5 | 95.6 | 118.5 |
| Atlantic | 39.5 | 39.5 | 44.9 |
| NIS | 35.4 | 33.3 | 28.7 |
4.6.2 Claimant Information Sessions
In addition to administrative reviews and investigations, integrity activities also include outreach and prevention activities, such as Claimant Information Sessions (CIS). The purpose of these sessions is twofold, to provide claimants with information on programs and services available to help them find suitable employment and to inform them about their rights and obligations regarding the EI program requirements and the consequences of abusing the system (namely, penalties or prosecutions).
ESDC held over 11,000 sessions in FY1617, an increase of 2% over the previous fiscal and directed over 110,000 EI claimants to attend a session, also about a 2% increase over the previous year (See Table 9). Claimants were identified and directed to a session based on the local job-demand in their previous occupation and the availability of work.
| 2014 to 2015 | 2015 to 2016 | 2016 to 2017 | |
|---|---|---|---|
| Number of client information sessions | 10,195 |
10,800 |
11,012 |
| Percentage change in the number of client information sessions | n/a |
+6% |
+2% |
Source: Employment and Social Development Canada.
Attendance at these sessions is mandatory; however, claimants have an opportunity to reschedule if needed. Should claimants not attend or fail to provide evidence of an active job search, their EI benefits could be suspended.
4.6.3 Integrity quality initiatives
In support of efforts to prevent, detect and manage error, fraud and abuse in the EI program, a national quality team helps ensure consistency in integrity investigation activities that take place across the country. The team's work includes ensuring that each of the four regions has quality advisors, quality management plans and consistent monitoring based on national procedures and the Employment and Insurance Act.
The accuracy of the Social Insurance Registry (SIR) is fundamental to all programs and services that use the Social Insurance Number (SIN) to identify clients accurately, including the EI program. Authenticating the identity of clients is crucial to ensuring that the individual requesting services or benefits is the correct SIN holder. The SIN program supports this effort through the use of strict identity and quality management practices designed to ensure that clients applying for a SIN, or updating their SIN records are properly identified and that SIN records are accurate. The SIN program electronically validates the applicant's identity information with the issuing source when performing transactions. When validated, the risk of critical errors when processing SIN transactions is significantly reduced.
4.6.4 Risk management
Enhancing program integrity is fundamental to delivering effective and efficient citizen-centred services and identifying incorrect payments including both under and overpayments. ESDC uses various risk-based strategies to improve the overall integrity of the EI program so that correct payments are made to the right person in the right amount and that resources are directed to higher-risk cases.
For example, ESDC has various automated programs and control mechanisms in place to prevent, detect and address fraudulent activities. More specifically, data matches are performed to detect potential situations of non-compliance, and risked-based modelling is used to identify situations posing higher risks. In addition, analytical analysis is undertaken on the data to detect anomalies and abnormal patterns of behaviour such as banking of hoursFootnote 17, and lay daysFootnote 18 to name a few. These tools, coupled with, potential issues flagged during the processing of a claim or voluntary disclosures on the part of EI claimants allow the Department to allocate integrity resources to higher risk cases which helps to prioritize investigation activities and minimize the investigation of EI claimants.
As part of its risk management strategies, ESDC also has a robust risk analysis function to quantitatively and qualitatively assess program integrity risks and to better understand the root cause of "mispayments". Developing appropriate mitigation strategies, including implementing additional controls where required to address any identified vulnerabilities is also part of this activity.
Generally, the number of EI administrative reviews and investigations that are conducted annually is in line with the number of cases which are considered to be high-risk; however in any given year the volume might vary slightly based on the changing nature and significance of identified risks.