
Employment Insurance Monitoring and Assessment Report for the fiscal year beginning April 1, 2016 and ending March 31, 2017
Chapter III: Impact and effectiveness of Employment Benefits and Support Measures
From: Employment and Social Development Canada
On this page
- 1. National overview
- 2. Provincial and territorial EBSM activities
- 3. Evaluation of Employment Benefits and Support Measures (EBSM)
- 4. Pan-Canadian activities and the national employment service
Activities delivered under Part II of the Employment Insurance (EI) Act help unemployed individuals in Canada prepare for, find and maintain suitable employment. Under the umbrella of Employment Benefits and Support Measures (EBSMs), these activities include programs delivered by provinces and territories under Labour Market Development Agreements (LMDAs), as well as the Government of Canada's pan-Canadian programming and functions of the National Employment Service (NES).
This chapter presents EBSM program results achieved under Part II of the EI Act during the fiscal year beginning on April 1, 2016 and ending on March 31, 2017 (FY1617). A national overview of EBSM-similar programming delivered under the LMDAs and by Aboriginal Skills and Employment Training Strategy (ASETS) agreement holders is provided in Section I, entitled “National Overview.” Provincial and territorial employment programming activities are presented in Section II, “Provincial and Territorial Summaries,” with a description of each jurisdiction's labour market and employment priorities. Section III presents consolidated findings and conclusions as part of the 2012-2017 second cycle of LMDA evaluations and an overview of effects of LMDAs on the well-being of active EI claimants in Part II programming. Section IV discusses the results of Employment and Social Development Canada's (ESDC) delivery of pan-Canadian activities, and the administration of certain NES functions.
Notes to readers
- The data used to analyze EBSM activities were collected from provinces, territories and ASETS agreement holders. Governments continue to improve data quality and collection to ensure accurate, reliable and consistent information. While all data sets are verified before publication, systems and operational changes may affect the comparability of data from year to year.
- Throughout this chapter, references to average levels of activity and to highs and lows generally use the 10-year period from FY0607 to FY1617 as a frame of reference.
- Statistics Canada's Labour Force Survey (LFS) is the source of labour market data reported. Data for Canada and the provinces are fiscal-year averages, calculated using seasonally unadjusted monthly data, while monthly references are seasonally adjusted. Data for the Northwest Territories, Yukon and Nunavut are calculated using unadjusted three-month moving averages of monthly data. In discussions of employment trends by industry, standard industry titles are taken from the North American Industry Classification System (NAICS).
- Real GDP data and other non LFS macroeconomic indicators are from Statistics Canada's Economic accounts. Forecasts are based on published analysis from the Bank of Canada, the Conference Board of Canada, Canadian banks, OECD and Statistics Canada, as well as on internal analysis, using information available as of February 2018.
1. National overview
1.1 Economic and labour market context
In FY1617, Canada's labour force grew by 0.8% to a total of 19.6 million, compared to FY1516. Over the same period, total employment grew at a faster pace (+1.0%), with 174,000 additional workers year over year, to a total of 18.2 million. Women accounted for nearly two-thirds of the employment increases, mostly in full-time work. Among men, part-time jobs grew by 6.6%, whereas their full-time employment edged down by 0.2%.
2016/2017 Employment Benefits and Support Measures
| EI active & former clients (LMDA) | Non-insured clients (LMDA) | Pan-Canadian1 |
|---|---|---|
429,382 |
304,927 |
17,563 |
| Active | Former | Non-insured |
| 46.7% |
12.7% |
40.6% |
| Youth (15–24)2 |
Core Age (25–54)2 |
Older Workers (55+)2 |
| 20.4% |
66.7% |
12.9% |
| FY1617 | Year-over-year change | |
|---|---|---|
| Employment Benefits | 147,054 | +0.4% |
| Support Measures: EAS | 999,844 | +1.0% |
| Pan-Canadian | 31,744 | +0.8% |
| FY1617 | Year-over-year change (p.p.) | |
|---|---|---|
| Employment Benefits | 12.8% | 0.1 |
| Support Measures: EAS | 87.1% | 0.1 |
| FY1617 ($ million) |
Year-over-year change | |
|---|---|---|
| Employment Benefits | $1,071 | -4.9 |
| Support Measures: EAS | $714.5 | +22.3% |
| LMPs and R&I | $282.4 | +21.9% |
| Pan-Canadian | $114.1 | +1.4% |
| Total expenditures | $2,181.7 | +6.2% |
| Indicator | Total | Year-over-year change |
|---|---|---|
| Active claimants served | 351,362 | -1.5% |
| Returns to employment | 187,172 | +4.8% |
| Estimated unpaid benefits ($ million) |
$1,345.00 | +16.6% |
- 1 EI Part II Pan-Canadian services to individuals are through the Aboriginal Skills and Employment Training Strategy.
- 2 Age distribution does not equal 100%, as the “unknown” category is not reported here. Date of birth is not collected for clients in SD-Apprentices and Group Services.
- 3 Totals may not add up exactly due to rounding; accounting adjustments are not included.
In FY1617, Canada's unemployment rate was 6.9%, sliding down by 0.1 percentage points over the previous year. The unemployment rate for youth (aged 15-24 years old) was 13%, which was considerably higher than among core-age workers (25 to 54 years old) and workers aged 55 and older, whose unemployment rates were 5.8% and 6.0%, respectively.
Canada's labour market participation rate in FY1617 was 65.7%, a decline of 0.2 percentage points compared to FY1516. In the context of an aging population, Canada's labour market participation rate steadily declined over the last decade, with proportionally fewer new workers to replace retirees.
According to Statistics Canada's Business Payroll Survey, Canadian businesses reported an average of 218,000 job vacancies in FY1617, a 2.6% drop compared to the previous yearFootnote 1. The number of unemployed workers across Canada dropped to 1.35 million (-0.3%) in the current year, compared to 1.36 million in FY1516Footnote 2. Labour market tightness is often assessed using the unemployment-to-job vacancies (U/V) ratio (number of unemployed people for every vacant position). In FY1617, for every job vacancy, 6.2 individuals sought employment, compared to 6.1 a year earlier. This suggests labour market tightness in FY1617 remained unchanged year-over-year.
In 2016, Canada's real GDP expanded by 1.4%, with growth in most regions of the country. Strong growth in Yukon (+8.0%), British Columbia (+3.5%), Ontario (+2.6%), Prince Edward Island (+2.3%), and Manitoba (+2.2%) were offset by real GDP declines in Alberta (-3.7%) and Saskatchewan (-0.5%), where low oil and commodity prices continued to negatively impact the economy of the two provinces.
In 2017, Canada's real GDP is estimated to have grown by 3.0%, largely driven by increased consumption and business fixed investmentsFootnote 3. The OECD estimates that Canada's real GDP growth in 2017 was the strongest among G-7 countries for the year.
1.2 Main resultsFootnote 4
Increase in the number of clients and interventionsFootnote 5
Under the LMDAs, provinces and territories served 734,309 clients, increasing by 2.3% compared to the previous year. Corresponding with the increase in clients served, LMDA interventions totalled 1,146,898, edging up by 0.9% year-over-year. Overall, Employment Benefit interventions remained stable (+0.4%), while Support Measures interventions, jumped by 1.0% year-over-year. In the context of improving economic and labour market conditions, the additional $125 million in LMDA funding in FY1617 (see Section 3.1.6 for expenditures details), enabled provinces and territories to deliver more programming to clients.
Terminology guide
A client is a person who has participated in programs or services that are funded by the LMDAs or by Indigenous organizations. See section 3.1.3 for details for client types.
An intervention is a discrete program or service that a client participates in. See Section 3.1.4 for the type of interventions available to clients.
Any reference to participants in this chapter is equal to the number of interventions, particularly in Section 3.1.3 where information on designated groups is only collected at the intervention level.
With the extra funding for LMDAs and strong growth of the national economy, provinces and territories were able to improve their outcomes for clients, as the number of EI clientsFootnote 6 returning to employment after participation (187,172), increased by 4.8%, year-over-year. Stronger returns to work contributed to higher unpaid EI Part I benefits ($1.345 billion), which increased by 16.6%, year-over-year.
Combined with labour market programming delivered by Indigenous organizations (details below), a total of 751,872 clients were served (+2.4%), and 1,178,642 EBSM interventions (+0.9%) were delivered in FY1617.
Programming for Indigenous clients continues to grow
In FY1617, Indigenous organizations served 17,563 clients under Pan-Canadian programming, compared to 16,228 clients in the previous year, increasing by 8.2%. The number of interventions increased as well; edging up slightly by 0.8% year-over-year, to a total of 31,744.
Over the last ten years, the number of clients served by Indigenous organizations rose by 9.5%, and the number of interventions being delivered jumped significantly, by 74.1%. The increase in the number of interventions, coupled with the slower increase in the number of clients, suggests that Indigenous clients receive longer-term interventions, usually through training services and various interventions, compared to FY0607. For every client in FY1617, there were 1.80 interventions, compared to 1.1 interventions ten years ago.
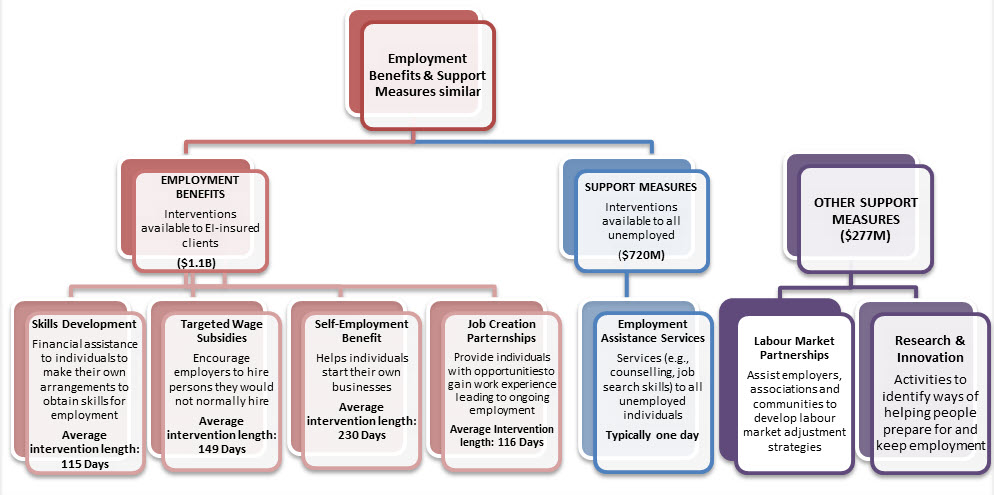
Expenditures and length of interventions (2016/2017)
Show Data Table
- Employment Benefits & Support Measures similar
- Employment Benefits
Interventions available to EI-insured clients ($1.1B)- Skills Development
Financial assistance to individuals to make their own arrangements to obtain skills for employment
Average intervention length: 115 Days - Targeted Wage Subsidies
Encourage employers to hire persons they would not normally hire
Average intervention length: 149 Days - Self-Employment Benefit
Helps individuals start their own businesses
Average intervention length: 230 Days - Job Creation Parternships
Provide individuals with opportunities to gain work experience leading to ongoing employment
Average Intervention length: 116 Days
- Skills Development
- Support Measures
Interventions available to all unemployed ($720M)- Employment Assistance Services
Services (e.g., counselling, job search skills) to all unemployed individuals. Typically one day
- Employment Assistance Services
- Employment Benefits
- Other Support Measures ($277M)
- Labour Market Partnerships
Assist employers, associations and communities to develop labour market adjustment strategies - Research & Innovation
Activities to identify ways of helping people prepare for and keep employment
- Labour Market Partnerships
1.3 Client profile and participation
Client types
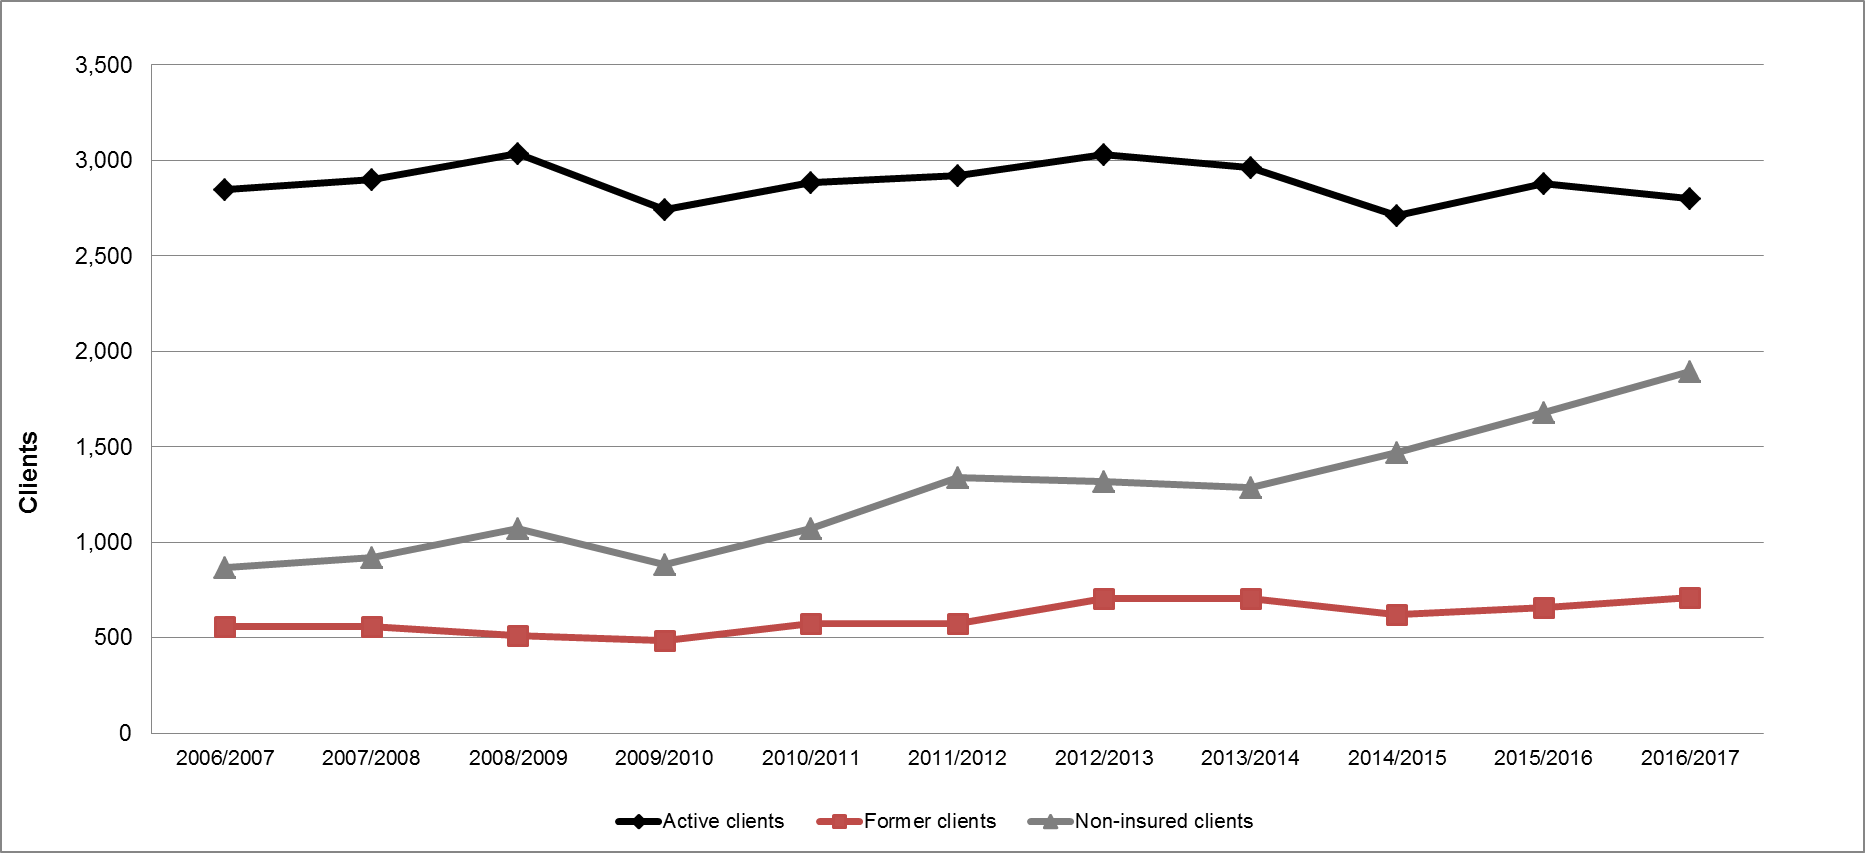
EI active claimants declined and former claimants and non-insured clients increased in FY1617
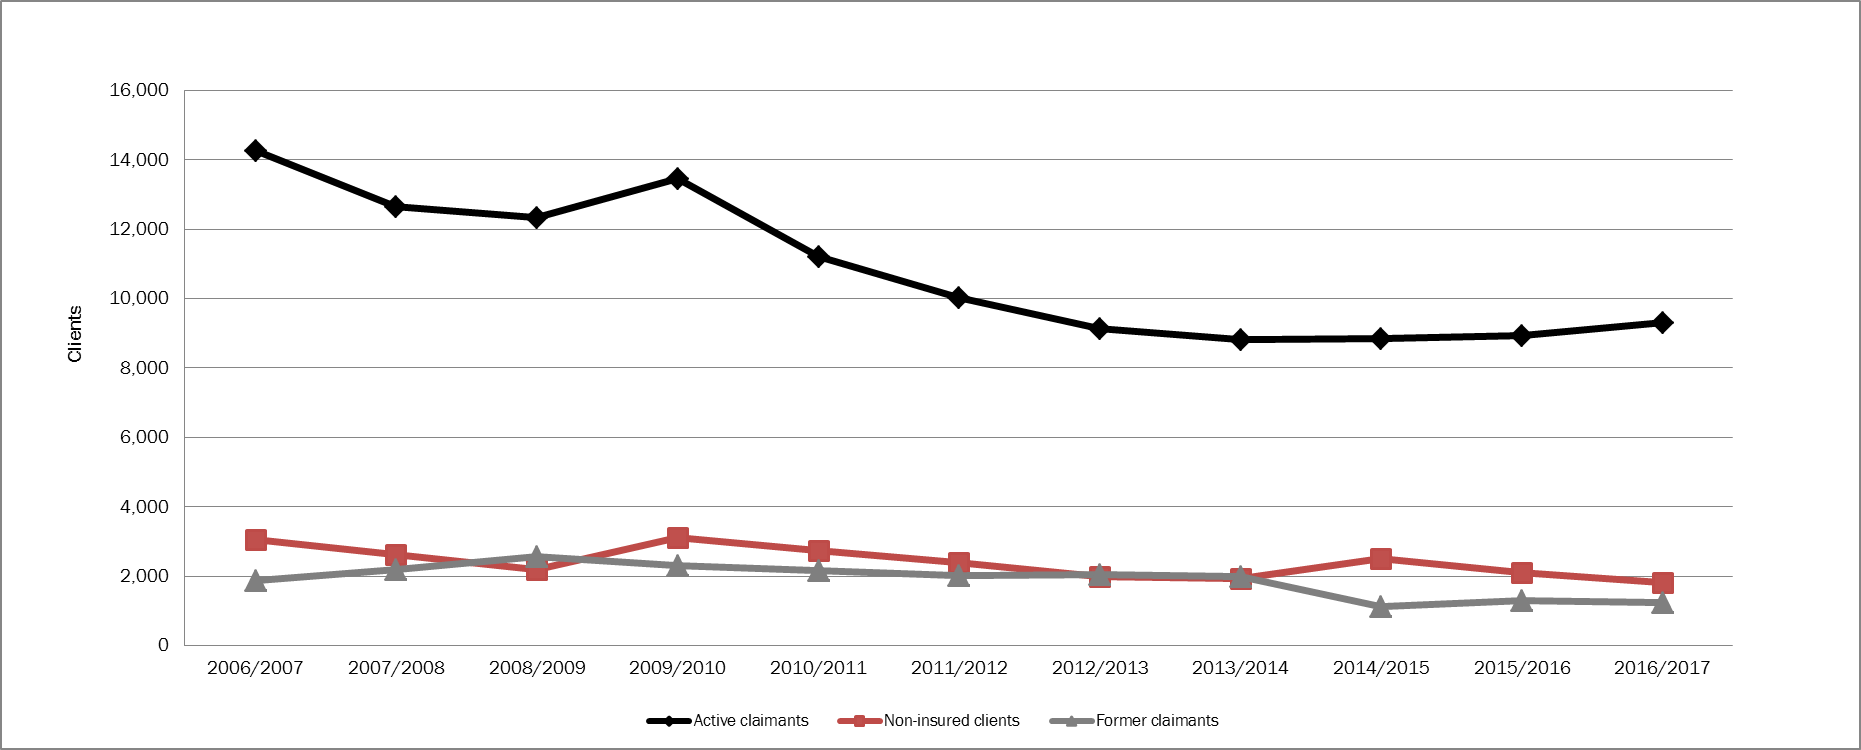
The overall number of clients increased in FY1617, with former claimants and non-insured clients edging up by 3.1% and 7.1%, respectively. At the same time, active claimants dropped by 1.5%.
Active claimants are those who had an active EI Part I regular claim when they requested assistance under Part II of the Employment Insurance Act. Typically, they have stronger and more recent job attachment. They tend to be able to return to work more quickly than those with weaker ties to employment. Active claimants who are considered job-ready from an analytical point of view often seek out short-term interventions under EI Part II to find their next employment opportunity. Others require longer-term Employment Benefits to upgrade their skills, establish certification or refine their job search strategies.
In FY1617, the number of active claimants served by provinces, territories and Indigenous organizations dropped by 1.5%, to a total of 351,362. Active claimants represented 46.7% of all clients, compared to 48.6% of all clients in FY1516.
Former claimants are those who completed an EI claim in the previous three yearsFootnote 7, or who began a parental or maternity claim in the last five years when they requested assistance under Part II. They are no longer eligible for EI Part I; however, they remain eligible for EI Part II under certain criteria.Footnote 8 Former claimants do not receive income support under Part I of the Employment Insurance Act while they complete an Employment Benefit intervention; however, they may receive Part II support while completing their return-to-work action plan.
In FY1617, the number of former claimants increased to a total of 95,583 clients (+3.1%). Coinciding with this increase, the share of former claimants edged up to 12.7%, compared to 12.6% in the previous year.
Non-insured clients are unemployed individuals who are neither active nor former EI clients. Non-insured clients usually have little substantive or recent job attachment. They include new labour force participants and individuals who were formerly self-employed without paid employment earnings. While these clients are not eligible for Employment Benefits under EI Part II, they may access interventions similar to Employment Assistance Services.
In FY1617, the numbers of non-insured clients increased sharply by 7.1%, to a total 304,927 from 284,607 a year earlier. In turn, the share of non-insured clients edged down from 38.8% to 40.6% in the current year.
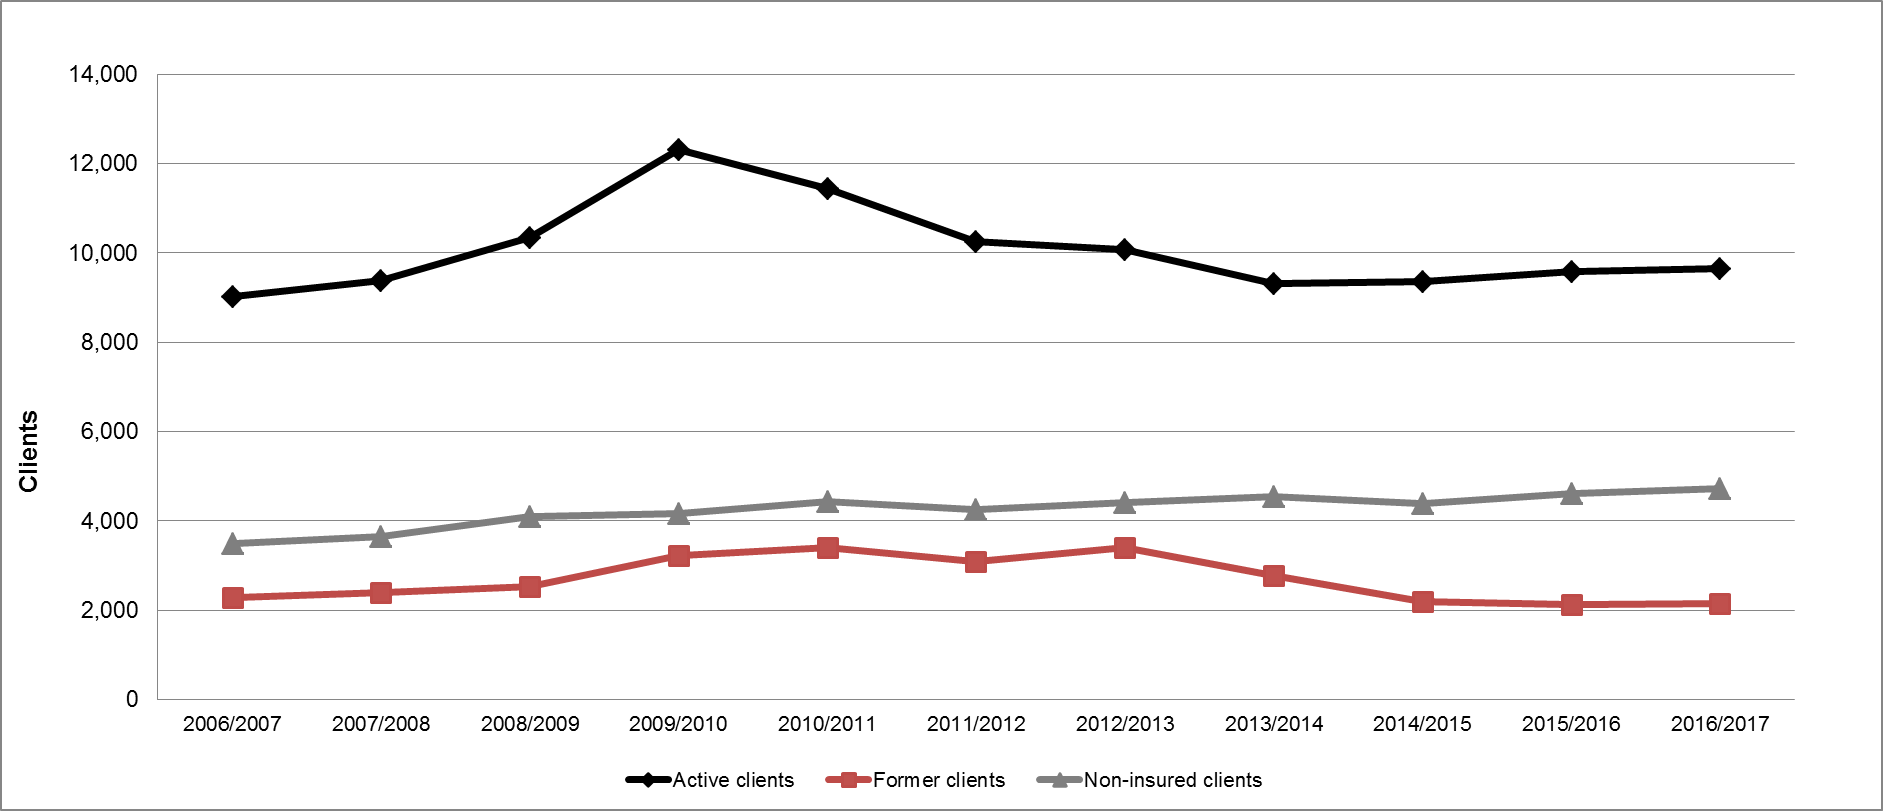
Total non-insured clients increased in the last decade
Overall, provinces, territories and Indigenous organizations have been serving more clients (+21.6%) since FY0607, with a pronounced growth in the number of non-insured clients (+72.4%), while active (+0.4%) and former EI claimant counts (+4.5%) increased at a slower pace.
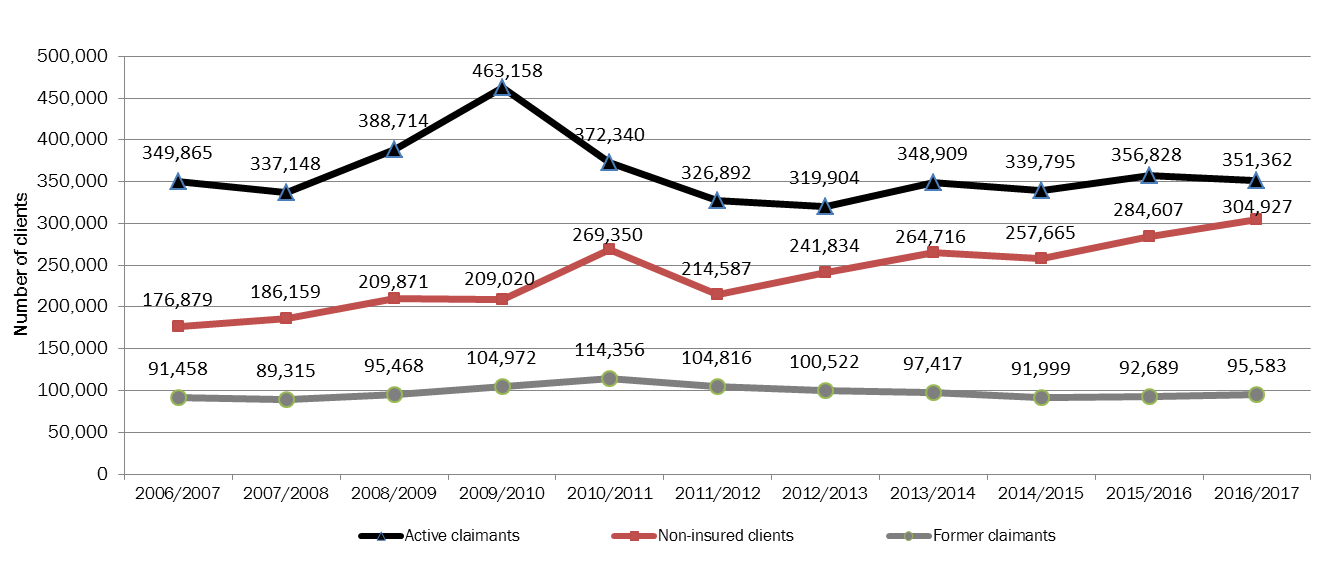
Show Data Table
| Active claimants | Non-insured clients | Former claimants | |
|---|---|---|---|
| 2006-2007 | 349,865 | 176,879 | 91,458 |
| 2007-2008 | 337,148 | 186,159 | 89,315 |
| 2008-2009 | 388,714 | 209,871 | 95,468 |
| 2009-2010 | 463,158 | 209,020 | 104,972 |
| 2010-2011 | 372,340 | 269,350 | 114,356 |
| 2011-2012 | 326,892 | 214,587 | 104,816 |
| 2012-2013 | 319,904 | 241,834 | 100,522 |
| 2013-2014 | 348,909 | 264,716 | 97,417 |
| 2014/2015 | 339,795 | 257,665 | 91,999 |
| 2015-2016 | 356,828 | 284,607 | 92,689 |
| 2016-2017 | 351,362 | 304,927 | 95,583 |
In turn, the growing number of total non-insured clients served by provinces, territories, and Indigenous organizations means their share among all EBSM client-types has jumped from 28.6% in FY0607, to 40.6% in the current year. Active claimants, who represented 56.6% of all clients a decade ago, now represent 46.7% of all clients in FY1617.
Patterns of working Canadians evolving alongside social and economic changes
According to the 2016 Census results, the period from 2005 to 2015 saw a shift from full-time, full-year employment toward part-time or part-year work. The shift is related to a combination of social and economic changes, such as the 2008 to 2009 financial crisis and automation technologies.
From 2006 to 2016, the employment rate fell from 62.6% to 60.2%.
Fewer men aged 25 to 54 are now working full-time all year. In 2015, 56.2% of men aged 25 to 54 years old worked full-time all year, down from 63.3% a decade earlier. The 2015 proportion is the lowest since 1980. The proportion of women in this age group who worked full-time all year has also declined: 43.7% in 2015 compared to 46.4% in 2005.
In the years prior to the 2008 to 2009 recession, the number of unemployed Canadians and active EI clients served by provinces and territories moved in similar patterns. Following the recession, provinces and territories increasingly reached out to all unemployed individuals, resulting in a spike of non-insured clients (see chart 2). Coming out of the recession, these individuals were probably less likely to qualify for EI regular benefits and entered LMDA programming as non-insured clients. Since then, the number of non-insured clients continues to steadily increase, while active clients have dropped. In the context of static LMDA funding over the years, up until 2015 to 2016, provinces and territories shifted towards serving non-insured clients, a group that is eligible only for Employment Assistance Services. These interventions are less expensive and focus on maximizing returns to work.
The growing number of non-insured clients reflects changing labour market conditions, where temporary, non-standard, and part-time employment is more prevalent (see box for details). These changing employment patterns impact the types of clients that provinces and territories serve, as evidenced by the growth in non-insured clients.
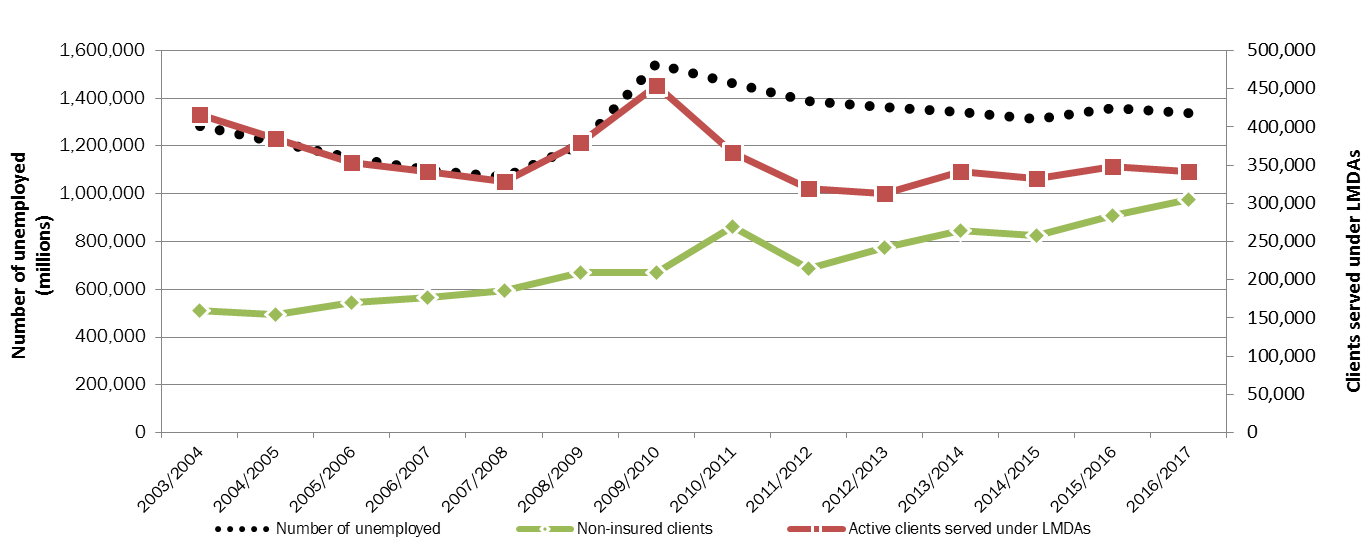
Show Data Table
| Non-insured clients | Active clients served under LMDAs | Number of unemployed | |
|---|---|---|---|
| 2003/2004 | 159,112 | 416,426 | 1,283,400 |
| 2004/2005 | 153,987 | 385,213 | 1,217,300 |
| 2005/2006 | 170,714 | 353,542 | 1,149,100 |
| 2006-2007 | 176,879 | 342,145 | 1,099,400 |
| 2007-2008 | 186,159 | 329,127 | 1,071,000 |
| 2008-2009 | 209,871 | 380,181 | 1,205,400 |
| 2009-2010 | 209,020 | 453,781 | 1,544,400 |
| 2010-2011 | 269,350 | 365,978 | 1,463,000 |
| 2011-2012 | 214,587 | 320,006 | 1,387,400 |
| 2012-2013 | 241,834 | 312,553 | 1,362,400 |
| 2013-2014 | 264,716 | 341,358 | 1,343,300 |
| 2014/2015 | 257,665 | 332,099 | 1,312,700 |
| 2015-2016 | 284,607 | 348,392 | 1,357,300 |
| 2016-2017 | 304,927 | 341,262 | 1,338,500 |
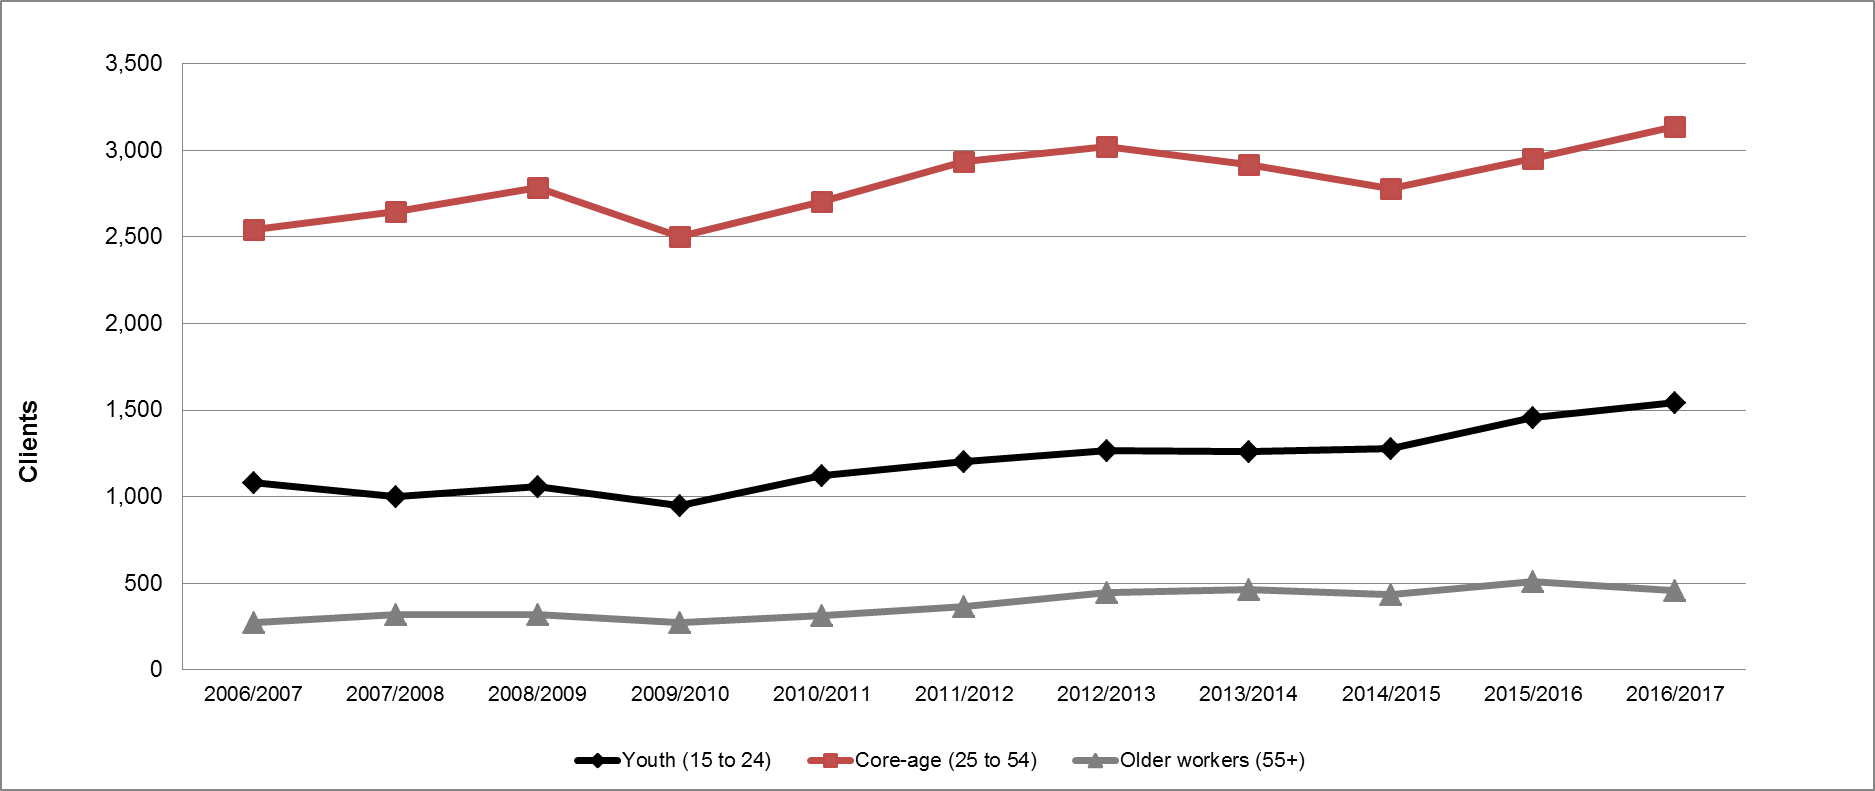
Age distributionFootnote 9
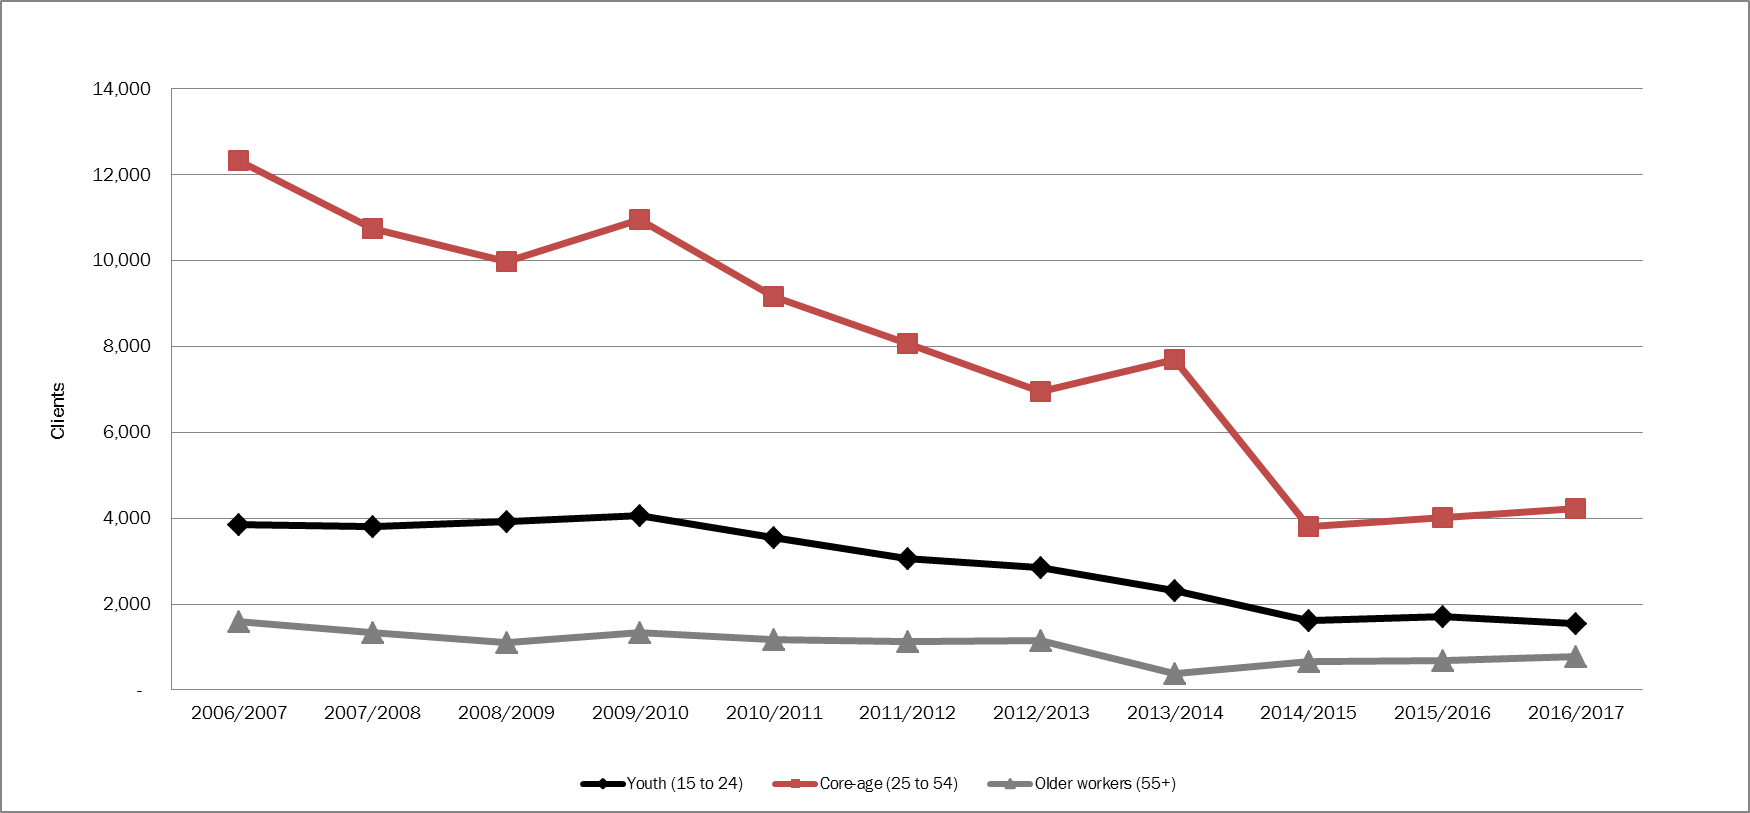
The majority (66.7%) of EBSM clients in FY1617 were core age workers (aged 25 to 54 years old) for a total of 440,176 individuals in this age group. The share of core age workers among all age groups dropped slightly, despite the number of core age workers increasing by 17,127 clients (+4.0%), from FY1516 results. Over ten years, the proportion of core age workers fell by 6.3 percentage points, as their growth has slowed down, especially after FY1213.
About one in five (20.4%) of EBSM clients in FY1617 were youth (aged 15 to 24), or a total of 134,465, increasing by 3.0% compared to FY1516. Their use of EBSM programming grew by 42.4% over the last ten years. Historically, youth have higher unemployment rates than core age workers and older workers. Youth were more impacted by the 2008 to 2009 recession and experienced slower recovery afterwards. This increase in EBSM usage could be attributed to provinces and territories increasingly focussing on labour market programming for youth.
In FY1617, the number of EBSM clients over the age of 55 increased by 8.1%, to a total of 85,056, compared to the previous year. This group represented 12.9% of all EBSM participants. Similar to young Canadians, more older workers have been participating in active labour market programs and services in the last ten years, spiking by 124.8%. This corresponds with the growing number of older workers in the labour force, which increased by 60.6% since FY0607. In turn, this growth fuelled the demand for labour market services for this age group.
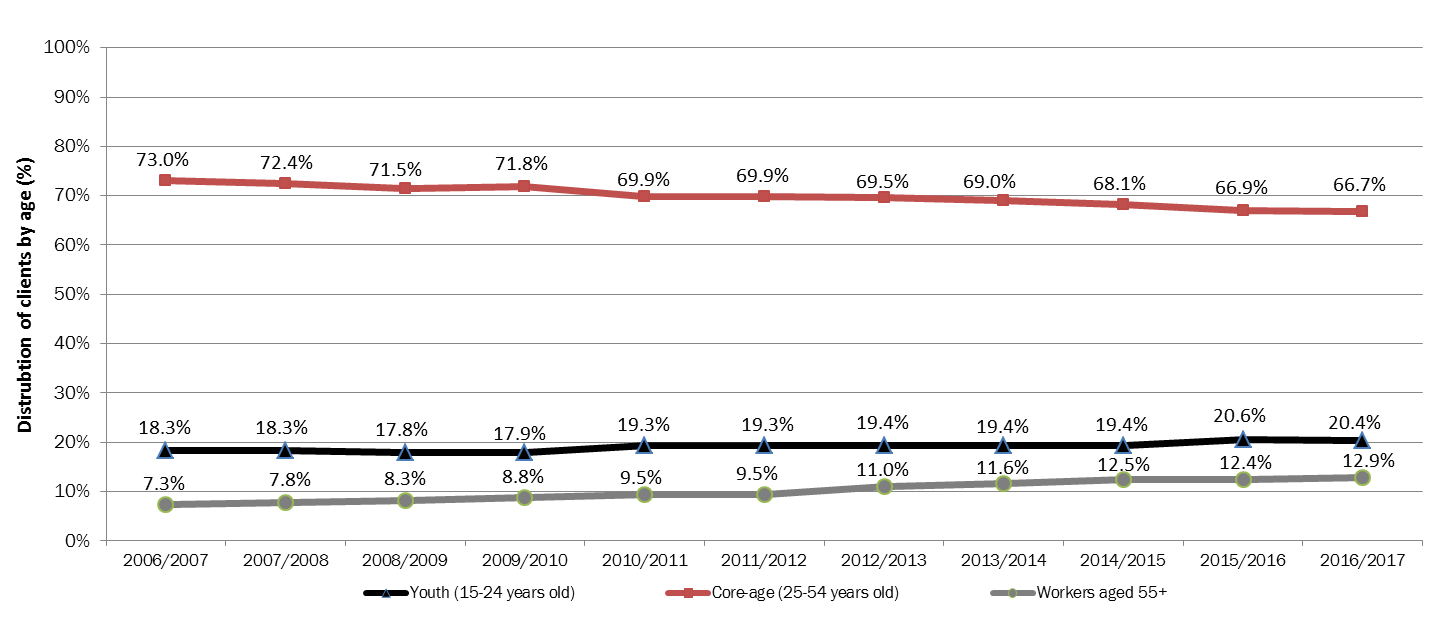
Show Data Table
| Youth (15-24 years old) | Core-age (25-54 years old) | Workers aged 55+ | |
|---|---|---|---|
| 2006-2007 | 18.3% | 73.0% | 7.3% |
| 2007-2008 | 18.3% | 72.4% | 7.8% |
| 2008-2009 | 17.8% | 71.5% | 8.3% |
| 2009-2010 | 17.9% | 71.8% | 8.8% |
| 2010-2011 | 19.3% | 69.9% | 9.5% |
| 2011-2012 | 19.3% | 69.9% | 9.5% |
| 2012-2013 | 19.4% | 69.5% | 11.0% |
| 2013-2014 | 19.4% | 69.0% | 11.6% |
| 2014/2015 | 19.4% | 68.1% | 12.5% |
| 2015-2016 | 20.6% | 66.9% | 12.4% |
| 2016-2017 | 20.4% | 66.7% | 12.9% |
- Note: 'Unknown' age group is not displayed.
Designated groupsFootnote 10
ESDC collects information on the EBSM participation of women, Indigenous peoples, members of visible minorities and persons with disabilities, in support of employment equity principles. ParticipantsFootnote 11 voluntarily self-identify, as such, fluctuations from year to year may be due to changes in self-identification.
- Women participated in a total of 494,054 EBSM interventions in FY1617, a 1.3% increase year over year (43.3% of all interventions delivered to Canadians). By way of context, women represented 42.6% of the unemployed workers in FY1617. Women accessed EAS interventions (92.1%) at a higher rate than men (82.7%). Overall, 50.5% of women clients were non-insured, compared to 38.8% for men. (See box for details on women's EBSM participation).
- A total of 138,969 participants self-identified as persons with a disability in FY1617, an increase of 9.4% year-over-year. Over ten years, the proportion of participants with a disability has increased by 191.5%. Among several factors, this can be attributed to workers ageing into disabilityFootnote 12. Persons with disabilities participated in 12.2% of all interventions delivered in FY1617. The vast majority (94.2%) participated in an EAS-only intervention, compared to 5.8% who participated in Employment Benefits. The majority were non-insured (55.6%), a slight drop of 0.1 percentage points, compared to FY1516.
- Indigenous peoples participated in 86,726 interventions in FY1617, a slight decrease of 2.1% year over year. Indigenous people participated in 7.6% of all EBSM interventions, including programming delivered through ASETS. Employment Benefits delivered to Indigenous peoples, decreased from 4.1% to 3.9% year-over-year, while EAS-only represented the remaining 96.1% of interventions. In the last ten years, EAS use among Indigenous peoples has increased by 30.9%, whereas Employment Benefit use has dropped by 42.9%.
- Members of visible minority groups participated in 70,649 interventions in FY1617, an increase of 35.4% from last year. As a result, visible minorities' share of total interventions increased from 4.6% to 6.2% compared to FY1516 results. The majority of interventions (95.3%) were EAS-only, compared to 4.7% for Employment Benefits. In the last ten years, the number of interventions delivered to members of visible minority groups have declined by 0.8%.
Women's participation in EBSMs
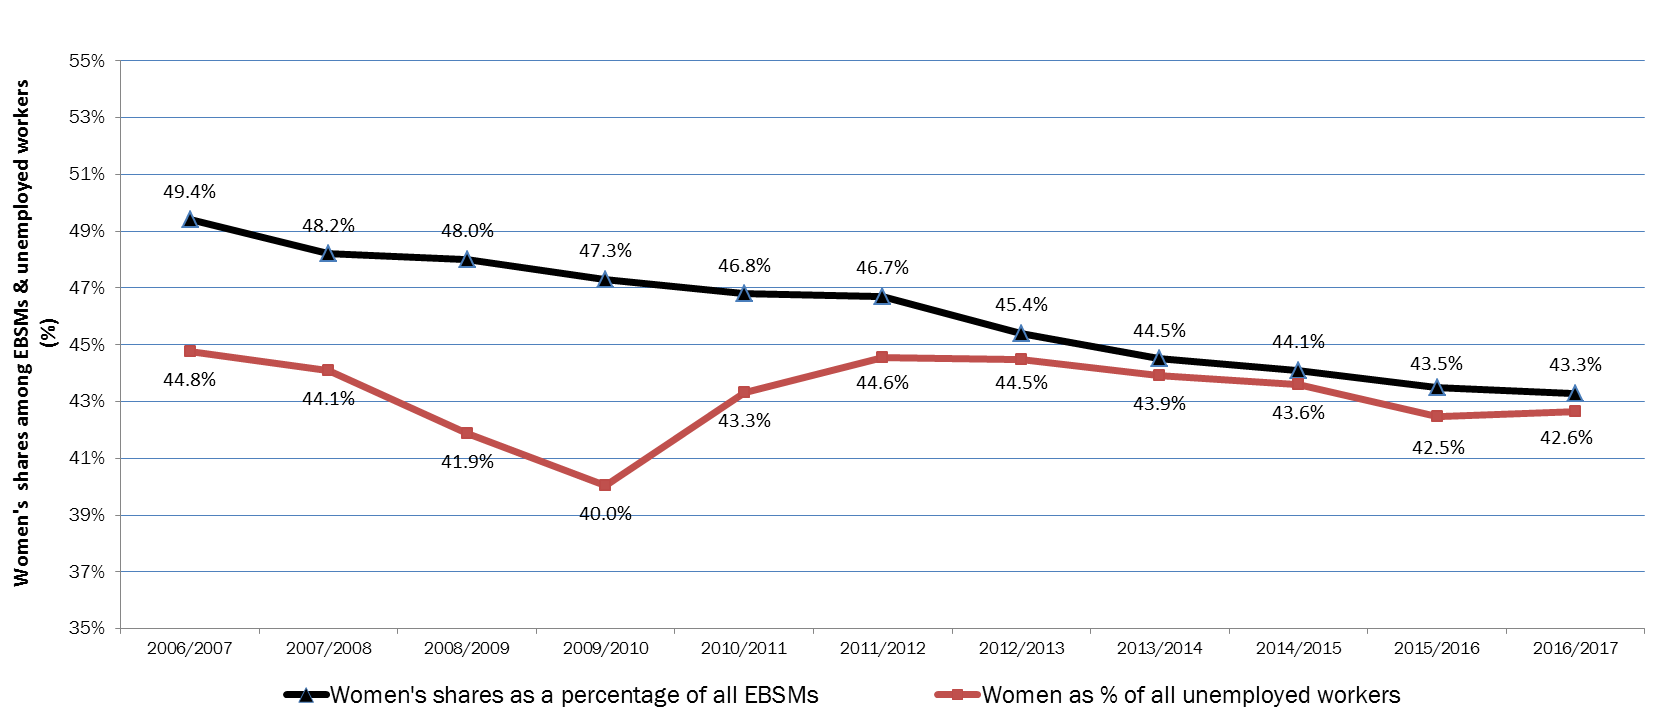
The number of EBSM interventions delivered to women increased from 446,824 in FY0607 to 494,054 in FY1617, an increase of 10.6%. Over this ten year period, women's share among all interventions decreased from 49.4% to 43.3%.
In the last ten years, women have fared relatively better than men on several labour market indicators. For example, employment growth among women has been higher (+11.4%) than that of men (+8.9%). In addition, women's share of unemployed Canadians has steadily declined, from 44.8% in FY0607, to 42.6% in FY1617. In particular, the 2008 to 2009 recession and the subsequent recovery period, was less severe for women than for men, as the industries that were the hardest hit by employment losses at that time were male-dominated. Women, however, are more likely to work in service industries such as health care, education and social assistance, where employment has continued to rise. As a result, the demand for active labour market programming among women in recent years has been less pronounced than for men.
Show Data Table
| Women's shares as a percentage of all EBSMs | Women as % of all unemployed workers | |
|---|---|---|
| 2006-2007 | 49.4% | 44.8% |
| 2007-2008 | 48.2% | 44.1% |
| 2008-2009 | 48.0% | 41.9% |
| 2009-2010 | 47.3% | 40.0% |
| 2010-2011 | 46.8% | 43.3% |
| 2011-2012 | 46.7% | 44.6% |
| 2012-2013 | 45.4% | 44.5% |
| 2013-2014 | 44.5% | 43.9% |
| 2014/2015 | 44.1% | 43.6% |
| 2015-2016 | 43.5% | 42.5% |
| 2016-2017 | 43.3% | 42.6% |
Official languages
ESDC furthers the commitment of the Government of Canada to foster the full recognition and use of both English and French in Canadian society, by ensuring that labour market programs and services are delivered in both official languages. In this context, all LMDAs contain commitments by provinces and territories to have programs and services delivered in both official languages where there is sufficient demand.
1.4 Interventions: Employment Benefits
Historically, Employment Benefits have consisted of longer-term interventions focused on providing skills or work experience required to regain employment. Under LMDAs, provinces and territories provide employment benefits similar to the following six benefits types: Skills Development-Regular (SD-R); Skills Development-Apprentices (SD-A); Targeted Wage Subsidies (TWS); Self-Employment (SE); Job Creation Partnerships (JCPs); and Targeted Earnings Supplements (TES)Footnote 13.
Decline in Employment Benefits interventions and expenditures in FY1617
In FY1617, Employment Benefits interventions totalled 147,054 and remained relatively stable (+0.4%) year-over-year. The stability of Employment Benefits in FY1617 can be largely attributed to the decreasing number of active claimants, usually the main beneficiaries of these types of interventions. The average of length of an Employment Benefit intervention increased from 111 days in FY1516, to 117 days in the current year, suggesting provinces and territories provided longer and more intensive supports, facilitated through the additional funding under Budget 2016 (see section 1.6 for expenditure details). In the context of tightening labour market and fewer individuals relying on provincial and territorial supports and services, investments focussed on retraining and upskilling existing clients for improved employment outcomes. In FY1617, this was evident through increased returns to work among Employment Benefits, which increased from 72,788 to 76,593 (+5.3%) year over year. However, total spending shrank by almost $56 million year-over-year (-4.9%), to a total $1.07 billion.
| Employment Benefits | Interventions | Share of Employment Benefits | Year-over-year change | Expenditures ($000s) |
Estimated cost per intervention | |
|---|---|---|---|---|---|---|
| Skills Development-Regular | 52,627 |
35.8% |
+1.0% |
855,300 |
$7,053 |
|
| Skills Development-Apprentice | 68,633 |
46.7% |
-3.1% |
|||
| Targeted Wage Subsidies | 16,404 |
11.2% |
+11.6% |
120,768 |
$7,281 |
|
| Self-Employment | 6,137 |
4.2% |
-2.2% |
59,752 |
$9,736 |
|
| Job Creation Partnerships | 3,253 |
2.2% |
+26.2% |
34,827 |
$10,706 |
|
| Canada | 147,054 |
100% |
+0.4% |
1,070,647 |
$7,281 |
|
SD-R interventions edged up (+1.0%) to a total of 52,627, while SD-A interventions dropped by 3.1%, to a total of 68,633 in FY1617. Combined, Skills Development interventions made up 82.5% of all Employment Benefits. Expenditures on Skills Development programming totalled $855.3 million, lower than the $887.8 million spent in FY1516. This is mainly attributable to the decline in apprentice training in FY1617, despite the addition of $125 million in LMDA funding for FY1617.
In FY1617, TWS interventions increased by 11.6% year-over-year, to 16,404. This type of intervention represented 11.6% of all Employment Benefit interventions. Expenditures on TWS programming totalled $120.8 million, an increase of $9 million in spending compared to the previous fiscal year. Atlantic Provinces and Quebec are the main jurisdictions delivering TWS programming accounting for almost 90% of total spending in Canada.
The number of SE interventions delivered decreased by 2.2%, to 6,137, with their shares among all Employment Benefits reaching 4.2%. Coinciding with this drop in interventions, SE expenditures contracted significantly in FY1617; going from $99 million in FY1516, to $59.8 million in the current reporting year. This sharp drop is mainly attributable to Ontario winding down its SE benefit in FY1516, resulting in an overall decline at the national level.
Among Employment Benefits, delivery of JCP interventions surged to a total of 3,253 interventions across Canada, increasing by 26.2%, compared to FY1516 results. In turn, JCPs' share among Employment Benefits edged up, from 1.8% to 2.2%, year-over-year. Reflecting this increase, JCP expenditures jumped to $34.8 million, compared to $28 million in the previous year. The increase was mainly driven by British Columbia, where JCP programming expanded significantly (+63% in the number of interventions), while spending increased by $4.6 million year-over-year.
Overall, Employment Benefits interventions have declined in the last decade, while apprentice training has grown
Since FY0607, total Employment Benefits delivered by provinces and territories has dropped by over 21%. However, SD-A programming is the only Employment Benefit that grew; increasing by 25.8% over this period. In many provinces and territories, apprentice training is used to address skills shortages and provides training for in-demand occupations. Over the last decade, provinces and territories delivered more than 700,000 apprentice training interventions to Canadians, while all other intervention types have dropped: SD-R (-40.1%); TWS (-13.6%), SE (-45.9%), and JCP (-50.2%). This contributes to an overall decline in the number of Employment Benefits interventions delivered throughout Canada.
1.5 Interventions: Support Measures
Part II of the Employment Insurance Act authorizes three support measures: Employment Assistance Services (EAS), Labour Market Partnerships (LMPs), and Research and Innovation (R&I). Through LMDAs, provinces and territories deliver these measures at regional and local levels, while ESDC retains responsibility for pan-Canadian delivery of LMPs and R&I (see section 4: Pan-Canadian Activities and the National Employment Services). Support Measures are available to all unemployed individuals in Canada, including non-insured clients. However, LMPs and R&I are generally not associated with direct client services and, therefore, counts on participants or interventions are not available. Delivered by the provinces and territories, the EAS component of the Support Measures provides a full range of self-help and assisted services, such as support in determining career objectives through employment counselling; improving job search techniques; completing a return-to-work action plan; and accessing labour market information in support of career choices.
Employment Assistance Services
Employment Assistance Services interventions declined in FY1617
Provinces and territories design and deliver interventions similar to Employment Assistance Services (EAS), which are available to all unemployed people in Canada. In addition to helping EI-insured clients, EAS interventions provide crucial support to those who have been absent from the labour market for an extensive period or who have low job attachment. They may also support new immigrants or young people who are entering the Canadian labour market for the first time. These interventions are reported in one of the three following categories: Employment Services, Group Services, and Individual Counselling. In FY1617, a total of 999,884 EAS interventions were delivered, increasing by 1.0% year-over-year. The rise in EAS usage coincided with the increase of non-insured clients. With additional LMDA funding, the average cost of an EAS intervention increased from $590 in FY1516 to $715 in the current reporting period.
Interventions similar to Employment Services continued to be the most common EAS intervention type, accounting for 60.1% of all EAS interventions in FY1617. A total of 601,159 Employment Services interventions were provided to unemployed individuals in Canada, a decrease of 3.6% year-over-year. Since FY0607, these interventions increased by 42.6%, attributable to a greater focus on delivering short-term interventions for quicker returns to work among unemployed Canadians.
Group Services dropped by 29.9%, for a total of 25,279 interventions delivered in FY1617. In turn, the share of Group Services among all EAS-type interventions dropped to 2.5%, compared to 3.6% in the previous year.
| Employment Assistance Services* | Interventions | Share of Support Measures | Year-over-year change | Expenditures ($000s) |
Estimated cost per intervention | |
|---|---|---|---|---|---|---|
| Employment Services | 601,159 |
60.1% |
-3.6% |
|
|
|
| Group Services | 25,279 |
2.5% |
-29.9% |
|
|
|
| Individual Counselling | 373,406 |
37.3% |
+12.9% |
|
|
|
| Total Employment Assistance Services | 999,884 |
100% |
-1.0% |
$714,544 |
$715 |
|
| Other Support Measures |
|
|
|
|
|
|
| Labour Market Partnerships | - |
- |
- |
165,886 |
- |
|
| Research & Innovation | - |
- |
- |
116,533 |
- |
|
| Canada | 999,884 |
100% |
+1.0% |
$996,963 |
$715 |
|
In addition to being the initial intervention for establishing action plans and potential access to Employment Benefits, Individual Counselling is particularly important when supporting clients who face multiple barriers to employment. A total of 373,406 interventions were delivered in FY1617 (an increase of 12.9% year-over-year). This accounted for 37.3% of all EAS interventions.
Other Support Measures
The Labour Market Partnership (LMP) initiative facilitates collaboration between employers, employees and employer associations, community groups and communities to develop solutions to labour force imbalances, such as persistent high unemployment or skill shortages. In FY1617, LMP expenditures totalled $165.9 million, an increase of 8.3% year-over-year.
Research and Innovation in British Columbia
Since launching its R&I in 2014, British Columbia (BC) recently reshaped and enhanced delivery of its funding stream with greater focus on client opportunities to gain experience and attach to in-demand jobs. BC also introduced the Social Innovation stream under its R&I program to expand the scope of Community and Employer Partnerships program, and support innovative projects that address social challenges beyond employment.
With R&I funding, BC also invested in The Centre for Employment Excellence (CfEE). The CfEE acts as a coordination point for research, communication, training and employment in British Columbia; the first of its kind for employment services in Canada. The Centre's online resources, along with its popular webinar series are loaded with information and ideas for practitioners, employers and policy-makers to draw upon to improve employment outcomes for job seekers in the province.
For more information, visit the Centre for Employment Excellence Web site
Research and Innovation (R&I) initiatives identify better ways of helping people prepare for, return to or maintain employment and participate productively in the labour force. In FY1617, R&I expenditures increased to $116.5 million, which is 48.5% higher than in the previous year.
1.6 Expenditures
Increased spending on Employment Assistance Services, Labour Market Partnerships, and Research & Innovation

Show Data Table
| 2016/17 spending chart | Value |
|---|---|
| Employment Benefits | 1,070,647 |
| Employment Assistance Services | 714,544 |
| LMP & R&I | 282,419 |
| Pan-Canadian | 114,063 |
- Note: As per budget 2016, an additional $125 million in LMDA funding pushed overall spending to $2.07 billion.
Total expenditures under Part II of the Employment Insurance Act were $2.18 billion in FY1617, which included EBSM programming, LMPs and R&I, as well as the pan-Canadian activities. As per Budget 2016, an additional $125 million in LMDA funding pushed overall spending by provinces and territories upwards by 6.2% (see box for examples of investments under the new funding).
Under the LMDAs, Employment Benefits remained the largest investment, at $1.071 billion, representing about half total expenditures by provinces and territories. Compared to FY1516, spending on Employment Benefits declined by nearly $56 million (-4.9%). This is attributable to decreasing interventions due to an improving economy, and fewer active claimants being served by provinces and territories. Employment Assistance Services expenditures jumped by 22.3% year-over-year, as spending increased from $584.3 million in FY1516 to $714.5 million in FY1617. EAS spending accounted for 35% of all expenditures under the LMDAs. Expenditures towards LMPs and R&I measures jumped as well, going from $231.7 million in FY1516, to $282.4 million in FY1617 (+21.9%). Ontario's $44 million in new R&I spending was largely responsible for the increase. In Alberta, as well as in Newfoundland and Labrador, LMPs and R&I expenditures jumped by almost 300%, and 154%, respectively, which also contributed to significant rise in Canada's overall LMP and R&I investments.
Pan-Canadian expenditures edged up by 1.4%, increasing from $112.5 million in FY1516 to $114.1 million to FY1617. See Section 4 of this chapter for details on Pan-Canadian activities.
Additional LMDA funding for FY1617 from Budget 2016
Under Budget 2016, an additional $125 million went towards the LMDAs for FY1617, giving provinces and territories additional flexibility to support Canadians access training and employment services. For example:
- Alberta increased its capacity to deliver Career and Employment Information Services to individuals negatively impacted by the economic downturn. This included events to connect Albertans with prospective employers, and regular information sessions for job seekers related to job search strategies, career planning, and networking. To enable greater success for individuals re-entering the labour market, the delivery of Job Placement services was expanded to rural Albertans, with a focus on one-to-one support. The province also increased investment in 25 communities across the Province in its Self-Employment and Workplace Training (TWS) programs. New Integrated Training (JCP) programs were also introduced to address local labour market demand for skills training, including agriculture, trades, truck driving, and child care development, among others.
- New Brunswick invested in its Training and Skills Development Program and the Experiential Learning Employment (ELE) Continuum initiative. This helps social assistance clients acquire classroom and on-the-job training through employment placement.
- British Columbia focused on supporting new clients as a result of changes to the EI program (elimination of new entrant and re-entering provisions and expanded ‘reachback' eligibility for former claimants). The province also directed funding in support of Skills Development participants with associated training costs. Community and Employer Partnership projects were also expanded to focus on priority clients, like persons with disabilities, Indigenous, youth and immigrants.
- Prince Edward Island expanded its eligibility criteria for its employer sponsored training programming, like EmployPEI and the Graduate Mentorship Program, to include non-profit organization, municipalities and educational institutions. The province assisted more unemployed Islanders find jobs, and provided employers with workers with the right set of skills.
- Manitoba made policy changes to its Skills Development Program to increase financial supports for Manitobans living in rural and remote regions. In addition, Labour Market Partnerships were used to facilitate labour adjustments following business closures.
- Newfoundland and Labrador utilized the additional funding to meet the increased demand for Skills Development programming. This supported more individuals under the province's Self-Employment Assistance benefit. The province implemented a Research & Innovation support measure to test new ways of helping people find jobs.
- Saskatchewan supported increased demand for services offered through Rapid Response Teams, providing services to businesses and individuals impacted by layoffs and/or slowdowns.
- The Northwest Territories focused on developing tools to identify EI clients earlier in their claim to offer them relevant programming. The NWT government worked with regional partners to identify ways of improving employment opportunities for EI eligible clients.
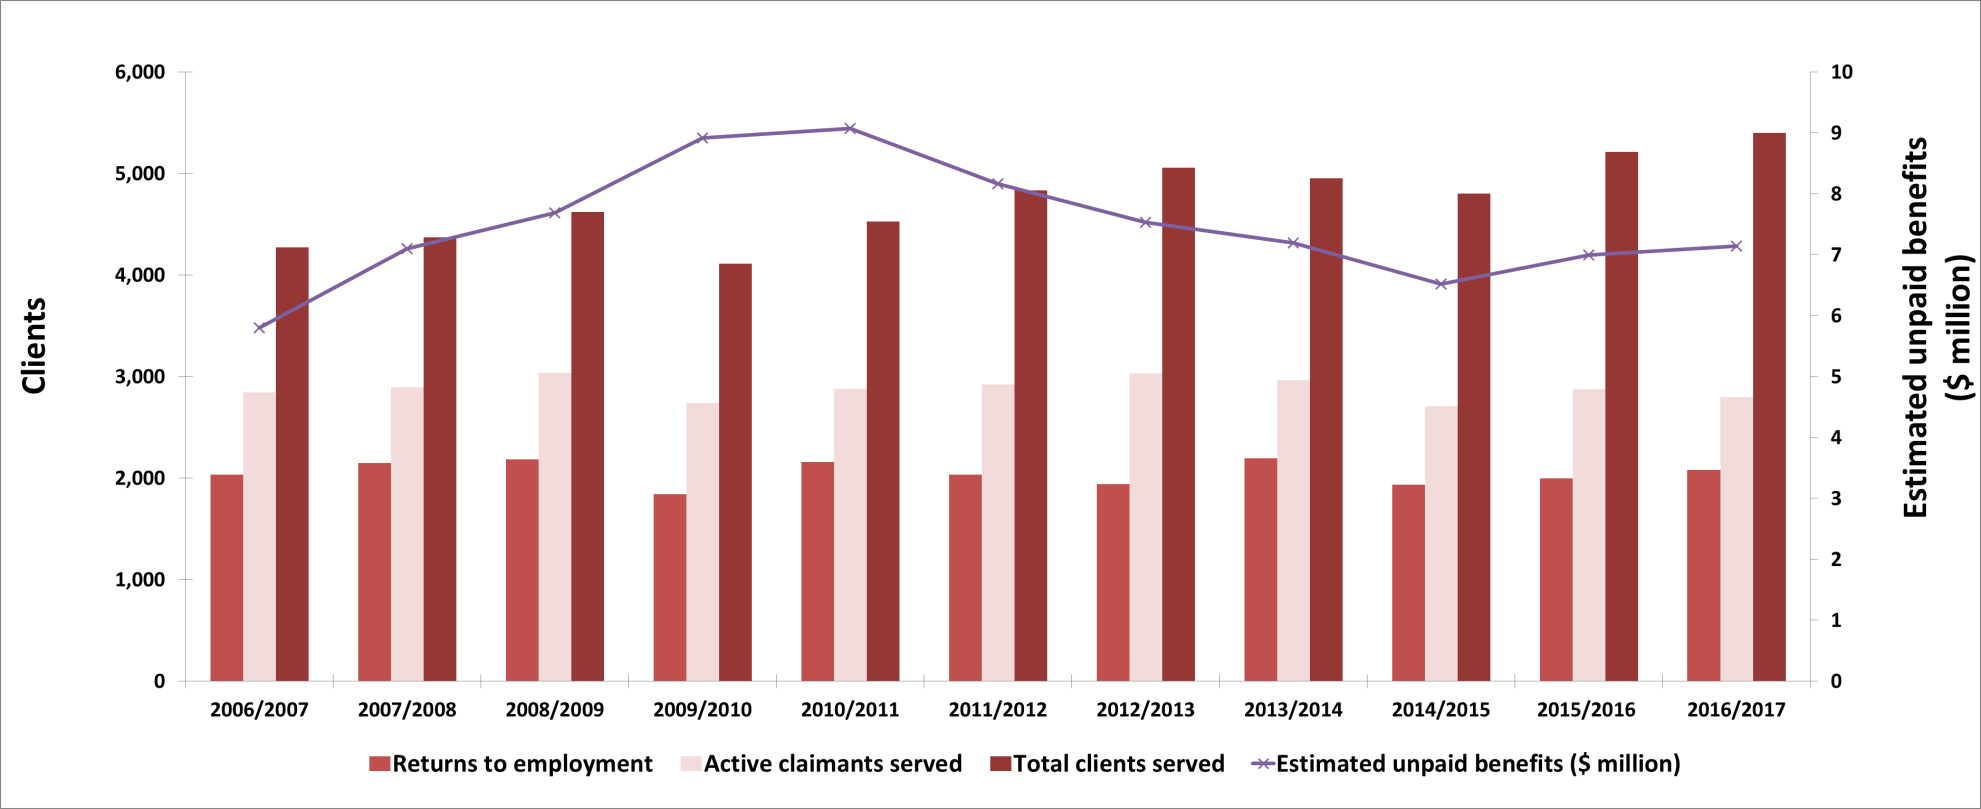
1.7 Key performance indicatorsFootnote 14
ESDC monitors the results of EBSM-similar programming delivered by provinces and territories through three key performance indicators:
- the number of active EI claimants served;Footnote 15
- the number of EI clients who return to employment following an intervention;Footnote 16 and
- the amount of unpaid EI Part I benefits resulting from the returns to employment.

Show Data Table
| Returns to employment | Active claimants served | Total clients served | Estimated unpaid benefits ($ Million) | |
|---|---|---|---|---|
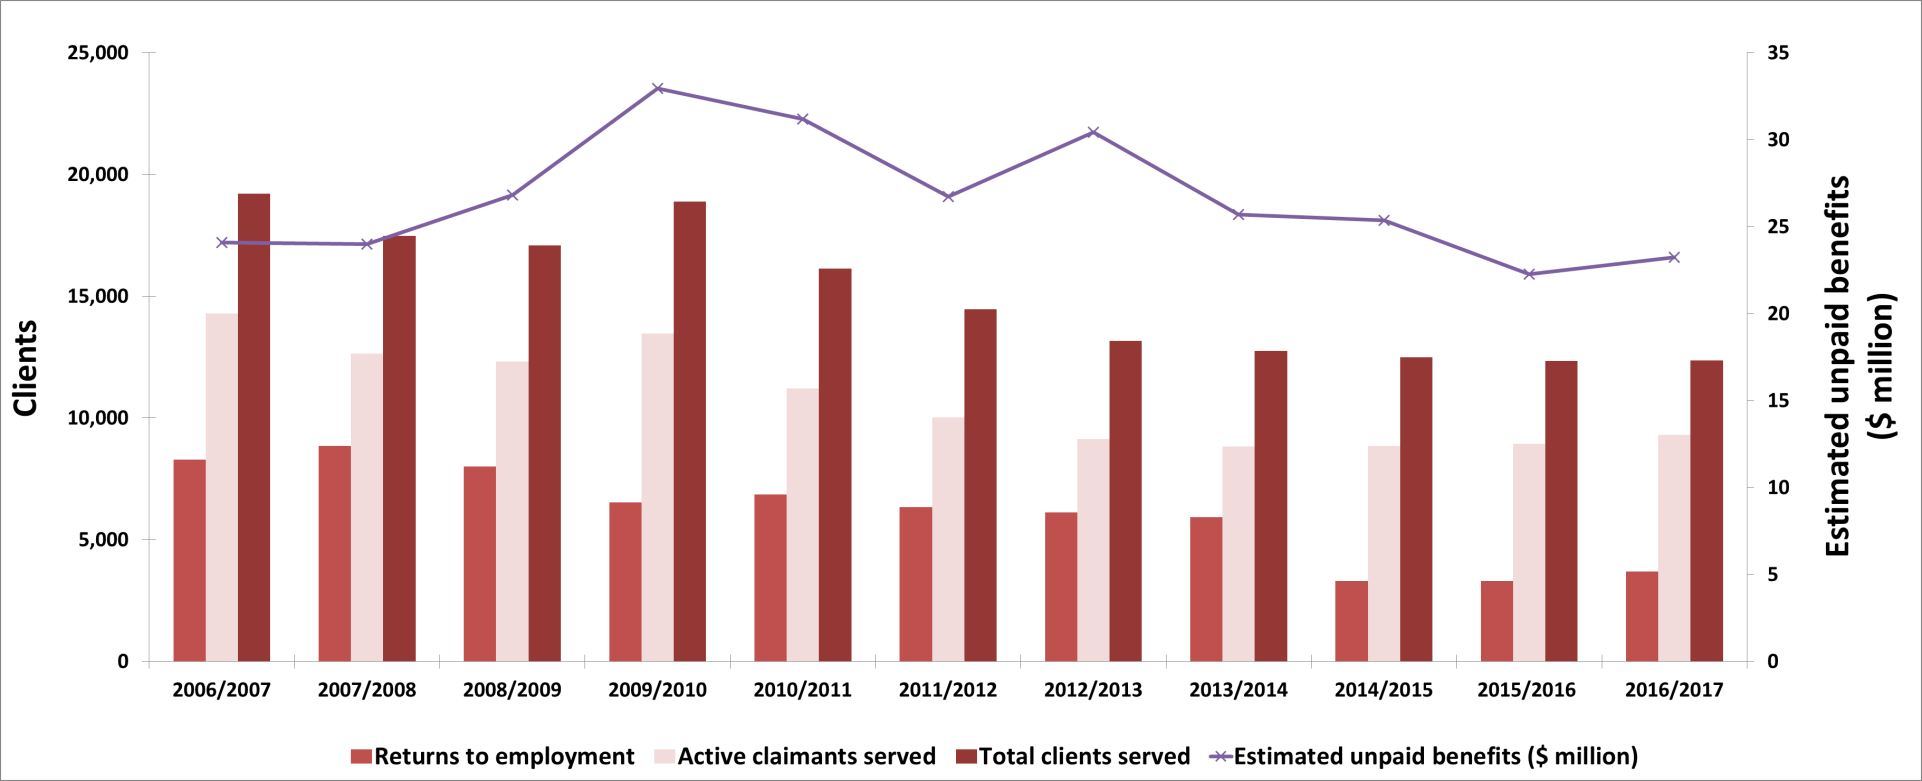
| 2006-2007 | 203,692 | 342,145 | 602,157 | $856.30 |
| 2007-2008 | 196,498 | 329,127 | 595,910 | $866.90 |
| 2008-2009 | 207,927 | 380,181 | 676,842 | $1,056.74 |
| 2009-2010 | 222,524 | 453,781 | 758,761 | $1,540.25 |
| 2010-2011 | 243,452 | 365,978 | 742,907 | $1,430.35 |
| 2011-2012 | 185,029 | 320,006 | 631,522 | $1,002.86 |
| 2012-2013 | 161,992 | 312,553 | 647,127 | $985.44 |
| 2013-2014 | 171,956 | 341,358 | 695,745 | $1,061.50 |
| 2014/2015 | 173,593 | 332,099 | 674,081 | $1,121.98 |
| 2015-2016 | 178,556 | 348,392 | 717,896 | $1,153.37 |
| 2016-2017 | 187,172 | 341,262 | 734,309 | $1,344.97 |
- Important: in response to the 2008-2009 recession, the Government of Canada invested a total of $1.0 billion over two years—2009/10 and 2010/11—in the delivery of EI Part II programming through Canada's EAP.
Lower number of active EI claimants with returns to work and unpaid EI benefits increasing
In the context of improving labour market and economic conditions in FY1617 throughout most parts of Canada, the number of active EI claimants served (351,362) dropped by 1.5% year-over-year. Improving labour market and economic conditions pushed up the returns to employment by 4.8% year-over-year, with a total of 187,172 clients finding work after their interventions. In turn, unpaid EI Part I benefits ($1.34 billion) jumped by 16.6%.
Compared to FY0607, unpaid EI Part I benefits increased by nearly $500 million (+57.1%). While several factors can influence the EI Part I benefits unpaid amount, a number of provinces and territories are reaching out to EI claimants earlier in their benefit period, to increase awareness of how LMDA programs and services can support their training and job search needs. By targeting clients earlier, which in turn contribute to speedier returns to work, LMDA participants are exiting the EI program sooner than they otherwise would have.
Recent LMDA evaluations demonstrate that providing EAS within the first four weeks of an EI claim facilitates faster returns to employment, and leads to increases in earnings after participation.Footnote 17 This evidence is encouraging a number of jurisdictions to target EI claimants with LMDA programs earlier. For example, a number of jurisdictions are already using the Targeting, Referral and Feedback (TRF) system to target EI applicants in order to direct them to relevant job opportunities or programs and services. Under the amended LMDA, the federal government will work with provinces and territories to implement a TRF system by March 2020 in all jurisdictions that do not already have a system in place.
Table 3 (see next page) presents supplementary performance indicators at the national and provincial/territorial level, contextualized with labour market indicators. Since multiple factors can influence results at the individual, jurisdictional, and national level, these indicators cannot be unequivocally attributed to LMDAs.
At the national level, close to 57% of active LMDA participants began their first LMDA-funded intervention within 12 weeks after their Benefit Commencement Period (BPC). Quebec exceeded the national average (72.6%), where the province's long-established TRF system helps Emploi-Québec to identify EI claimants at risk of prolonged unemployment for active employment supports. All other provinces and territories were below the national average, ranging from roughly 19% to 50% of active LMDA participants beginning EI Part II programming within 12 weeks of their BPC.
In terms of returns to work as a proportion of LMDA clients served, the national average was 25.5% in FY1617. Eight provinces and territories exceeded the national average, ranging from 26.6% in Quebec to 55% in Yukon. Whereas Ontario, Manitoba, Alberta, Northwest Territories, and Nunavut were below the national average.
In FY1617, Canada's returns to work from ESBM interventions among active clients, expressed as a proportion of Canada's labour force was 1.0%, with 8 provinces and territories exceeding the national average. Secondly, unpaid EI regular benefits stemming from returns to work, expressed as proportion of total EI regular benefits paid, was 10.6%. Quebec, Manitoba, Saskatchewan, Alberta, British Columbia and Northwest Territories posted higher proportions than the national figure.
In addition, Quebec, Manitoba, Saskatchewan and Alberta are above the national average for both ratios. This suggests an effective and efficient balance between returning clients to work as soon as possible, while ensuring they are provided with the necessary active employment services to succeed in the job market over a mid to long-term horizon.
| Employment change & unemployment rate (FY1617) |
Job vacancy rate (FY1617) | Percentage of EI active participants beginning EI Part II within 12 weeks following their Part I benefit period commencement * (2016-2017) |
Returns to work as a proportions of LMDA clients served (FY1617) |
Returns to work among active EI clients from EBSM interventions, as a proportion of the labour force (FY1617) |
Estimated unpaid EI regular benefits resulting EBSM interventions, as a proportion of Part I regular benefits paid (FY1617) |
|
|---|---|---|---|---|---|---|
| Newfoundland & Labrador | -3,500 (-1.5%) 13.7% |
0.8 | 19.2% | 29.9% | 1.4% | 2.8% |
| Prince Edward Island |
-800 (-1.1%) 8.4% |
1.4 | 41.2% | 38.5% | 2.6% | 4.4% |
| Nova Scotia | -300 (-0.1%) 8.1% |
1.2 | 33.7% | 31.2% | 1.1% | 4.0% |
| New Brunswick | +2,600 (+0.7%) 9.2% |
1.3 | 49.4% | 36.7% | 2.1% | 4.2% |
| Quebec | +55,100 (+1.3%) 6.8% |
1.3 | 72.6% | 26.5% | 1.5% | 11.0% |
| Ontario | +79,200 (+1.1%) 6.4% |
1.4 | 42.5% | 19.4% | 0.5% | 8.6% |
| Manitoba | +400 (+0.1%) 6.1% |
1.4 | 47.4% | 25.3% | 1.0% | 13.7% |
| Saskatchewan | -4,400 (-0.8%) 6.4% |
1.4 | 35.9% | 43.8% | 1.1% | 17.0% |
| Alberta | -32,600 (-1.4%) 8.3% |
1.4 | 39.5% | 25.1% | 1.2% | 17.2% |
| British Columbia | +78,500 (+3.4%) 5.7% |
1.9 | 36.0% | 28.0% | 0.8% | 12.6% |
| Northwest Territories |
Unchanged 7.1% |
1.8 | 38.0% | 17.1% | 0.8% | 10.8% |
| Yukon | +1,000 (+5.5%) 5.4% |
1.6 | 31.1% | 55.0% | 0.6% | 7.9% |
| Nunavut | +1,000 (+6.6%) 14.5% |
1.3 | 28.9% | 8.9% | 0.5% | 10.1% |
| Canada | +174,300 (+1.0%) 6.9% |
1.4 | 56.7% | 25.5% | 1.0% | 10.6% |
- Source: Labour Force Survey, Business Payroll Survey, and EI Administrative Data.
- * This includes a small percentage of clients who began EI Part II programming up to 2 weeks prior to their Part I Benefit Period Commencement. SD-A participants and those who were non-insured participants were excluded, if they had taken EAS in the previous year.
1.8 Additional LMDA funding and expanded eligibility to programs and services
Budget 2017 invested an additional $1.8 billion to support programs funded through LMDAs, and amended the EI Act to broaden worker eligibility for programs and services under the LMDAs. This allows even more Canadians, including underrepresented groups, to access EI-funded skills training and employment supports, including:
- Broaden current eligibility to Employment Benefits for unemployed individuals who have made minimum EI premium contributions (that is, above the premium rebate threshold) in five of the previous ten years;
- Expand eligibility for Employment Assistance Services under Support Measures (e.g., employment counselling, job search assistance), currently available to unemployed Canadians, to also include employed Canadians; and
- Expand current eligibility for support measures, particularly to increase flexibility to support employer sponsored training under Labour Market Partnerships. This includes employers who need to upskill or retrain their employees to maintain their current employment (for example, to adjust to technological or structural changes in the economy).
These changes are effective as of April 1, 2018.
2. Provincial and territorial EBSM activities
This section analyzes the provincial and territorial economic environment and EBSM-similar activities in FY1617; linking trends in clients served, interventions, and expenditures to local labour market conditions, and employment programming priorities.
2.1 Context
Under the LMDAs, provinces and territories received funding to support the delivery of programs and services, similar to the EBSMs established under Part II of the Employment Insurance Act.Footnote 18 To address unique labour market challenges, provinces and territories delivered employment programming under LMDAs, which were individually negotiated with the Government of Canada. Provinces and territories designed and delivered all EI-funded active employment programming, except for pan-Canadian activities, discussed in Section 4 of this chapter.
Expenditures for EBSM-similar activities increased in all provinces and one territory between FY1516 and FY1617, supported by the additional $125 million investment announced in Budget 2016. This additional funding further supports unemployed Canadians to access employment benefits and services that develop skills and workplace experience. Compared to the previous year, most provinces and territories served more clients, and delivered more EBSM-Similar interventions, while the number of clients who returned to work increased in all but two jurisdictions.
Overall, Canada's economy and labour market strengthened in FY1617. On average, regions, such as central Canada, the Territories, and British Columbia enjoyed comparatively healthier economic and labour market conditions, than the Prairies and eastern Canada. Despite varying economic and labour market outcomes, all jurisdictions prioritized improving the labour market attachment of underrepresented groups, such as persons with disabilities, Indigenous peoples, recent immigrants, youth, and older workers; as well as ensuring that employers can readily access a skilled workforce. To meet these objectives, and to address the impacts of new technologies on job types and skills, provinces and territories engaged with numerous stakeholders, including employers, to ensure that training programs remained relevant in a context of an aging workforce and a shifting labour market landscape.
Successful outcomes from the provinces and territories are highlighted in the Managing for Results section. These approaches include:
- Employer engagement in program priorities and design;
- Strategies to deliver active employment supports earlier for EI claimants; and,
- Approaches in the use of the Research and Innovation support measure in some jurisdictions.
2.2 Newfoundland and LabradorFootnote 19
In 2016, Newfoundland and Labrador's real GDP growth expanded by 1.9%, after two years of decline due to weakened oil prices. The province benefitted from increased oil output and exports from 2015 to 2016. Real GDP growth is expected to contract again in 2017, as household spending eases due to weaker labour market conditions, and constrained government spending.
Newfoundland and Labrador: EBSM key facts
| EI clients | Non-insured clients |
|---|---|
| 11,120 |
1,232 |
| Interventions type | 2016-2017 | Year-over-year change |
|---|---|---|
| Employment Benefits | 8,512 | 6.1% |
| Support Measures: EAS | 17,926 | 4.4% |
| Interventions type | 2016-2017 | Year-over-year change ( pp) |
|---|---|---|
| Employment Benefits | 32.2% | 0.4 |
| Support Measures: EAS | 67.8% | 0.4 |
| Total expenditures | 2016-2017 ($ million) | Year-over-year change |
|---|---|---|
| Employment Benefits | $117.0 | 3.4% |
| Support Measures: EAS | $6.3 | 18.8% |
| LMPs and R&I | $3.2 | 153.5% |
| Total expenditures1 | $126.4 | 5.6% |
| 2015-2016 | 2016-2017 | Year-over-year change |
|---|---|---|
| $22.25 | $23.23 | 4.4% |
- 1 Totals may not add up due to rounding; does not include accounting adjustments.
In line with the weak economic environment the province has been facing over the past few years, labour market conditions continued to soften in Newfoundland and Labrador in FY1617. Total employment declined for a fourth consecutive year by 3,500 (-1.5%). This loss was entirely in full-time work. As a result, the unemployment rate increased to 13.7%, the second highest in the country after Nunavut (14.3%). There were employment losses in:
- Forestry, fishing, mining, quarrying, oil and gas (-2,000; -12.8%);
- Manufacturing (-2,000; -17.4%); and
- Finance, insurance, real estate, rental and leasing (-1,100; -12.4%).
These losses were partially offset by gains in health care and social assistance (+1,600; +4.3%).
Newfoundland and Labrador's main labour market challenges are demographic; an aging population, declining working-age population, and youth out-migration. Consequently, the province set forth a number of labour market priorities for FY1617 to ensure a sufficient labour supply for employers, and to enhance their economic competitiveness. This included providing responsive, relevant, and flexible labour market programming by assisting individuals impacted by changes in the local labour market landscape; especially underrepresented groups, such as youth, persons with disabilities, as well as older workers. In addition, the province will develop an adaptive workforce by investing in employment and skills training. In partnership with employers and other stakeholders workforce needs will be identified by building an informed and productive focus on human resource needs.
Managing for results
In FY1617, the Department of Advanced Education, Skills and Labour organized seven Provincial Roundtables on Labour Market Transfer Agreements across the province, with over 130 participants. The provincial roundtables provided an opportunity for individual residents, employers, academics, researchers, labour groups, and non-profit, community organizations to share their input on the four labour market transfer agreements. In particular, the roundtables served as a channel for members of the public to provide ideas on how employment and skills training programs can be more relevant, flexible and responsive.
Some key themes arising from the roundtables included:
- Requirements for accurate and timely labour market information to assist governments in their short and long-term planning;
- Engagement with stakeholders to improve information-sharing;
- Greater program flexibility for both Employment Insurance (EI) and non-EI eligible individuals;
- Increased research funding focused on finding opportunities for work creation and researching promising practices to improve labour market outcomes; and
- Increased supports to individuals transitioning to employment, especially for those in under-represented groups.
Clients, interventions and expenditures
In FY1617, the total number of clients served by Newfoundland and Labrador remained stable at 12,352 (+0.2%). Client types grew in opposite directions this fiscal:
- Active claimants grew by 4.1% to 9,308;
- Former claimants shrank by 13.5% to 1,812; and
- Non-insured clients shrank by 5.0% to 1,232.
Reflecting this variance, client shares mirrored changes in client types:
- Active clients' share accounted for the highest proportion of total clients served at 75.4%. This represented a year-over-year increase of 2.9 percentage points;
- Former clients' share declined by 2.3 percentage points, from 17.0% to 14.7%; and
- Non-insured clients' share edged down by 0.5 percentage point, from 10.5% to 10.0%.
Newfoundland and Labrador delivered 26,438 interventions in FY1617, a 5.0% growth compared to the previous year. The total number of interventions delivered in the province remained relatively stable, with Employment Benefits taking 32.2% of shares, while shares of EAS continued at 67.8%. Unpaid Benefits grew by 4.4% to $23.23 million. Total expenditures for EBSM reached $126.4 million, a 5.6% increase year-over-year. Of the extra $6.8 million expended on EBSMs in FY1617, $4.5 million came from the province's share of the additional $125 million LMDA investment announced in Budget 2016.
Show Data Table
| Active claimants | Non-insured clients | Former claimants | |
|---|---|---|---|
| 2006-2007 | 14,279 | 3,060 | 1,871 |
| 2007-2008 | 12,648 | 2,616 | 2,200 |
| 2008-2009 | 12,325 | 2,204 | 2,561 |
| 2009-2010 | 13,466 | 3,114 | 2,302 |
| 2010-2011 | 11,215 | 2,748 | 2,171 |
| 2011-2012 | 10,027 | 2,405 | 2,031 |
| 2012-2013 | 9,124 | 1,992 | 2,046 |
| 2013-2014 | 8,831 | 1,928 | 1,980 |
| 2014/2015 | 8,850 | 2,513 | 1,126 |
| 2015-2016 | 8,941 | 2,095 | 1,297 |
| 2016-2017 | 9,308 | 1,812 | 1,232 |
Show Data Table
| Youth (15 to 24) | Core-age (25 to 54) | Older workers (55+) | |
|---|---|---|---|
| 2006-2007 | 3,853 | 12,320 | 1,602 |
| 2007-2008 | 3,796 | 10,751 | 1,348 |
| 2008-2009 | 3,927 | 9,970 | 1,116 |
| 2009-2010 | 4,061 | 10,957 | 1,341 |
| 2010-2011 | 3,541 | 9,154 | 1,178 |
| 2011-2012 | 3,055 | 8,066 | 1,124 |
| 2012-2013 | 2,846 | 6,942 | 1,145 |
| 2013-2014 | 2,325 | 7,699 | 376 |
| 2014/2015 | 1,627 | 3,814 | 665 |
| 2015-2016 | 1,700 | 4,021 | 676 |
| 2016-2017 | 1,545 | 4,217 | 769 |
Show Data Table
| Returns to employment | Active claimants served | Total clients served | Estimated unpaid benefits ($ million) | |
|---|---|---|---|---|
| 2006-2007 | 8,275 | 14,279 | 19,210 | $24.10 |
| 2007-2008 | 8,856 | 12,648 | 17,464 | $24.00 |
| 2008-2009 | 7,995 | 12,325 | 17,090 | $26.83 |
| 2009-2010 | 6,526 | 13,466 | 18,882 | $32.94 |
| 2010-2011 | 6,857 | 11,215 | 16,134 | $31.20 |
| 2011-2012 | 6,335 | 10,027 | 14,463 | $26.71 |
| 2012-2013 | 6,114 | 9,124 | 13,162 | $30.42 |
| 2013-2014 | 5,918 | 8,831 | 12,739 | $25.69 |
| 2014/2015 | 3,298 | 8,850 | 12,489 | $25.35 |
| 2015-2016 | 3,306 | 8,941 | 12,333 | $22.25 |
| 2016-2017 | 3,696 | 9,308 | 12,352 | $23.23 |
| Interventions | Year-over-year change | Expenditures ($ 000s) | ||
|---|---|---|---|---|
| Employment Benefits | ||||
| SD-R | Newfoundland and Labrador Skills Development | 3,206 | -2.4% | 95,211 |
| SD-A | Newfoundland and Labrador Skills Development | 2,734 | 14.2% | |
| TWS | Newfoundland and Labrador Wage Subsidies | 812 | -9.4% | 5,804 |
| SE | Newfoundland and Labrador Self-Employment Assistance | 236 | -2.9% | 6,186 |
| JCPs | Newfoundland and Labrador Job Creation Partnerships | 1,524 | +26.8% | 9,734 |
| Support Measures | ||||
| EAS | Newfoundland and Labrador Employment Assistance Services | 17,926 | +4.4% | 6,252 |
| LMPs | Newfoundland and Labrador Labour Market Partnerships | n/a | n/a | 2,924 |
| R&I | Research and Innovation | n/a | n/a | 298 |
Job Creation Partnership participation leads to seasonal employment for Tina
Tina lives in a small, rural community in Newfoundland and Labrador with high unemployment and limited employment prospects. A community organization in the area was approved under the JCP program to hire a Program Coordinator/Recreation Director to develop, coordinate and implement a community recreation plan with structured programming for children and youth in the community. The sponsor hired Tina and, during the 20 week program, Tina gained valuable skills with the organization. The project was so successful that Tina was employed for 20 weeks following the end of the JCP program and the organization now intends to rehire Tina for full-time seasonal employment.
Employment Benefits
Newfoundland and Labrador implemented a total of 8,512 Employment Benefit interventions in FY1617, representing a year-over-year increase of 6.1%.
- JCP grew by 26.8% to 1,524 interventions;
- SD-A grew by 14.2% to 2,734 interventions;
- SE declined by 2.9% to 236 interventions;
- TWS declined by 9.4% to 812 interventions; and
- SD-R declined by 2.4% to 3,206 interventions.
Employment Benefits expenditures reached $117.0 million (+3.4%). The province utilized some of its supplemental investment in LMDA funding from Budget 2016 to increase SD and SE expenditures to support growing demand for individuals participating in these two benefit types.
Support Measures: EAS
In FY1617, EAS interventions rose by 4.4% to 17,926 in Newfoundland and Labrador. While Individual Counselling grew considerably by 70.1% to 6,006; Employment Service dropped by 2.3% to 8,014; and Group Services declined by 28.1% to 3,906. Total EAS expenditures rose for a third consecutive year, increasing by 18.8% in FY1617 to $6.3 million.
Other Support Measures
Compared to FY1516, LMPs expenditures increased significantly in FY1617 by 130.1% to $2.9 million. This was attributable to an increased effort in Newfoundland and Labrador to develop partnerships in implementing labour market strategies and activities for labour force adjustment and human resource requirements.
R&I was delivered for the first time in Newfoundland and Labrador, through start-up funding of $300,000 to establish a new Workforce Innovation Centre at the College of the North Atlantic's Corner Brook campus. The Centre will support and fund activities, research, designs and innovative projects to identify methods to better assist individuals prepare for, find, return to, or maintain sustainable employment.
2.3 Prince Edward Island
Prince Edward Island's real GDP expanded by 2.3% in 2016, supported by gains in construction, manufacturing, real estate, health care and social assistance, as well as retail trade. The province's real GDP is expected to advance at a similar pace in 2017.
Prince Edward Island : EBSM key facts
| EI clients | Non-insured clients |
|---|---|
| 3,507 |
1,893 |
| Interventions type | 2016-2017 | Year-over-year change |
|---|---|---|
| Employment Benefits | 2,435 | 14.3% |
| Support Measures: EAS | 6,059 | 3.4% |
| Interventions type | 2016-2017 | Year-over-year change (pp) |
|---|---|---|
| Employment Benefits | 28.7% | 3.3 |
| Support Measures: EAS | 71.3% | 3.3 |
| Total expenditures | 2016-2017 ($ million) | Year-over-year change |
|---|---|---|
| Employment Benefits | $21.1 | 12.4% |
| Support Measures: EAS | $3.5 | 19.8% |
| LMPs and R&I | $1.5 | 32.0% |
| Total expenditures1 | $26.1 | 3.1% |
| 2015-2016 | 2016-2017 | Year-over-year change |
|---|---|---|
| $6.99 | $7.14 | 2.1% |
- 1 Totals may not add up due to rounding; does not include accounting adjustments.
In contrast to its resilient economy, Prince Edward Island's labour market conditions have been relatively soft over the past few years. In FY1617, the province's employment level declined by 800 (-1.1%), mostly in full-time work. The unemployment rate remained unchanged at 10.5%, the second highest among all provinces.
Prince Edward Island is addressing its growing population of ageing workers, to ensure that residents have the skills to meet the needs of an increasingly knowledge-based economy. Therefore, the province is providing relevant educational and work experience programs to prepare its workforce for the new opportunities brought on by the changing labour market landscape. As well, the province is developing strategies to retain its youth, and integrate highly skilled immigrants. The province will continue to promote entrepreneurship through investment supports for unemployed individuals who wish to launch a business.
Managing for results
Prince Edward Island engages and consults with employers, industry associations, educational institutions and other key partners on an ongoing basis to solicit input on matters related to active labour market programming. This engagement process ensures alignment between strategic priorities and the workforce development needs of the province. In July 2016, Prince Edward Island held a Stakeholder Roundtable Consultation on the Labour Market Transfer Agreements with approximately 50 stakeholders. In addition, through the Atlantic Workforce Partnership, the four Atlantic Provinces convened and hosted 10 sessions, primarily in the form of roundtable discussion workshops, with 275 individuals from 198 organizations across Atlantic Canada.
Clients, interventions and expenditures
In FY1617, Prince Edward Island served 5,400 clients (+3.6%), compared to 5,214 in FY1516.
- Active claimants declined by 2.7% to 2,798 clients;
- Former claimants rose by 7.9% to 709 clients; and
- Non-insured clients rose by 12.6% to 1,893 clients.
The shares also shifted in the same direction as the absolute numbers,
- Active claimants' proportion declined by 3.3 percentage points to 51.8%;
- Former claimants edged up by 0.5 percentage points to 13.1%; and
- Non-insured clients climbed by 2.8 percentage points to 35.0%.
For a third consecutive year, the province delivered a growing number of interventions, reaching 8,494 (+1.1% year-over-year) in FY1617. Employment Benefits interventions accounted for 28.7% of all EBSM-similar interventions and EAS interventions reached 71.3%. Unpaid benefits jumped by 2.1% to $7.14 million. A total of 2,081 (+4.2%) clients were employed after participation in the program. Total expenditures for EBSM-similar programming jumped from $25.3 million in the previous year to $26.1 million in FY1617, this represented an increase of 3.1% year-over-year. About $1.2 million of total expenditures represented Prince Edward Island's share of the $125 million additional LMDA funding announced in Budget 2016. Most of this additional funding was invested in Employment Benefits.
Show Data Table
| Active clients | Former clients | Non-insured clients | |
|---|---|---|---|
| 2006-2007 | 2,846 | 560 | 868 |
| 2007-2008 | 2,898 | 557 | 918 |
| 2008-2009 | 3,035 | 512 | 1,072 |
| 2009-2010 | 2,740 | 487 | 885 |
| 2010-2011 | 2,882 | 572 | 1,071 |
| 2011-2012 | 2,921 | 574 | 1,340 |
| 2012-2013 | 3,032 | 708 | 1,316 |
| 2013-2014 | 2,963 | 703 | 1,285 |
| 2014/2015 | 2,709 | 621 | 1,470 |
| 2015-2016 | 2,876 | 657 | 1,681 |
| 2016-2017 | 2,799 | 709 | 1,893 |
Show Data Table
| Youth (15 to 24) | Core-age (25 to 54) | Older workers (55+) | |
|---|---|---|---|
| 2006-2007 | 1,080 | 2,543 | 274 |
| 2007-2008 | 1,003 | 2,645 | 323 |
| 2008-2009 | 1,060 | 2,784 | 323 |
| 2009-2010 | 950 | 2,504 | 275 |
| 2010-2011 | 1,124 | 2,705 | 312 |
| 2011-2012 | 1,202 | 2,937 | 364 |
| 2012-2013 | 1,265 | 3,023 | 446 |
| 2013-2014 | 1,259 | 2,920 | 463 |
| 2014/2015 | 1,276 | 2,776 | 438 |
| 2015-2016 | 1,456 | 2,954 | 508 |
| 2016-2017 | 1,542 | 3,138 | 458 |
Show Data Table
| Returns to employment | Active claimants served | Total clients served | Estimated unpaid benefits ($ million) | |
|---|---|---|---|---|
| 2006-2007 | 2,033 | 2,846 | 4,274 | $5.80 |
| 2007-2008 | 2,148 | 2,898 | 4,373 | $7.10 |
| 2008-2009 | 2,186 | 3,035 | 4,619 | $7.69 |
| 2009-2010 | 1,839 | 2,740 | 4,112 | $8.92 |
| 2010-2011 | 2,159 | 2,882 | 4,525 | $9.07 |
| 2011-2012 | 2,034 | 2,921 | 4,835 | $8.16 |
| 2012-2013 | 1,939 | 3,032 | 5,056 | $7.53 |
| 2013-2014 | 2,194 | 2,963 | 4,951 | $7.19 |
| 2014/2015 | 1,934 | 2,709 | 4,800 | $6.52 |
| 2015-2016 | 1,997 | 2,876 | 5,214 | $6.99 |
| 2016-2017 | 2,081 | 2,799 | 5,401 | $7.14 |
| Interventions | Year-over-year change | Expenditures ($ 000s) |
||
|---|---|---|---|---|
| Employment Benefits | ||||
| SD-R | Training PEI—Individual | 1,070 | -3.2% | 14,479 |
| SD-A | Training PEI—Apprentice | 295 | -4.8% | |
| TWS | Employ PEI | 832 | +49.6% | 4,060 |
| SE | Self-Employ PEI | 170 | +23.2% | 2,008 |
| JCPs | Work Experience PEI | 68 | +209.1% | 601 |
| Support Measures | ||||
| EAS | Employment Assistance Services | 6,059 | -3.4% | 3,461 |
| LMPs | Labour Market Partnerships | n/a | n/a | 1,344 |
| R and I | Research & Innovation | n/a | n/a | 124 |
Employment Benefits
Compared to the previous reporting period, Employment Benefits expanded by 14.3% to 2,435 interventions in FY1617. Participation in all types of interventions changed including,
- SD-R which slowed down by 3.2% to 1,070 interventions;
- SD-A which dropped by 4.8% to 295 interventions;
- TWS which increased by 49.6% to 832 interventions;
- SE which rose by 23.2% to 170; and
- JCP which climbed by 209.1% to 68.
Prince Edward Island spent a total of $21.1 million (+12.4%) on Employment Benefits, where TWS received the majority of the province's share of additional LMDA funding from Budget 2016. The rise of TWS interventions and expenditures fulfills the increased demand for employer-sponsored training, such as EmployPEI and the Graduate Mentorship Program.
Jenna's journey to sustainable employment
Jenna was interested in exploring new career options in trades and increasing her employability skills. She was able to find her dream job by progressing along a path to sustainable employment which included:
- Career exploration via a program offered by the Women's Network PEI;
- Training to develop skills needed to succeed in the workforce by enrolling in and graduating from the Heritage Retrofit Carpentry program; and
- An opportunity to bridge education with work experience through the Graduate Mentorship program.
With a lot of perseverance and support from the province, Jenna developed new skills and abilities that will contribute to the success of the renovations at the historic Province House in Charlottetown.
Support Measures: EAS
Total EAS interventions fell from 6,271 in FY1516 to 6,059 in FY1617, a 3.4% year-over-year drop. This was a result of the 23.6% decrease in Individual Counselling interventions. On the other hand, Employment Services edged up by 3.1% to 4,897, while EAS expenditures reached $3.5 million, a decrease of 19.8%.
Other Support Measures: LMPs and R&I
In FY1617, LMPs and R&I funding dropped for a second consecutive year, by 32.0%, to $1.5 million. Both LMPs ($1.3 million) and R&I ($124,000) funding declined by 31.3% and 39.2%, respectively.
2.4 Nova Scotia
Nova Scotia's real GDP grew by 0.8% in 2016, slower than the 1.4% increase in 2015. This continued growth is supported by gains in real estate, construction, and manufacturing. Real GDP growth is projected to moderately strengthen in 2017, backed by increases in home starts, tourism and non-energy exports. However, this projected growth remains considerably below the expected national average of 3.0%.
Compared to FY1516, overall employment in FY1617 remained relatively unchanged (-300; -0.1%), the decline in full-time work (-5,600; -1.5%) was the largest recorded by the province since FY9293. A gain in the services-producing sector (+2,500; +0.7%), was more than offset by a loss in the goods-producing sector (-2,700; -3.3%). Employment growth was led by the following industries:
- Trade increased by 4.0% (+2,800); and
- Health care and social assistance increased by 2.8% (+2,100).
The 0.5 percentage points decrease (from 8.6% in FY1516 to 8.1% in FY1617)in Nova Scotia's unemployment rate was due largely to an increased number of people exiting the labour force. The participation rate dropped from 62.3% in FY1516, to 61.6% in FY1617, the second lowest among Canadian provinces.
Nova Scotia : EBSM key facts
| EI clients | Non-insured clients |
|---|---|
| 11,792 |
4,717 |
| Interventions type | 2016-2017 | Year-over-year change |
|---|---|---|
| Employment Benefits | 4,450 | 7.8% |
| Support Measures: EAS | 28,618 | 2.1% |
| Interventions type | 2016-2017 | Year-over-year change (pp) |
|---|---|---|
| Employment Benefits | 13.5% | 0.6 |
| Support Measures: EAS | 86.5% | 0.6 |
| Total expenditures | 2016-2017 ($million) | Year-over-year change |
|---|---|---|
| Employment Benefits | $48.3 | 2.7% |
| Support Measures: EAS | $32.1 | 19.2% |
| LMPs and R&I | $2.9 | 44.0% |
| Total expenditures1 | $83.3 | 6.0% |
| 2015-2016 | 2016-2017 | Year-over-year change |
|---|---|---|
| $23.39 | $24.02 | 2.7% |
- 1 Totals may not add up due to rounding; does not include accounting adjustments.
With an ageing workforce and changing economic environment, a well-trained and flexible labour force is increasingly in demand. Nova Scotia's labour market priorities ensure that both the current workforce and new entrants have the right skills to meet employers' expectations. To mitigate the ongoing shrinking labour force and to increase workplace productivity, the province will focus on raising the workforce participation of priority groups facing significant barriers; including older workers, Indigenous peoples, African Nova Scotians, persons with disabilities, and Acadian Nova Scotians. The province will also introduce the Nova Scotia Research and Innovation Measure, to identify new and innovative ways to deliver labour market programs and services to Nova Scotians. In July 2016, the province implemented the Nova Scotia Works program, transforming the previous Careers Nova Scotia (Employment Assistance Services) program to better meet program administration cost savings and service delivery reach goals.
Managing for results
In an effort to standardize employment services offered to Nova Scotians throughout the province, and increase the share of funding allocated to direct clients supports, the province adopted the Nova Scotia Works service system. Replacing Careers Nova Scotia Centres, the Nova Scotia Works platform was launched in FY1617 to provide consistent EAS employment services to Nova Scotians, in an innovative and efficient manner. With input from service providers, a more structured approach was developed for assessing client service needs and directing them to the proper service plan. The Client Pathway process utilizes common assessment tools to determine job readiness, by identifying employment barriers, and moving clients into the most relevant service stream. Preliminary performance results of this new service delivery platform, show an increase in clients served, clients employed, clients employed full-time, and clients employed in their preferred field. Nova Scotia Works also improves the collaboration with the employer community, through the new Employer Engagement Specialist located in each Nova Scotia Works service provider.
Clients, interventions and expenditures
The number of clients served in Nova Scotia rose from 16,329 in FY1516 to 16,509 in FY1617. This represented a year-over-year increase of 1.1%. All three client-types changed,
- Active clients grew by 0.8% to 9,651 claimants;
- Former clients grew by 0.3% to 2,141 claimants; while
- Non-insured clients shrank by 2.1% to 4,717 claimants.
The share of each client type remained relatively stable compared to the previous year.
- Active claimants' share decreased by 0.2 percentage points to 58.5%;
- Former claimants' share decreased by 0.1 percentage points to 13.0%, while
- Non-insured clients rose by 0.3 percentage points to 28.6%.
Nova Scotia delivered 33,068 EBSM-similar interventions in FY1617, a 2.9% increase from FY1516. Employment Benefits reached 13.5% of all interventions, while EAS declined to 86.5%. A total of 5,133 clients returned to employment after participating in an EBSM-similar programming, compared to 5,100 clients from the previous period. Unpaid benefits amounted to $24.02 million (+2.7%), while total EBSM expenditures reached $83.3 million (+6.0%). This included Nova Scotia's $4.9 million share of the $125 million LMDA additional funding announced in Budget 2016.
Show Data Table
| Active clients | Former clients | Non-insured clients | |
|---|---|---|---|
| 2006-2007 | 9,027 | 2,281 | 3,503 |
| 2007-2008 | 9,386 | 2,395 | 3,649 |
| 2008-2009 | 10,348 | 2,526 | 4,101 |
| 2009-2010 | 12,313 | 3,218 | 4,155 |
| 2010-2011 | 11,437 | 3,407 | 4,429 |
| 2011-2012 | 10,250 | 3,089 | 4,247 |
| 2012-2013 | 10,080 | 3,399 | 4,410 |
| 2013-2014 | 9,313 | 2,779 | 4,545 |
| 2014/2015 | 9,360 | 2,202 | 4,397 |
| 2015-2016 | 9,575 | 2,134 | 4,620 |
| 2016-2017 | 9,652.0 | 2,142.0 | 4,717.0 |
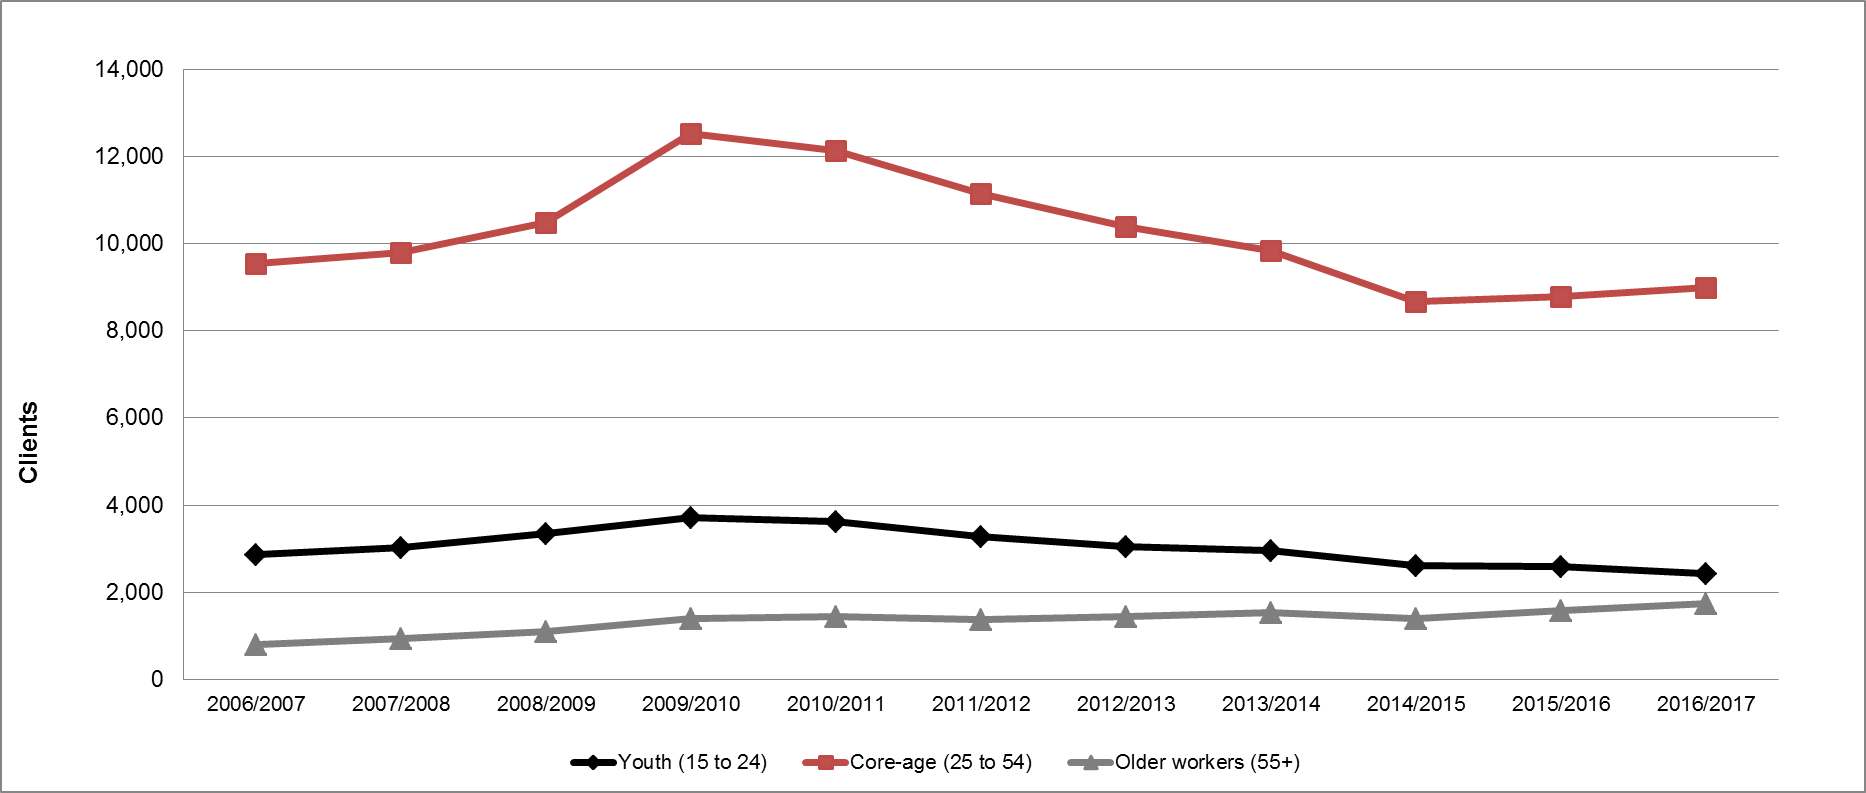
Show Data Table
| Youth (15 to 24) | Core-age (25 to 54) | Older workers (55+) | |
|---|---|---|---|
| 2006-2007 | 2,858 | 9,549 | 806 |
| 2007-2008 | 3,034 | 9,794 | 943 |
| 2008-2009 | 3,356 | 10,492 | 1,105 |
| 2009-2010 | 3,720 | 12,536 | 1,405 |
| 2010-2011 | 3,614 | 12,134 | 1,446 |
| 2011-2012 | 3,281 | 11,154 | 1,388 |
| 2012-2013 | 3,059 | 10,386 | 1,436 |
| 2013-2014 | 2,963 | 9,848 | 1,548 |
| 2014/2015 | 2,618 | 8,667 | 1,401 |
| 2015-2016 | 2,590 | 8,792 | 1,589 |
| 2016-2017 | 2,422.0 | 8,993.0 | 1,735.0 |
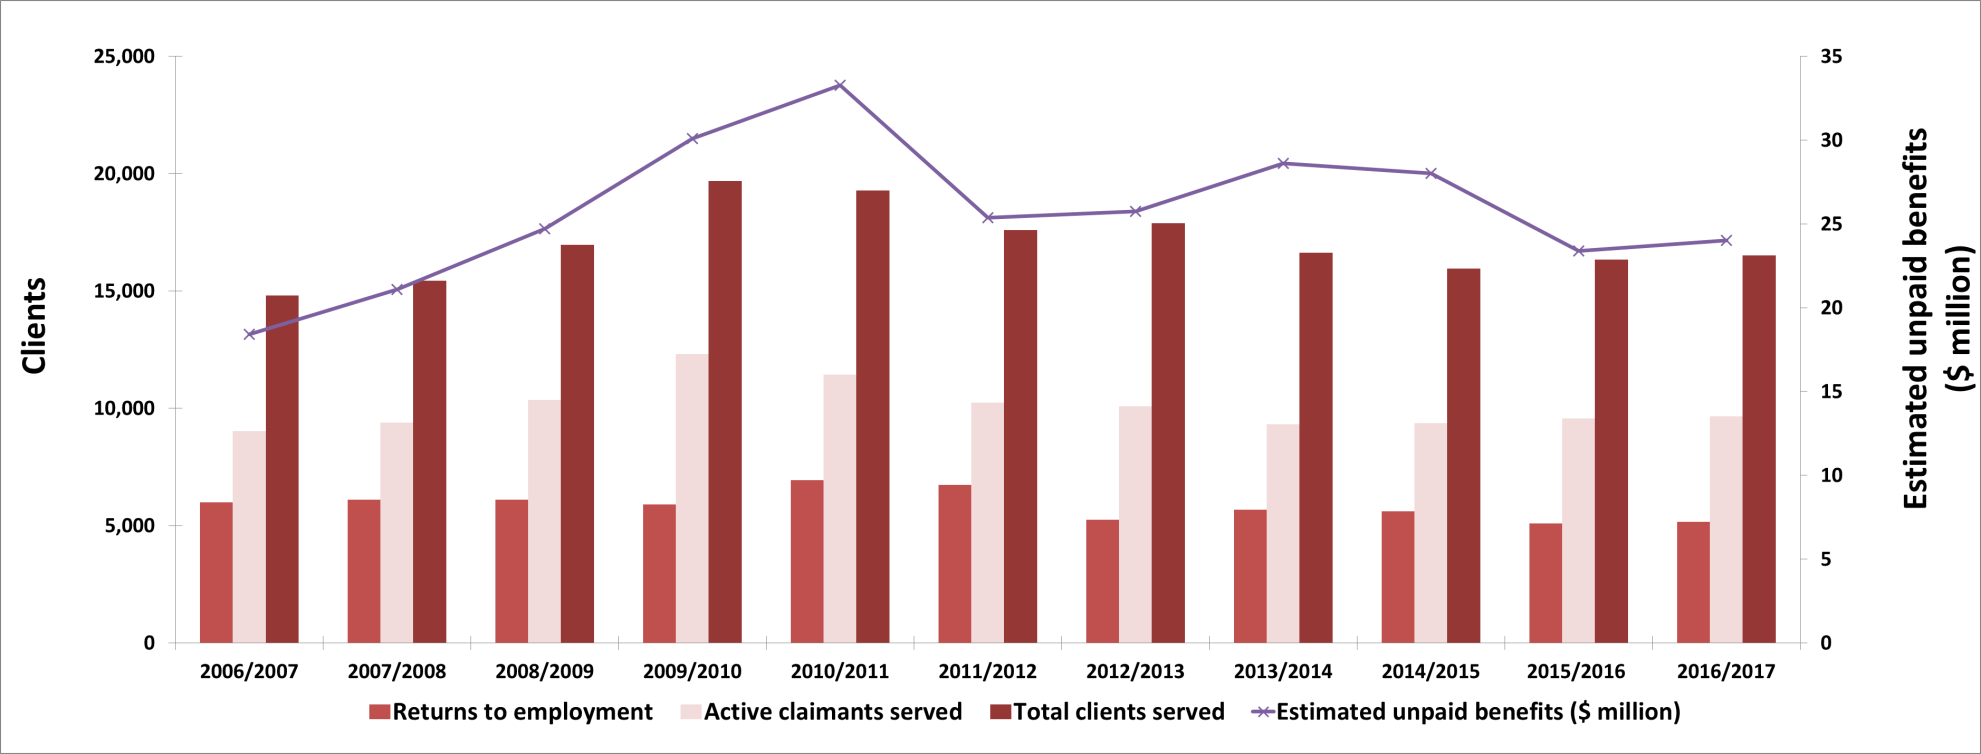
Show Data Table
| Returns to employment | Active claimants served | Total clients served | Estimated unpaid benefits ($ million) | |
|---|---|---|---|---|
| 2006-2007 | 5,983 | 9,027 | 14,811 | $18.40 |
| 2007-2008 | 6,105 | 9,386 | 15,430 | $21.10 |
| 2008-2009 | 6,100 | 10,348 | 16,975 | $24.71 |
| 2009-2010 | 5,908 | 12,313 | 19,686 | $30.09 |
| 2010-2011 | 6,942 | 11,437 | 19,273 | $33.28 |
| 2011-2012 | 6,734 | 10,250 | 17,586 | $25.38 |
| 2012-2013 | 5,259 | 10,080 | 17,889 | $25.75 |
| 2013-2014 | 5,680 | 9,313 | 16,637 | $28.60 |
| 2014/2015 | 5,608 | 9,360 | 15,959 | $28.00 |
| 2015-2016 | 5,100 | 9,575 | 16,329 | $23.39 |
| 2016-2017 | 5,153 | 9,652 | 16,511 | $24.02 |
| Interventions | Year-over-year change | Expenditures ($ 000s) |
||
|---|---|---|---|---|
| Employment Benefits | ||||
| SD-R | Nova Scotia Skills Development | 1,432 | -4.9% | 37,409 |
| SD-A | Nova Scotia Skills Development | 1,477 | -2.2% | |
| TWS | START | 827 | +76.3% | 3,999 |
| SE | Nova Scotia Self-Employment Benefit | 568 | +10.5% | 5,518 |
| JCPs | Nova Scotia Job Creation Partnerships | 146 | +13.2% | 1,404 |
| Support Measures | ||||
| EAS | Nova Scotia Employment Assistance Services | 28,618 | +2.1% | 32,070 |
| LMPs | Nova Scotia Labour Market Partnerships | n/a | n/a | 1,987 |
| R and I | Research and Innovation | n/a | n/a | 894 |
Employment Benefits
After the previous year's decline, Employment Benefits interventions in Nova Scotia increased in FY1617, reaching 4,450 (+7.8%). A breakdown of interventions shows that:
- TWS increased by 76.3% to 827 interventions;
- SE increased by 10.5% to 568 interventions;
- JCP increased by 13.2% to 146 interventions; while
- SD-R declined by 4.9% to 1,432 interventions; and
- SD-A declined by 2.2%. to 1,477 interventions.
Terry puts down roots in Cape Breton through the START Program
Terry had been a client of the YMCA of Cape Breton Nova Scotia Works Employment Services Centre in Sydney since 2015. As part of his on-going job search efforts Terry worked with a Career Practitioner for resume writing and job search assistance. At one of his visits to the centre, Terry noticed an advertisement for a training opportunity in Sydney for the Motor Vehicle Body Repair (MVBR) Trade. Terry attended the session, was interviewed and accepted for the 6-week ‘Boot Camp' training session at Nova Scotia Community College Marconi Campus in Sydney. Upon completion of the program Terry was hired under the START program to work with one of the local MVBR project partners. At the conclusion of the START program, Terry was hired full-time with that partner as a MVBR Apprentice and is now working towards becoming a Red Seal MVBR. Through this training opportunity Terry was able to find career employment locally without having to relocate to another part of Canada.
Employment Benefits expenditures amounted to $48.3 million, a 2.7% year-over-year decrease. A portion of Nova Scotia's additional funding announced in Budget 2016 was invested in improving program access for under-represented groups in apprenticeship training, including a diversity incentive for employers and a women-in-trades project.
Support Measures: EAS
EAS interventions delivered in Nova Scotia in FY1617 increased by 2.1% to 28,618. The breakdown of interventions includes:
- Employment Services which expanded by 5.2% to 22,532 interventions;
- Group Services which expanded by 3.3% to 2,077 interventions; while
- Individual Counselling shrank by 12.7% to 4,009 interventions.
At 78.7% of all EAS interventions, Employment Services remained the most frequently used Support Measure. EAS expenditures climbed by 19.2% to $32.1 million, in large part due to the $4.9 million additional funding from Budget 2016.
Other Support Measures: LMPs
Nova Scotia spent $2.9 million for LMPs and R&I, an increase of 44.0% from the previous year. LMPs expenditures edged down by 0.7% whereas R&I, delivered for the first time in the province in FY1617, cost $894,369. The key initiative under R&I, is a new partnership with St. Francis Xavier University to establish and develop the Nova Scotia Centre for Employment Innovation. This project is founded on four pillars: research and innovation, collaboration and engagement, capacity building, and training, and governance and leadership. The Centre will work closely with the Department of Labour and Advanced Education, the Nova Scotia Career Development Association, Nova Scotia EAS service providers, and community agencies. The goal is to provide coordinated leadership on innovative, evidence-based approaches, to inclusive employment service delivery and workflow, and increase the capacity and competencies of all service providers.
2.5 New Brunswick
New Brunswick's real GDP grew by 1.2% in 2016, down from 2.4% in 2015. This slower growth was in part due to contractions in the mining and quarrying industry, which saw the Piccadilly potash mine close early in the year. The province's economic growth is expected to slightly strengthen in 2017, due to rises in retail sales and housing starts. However, GDP growth rate is expected to ease again in 2018, as New Brunswick's construction activity is potentially affected by uncertainty around the United States' trade policy. Accounting for roughly 40.0% of its GDP, New Brunswick's exports to the United States as a share of total provincial GDP, is by far the largest among all provinces.
New Brunswick : EBSM key facts
| EI clients | Non-insured clients |
|---|---|
| 14,245 |
8,347 |
| Interventions type | 2016-2017 | Year-over-year change |
|---|---|---|
| Employment Benefits | 11,117 | 19.9% |
| Support Measures: EAS | 33,684 | 5.4% |
| Interventions type | 2016-2017 | Year-over-year change (pp) |
|---|---|---|
| Employment Benefits | 24.8% | 2.3 |
| Support Measures: EAS | 75.2% | 2.3 |
| Total expenditures | 2016-2017 ($ million) | Year-over-year change |
|---|---|---|
| Employment Benefits | $75.3 | 5.9% |
| Support Measures: EAS | $10.1 | 3.8% |
| LMPs and R&I | $9.5 | 15.7% |
| Total expenditures1 | $94.9 | 5.7% |
| 2015-2016 | 2016-2017 | Year-over-year change |
|---|---|---|
| $31.02 | $30.01 | 3.3% |
- 1 Totals may not add up due to rounding; does not include accounting adjustments.
Following two years of decline, employment in New Brunswick bounced back by 0.7% (+2,600), in FY1617. This was only the second year of employment growth since the province's pre-recession peak in FY0809. Most of the growth stemmed from the services-producing sector, which increased 0.8% (+2,300), with several sectors in particular seeing significant employment growth:
- Finance, insurance, real estate, rental and leasing rose by 17.4% (+2,600);
- Trade rose by 4.6% (+2,500); and
- Health care and social assistance rose by 3.7% (+2,000).
However, these gains were offset by contractions in the services-producing sector, primarily in,
- Business, building and other support services, which dropped by 12.3% (-2,200);
- Accommodation and food services, which dropped by 7.0% (-1,700); and
- Transportation and warehousing, which dropped by 6.4% (-1,300).
Employment in the goods-producing sector remained relatively unchanged (+300; +0.4%). Employment in agriculture grew by 31.3% (+1,300), and manufacturing increased by 2.9% (+900). However, these gains were offset by losses in forestry, fishing, mining, quarrying, oil and gas, which fell 13.5% (-1,500); and in construction, which contracted by 3.1% (-800). Between FY1516 and FY1617, the unemployment rate dropped by 0.6 percentage points to 9.2%, as the number of unemployed declined by 2,200 (-5.7%).
Similar to its Atlantic counterparts, New Brunswick's economic and labour market challenges include high unemployment rates, slow population growth, an aging workforce, and net out-migration of youth and skilled workers. To alleviate these issues, the province will prioritise activities to attract, retain, and educate a highly skilled workforce that meet employers' needs. It will do so by engaging youth to partake in local post-secondary education; promoting upskilling opportunities to workers, and those who have not yet entered the labour market; and investing in innovative programs and services. These initiatives should contribute to ensure the province is responsive to labour market challenges.
Managing for results
New Brunswick acknowledges that valid, up-to-date labour market information, will assist its citizens in acquiring the right skills to secure and maintain employment. To roll-out concrete initiatives to address workforce issues, the province established Workforce Action Teams in three major centers, to pool resources and share Labour Market Information (LMI). As part of this initiative, New Brunswick developed valuable new LMI tools, including a Careers in Demand feature that highlights skills most commonly sought by employers. The province explored new approaches to support those who required additional interventions, to ensure they are ready to join the labour market. An example of new program design and delivery includes the Experiential Learning and Employment (ELE) Continuum. This initiative targets 400 Social Assistance clients over three years, with the goal of improving their labour market outcomes. The nine month ELE Continuum includes pre-employability services, a job preparation skills and knowledge component, workplace essential skills training, and work experience.
Clients, interventions and expenditures
New Brunswick served 22,592 clients in FY1617, a 14.9% increase from FY1516 figures.
- Former claimants declined by 0.9% to 2,859,
- Active claimants rose by 9.4% to 11,386, and
- Non-insured clients grew by 31.1%, reaching 8,347.
As for their shares, the majority of clients were active claimants (50.4%), followed by non-insured claimants (36.9%) and former clients (12.7%).
The total number of EBSM-similar interventions delivered in New Brunswick in FY1617 increased for a fourth consecutive year by 8.7%, reaching 44,801. Employment Benefits represented 24.8% of the total EBSMs programming, an increase of 2.3 percentage points year-over-year. Accordingly, the share of EAS dropped from 77.5% in the previous year to 75.2% in FY1617. A total of 8,300 clients (+1.5%) returned to employment following an intervention. Additionally, unpaid benefits contracted by 3.3% to $30.01 million. Total expenditures in EBSMs amounted to $94.9 million (+5.7%), including $5.1 million of the $125 million additional LMDA funding, provided under Budget 2016.
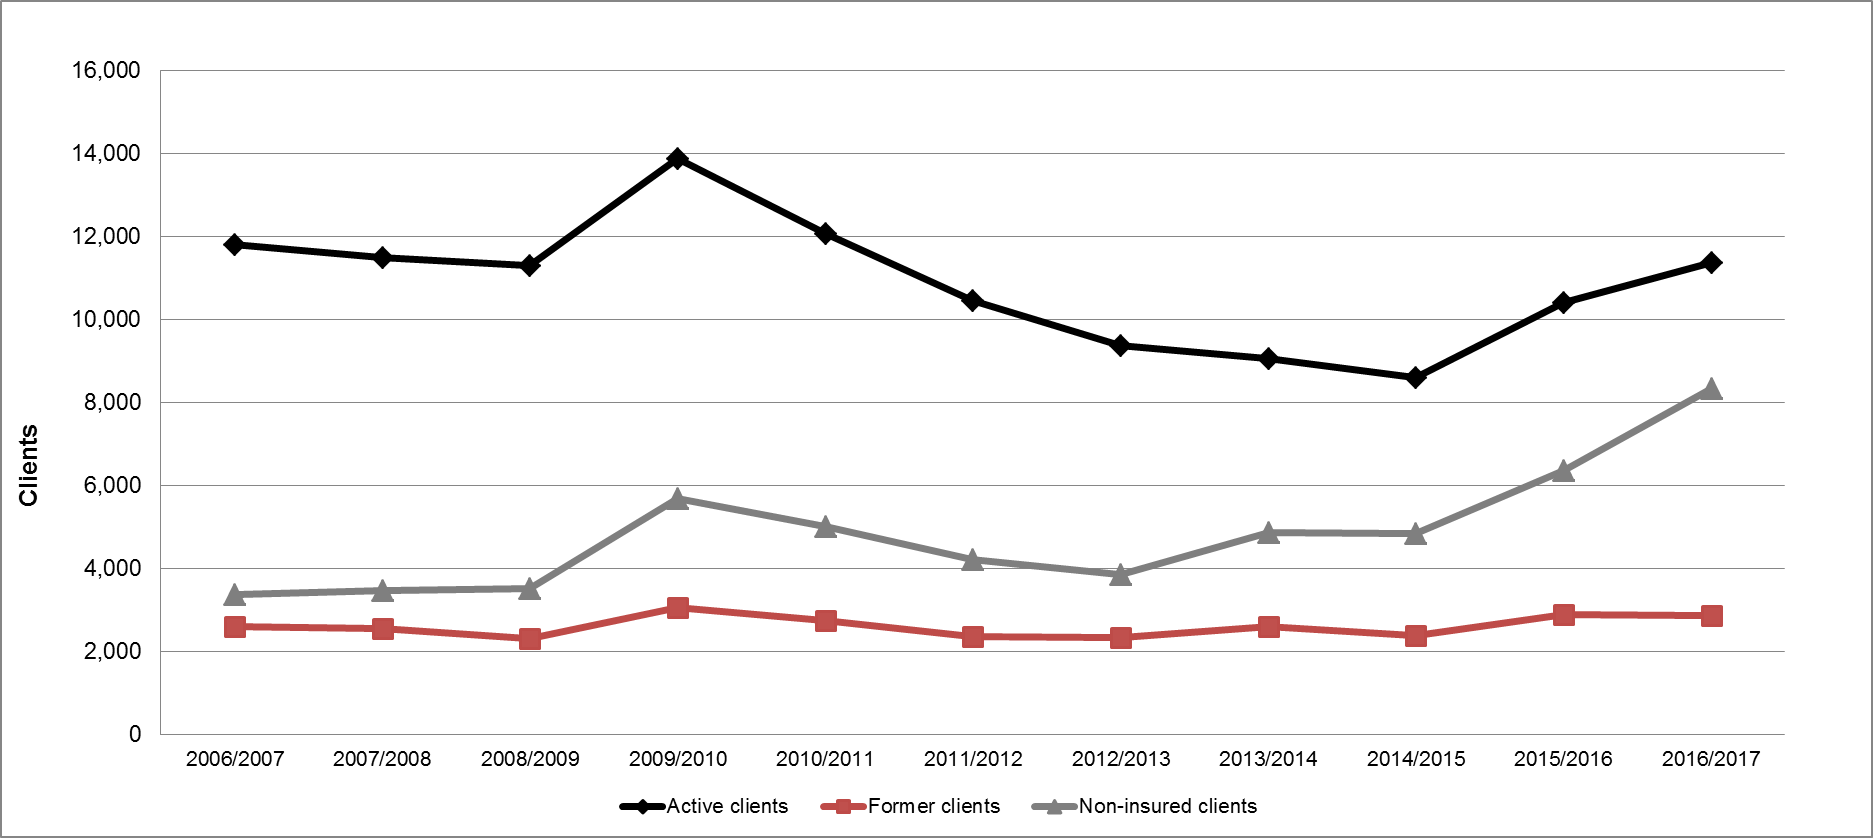
Show Data Table
| Active clients | Former clients | Non-insured clients | |
|---|---|---|---|
| 2006-2007 | 11,812 | 2,592 | 3,381 |
| 2007-2008 | 11,508 | 2,552 | 3,476 |
| 2008-2009 | 11,315 | 2,303 | 3,512 |
| 2009-2010 | 13,895 | 3,064 | 5,679 |
| 2010-2011 | 12,076 | 2,741 | 5,001 |
| 2011-2012 | 10,459 | 2,365 | 4,217 |
| 2012-2013 | 9,365 | 2,334 | 3,844 |
| 2013-2014 | 9,070 | 2,592 | 4,876 |
| 2014/2015 | 8,596 | 2,393 | 4,838 |
| 2015-2016 | 10,411 | 2,885 | 6,365 |
| 2016-2017 | 11,386 | 2,860 | 8,347 |
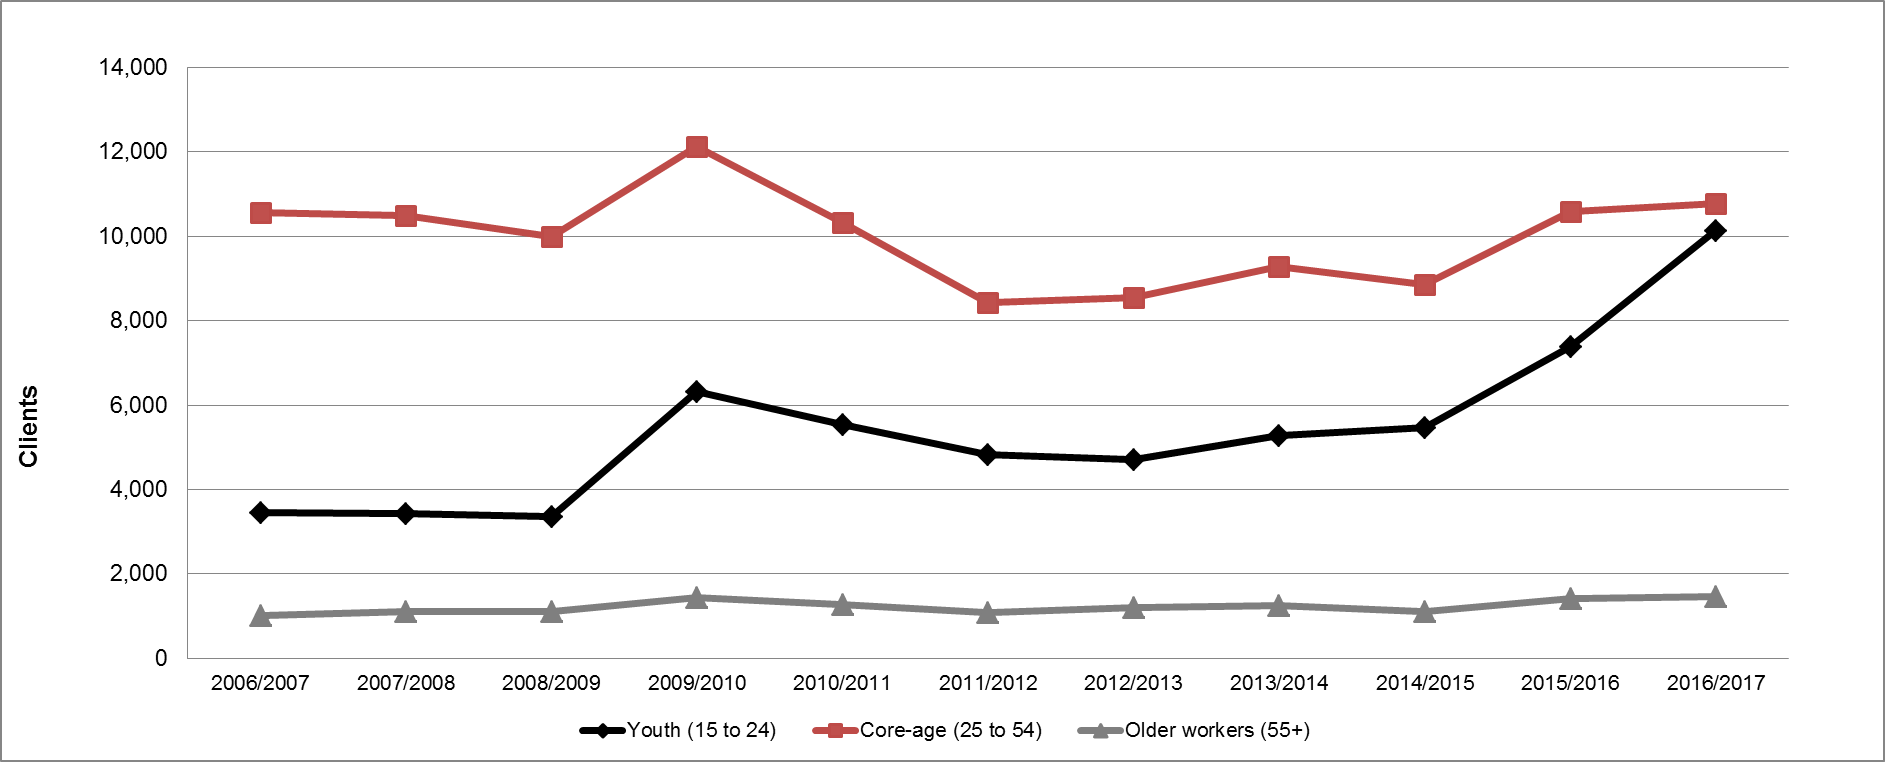
Show Data Table
| Youth (15 to 24) | Core-age (25 to 54) | Older workers (55+) | |
|---|---|---|---|
| 2006-2007 | 3,462 | 10,562 | 1,013 |
| 2007-2008 | 3,442 | 10,489 | 1,101 |
| 2008-2009 | 3,361 | 9,994 | 1,120 |
| 2009-2010 | 6,321 | 12,130 | 1,432 |
| 2010-2011 | 5,537 | 10,323 | 1,271 |
| 2011-2012 | 4,837 | 8,429 | 1,086 |
| 2012-2013 | 4,709 | 8,558 | 1,199 |
| 2013-2014 | 5,287 | 9,297 | 1,257 |
| 2014/2015 | 5,466 | 8,870 | 1,116 |
| 2015-2016 | 7,383 | 10,583 | 1,427 |
| 2016-2017 | 10,132 | 10,782 | 1,475 |
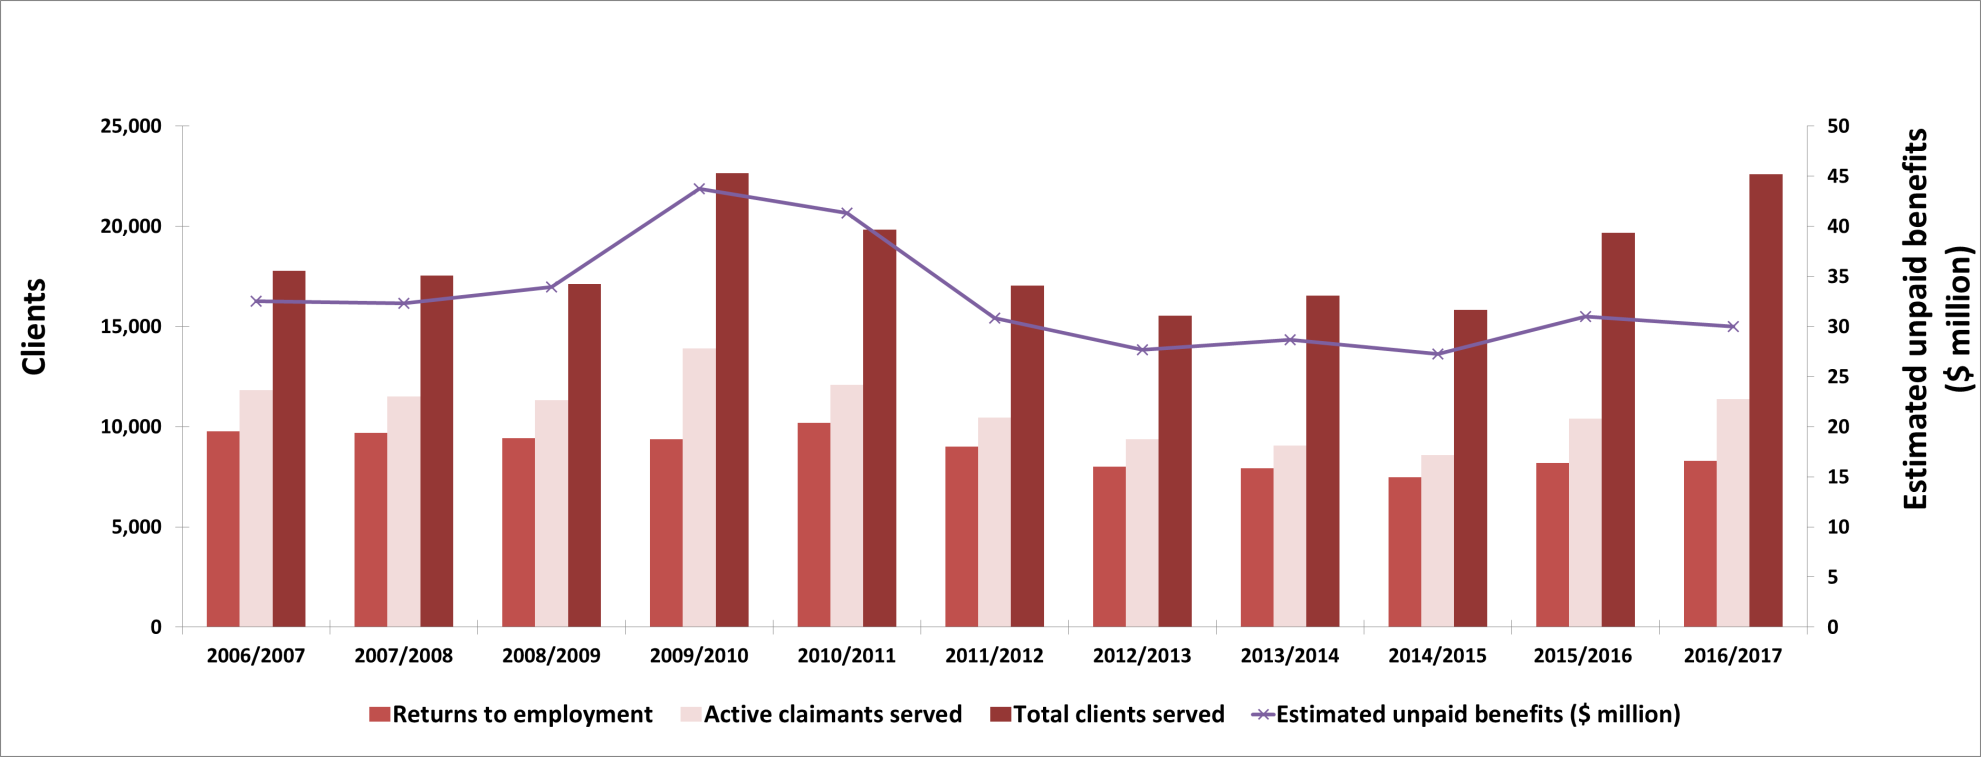
Show Data Table
| Returns to employment | Active claimants served | Total clients served | Estimated unpaid benefits ($ million) | |
|---|---|---|---|---|
| 2006-2007 | 9,776 | 11,812 | 17,785 | $32.50 |
| 2007-2008 | 9,680 | 11,508 | 17,536 | $32.30 |
| 2008-2009 | 9,422 | 11,315 | 17,130 | $33.95 |
| 2009-2010 | 9,367 | 13,895 | 22,638 | $43.73 |
| 2010-2011 | 10,193 | 12,076 | 19,818 | $41.33 |
| 2011-2012 | 9,017 | 10,459 | 17,041 | $30.85 |
| 2012-2013 | 8,015 | 9,365 | 15,543 | $27.65 |
| 2013-2014 | 7,927 | 9,070 | 16,538 | $28.67 |
| 2014/2015 | 7,471 | 8,596 | 15,827 | $27.25 |
| 2015-2016 | 8,179 | 10,411 | 19,661 | $31.02 |
| 2016-2017 | 8,300 | 11,386 | 22,593 | $30.01 |
| Interventions | Year-over-year change |
Expenditures ($ 000s) |
||
|---|---|---|---|---|
| Employment Benefits | ||||
| SD-R | Training and Skills Development Program | 6,300 | +50.3% | 57,319 |
| SD-A | Training and Skills Development Program | 1,994 | -14.2% | |
| TWS | Workforce Expansion—Employer Wage Subsidy | 2,461 | +0.7% | 12,818 |
| SE | Workforce Expansion—Self-Employment Benefit | 362 | +14.9% | 5,153 |
| Support Measures | ||||
| EAS | Employment Assistance Services | 33,684 | +5.4% | 10,131 |
| LMPs | Adjustment Services | n/a | n/a | 8,685 |
| R&I | Research and Innovation | n/a | n/a | 832 |
Employment Benefits
For a third consecutive year, Employment Benefits interventions rose in New Brunswick, reaching 11,117 in FY1617, an increase of 19.9% year-over-year. SD-R (6,300; +50.3%) was the main contributor to this growth, which was made possible with the support from the additional funding provided through Budget 2016. Other contributors included TWS, which increased by 0.7% to 2,461, and SE, which increased by 14.9% to 362. Conversely, SD-A declined by 14.2% to 1,994. Employment Benefits expenditures increased by 5.9% to $75.3 million, almost entirely resulting from the additional $5.3 million invested in SD through the Training and Skills Development Program.
Support Measures: EAS
The total number of EAS interventions delivered in New Brunswick grew 5.4% year-over-year, from 31,954 in FY1516, to 33,684 in FY1617. Individual Counselling (2,106) rose moderately by 10.0%, representing a fifth consecutive year of growth for this EAS type. However, Employment Service dropped 3.5% to 10,428 in FY1617. Total EAS Expenditures shrank by 3.8% to $10.1 million.
A suite of employment benefits help Todd land a job
After graduating from high school through the Workplace Essential Skills program in 2013, Todd wanted to gain additional skills that would allow him to find work in a field more closely aligned with his lifetime passion: cars.
In September 2015, he received Training and Skills Development funding to help him undertake an auto body and paint training program at the Collège communautaire du Nouveau-Brunswick (CCNB) in Bathurst. He successfully completed the training and graduated from the CCNB in June 2016. He then secured a job with a local employer funded under the Employer Wage Incentive - Workforce Expansion Program in October 2016.
This work opportunity gave him the experience he needed to continue his career path and maintain a job in a field he enjoys.
Other Support Measures: LMPs and R&I
New Brunswick's LMPs expenditures rose 18.9% to $8.7 million in FY1617, while expenditures for R&I contracted by 9.2% to $832,000. Over half of R&I expenditures were allocated towards testing service delivery models for persons with disabilities. Total combined expenditures for both LMP and R&I accounted for 10.0% of EBSM total expenditures.
2.6 Quebec
In 2016, Quebec's real GDP grew by 1.4%, following a 1.0% increase in 2015. For 2017, Canadian chartered banks project Quebec's growth will grow by up to 2.5%.
Compared to FY1516, Quebec's labour force changed very little at 4,459,400 (+0.4%). In total, 55,100 (+1.3%) jobs were created in the province on a net basis. This is mainly due to the rise in full-time work (+1.6%), while part-time work remained relatively steady (+0.2%). A decrease of 0.8 percentage points in the unemployment rate (6.8%) was recorded in FY1617, while the participation rate (64.6%) dipped slightly (-0.2 percentage points).
Quebec: EBSM key facts
| EI clients | Non-insured clients |
|---|---|
| 165,627 |
84,716 |
| Interventions type | 2016-2017 | Year-over-year change |
|---|---|---|
| Employment Benefits | 34,464 | 3.7% |
| Support Measures: EAS | 283,322 | 0.5% |
| Interventions type | 2016-2017 | Year-over-year change (pp) |
|---|---|---|
| Employment Benefits | 10.8% | 0.3 |
| Support Measures: EAS | 89.2% | 0.3 |
| Total expenditures | 2016-2017 ($ million) | Year-over-year change |
|---|---|---|
| Employment Benefits | $343.5 | 1.5% |
| Support Measures: EAS | $156.4 | 26.0% |
| LMPs and R&I | $112.5 | 2.3% |
| Total expenditures1 | $612.5 | 6.0% |
| 2015-2016 | 2016-2017 | Year-over-year change |
|---|---|---|
| $332.31 | $334.28 | 0.6% |
- 1 Totals may not add up due to rounding; does not include accounting adjustments.
During FY1617, employment grew by 6,700 (+0.8%) in the goods-producing industries on a net basis. This improvement is mainly a result of gains recorded in the following sectors: construction (+7,100, +3.1%); forestry, fishing, mining, oil and gas (+1,400, +4.5%); and agriculture (+1,100, +2.0%); however, employment dipped slightly in the manufacturing sector (-1,400, -0.3%), and in utilities (-1,500, -5.2%). With regards to service industries, 48,300 (+1.5%) jobs were created on a net basis, with strong growth in educational services (+11,200, +4.1%); information, culture and recreation (+10,000, +5.8%); business, building and other support services (+9,000, +5.2%); finance, insurance, real estate and leasing (+8,500, +4.0%); other services (+8,500, +5.2%); and public administration (+4,100, +1.7%). Only health care and social assistance (-2,800), and professional, scientific and technical services (-5,400) sectors recorded decreases of 0.5% and 1.7%, respectively.
The Quebec labour market is evolving along with the aging population. This could lead to declines in the long-term participation rate. In FY1617, Emploi-Québec highlighted the link between training and labour market needs. This priority complies with the governmental initiatives announced in FY1516's and FY1617's successive budgets. These initiatives were intended to boost the participation rate to effectively meet the labour market needs of employers. A further aim was to increase the number of available workers through better integration of underrepresented groups in the labour market. During FY1617, Emploi-Québec's objective was to enable 282,500 new participants to benefit from employment measures, and ensure the integration of 142,600 individuals into employment following participation in interventions. Quebec intended to reach its goals through the implementation of the following approaches and strategies: transitioning individuals ready to enter the labour market; integrating clients of social assistance programs, and individuals from underrepresented labour market groups, into the workforce; managing human resources in companies effectively; and strengthening labour market skills.
Managing for results
Emploi-Québec proactively intervenes with regular EI claimants through the Targeting, Referral and Feedback (TRF) system. This tool, implemented in close collaboration with Service Canada, helps to identify claimants by targeting and referring them to Emploi-Québec as soon as their EI claim is submitted. It is designed to provide early interventions to both workers in high-demand occupations, and those likely to experience prolonged unemployment. Depending on their needs, specific measures such as job search assistance, resume writing, and training activities, are provided to candidates. Claimants can access these services through third parties specializing in job development, with agreements with either Emploi-Québec or regional Services Québec offices.
The TRF tool also acts as a channel for Emploi-Québec to update Service Canada on candidates' progress, especially in the event of a quick return to work. Given its proven effectiveness over the years, the TRF system has been, or will be, adopted by other provinces (British Columbia and Alberta).
Clients, interventions and expenditures
In FY1617, a total of 250,343 clients participated in EBSM-similar programs funded by LMDAs, in line with the number of clients served in FY1516 (253,119; -1.1%). FY1516 marked a historic peak in terms of people reached in a year. The composition of the claimants evolved to meet the needs of the labour market as much as possible, as shown in Chart 19. From one year to the next, the number of active claimants who received an intervention (138,682) fell by 5.2%, whereas the number of former claimants remained stable at 26,945. The number of non-insured clients increased to 84,716 (+6.1%) in FY1617. At 55.4%, active claimants still represent the majority of clients served, however, their share shrank for the third year in a row (-2.4 percentage points in FY1617). The shares of former claimants (10.8%) and non-insured clients (33.8%) climbed by 0.1 and 2.3 percentage points, respectively.
Clients participated in a total of 317,786 interventions (+0.8%). After declining for six years, the proportion of employment benefits among all EBSM interventions stabilized in FY1617 at 10.8%. EAS interventions remained unchanged at 89.2%.
In total, 66,468 clients (+2.7%) returned to work after participating in LMDA-funded programs. This number rose for the fourth consecutive year. The total amount of unpaid benefits ($334.3 million) from the EI Operating Account remained relatively steady (+0.6%). EBSM expenditures from the Employment Insurance Operating Account totalled $612.5 million, an increase of 6.0% (+$34.8 million) from FY1516. This is due to an additional $35.6 million from the federal government, allocated to Quebec as part of the Canada-Quebec Labour Market Agreement.
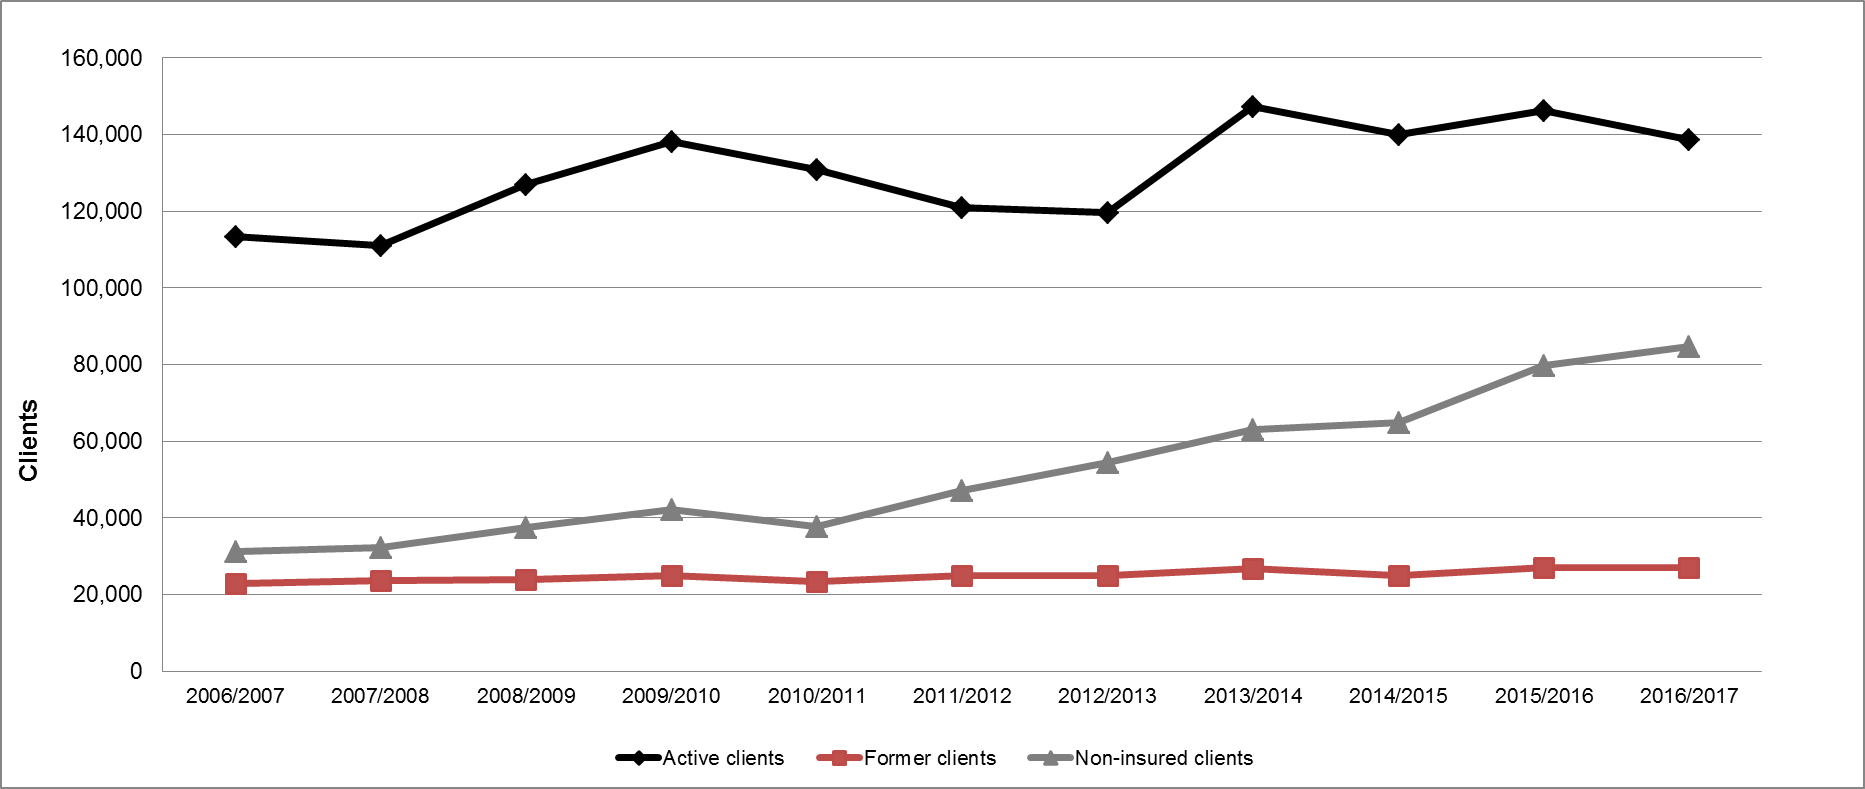
Show Data Table
| Active clients | Former clients | Non-insured clients | |
|---|---|---|---|
| 2006-2007 | 113,417 | 22,797 | 31,247 |
| 2007-2008 | 111,026 | 23,582 | 32,212 |
| 2008-2009 | 127,027 | 23,893 | 37,408 |
| 2009-2010 | 138,274 | 24,970 | 42,167 |
| 2010-2011 | 130,782 | 23,288 | 37,859 |
| 2011-2012 | 121,089 | 25,099 | 47,049 |
| 2012-2013 | 119,771 | 25,081 | 54,519 |
| 2013-2014 | 147,396 | 26,779 | 63,162 |
| 2014/2015 | 140,026 | 24,986 | 64,769 |
| 2015-2016 | 146,359 | 26,946 | 79,814 |
| 2016-2017 | 138,685 | 26,945 | 84,731 |
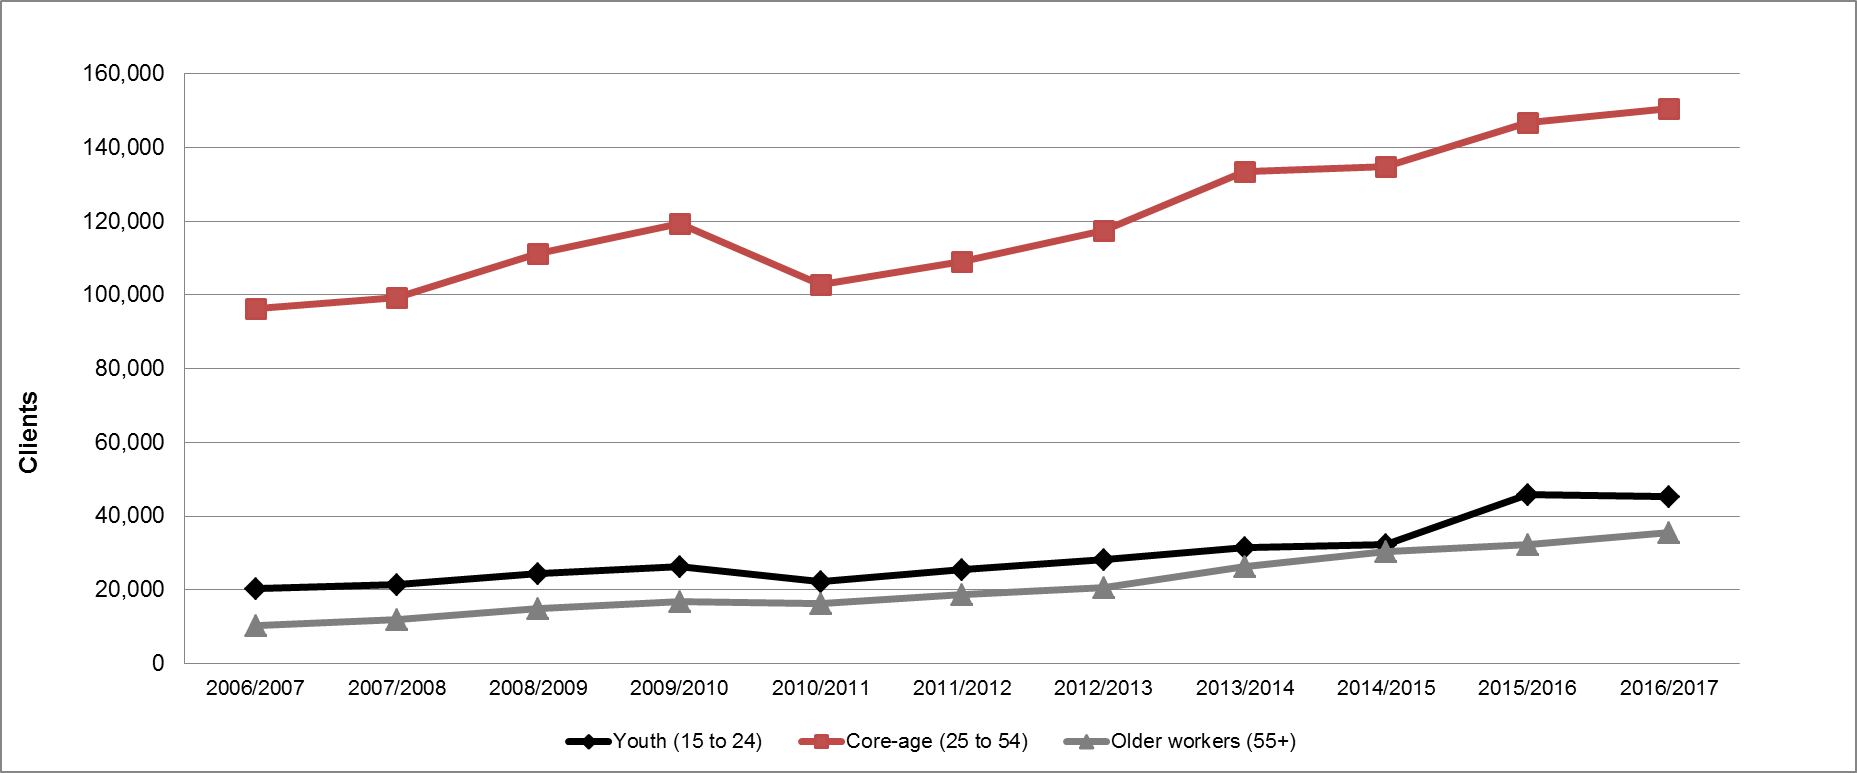
Show Data Table
| Youth (15 to 24) | Core-age (25 to 54) | Older workers (55+) | |
|---|---|---|---|
| 2006-2007 | 20,284 | 96,376 | 10,275 |
| 2007-2008 | 21,394 | 99,350 | 11,961 |
| 2008-2009 | 24,367 | 111,260 | 14,953 |
| 2009-2010 | 26,342 | 119,448 | 16,728 |
| 2010-2011 | 22,385 | 102,720 | 16,279 |
| 2011-2012 | 25,408 | 109,185 | 18,669 |
| 2012-2013 | 28,285 | 117,427 | 20,752 |
| 2013-2014 | 31,409 | 133,491 | 26,454 |
| 2014/2015 | 32,259 | 134,939 | 30,334 |
| 2015-2016 | 45,785 | 146,872 | 32,370 |
| 2016-2017 | 45,402 | 150,695 | 35,540 |
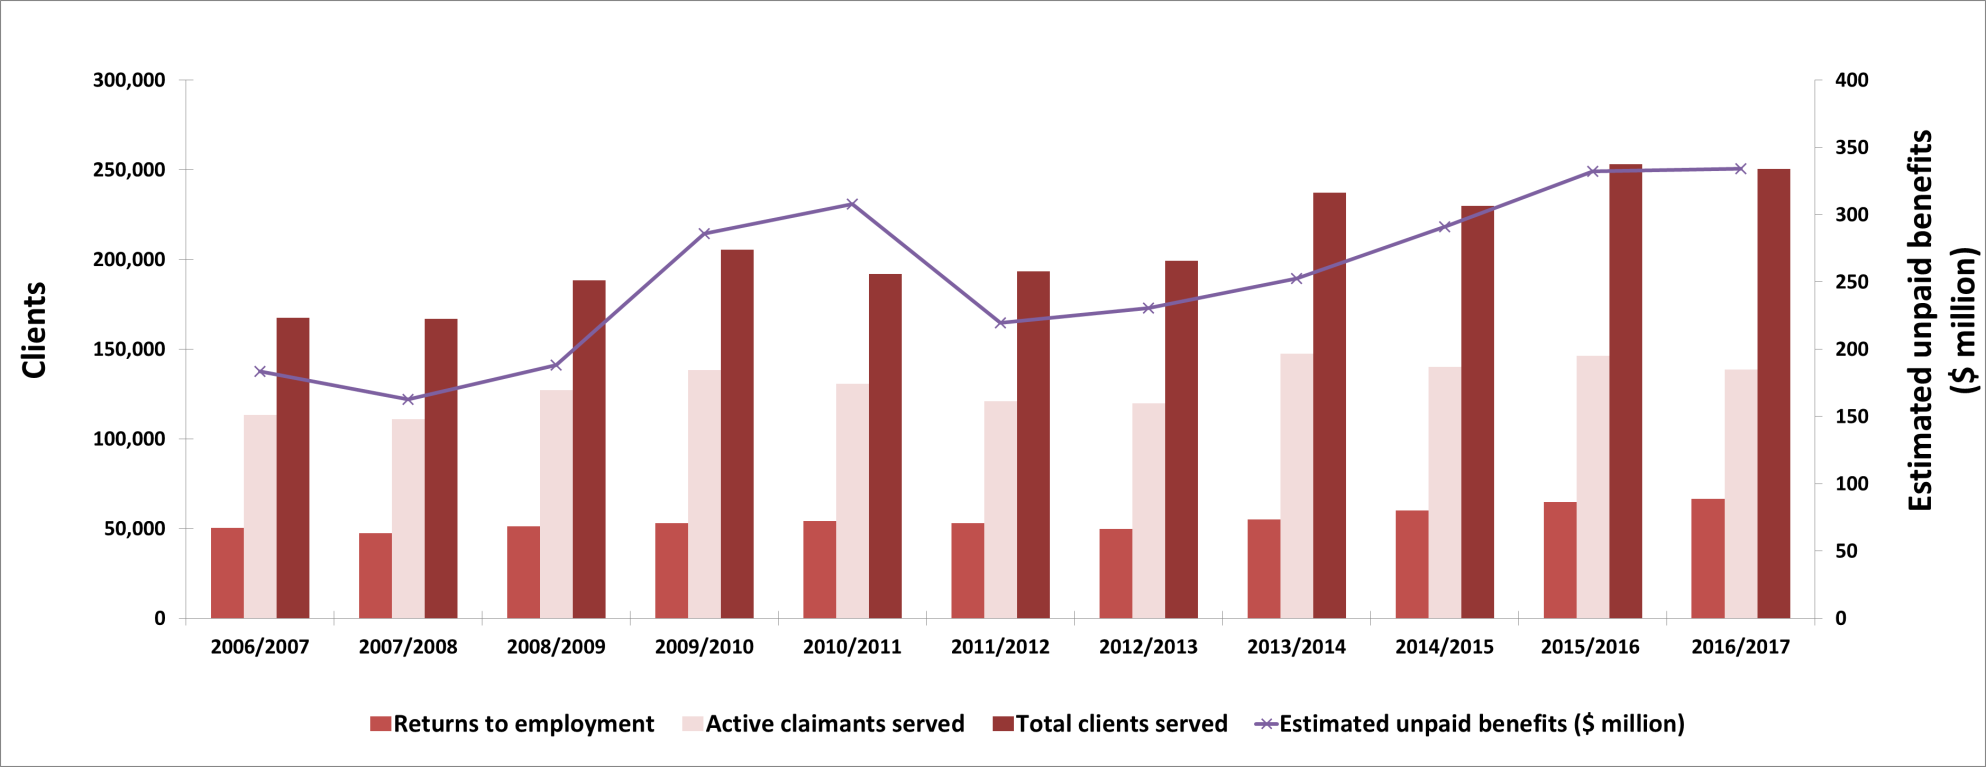
Show Data Table
| Returns to employment | Active claimants served | Total clients served | Estimated unpaid benefits ($ million) | |
|---|---|---|---|---|
| 2006-2007 | 50,486 | 113,417 | 167,461 | $183.30 |
| 2007-2008 | 47,313 | 111,026 | 166,820 | $162.80 |
| 2008-2009 | 51,383 | 127,027 | 188,328 | $188.26 |
| 2009-2010 | 53,081 | 138,274 | 205,411 | $285.80 |
| 2010-2011 | 54,239 | 130,782 | 191,929 | $307.80 |
| 2011-2012 | 52,872 | 121,089 | 193,237 | $219.42 |
| 2012-2013 | 49,757 | 119,771 | 199,371 | $230.49 |
| 2013-2014 | 55,043 | 147,396 | 237,337 | $252.38 |
| 2014/2015 | 59,949 | 140,026 | 229,781 | $290.84 |
| 2015-2016 | 64,697 | 146,359 | 253,119 | $332.31 |
| 2016-2017 | 66,502 | 138,685 | 250,361 | $334.28 |
| Interventions | Year-over-year change |
Expenditures ($ 000s) |
||
|---|---|---|---|---|
| Employment Benefits | ||||
| TWS | Wage Subsidies | 6,657 | +17.7% | 81,153 |
| SE | Support for Self-Employment Measure | 1,774 | -2.0% | 24,536 |
| TES | Return to Work Supplement | - | - | - |
| SD | Manpower Training Measure Job Readiness | 26,033 | +1.0% | 237,845 |
| Support Measures | ||||
| EAS | Labour Market Information Job Placement Job Research and Assistance Services |
283,322 | +0.5% | 156,429 |
| LMPs | Job Cooperation Services Manpower Training Measure for Enterprises |
n/a | n/a | 111,704 |
| R&I | Research and Innovation Strategy | n/a | n/a | 797 |
Employment Benefits
In FY1617, the number of Employment Benefits interventions rose by 3.7% to 34,464. This growth is a result of the Skills Development (SD) Regular stream (26,033) and Targeted Wage Subsidies (TWS) (6,657), which increased by 1.0% and 17.7%, respectively, as a result of the additional funding granted by the federal government in Budget 2016 ($125 million for all of Canada). Conversely, the number of Self-Employment Benefit (SE) interventions (1,774) dropped by 2.0%. Quebec invested a total of $343.5 million (+1.5%) on Employment Benefits.
Support Measures: Employment Assistance Services (EAS)
In FY1617, the number of EAS interventions increased to 283,323 (+0.5%), for claimants without employment barriers who are ready to return to work. Employment Services (196,739) and Individual Counselling (68,202) grew by 3.1% and 7.8%, respectively, while Group Services (18,382) fell by 34.0%. EAS expenditures increased from $124.1 million in FY1516 to $156.4 million in FY1617, a 26.0% increase year-over-year. The additional $125 million in funding from the federal government to all provinces and territories allowed Quebec to significantly increase assistance to Quebeckers who were not previously entitled to EI Part I in FY1516.
Other Support Measures: LMPs and R&I
Compared to the last year, total expenditures granted to LMPs and R&I by Quebec in FY1617 amounted to $112.5 million, with $111.7 million going to LMPs. The proportion of total LMP funding represented 18.2% of total EBSM expenditures, illustrating the importance placed on supporting the training of employed workers, and improving human resource management functions. This amount is similar to the $113.9 million in FY1516. The $797,000 invested in R&I supported projects to explore new ways to improve results.
Audrey is benefitting from the new specialized service for young people (EAS)
Audrey dropped out of high school after moving to another region, where she had trouble fitting into her new school environment (target of prejudice, learning challenges, anxiety, etc.). By talking with an agent from her local employment centre, she decided to meet with a Carrefour jeunesse-emploi (CJE) support worker. They then agreed to complete an orientation process to help her set a professional objective and gain a better understanding of job opportunities in her new region. To help herself on this fresh start, Audrey also participated in various volunteering activities, which enabled her to gain confidence while giving her the opportunity to experience the agrifood sector first-hand through an unpaid internship. Possessing all general training prerequisites, she began professional training in food processing with the support of Emploi-Québec. She continues to receive the necessary support from her CJE support worker.
2.7 Ontario
Ontario's real GDP grew by 2.6% in 2016, extending the province's ongoing economic expansion period to seven years. Main contributors to this growth were finance and insurance, real estate, information and communication, and trade. The province's real GDP is projected to increase by over 2.0% in both 2017 and 2018.
Ontario: EBSM key facts
| EI clients | Non-insured clients |
| 87,135 |
103,402 |
| Interventions type | 2016-2017 | Year-over-year change |
|---|---|---|
| Employment Benefits | 25,615 | 8.4% |
| Support Measures: EAS | 188,071 | 23.4% |
| Interventions type | 2016-2017 | Year-over-year change (pp) |
|---|---|---|
| Employment Benefits | 12.0% | 3.5 |
| Support Measures: EAS | 88.0% | 3.5 |
| Total expenditures | 2016-2017 ($ million) | Year-over-year change |
|---|---|---|
| Employment Benefits | $170.8 | 25.2% |
| Support Measures: EAS | $336.0 | 19.0% |
| LMPs and R&I | $113.7 | 77.1% |
| Total expenditures1 | $620.6 | 8.0% |
| 2015-2016 | 2016-2017 | Year-over-year change |
|---|---|---|
| $236.05 | $262.66 | 11.3% |
- 1 Totals may not add up due to rounding; does not include accounting adjustments.
Ontario's labour market conditions improved in FY1617 from the previous year, as employment grew by 79,100 (+1.1%) and the unemployment rate declined to 6.4%, in line with rates last seen before the 2008-2009 recession. However, both the employment rate and participation rate continued their long-term decline, as employment and labour force growth did not keep pace with the increase of the working-age population. Employment growth was almost entirely realized in the services-producing sector, which increased by 75,800 (+1.4%), led by gains in:
- Health care and social assistance (+31,200; +3.8%)
- Public administration (+18,000; +5.3%)
- Accommodation and food services (+13,900; 3.1%)
The largest losses in the services-producing sector were registered in:
- Educational services (-11,700; -2.3%)
- Business, building and other support services (-9,000; -2.7%)
In the goods-producing sector, employment increased by 3,300 (+0.2%). Gains in construction (+14,700; +3.0%) and utilities (+1,300; +2.6%) were partially offset by declines in forestry, fishing, mining, quarrying, oil and gas ( 9,600; -21.8%) and agriculture (-3,200; -4.1%). Ontario's overall employment growth is forecasted to strengthen in FY1718.
Ontario's employment and skills training priorities reflect the needs of a growing economy and to ensure opportunities in training, the workforce and communities, including:
- Sustaining an adequate supply of highly-skilled workers to meet the needs of a growing economy and the jobs of the future workforce;
- Increasing the participation of underrepresented groups (e.g. Indigenous peoples and persons with disabilities) in training and workplaces and to address labour market needs and outcome differences.
The province used its additional LMDA funding from Budget 2016 to test new approaches to create a highly skilled workforce, including implementing recommendations from the Premier's Highly Skilled Workforce Expert Panel and other initiatives to transform Ontario's employment and training services to better address the needs of Ontarians. These efforts include increasing partnerships between employers, the education sector and governments, to support skills development and job-integrated learning opportunities, including to those who are distant from the labour market (e.g. Indigenous peoples, persons with disabilities and newcomers).
Managing for results
In 2016, Ontario's government released a report with recommendations led by the Premier's Highly Skilled Workforce expert panel. The goal of this panel is to develop a strategy allowing the province's current and future workforce to meet the demands of a technology-driven knowledge economy. The government accepted the recommendations and mandated the Minister of Advanced Education and Skills Development (MAESD) to lead their implementation.
As part of ongoing and continuous improvements to the province's programming, Ontario works collaboratively with a range of stakeholders. For example, in March and April 2016, MAESD undertook a series of employer engagement sessions on Ontario's apprenticeship programming and financial supports for employers of apprentices. The sessions were led by third-party consultants, in partnership with stakeholders. The results of the engagement sessions were used to inform the development of a strategy to modernize Ontario's apprenticeship system.
Also, in June 2016, Ontario held eight roundtables to engage with stakeholders, including employers, on improving the labour market transfer agreements. Together with the Pan-Canadian consultations, these roundtables informed the 2017-18 negotiations of a more flexible Labour Market Development Agreement to better respond to the changing labour market.
Clients, interventions and expenditures
Ontario served 190,537 clients in FY1617, 17.9% greater than in FY1516. All client types increased:
- Active clients increased by 3.1% to 62,339;
- Former clients increased by 33.2% to 24,796; and
- Non-insured clients increased by 25.4% to 103,402.
As for their shares, the proportion of non-insured clients grew, by 3.2 percentage points to 54.3%, followed by former clients (13.0%) which rose by 1.5 percentage points. The share of active clients diminished by 4.7 percentage points to 32.7%.
In FY1617, the province delivered a total of 213,686 (+18.5%) interventions, compared to 180,343 in FY1516. While the share of EAS accounted for 88.0% of all interventions, that of Employment benefits totalled 12.0%. In Ontario, 37,044 clients returned to work after participating in an EBSM-similar programming. Unpaid Benefits rose to $262.66 million (+11.3%). EBSMs expenditures amounted to $620.6 million, including $43.4 million of the $125 million additional LMDA funding announced in Budget 2016.
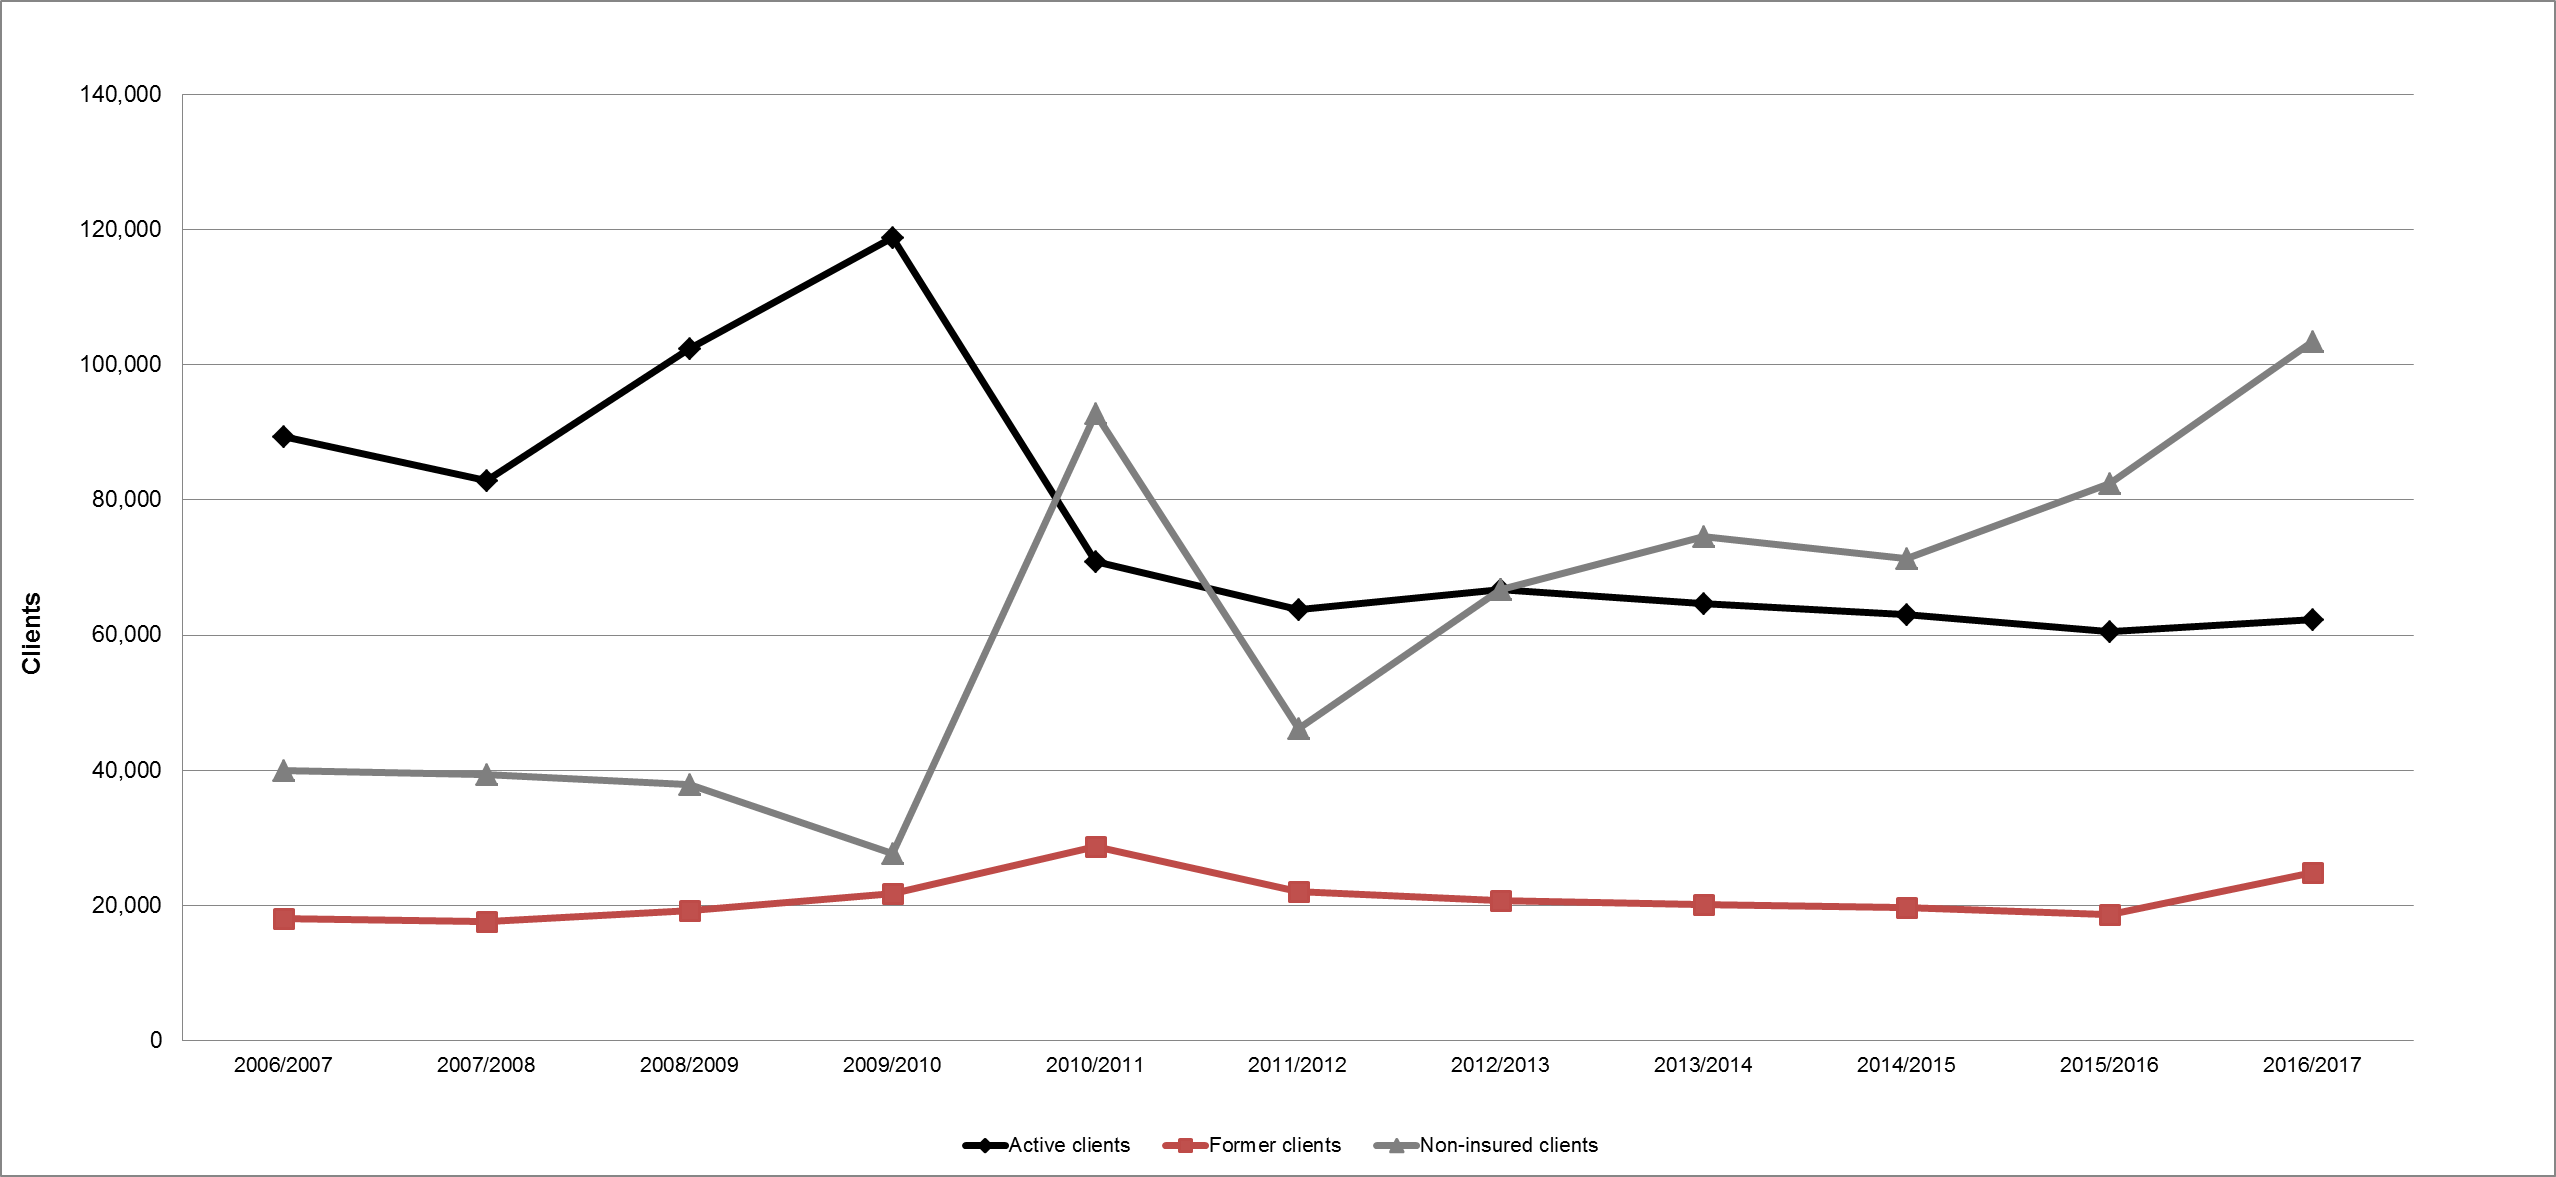
Show Data Table
| Active clients | Former clients | Non-insured clients | |
|---|---|---|---|
| 2006-2007 | 89,353 | 18,044 | 39,898 |
| 2007-2008 | 82,927 | 17,595 | 39,346 |
| 2008-2009 | 102,406 | 19,278 | 37,923 |
| 2009-2010 | 118,782 | 21,693 | 27,682 |
| 2010-2011 | 70,901 | 28,703 | 92,788 |
| 2011-2012 | 63,780 | 22,074 | 46,170 |
| 2012-2013 | 66,748 | 20,707 | 66,703 |
| 2013-2014 | 64,689 | 20,145 | 74,533 |
| 2014/2015 | 63,061 | 19,734 | 71,278 |
| 2015-2016 | 60,489 | 18,611 | 82,458 |
| 2016-2017 | 62,339 | 24,796 | 103,402 |
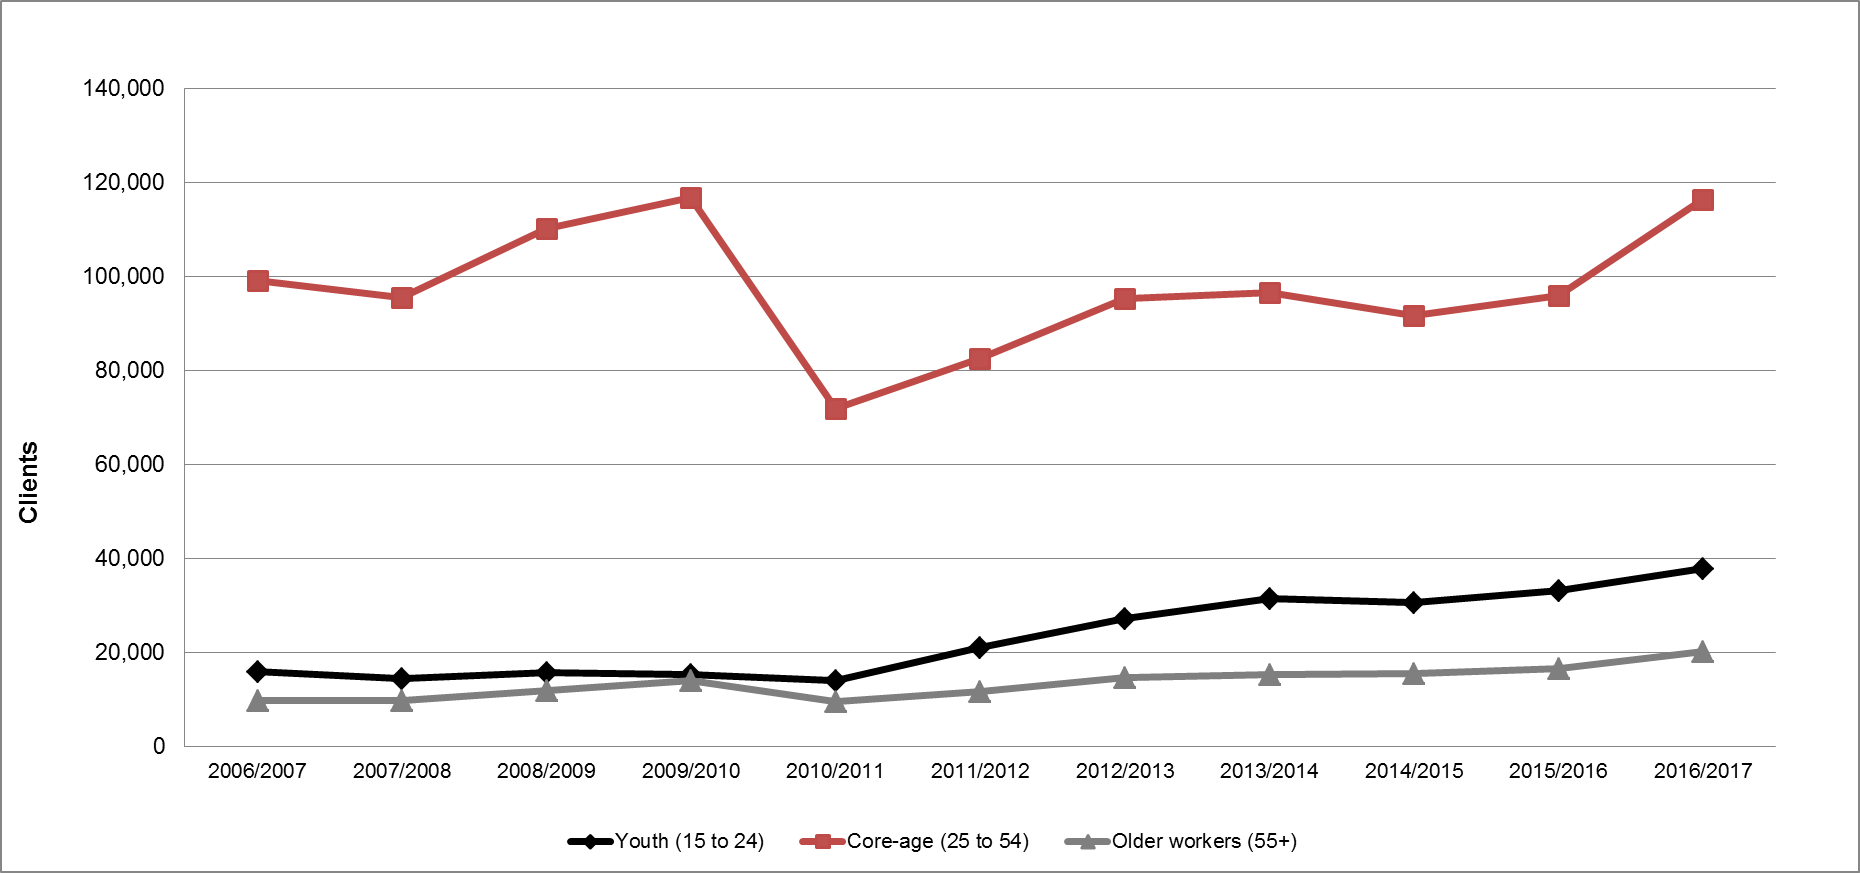
Show Data Table
| Youth (15 to 24) | Core-age (25 to 54) | Older workers (55+) | |
|---|---|---|---|
| 2006-2007 | 16,047 | 99,235 | 9,770 |
| 2007-2008 | 14,519 | 95,493 | 9,972 |
| 2008-2009 | 15,839 | 110,172 | 11,915 |
| 2009-2010 | 15,380 | 116,697 | 14,193 |
| 2010-2011 | 14,227 | 72,003 | 9,623 |
| 2011-2012 | 21,203 | 82,505 | 11,847 |
| 2012-2013 | 27,407 | 95,367 | 14,848 |
| 2013-2014 | 31,648 | 96,636 | 15,477 |
| 2014/2015 | 30,738 | 91,792 | 15,687 |
| 2015-2016 | 33,271 | 95,902 | 16,775 |
| 2016-2017 | 37,909 | 116,420 | 20,205 |
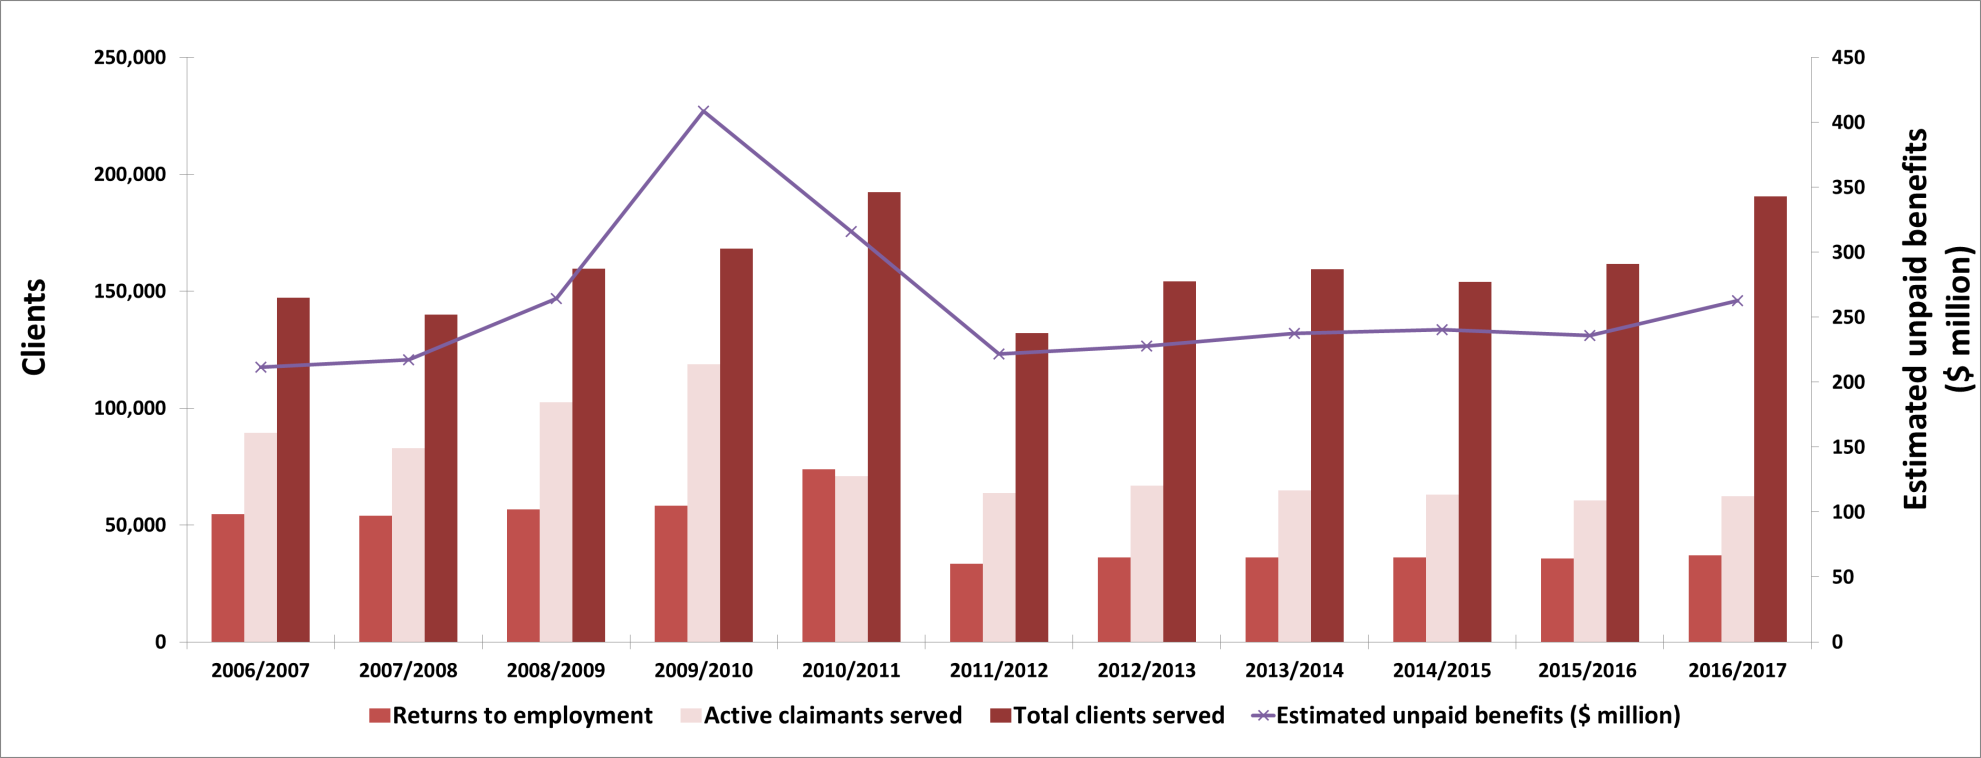
Show Data Table
| Returns to employment | Active claimants served | Total clients served | Estimated unpaid benefits ($ million) | |
|---|---|---|---|---|
| 2006-2007 | 54,541 | 89,353 | 147,295 | $211.40 |
| 2007-2008 | 53,962 | 82,927 | 139,868 | $217.10 |
| 2008-2009 | 56,562 | 102,406 | 159,607 | $264.44 |
| 2009-2010 | 58,333 | 118,782 | 168,157 | $408.52 |
| 2010-2011 | 73,855 | 70,901 | 192,392 | $315.75 |
| 2011-2012 | 33,347 | 63,780 | 132,024 | $221.48 |
| 2012-2013 | 36,111 | 66,748 | 154,158 | $227.71 |
| 2013-2014 | 36,018 | 64,689 | 159,367 | $237.59 |
| 2014/2015 | 36,166 | 63,061 | 154,073 | $240.22 |
| 2015-2016 | 35,625 | 60,489 | 161,558 | $236.05 |
| 2016-2017 | 37,044 | 62,339 | 190,537 | $262.66 |
| Interventions | Year-over-year change | Expenditures ($ 000s) |
||
|---|---|---|---|---|
| Employment Benefits | ||||
| SD-R | Second Career | 6,337 | -21.2% | 165,709 |
| SD-A | Skills Development–Apprenticeship | 16,394 | +1.3% | |
| TWS | Job Placement with Incentive | 2,652 | -0.9% | 2,654 |
| SE | Ontario Self-Employment Benefit | 0 | -100.0% | 39 |
| JCPs | Ontario Job Creation Partnerships | 232 | -4.1% | 2,422 |
| Support Measures | ||||
| EAS | Ontario Employment Assistance Services/ Employment Service | 188,071 | +23.4% | 336,002 |
| LMPs | Ontario Labour Market Partnerships | n/a | n/a | 18,024 |
| R and I | Research and Innovation | n/a | n/a | 95,708 |
Employment Benefits
Employment Benefits interventions contracted to 25,615 in FY1617 (-8.4% year-over-year). Except for SD A (16,394), which grew by 1.3%, all other Employment Benefits types dropped:
- SD-R fell by 21.2% to 6,337 interventions
- TWS fell by 0.9% to 2,652 interventions
- JCP fell by 4.1% to 232 interventions
Ontario Self-Employment Benefit (OSEB) was not delivered in FY1617 following the province's decision to start winding down OSEB in FY1516. As part of Ontario's commitment to integrate employment and training services, Ontario wound-down OSEB, in part, to fund costs of the Canada-Ontario Job Grant. Expenditures for OSEB in FY16-17 represent residual/close-out activities for OSEB clients who began in FY1516. Following the wind-down of OSEB, responsibility for entrepreneurship training was placed with Ontario's Ministry of Economic Development and Growth (MEDG). Funding for MEDG programs are not claimed under the LMDA.
At 88.7%, the combined shares of SD-A and SD-R continued to account for the largest part of Employment Benefits interventions in the province.
Support Measures: EAS
In Ontario, the total number of EAS interventions delivered increased from 152,387 in FY1516 to 188,071 in FY1617, a 23.4% growth. Individual Counselling remained the sole delivered EAS type. The province spent $336.0 million (+19.0 %) for EAS interventions.
Other Support Measures
In FY1617, a significant share of the additional $43.4 million in LMDA funding from Budget 2016, was spent on LMP ($18.0 million; +39.8%) and R&I measures ($95.7 million; +86.5% over FY1516). In February 2016, the Ontario Centre for Workforce Innovation (OCWI) was launched to drive innovation and evidence-based service delivery across the province. Ryerson University is operating the Centre, along with a consortium of partners. The Centre is currently testing new approaches to service delivery within the Employment Ontario network.
As part of new strategies and approaches developed by the province in the use of R&I, Ontario is also investing in the Ontario Human Capital Research and Innovation Fund (OHCRIF). The objective of the OHCRIF is to support research and innovation projects that identify better ways to help people prepare for, return to, or keep employment and become productive participants in the labour force. In FY1617, MAESD released a Call for Proposals for projects related to the following research priorities: skills and return on investment, postsecondary education (PSE), and training policies, as well as labour market programs, policy and service delivery. One project funded looked at the labour market outcomes of cooperative education programs.
Apprenticeship in-class training produces first female Sprinkler and Fire Protection Installer journeyperson.
In anticipation of the trade becoming compulsory in February 2017, there was an increase in registrations for in-class training. There were enough classes to support the increased enrolment and the continued growth of the trade. One of the people that benefitted from the in-class training was Kathryn. Thanks to her in-class training, she was well prepared to write her certificate of qualification and was successful on her first attempt. Kathryn became the first woman ever in Ontario to become licensed in the 427A - Sprinkler and Fire Protection Installer trade. She was celebrated by her fellow classmates and has become an inspiration for other women in the trades.
2.8 Manitoba
Manitoba's real GDP growth in 2016 was 2.2%, which surpassed the national average growth of 1.4% for a second consecutive year. This was supported by household spending and construction. Real GDP growth in 2017 is expected to follow similar trends, backed by a strong rebound in housing starts and manufacturing activity. The province's economic growth is projected to approach 2.0% in 2018.
After a slow start, labour market conditions improved in Manitoba near the end of FY1617. The province's employment level remained relatively unchanged between FY1516 and FY1617, as losses incurred in 2016 were counterbalanced by a strong start in 2017. Gains in goods-producing industries (+3,800; +2.6%) were partially offset by losses in the services-producing sector (-3,500; -0.7%). The largest gains were recorded in finance, insurance, real estate, rental and leasing (+3,000; +9.4%); and in professional, scientific and technical services (+1,800; +6.8%). The number of unemployed increased by 2,400 (+6.3%), raising the province's unemployment rate to 6.1%, its highest level since FY9798.
Manitoba: EBSM key facts
| EI clients | Non-insured clients |
|---|---|
| 12,952 |
12,963 |
| Interventions type | 2016-2017 | Year-over-year change |
|---|---|---|
| Employment Benefits | 6,473 | 0.5% |
| Support Measures: EAS | 51,870 | 3.2% |
| Interventions type | 2016-2017 | Year-over-year change (pp) |
|---|---|---|
| Employment Benefits | 11.1% | 0.4 |
| Support Measures: EAS | 88.9% | 0.4 |
| Total expenditures | 2016-2017 ($ million) | Year-over-year change |
|---|---|---|
| Employment Benefits | $28.3 | 2.8% |
| Support Measures: EAS | $11.6 | 45.5% |
| LMPs and R&I | $6.4 | 16.4% |
| Total expenditures1 | $46.2 | 7.3% |
| 2015-2016 | 2016-2017 | Year-over-year change |
|---|---|---|
| $44.14 | $46.59 | 5.6% |
- 1 Totals may not add up due to rounding; does not include accounting adjustments.
To maintain a stable economic and labour market growth environment, Manitoba's priority is to address the small pool of work-ready individuals seeking employment. To do so, the province will continue to focus on supporting its young and growing population to acquire skills that are responsive to employers' needs, and on increasing the participation of those further removed from suitable employment such as Indigenous peoples, persons with disabilities, recent newcomers, and those at risk of long-term social assistance dependence.
Managing for results
In the summer of 2016, the Government of Manitoba hosted stakeholder consultations on labour market training, as part of the pan-Canadian consultations led by the Forum of Labour Market Ministers. The purpose was to gather information from a broad range of stakeholders, to ensure Manitoba's employment and training programs continue to be relevant and responsive to current and future labour market needs and priorities. Feedback included the need for: greater flexibility in program eligibility; recognition of the unique needs of Manitoba's diverse workforce; prioritizing investments in essential skills training for Indigenous peoples; improved coordination across and within sectors to make programming more responsive and effective; and timely, reliable, and easily accessible labour market information (LMI). The consultations helped identify ways to improve labour market programming in Manitoba and inform future investments.
Clients, interventions and expenditures
In Manitoba, the number of clients served in FY1617 declined for a second consecutive year, dropping by 5.7% to 25,915. All client types decreased year-over-year, with,
- Active claimants declining by 1.9%from 10,132 to 9,941;
- Former claimants decreasing 8.5% from 3,292 to 3,011; and
- Non-insured clients dropping 7.8% from 14,056 to 12,963.
With respect to their distribution, the share of active claimants (38.4%) increased by 1.5 percentage points year-over-year, whereas the share of former claimants (11.6%) dropped by 0.4 percentage points, and non-insured clients (50.0%) decreased by 1.1 percentage points, respectively.
Manitoba delivered 6,473 interventions in FY1617, a 0.5% increase from the 6,443 interventions delivered in FY1516. While Employment Benefits accounted for a growing part of the total EBMS-similar interventions (11.1%), the number of claimants employed after following program participation dropped by 5.6% year-over-year, to 6,565 claimants. Additionally, unpaid benefits amounted to $46.59 million, a 5.6% increase year-over-year. The province spent $46.2 million (+7.3%) for EBSM expenditures in FY1617, including $3.4 million of the $125 million in additional funding for the LMDA announced in Budget 2016.
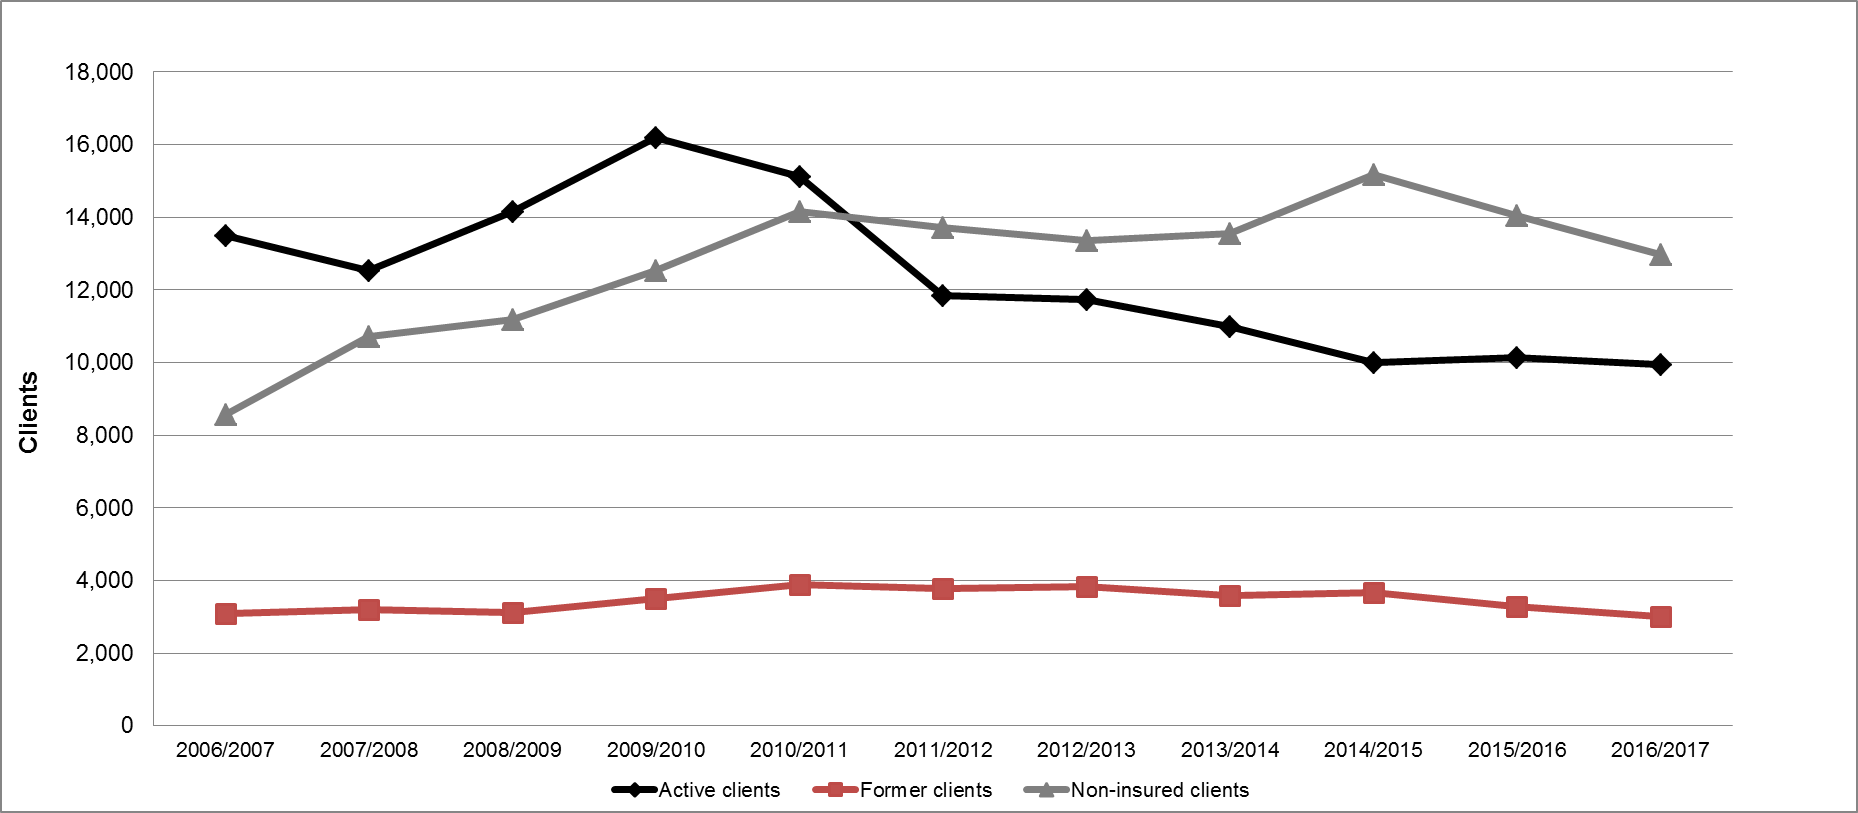
Show Data Table
| Active clients | Former clients | Non-insured clients | |
|---|---|---|---|
| 2006-2007 | 13,489 | 3,084 | 8,567 |
| 2007-2008 | 12,523 | 3,190 | 10,707 |
| 2008-2009 | 14,171 | 3,129 | 11,180 |
| 2009-2010 | 16,204 | 3,496 | 12,546 |
| 2010-2011 | 15,110 | 3,875 | 14,153 |
| 2011-2012 | 11,834 | 3,775 | 13,704 |
| 2012-2013 | 11,744 | 3,844 | 13,369 |
| 2013-2014 | 10,988 | 3,579 | 13,540 |
| 2014/2015 | 9,996 | 3,672 | 15,174 |
| 2015-2016 | 10,132 | 3,292 | 14,056 |
| 2016-2017 | 9,942.0 | 3,011.0 | 12,964.0 |
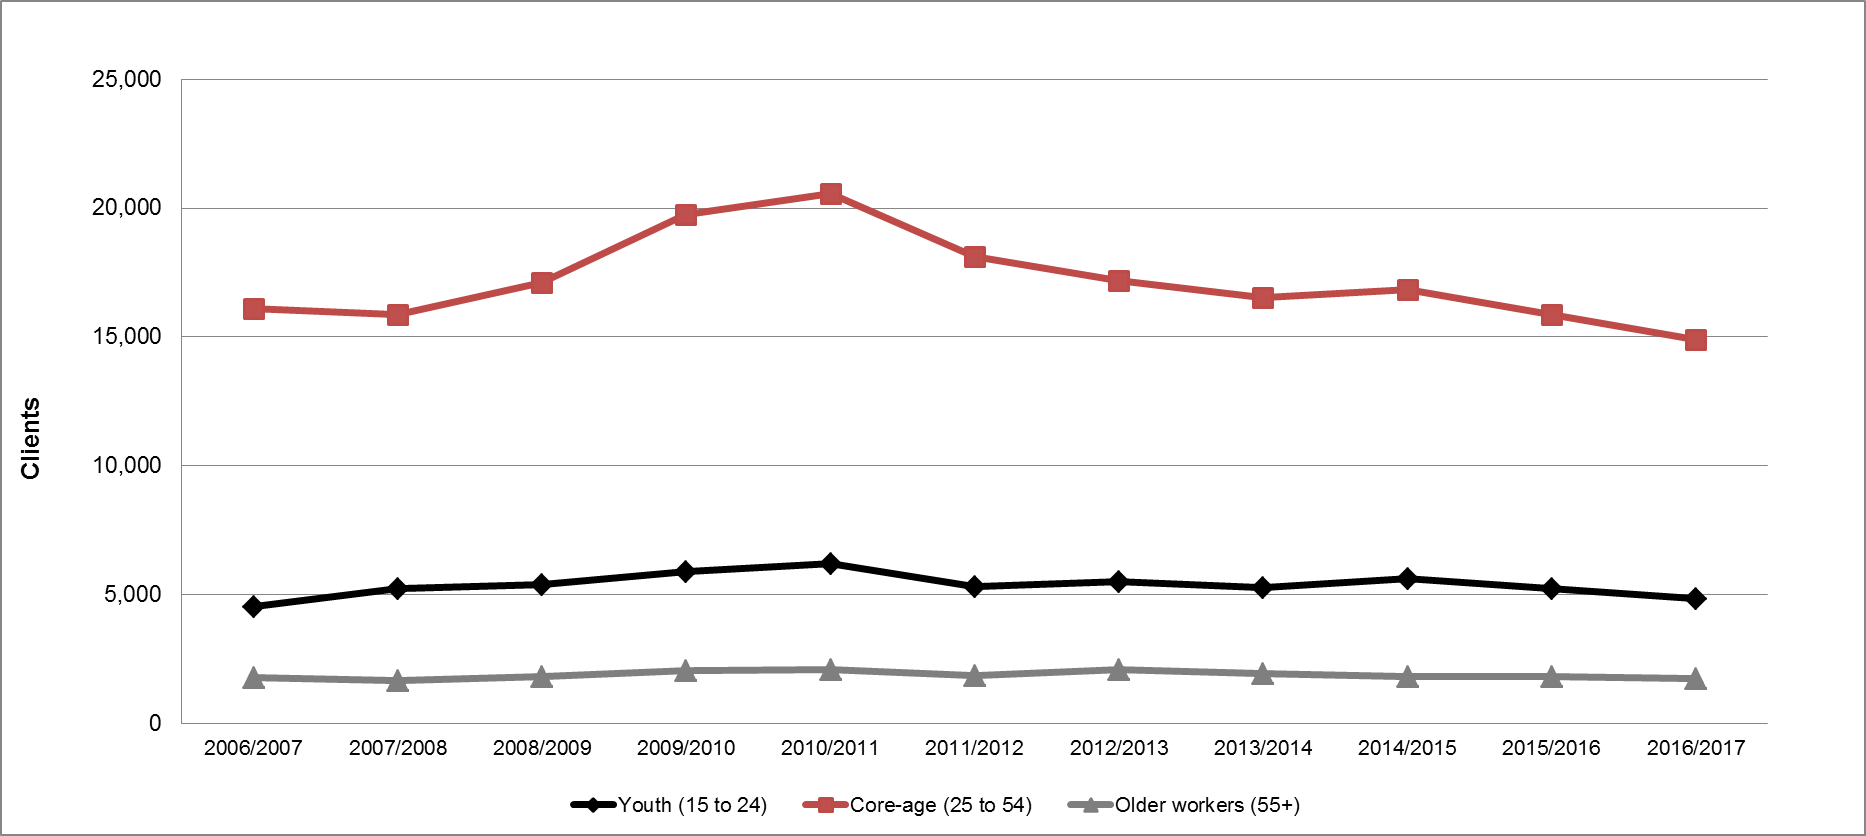
Show Data Table
| Youth (15 to 24) | Core-age (25 to 54) | Older workers (55+) | |
|---|---|---|---|
| 2006-2007 | 4,552 | 16,115 | 1,770 |
| 2007-2008 | 5,237 | 15,879 | 1,678 |
| 2008-2009 | 5,377 | 17,101 | 1,826 |
| 2009-2010 | 5,899 | 19,760 | 2,065 |
| 2010-2011 | 6,219 | 20,562 | 2,092 |
| 2011-2012 | 5,320 | 18,122 | 1,862 |
| 2012-2013 | 5,491 | 17,206 | 2,098 |
| 2013-2014 | 5,264 | 16,519 | 1,943 |
| 2014/2015 | 5,632 | 16,828 | 1,830 |
| 2015-2016 | 5,217 | 15,885 | 1,798 |
| 2016-2017 | 4,852.0 | 14,901.0 | 1,727.0 |
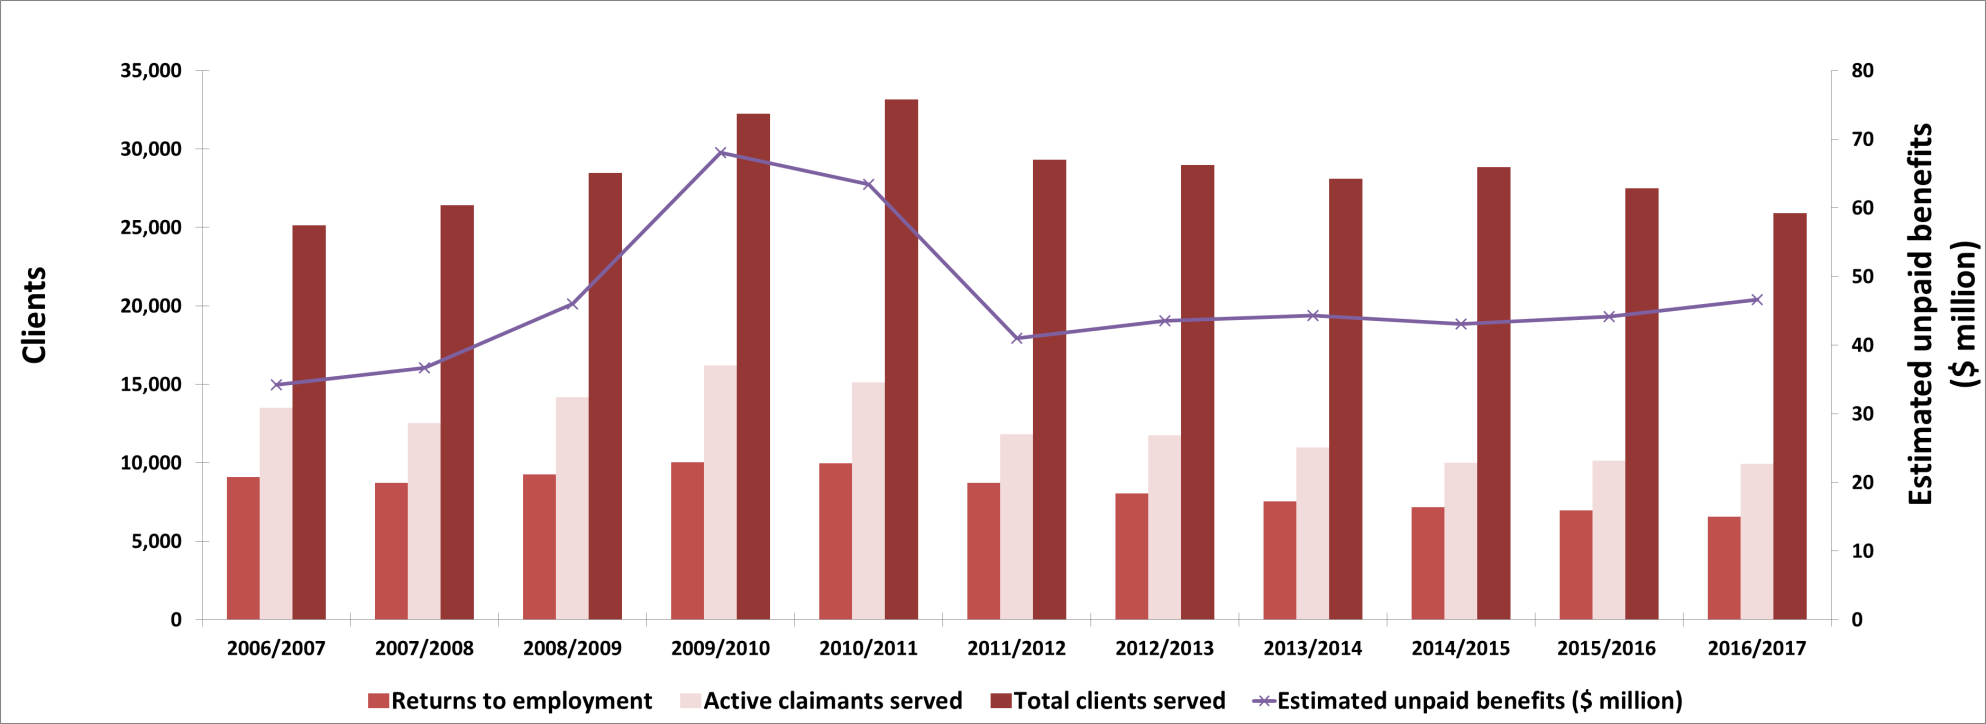
Show Data Table
| Returns to employment | Active claimants served | Total clients served | Estimated unpaid benefits ($ million) | |
|---|---|---|---|---|
| 2006-2007 | 9,083 | 13,489 | 25,140 | $34.20 |
| 2007-2008 | 8,715 | 12,523 | 26,420 | $36.70 |
| 2008-2009 | 9,256 | 14,171 | 28,480 | $46.00 |
| 2009-2010 | 10,043 | 16,204 | 32,246 | $68.03 |
| 2010-2011 | 9,950 | 15,110 | 33,138 | $63.38 |
| 2011-2012 | 8,714 | 11,834 | 29,313 | $40.97 |
| 2012-2013 | 8,056 | 11,744 | 28,957 | $43.51 |
| 2013-2014 | 7,526 | 10,988 | 28,107 | $44.28 |
| 2014/2015 | 7,156 | 9,996 | 28,842 | $43.09 |
| 2015-2016 | 6,957 | 10,132 | 27,480 | $44.14 |
| 2016-2017 | 6,565 | 9,942 | 25,917 | $46.59 |
| Interventions | Year-over-year change |
Expenditures ($ 000s) |
||
|---|---|---|---|---|
| Employment Benefits | ||||
| SD-R | Skills Development | 2,043 | +1.6% | 26,020 |
| SD-A | Skills Development-Apprenticeship | 4,166 | +2.0% | |
| TWS | Wage Subsidies | 30 | -67.7% | 173 |
| SE | Self-Employment | 131 | -15.5% | 1,073 |
| JCPs | Employment Partnerships | 103 | +2.0% | 999 |
| Support Measures | ||||
| EAS | Employment Assistance Services | 51,870 | -3.2% | 11,618 |
| LMPs | Labour Market Partnerships | n/a | n/a | 5,247 |
| R&I | Research and Innovation | n/a | n/a | 1,117 |
Employment Benefits
Overall, Employment Benefits edged up by 0.5%, to 6,473 interventions. This is primarily a result of increases in,
- JCP by 2.0%, to 103 interventions;
- SD-R by 1.6%, to 2,043 interventions; and
- SD-A by 2.0%, to 4,166 interventions.
Offsetting this growth, however, were contractions in the following programs:
- TWS by 67.7%, to 30 interventions; and
- SE by 15.5% to 131 interventions.
At 64.4%, SD-A had the largest share of all delivered Employment Benefits interventions, followed by SD-R (31.6%). Total expenditures for Employment Benefits reached $28.3 million (+2.8%). Increased funding under Budget 2016 towards SD supported Manitobans living in rural and remote regions of the province.
Skills Development financial assistance helps Lori upskill and secure a full-time job
Lori is a single parent who could only find seasonal employment or part-time minimum wage positions, with little opportunity for advancement. Lori had an interest in the correctional service sector, so she applied to a correctional officer training program and was accepted. She received EI Part 1 and EI Part 2 benefits (living allowance, lodging, and transportation) while she attended training. Lori successfully completed the program and found work as a full-time Correctional Officer. She is very happy in her new career and is grateful for the support she received that enabled her to get there.
Support Measures: EAS
For a second consecutive year, EAS interventions in Manitoba shrank by 3.2%, reaching 51,870 in FY1617. Compared to the previous year, Employment Service dropped by 7.7%, from 35,429 to 32,685 interventions; while Individual Counselling grew by 5.8% from 18,137 to 19,185 interventions. Employment Service accounted for 63.0% of shares of all EAS interventions. Total expenditures for EAS increased for a third consecutive year, by 45.5% to $11.6 million in FY1617.
Other Support Measures: LMPs and R&I
The province's total funding for LMPs and R&I fell from $7.6 million in FY1516, to $6.4 million in FY1617. This represented a 16.4% year-over-year decrease. While LMPs funding jumped by 58.1% to $5.2 million, that of R&I went down by 74.0% to $1.1 million. Additional funding for LMPs facilitated labour adjustment activity resulting from business closures. Manitoba used R&I to support research of employment and training programs that directly advanced service delivery improvements. Findings from two initiatives, Manitoba Works! Co-operative Workplace Experience Program Evaluation and Motivational Interviewing Evaluation, both demonstrated that social assistance usage decreased significantly among program participants compared to non-participants.
2.9 Saskatchewan
Saskatchewan's real GDP contracted for a second consecutive year in 2016, by 0.5%. The province's real GDP is expected to increase in 2017 by close to 2.0%, during which improved oil output will likely offset a decline in agriculture.
Weak labour market conditions prevailed in Saskatchewan in FY1617. In FY1617, employment fell by 4,400 (-0.8%), all in full-time positions compared to FY1516. The unemployment rate increased by a full percentage point to 6.4%; the province's highest level since FY9596. Saskatchewan's employment drop in the goods-producing sector (-7,200; -4.6%), mostly in construction (-5,000; -9.0%), was partially offset by a gain in the services-producing sector (+2,800; +0.7%), led by the wholesale and retail trade industry (+5,200; +6.1%) and professional, scientific and technical services (+3,900; or +15.0%). Employment declined for both men and women, but increased for the off-reserve First Nation and Metis population (+2,200; or +5.0%) to a record of 46,300. The province's weak labour market conditions are expected to slightly improve in FY1718.
Saskatchewan: EBSM key facts
| EI clients | Non-insured clients |
|---|---|
| 14,284 |
1,040 |
| Interventions type | 2016-2017 | Year-over-year change |
|---|---|---|
| Employment Benefits | 6,777 | 13.6% |
| Support Measures: EAS | 13,341 | 8.7% |
| Interventions type | 2016-2017 | Year-over-year change (pp) |
|---|---|---|
| Employment Benefits | 33.7% | 5.3 |
| Support Measures: EAS | 66.3% | 5.3 |
| Total expenditures | 2016-2017 ($ million) | Year-over-year change |
|---|---|---|
| Employment Benefits | $31.6 | 10.2% |
| Support Measures: EAS | $4.3 | 7.7% |
| LMPs and R&I | $1.6 | 36.7% |
| Total expenditures1 | $37.6 | 6.6% |
| 2015-2016 | 2016-2017 | Year-over-year change |
|---|---|---|
| $61.55 | $74.73 | 21.4% |
- 1 Totals may not add up due to rounding; does not include accounting adjustments.
Despite a period of softer labour market demand, Saskatchewan still faced challenges in ensuring an adequate supply of skilled workers for employers who experienced labour shortages. Continued population growth will help grow the available pool of workers for when economic recovery takes hold. The province's labour market development priorities will focus primarily on upskilling existing workers, and increasing the workforce participation and skills development of Saskatchewan residents, with a particular focus on under-represented groups, such as Indigenous peoples, persons with disabilities, youth, older workers and newcomers. Priorities set out in the Ministry's labour market development strategy address these challenges and opportunities by, among other, improving access programs and services in youth, and First Nations and Métis workers, and increasing utilization of the Employability Assistance Program for Persons with Disabilities.
Managing for results
Saskatchewan conducted a citizen-centred service review to evaluate the effectiveness of a selection of programs and services that assist employers. The evaluation included an employer survey to gather information about satisfaction with programs and services, to better understand opportunities that support employers through labour market programming. In addition, an online public opinion poll was conducted to understand employer usage of various programs, and preferred methods of recruitment. Consultations were conducted in collaboration with the Chambers of Commerce, industry associations, and post-secondary education institutions. Additionally, staff who managed the programs were interviewed about service standards, uptake and other relevant data. The evaluation has informed program and policy changes, and is being to develop an employer engagement framework. A follow-up survey will be conducted to measure employer satisfaction with program and policy changes.
Clients, interventions and expenditures
In FY1617, Saskatchewan served 15,324 (+3.3%) clients. All three client-types contributed to this growth:
- Active claimants rose by 1.6% to 11,542;
- Former claimants rose by 2.8% to 2,742; and
- Non-insured clients rose by 30.2% to 1,040.
The share of active claimants (75.3%) among all clients served slowed down slightly by 1.3 percentage points, while shares of former claimants (17.9%) regressed slightly, by 0.1 percentage points. On the other hand, non-insured clients' share advanced by 1.4 percentage points, reaching 6.8% of all client types.
The total number of interventions delivered in Saskatchewan remained stable at 20,118. The share of Employment Benefits accounted for 33.7% of all interventions, while the proportion of services totalled 66.3%. Unpaid benefits jumped by 21.4% to $74.73 million. The province spent $37.6 million (+6.6%) for total EBSM-similar programming, including $2.6 million in additional LMDA funding from Budget 2016. Saskatchewan used the additional investment to increase the capacity of existing programs and services targeted toward individuals impacted by the slowdown in the economy.
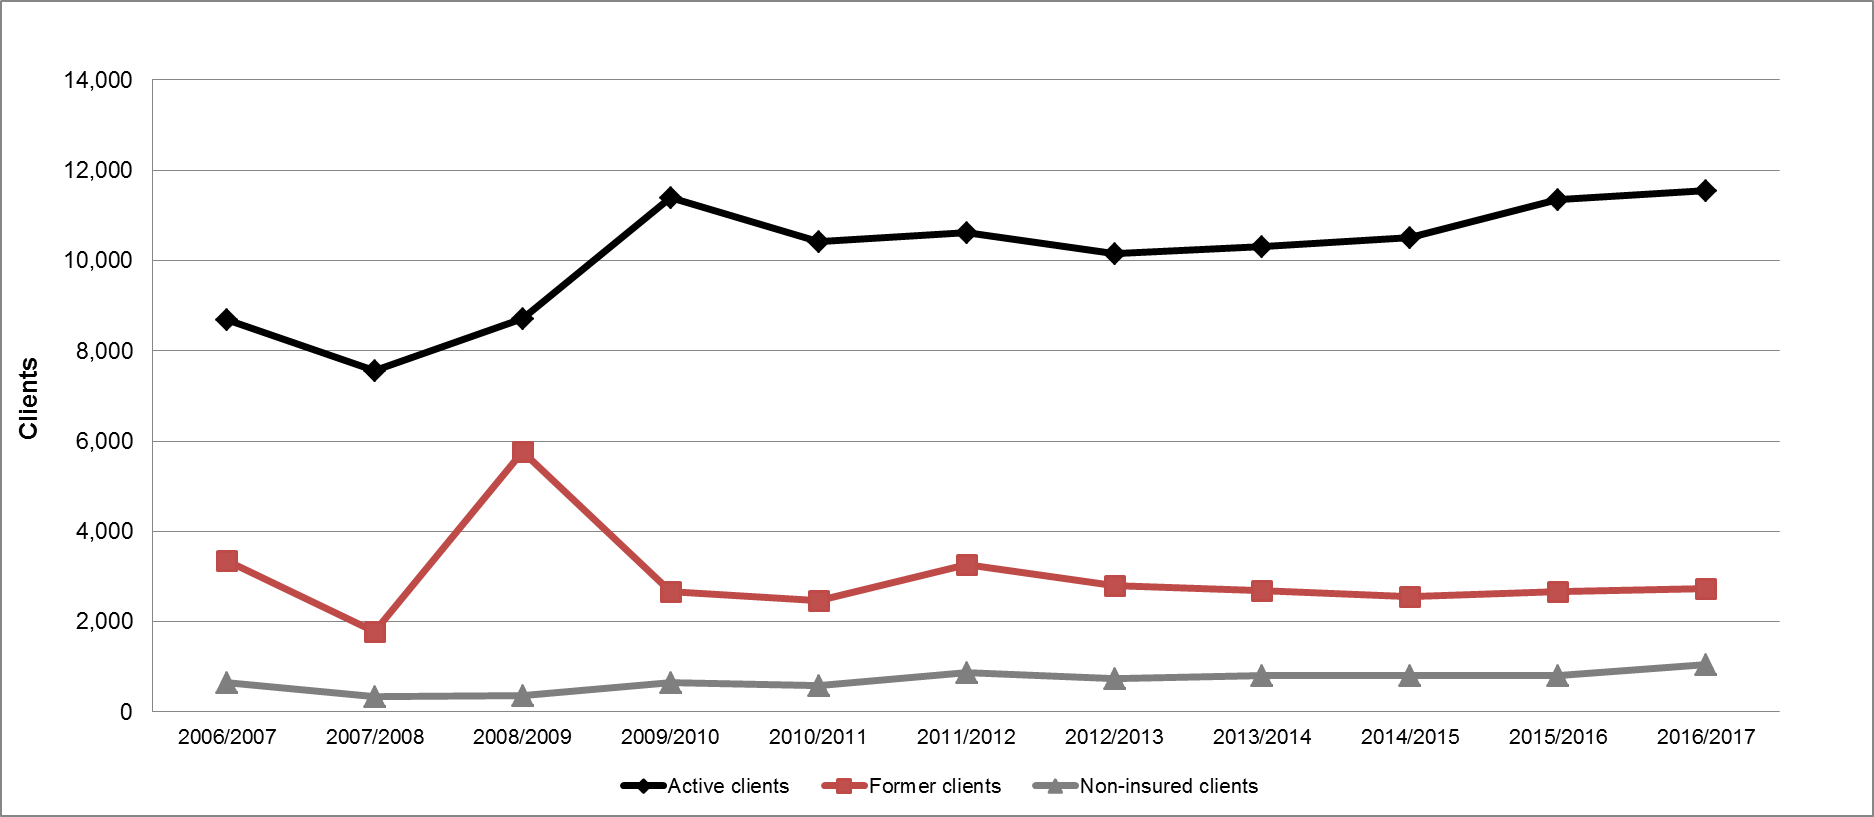
Show Data Table
| Active clients | Former clients | Non-insured clients | |
|---|---|---|---|
| 2006-2007 | 8,699 | 3,345 | 651 |
| 2007-2008 | 7,556 | 1,773 | 338 |
| 2008-2009 | 8,724 | 5,773 | 351 |
| 2009-2010 | 11,406 | 2,663 | 640 |
| 2010-2011 | 10,414 | 2,471 | 577 |
| 2011-2012 | 10,624 | 3,268 | 870 |
| 2012-2013 | 10,161 | 2,788 | 748 |
| 2013-2014 | 10,308 | 2,687 | 798 |
| 2014/2015 | 10,503 | 2,565 | 813 |
| 2015-2016 | 11,362 | 2,667 | 799 |
| 2016-2017 | 11,543 | 2,743 | 1,040 |
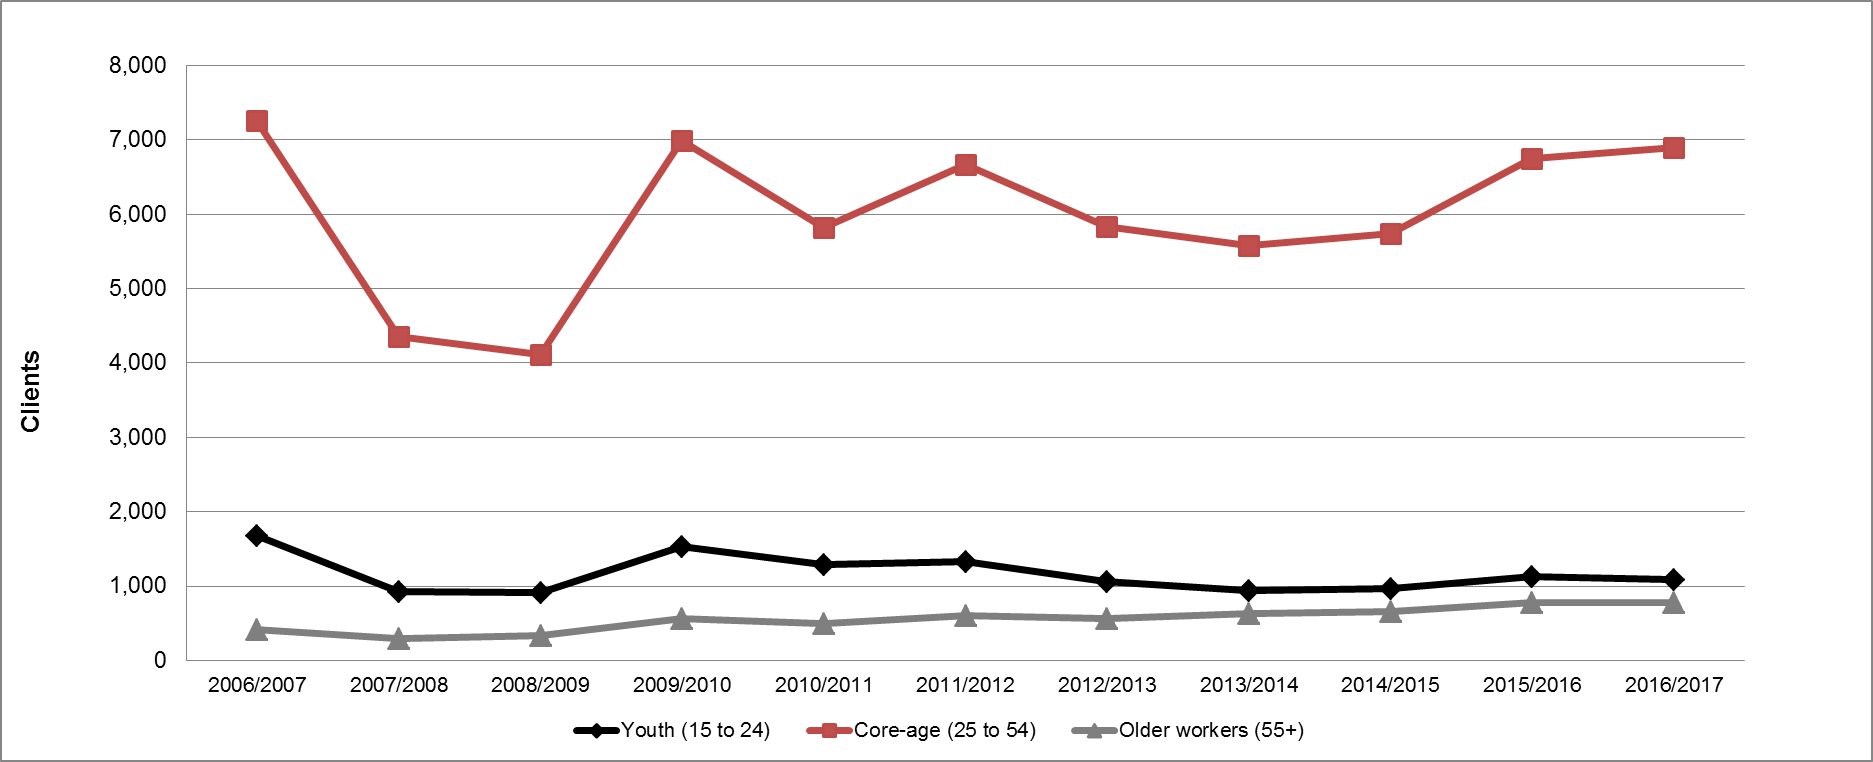
Show Data Table
| Youth (15 to 24) | Core-age (25 to 54) | Older workers (55+) | |
|---|---|---|---|
| 2006-2007 | 1,675 | 7,265 | 415 |
| 2007-2008 | 933 | 4,350 | 289 |
| 2008-2009 | 913 | 4,113 | 339 |
| 2009-2010 | 1,530 | 6,987 | 557 |
| 2010-2011 | 1,287 | 5,816 | 502 |
| 2011-2012 | 1,329 | 6,664 | 605 |
| 2012-2013 | 1,058 | 5,835 | 562 |
| 2013-2014 | 946 | 5,574 | 627 |
| 2014/2015 | 968 | 5,743 | 657 |
| 2015-2016 | 1,124 | 6,755 | 772 |
| 2016-2017 | 1,085 | 6,892 | 775 |
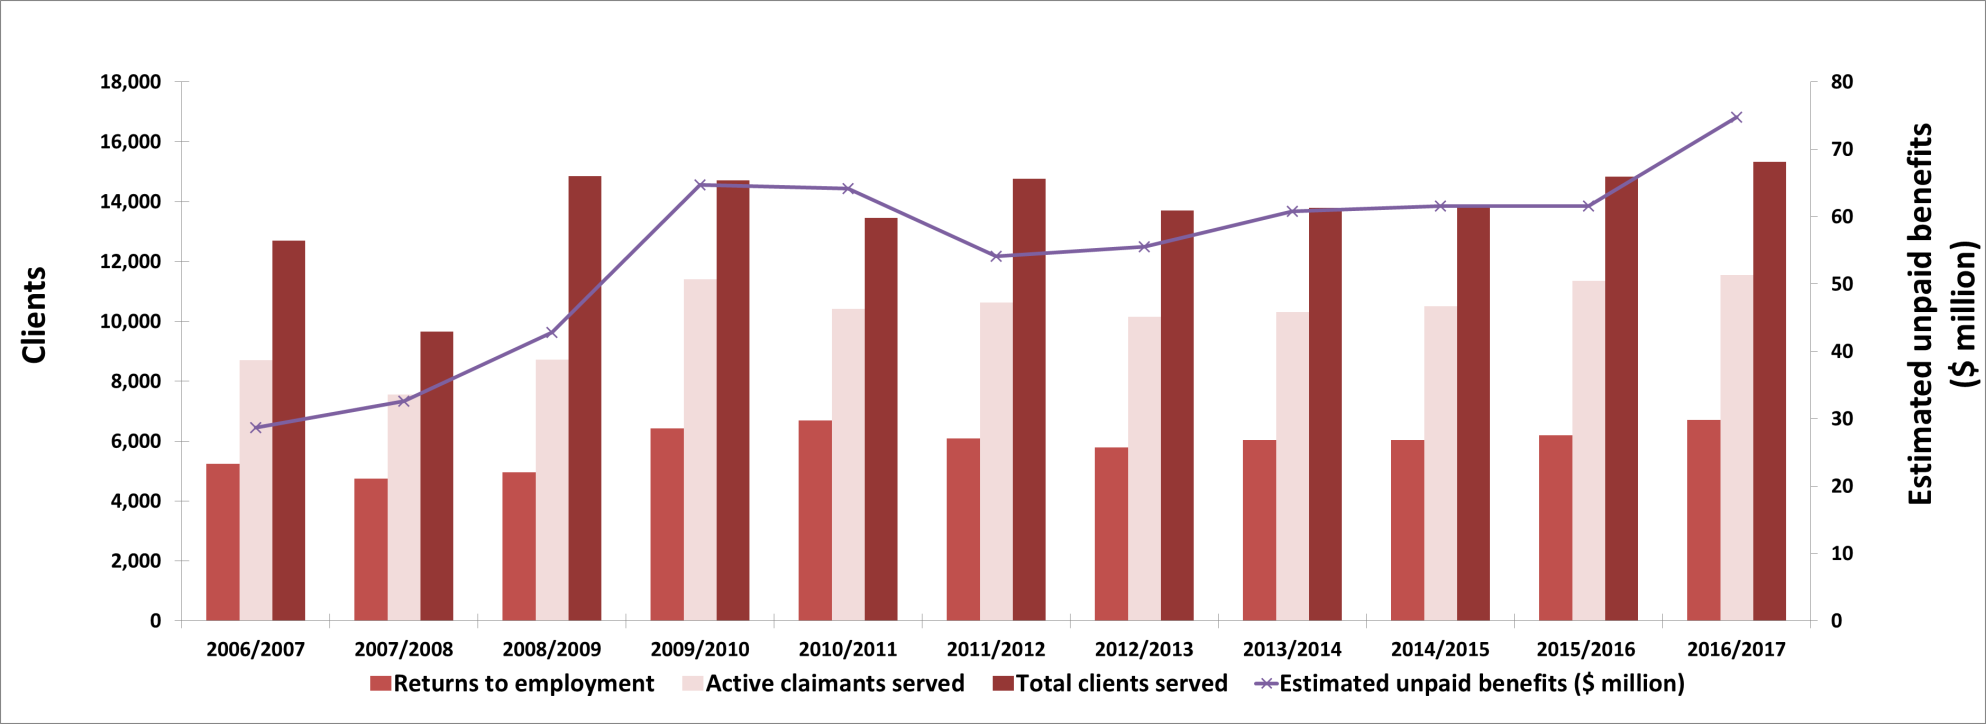
Show Data Table
| Returns to employment | Active claimants served | Total clients served | Estimated unpaid benefits ($ million) | |
|---|---|---|---|---|
| 2006-2007 | 5,244 | 8,699 | 12,695 | $28.70 |
| 2007-2008 | 4,754 | 7,556 | 9,667 | $32.60 |
| 2008-2009 | 4,956 | 8,724 | 14,848 | $42.80 |
| 2009-2010 | 6,432 | 11,406 | 14,709 | $64.70 |
| 2010-2011 | 6,692 | 10,414 | 13,462 | $64.15 |
| 2011-2012 | 6,083 | 10,624 | 14,762 | $54.13 |
| 2012-2013 | 5,784 | 10,161 | 13,697 | $55.56 |
| 2013-2014 | 6,038 | 10,308 | 13,793 | $60.81 |
| 2014/2015 | 6,038 | 10,503 | 13,881 | $61.60 |
| 2015-2016 | 6,204 | 11,362 | 14,828 | $61.55 |
| 2016-2017 | 6,716 | 11,543 | 15,326 | $74.73 |
| Interventions | Year-over-year change | Expenditures ($ 000s) |
||
|---|---|---|---|---|
| Employment Benefits | ||||
| SD-R | Skills Training Benefit Provincial Training Allowance | 358 | -67.7% | 31,375 |
| SD-A | Apprenticeship Training | 6,344 | -4.7% | |
| TWS | Skills Training Allocation | - | N/A | - |
| SE | Self-Employment Program | 75 | -8.5% | 263 |
| JCPs | Employment Programs | - | n/a | - |
| Support Measures | ||||
| EAS | Workforce Development | 13,341 | +8.7% | 4,333 |
| LMPs | Regional and Sectoral Partnerships | n/a | n/a | 1,219 |
| R and I | Research and Innovation | n/a | n/a | 362 |
Employment Benefits
In FY1617, a total of 6,777 (-13.6%) Employment Benefits interventions were registered in Saskatchewan. All Employment Benefits types declined:
- SE decreased by 8.5% to 75 interventions;
- SD-A, which accounted for 93.6% of employment benefits, decreased by 4.7% to 6,344 interventions; while
- SD-R decreased by 67.7% to 358 interventions.
Total expenditures for Employment Benefits increased for a third consecutive year, totalling $31.6 million (+10.2%) in FY1617.
James' journey to becoming an apprentice
James is a 26-year-old First Nations man from Birch Narrows First Nation. At the age of 22, he completed his Adult Basic Education Level 4, through Northlands College's Buffalo Narrows Campus. Following completion of the program, he had no success in finding employment. Then, he heard about the Northern Career Quest Mining Project, a training program that leads to long-term employment in the resource-based sector. He was one of 30 applicants flown into McClean Lake to be interviewed by mining personnel, and he was accepted into the program. After successfully completing the four-month training program at the McClean Lake uranium mine, he was employed with the company for two years before deciding to pursue journeyperson status as a power engineer. The uranium company indentured him, supported his apprenticeship tuition, and continues to apprentice him on the job.
Support Measures (EAS)
In FY1617, Saskatchewan delivered 13,341 EAS interventions, an 8.7% increase compared to FY1516. Saskatchewan spent a total of $4.3 million (+7.7%) for EAS, and all EAS intervention types increased,
- Group Services increased by 371.6% to 731 interventions
- Employment Service increased by 7.9% to 6,367 interventions
- Individual Counselling increased by 0.5% to 6,243 interventions
Saskatchewan's LMDA-funded Rapid Response teams provided services for employers and workers faced with production slow-downs and/or layoffs, due to the decline in the resource-based, and energy sectors. Rapid Response teams include federal and provincial representatives to inform employers about provincial and federal programs and services, such as Employment Insurance. Services can include information sessions for workers, job fairs, re-employment and re-training options, immigration issues related to unemployment, as well as Employment Insurance and the Work Sharing program.
Other Support Measures: LMPs and R&I
For a third consecutive year, total LMPs and R&I funding declined, reaching $1.6 million (-36.7%) in FY1617. While LMPs funding ($1.2 million) fell slightly by 1.5%, that of R&I ($362,000) dropped considerably by 71.3%. The province is developing a Common Client Tool (CCT), to support clients navigate government programs in a more client-centred way.
2.10 Alberta
Alberta's economy contracted for a second consecutive year in 2016. Real GDP declined by 3.7%, due to ongoing low oil prices and forest fires in northern Alberta. Despite the slower than anticipated oil price recovery, real GDP growth bounced back solidly in 2017, with an estimated growth rate surpassing 4.0%. This growth rate is the highest among Canadian provinces, thanks to the strong increase in oil sands production and exports, as well as gains in manufacturing, retail sales and residential construction. Real GDP growth is forecasted to moderate in 2018, to fall below 3.0%. This still remains ahead of the projected national average growth of about 2.2%.
Alberta: EBSM key facts
| EI clients | Non-insured clients |
|---|---|
| 63,807 |
54,258 |
| Interventions type | 2016-2017 | Year-over-year change |
|---|---|---|
| Employment Benefits | 23,946 | 6.2% |
| Support Measures: EAS | 191,515 | 11.9% |
| Interventions type | 2016-2017 | Year-over-year change (pp) |
|---|---|---|
| Employment Benefits | 11.1% | 0.6 |
| Support Measures: EAS | 88.9% | 0.6 |
| Total expenditures | 2016-2017 ($ million) | Year-over-year change |
|---|---|---|
| Employment Benefits | $75.1 | 12.7% |
| Support Measures: EAS | $42.7 | 89.6% |
| LMPs and R&I | $3.4 | 293.5% |
| Total expenditures1 | $121.2 | 10.7% |
| 2015-2016 | 2016-2017 | Year-over-year change |
|---|---|---|
| $267.88 | $384.91 | 43.7% |
- 1 Totals may not add up due to rounding; does not include accounting adjustments.
Reflecting the province's economic turbulences, Alberta's labour market conditions significantly deteriorated in FY1617. During that period, the province's employment level declined by 1.4% to 2,263,300. While losses occurred mainly in full-time employment (-61,100; -3.2%), part-time employment rose by 28,600 (+7.2%). Gains in the services-producing sector (+26,700; +1.6%), led by educational services (+10,000; +7.0%) and trade (+6,800; +2.1%) were more than offset by losses in all goods-producing industries (-59,200; -9.4%), with notable declines in manufacturing (-22,300; -16.6%); forestry, fishing, mining, oil and gas (-17,100; -11.0%); and, construction (-11,200; -4.3%). The unemployment rate rose for a fourth consecutive year to 8.4%, the highest since FY9495, as the number of unemployed workers increased by 42,800 (+26.2%). Aligned with the evolution of the overall economy, employment growth in Alberta resumed in the second half of 2016, and is projected to post a gain between FY1617 and FY1718.
Despite the increase in the number of job seekers in FY1617, due to ongoing depressed oil prices, Alberta's employers continued to post thousands of job vacancies. To better respond to rapid changes in the labour market, the province increased services to the recently unemployed, connecting job seekers with employers and employment opportunities. In previous years, Alberta focused more on developing targeted services to support Albertans with barriers to fully participate in the labour market. In FY1617, the province adjusted its LMDA investments to better meet the continuum of client and employer needs for a skilled workforce. In addition to continuing to support active training programs, Alberta increased investments in self-employment, to serve the growing number of unemployed Albertans interested in self-employment as a viable employment option. Alberta also increased investments in LMPs to identify, develop and support projects with stakeholders that share common labour market needs. Alberta also saw increased demand for foundational learning to allow unemployed Albertans the opportunity to gain the necessary competences to find and maintain employment and/or enhance their skills by participating in further post-secondary education.
Managing for results
To better support rural communities, Alberta improved its delivery model for Employment Assistance Services. Key communication channels were created, including social media, videoconference, and web, helping provide rural and small communities in Alberta with access to labour market information. The province worked collaboratively with rural communities, to foster solutions for the unemployed.
Alberta's program priorities and designs also depend on joint agreements with employers and other stakeholders. This ensures that training and employment services meet the needs of local labour markets. Engagement and cooperation between employers and service providers is essential to delivering well-matched training for in-demand occupations and connecting Albertans with employment opportunities. Furthermore, the province improved its suite of Training for Work program policies, to better respond to the needs of those impacted by the recession.
Clients, interventions and expenditures
In Alberta, a total of 118,065 clients were served in FY1617, a year-over-year decline of 7.8%. The number of claimants in all three EBSM client types decreased:
- active clients dropped 3.8% to 49,720,
- former clients fell 13.1% to 14,087, and
- non-insured clients shrank 9.9% to 54,258.
While, the share of active claimants rose by 1.7 percentage points to 42.1%, shares of former (11.9%) and non-insured claimants (46.0%) diminished, by 0.7 and 1.0 percentage points, respectively.
The province provided 215,461 EBSM interventions in FY1617, a decrease of 11.3% year-over-year. The share of Employment Benefits grew for a sixth consecutive year, reaching 11.1% of all interventions in FY1617, while shares in EAS contracted to 88.9%. In total, 29,671 clients (+11.9%) returned to employment after participating in an EBSM-similar intervention. Unpaid benefits jumped significantly from $267.88 million in FY1516 to $384.91 million in FY1617, a 43.7% year-over-year increase. Total expenditures increased for a second consecutive year, reaching $121.2 million (+10.7%) in FY1617.
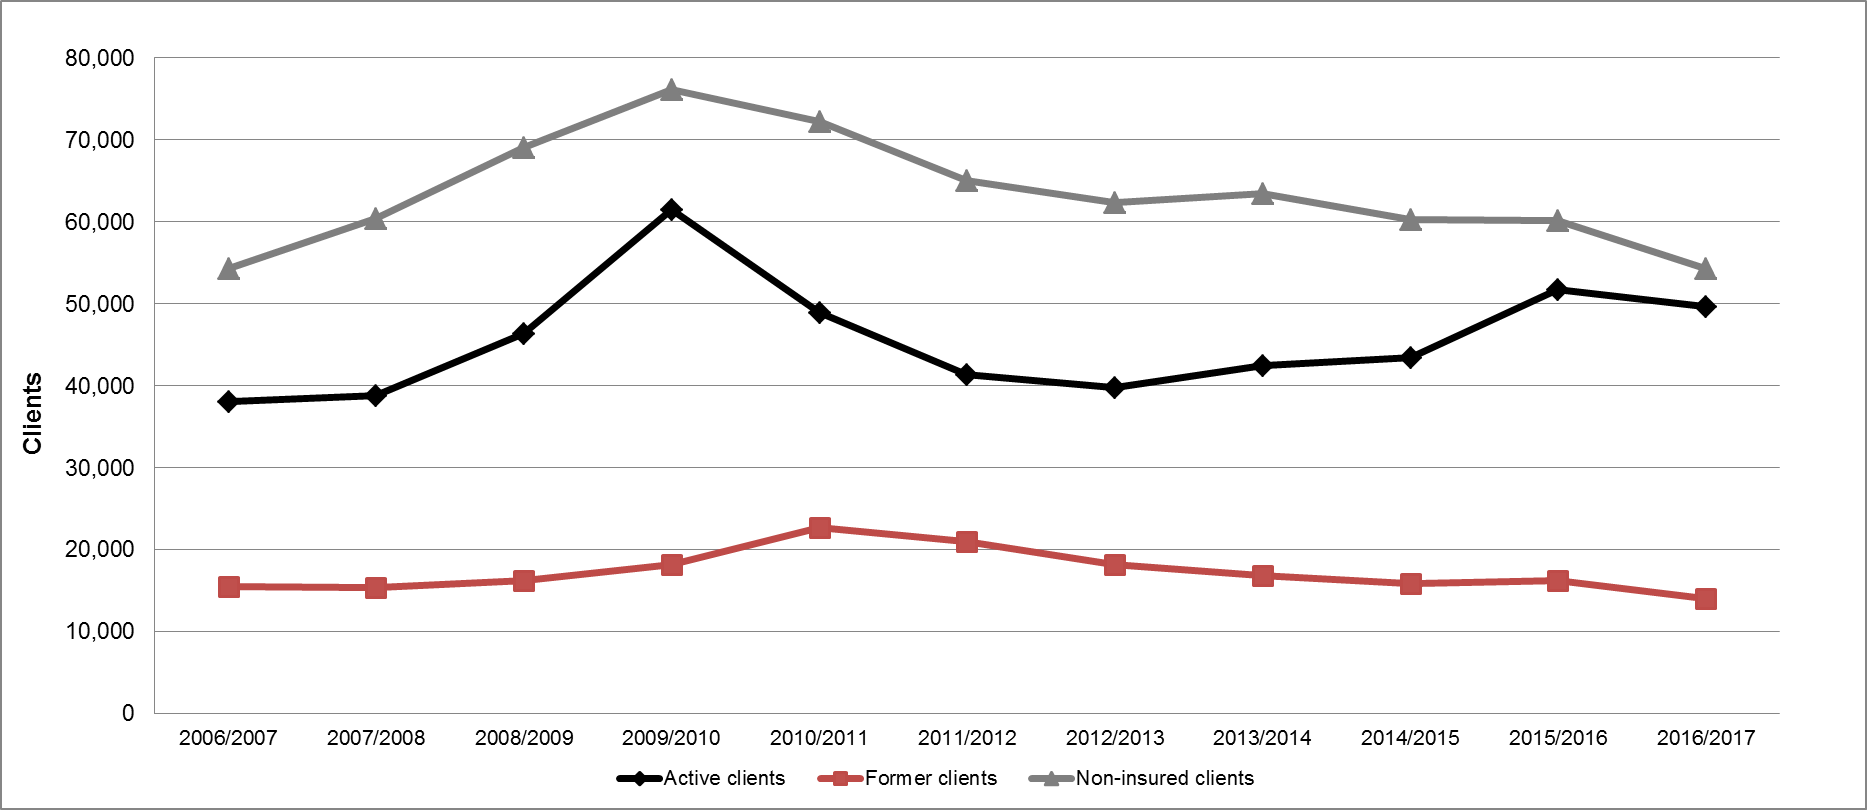
Show Data Table
| Active clients | Former clients | Non-insured clients | |
|---|---|---|---|
| 2006-2007 | 38,087 | 15,528 | 54,348 |
| 2007-2008 | 38,809 | 15,332 | 60,375 |
| 2008-2009 | 46,385 | 16,245 | 69,072 |
| 2009-2010 | 61,503 | 18,168 | 76,097 |
| 2010-2011 | 48,917 | 22,683 | 72,284 |
| 2011-2012 | 41,394 | 20,966 | 65,098 |
| 2012-2013 | 39,823 | 18,234 | 62,404 |
| 2013-2014 | 42,472 | 16,819 | 63,516 |
| 2014/2015 | 43,398 | 15,820 | 60,344 |
| 2015-2016 | 51,694 | 16,213 | 60,191 |
| 2016-2017 | 49,722 | 14,093 | 54,277 |
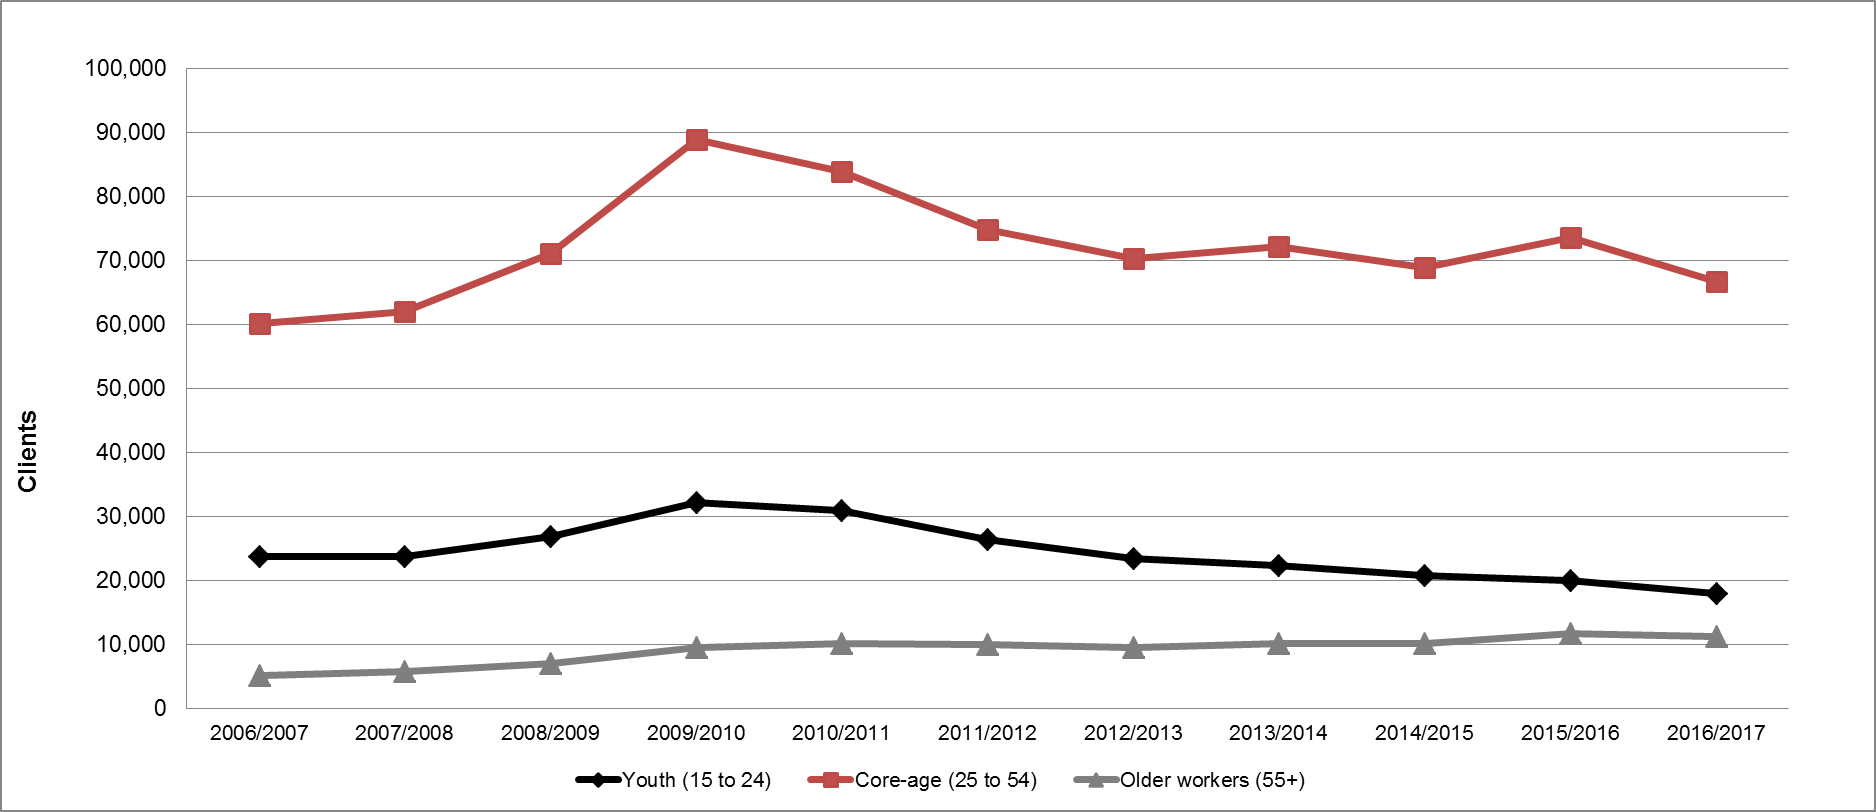
Show Data Table
| Youth (15 to 24) | Core-age (25 to 54) | Older workers (55+) | |
|---|---|---|---|
| 2006-2007 | 23,770 | 60,093 | 5,193 |
| 2007-2008 | 23,766 | 62,021 | 5,767 |
| 2008-2009 | 26,931 | 71,068 | 7,026 |
| 2009-2010 | 32,150 | 88,918 | 9,519 |
| 2010-2011 | 30,937 | 83,924 | 10,077 |
| 2011-2012 | 26,419 | 74,821 | 9,980 |
| 2012-2013 | 23,368 | 70,296 | 9,467 |
| 2013-2014 | 22,398 | 72,087 | 10,204 |
| 2014/2015 | 20,752 | 68,930 | 10,157 |
| 2015-2016 | 19,931 | 73,572 | 11,755 |
| 2016-2017 | 18,013 | 66,685 | 11,214 |
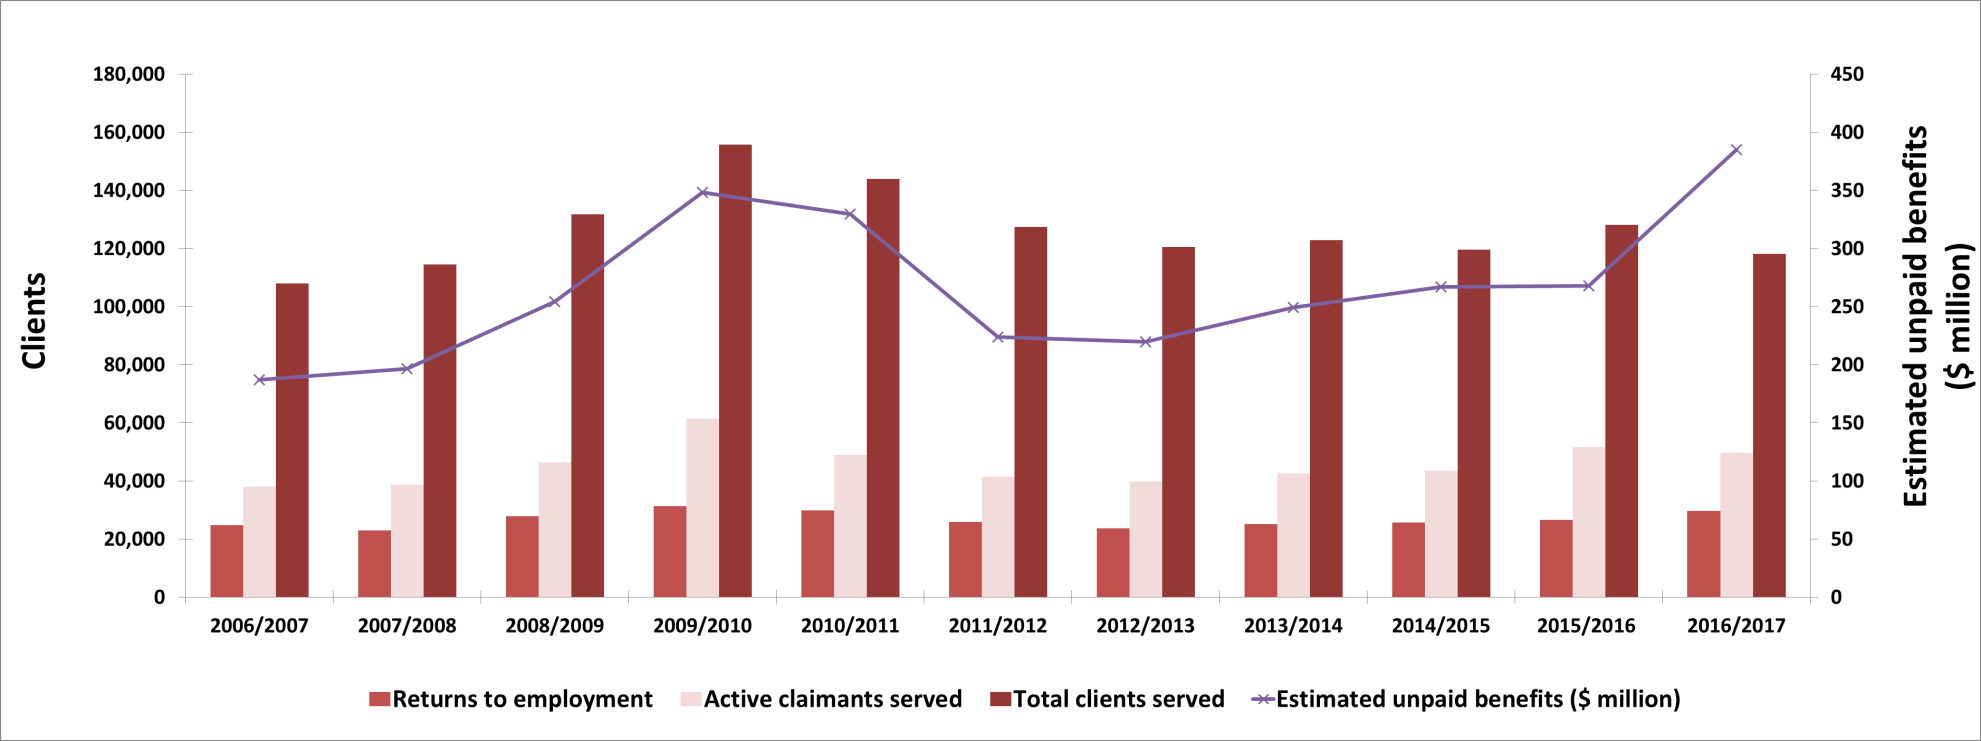
Show Data Table
| Returns to employment | Active claimants served | Total clients served | Estimated unpaid benefits ($ million) | |
|---|---|---|---|---|
| 2006-2007 | 24,801 | 38,087 | 107,963 | $186.80 |
| 2007-2008 | 22,920 | 38,809 | 114,516 | $196.70 |
| 2008-2009 | 27,869 | 46,385 | 131,702 | $254.39 |
| 2009-2010 | 31,341 | 61,503 | 155,768 | $347.95 |
| 2010-2011 | 29,890 | 48,917 | 143,884 | $329.59 |
| 2011-2012 | 25,776 | 41,394 | 127,458 | $223.61 |
| 2012-2013 | 23,686 | 39,823 | 120,461 | $219.63 |
| 2013-2014 | 25,092 | 42,472 | 122,807 | $249.34 |
| 2014/2015 | 25,745 | 43,398 | 119,562 | $266.98 |
| 2015-2016 | 26,525 | 51,694 | 128,098 | $267.88 |
| 2016-2017 | 29,671 | 49,722 | 118,092 | $384.91 |
| Interventions | Year-over-year change | Expenditures ($ 000s) |
||
|---|---|---|---|---|
| Employment Benefits | ||||
| SD-R | Occupational Training Work Foundations | 1,270 | +48.7% | 64,758 |
| SD-A | Skills Development-Apprenticeship | 21,554 | -9.8% | |
| TWS | Workplace Training | 39 | +8.3% | 465 |
| SE | Self‑Employment | 226 | +148.4% | 1,230 |
| JCPs | Integrated Training | 857 | +31.6% | 8,599 |
| Support Measures | ||||
| EAS | Career Information | 191,515 | -11.9% | 42,737 |
| LMPs | Workforce Partnerships | n/a | n/a | 3,374 |
Employment Benefits
After four consecutive years of growth, the total number of interventions delivered by Employment Benefits fell in FY1617, by 6.2% to 23,946. This was primarily due to decreases in SD-A, falling 9.8% to 21,554. However, delivery of other interventions increased during the same period:
- TWS grew by 8.3% to 39,
- SE grew by 148.4% to 226,
- JCP grew by 31.6% to 857, and
- SD-R grew by 48.7% to 1,270.
As SD-A represents 90.0% of all employment benefits, the growth of the other interventions were not strong enough to offset the dampening effect of SD-A. Total Employment Benefits expenditures amounted to $75.1 million (-12.7%). The province recorded fewer registered apprentices and fewer new apprentices, resulting in lower technical training enrollments at publicly funded post-secondary institutions. This decline was expected, as there is a direct correlation between the apprenticeship system with the economy and labour market conditions. However, this does not negatively impact students who would like to enter the apprenticeship program.
Zara and Rashida run successful businesses after participation in the self-employment program
- After being laid off during the economic downturn, Zara was struggling to find work in Fort McMurray. She decided to start her own business, and enrolled in a Self-Employment program that included classes and individual coaching. While participating in the program, Zara's home was damaged in the 2016 wildfires. This confluence of events inspired Zara to relocate to a new community. In September 2016, she opened her own boutique in Banff. In her first month, she exceeded her sales target by 25%. Zara's boutique remains open.
- As a single mother, Rashida felt immense financial pressure to meet her family's needs. To realize her goal of starting her own insurance brokerage firm, Rashida enrolled in a Self-Employment training program in Edmonton. Rashida has since opened her own brokerage firm, employs four staff, and serves more than 200 direct clients.
Support Measures: EAS
Compared to the previous year, the total number of EAS interventions delivered in FY1617 decreased by 11.9% to 191,515. After four consecutive years of decline, total EAS expenditures grew by 89.6% to $42.7 million. This is due, in part, to an additional $10.5 million made available to Alberta through the LMDA as part of Budget 2016. The changes seen in Alberta's EAS activities reflect investments to increase the capacity to deliver Career and Employment Information Services to individuals negatively impacted by the economic downturn. With increased demand due to economic conditions in the province, these investments supported more agile and large-scale services intended to help clients quickly return to employment. As these services do not capture individual client and intervention counts, they are not represented in Alberta's EAS statistics. For example, Alberta supported events such as job and career fairs and information sessions to connect clients with prospective employers and to provide them with focused information on job search and career planning, insight into the labour market and specific industries, and networking. Alberta also invested more in career advice services and publications and resources on labour market information and career and workplace information to serve Albertans.
Other Support Measures: LMPs
Total LMP expenditure rose from $857,000 in the previous year to $3.4 million in FY1617, a year over year increase of 293.5%. This reached 2.8% of all EBSM-similar expenditures (+2.0 percentage points). Alberta utilizes LMPs to enhance workplace human resource development and labour market adjustment strategies through community partnerships. Through LMPs, LMDA funding supported the City of Fort McMurray, its employers, and its residents during both the economic downturn, and in the aftermath of the 2016 wildfires. For example, LMDA funding supported a Labour Market Study, which identified current and future labour demands in Fort McMurray, with a specific focus on the rebuilding of the city. The information collected in the study is being used in the creation of short- and long-term economic development plans for the region.
2.11 British Columbia
In 2016, British Columbia's economy outperformed all other provinces for a second consecutive year, with a real GDP growth rate of 3.5%. This ongoing healthy economic performance was supported by robust household consumption, business investments and housing starts. Strong provincial economic growth is expected to follow-through in 2017, with an estimated real GDP increase ranging from 3.0% to 4.0%, depending on the impact of the wildfires and softwood lumber trade dispute. Real GDP growth is projected to moderate in 2018, closer to the forecasted national average of around 2.2%.
Mirroring its solid economic performance, British Columbia experienced its strongest year over year employment gain since FY8081, where employment in FY1617 grew by 78,600 (+3.4%). The majority of these gains were from full-time work (+51,700, +2.8%). Employment gains were realized in both services producing sectors (+67,100; +3.6%), and goods producing sectors (+11,400; +2.5%). The following industries experienced the highest employment gains:
- Construction (+13,600; +6.7%),
- Finance, insurance, real estate, rental and leasing (+12,900; +10.1%),
- Information, culture and recreation (+11,400; +9.7%),
- Business, building and other support services (+11,100; +11.6%).
For the first time since the 2008-2009 recession, British Columbia's unemployment rate fell below the 6.0% mark to 5.7% as the number of unemployed dropped by 7.0% (-11,100) from FY1516.
British Columbia: EBSM key facts
| EI clients | Non-insured clients |
|---|---|
| 44,005 |
31,073 |
| Interventions type | 2016-2017 | Year-over-year change |
|---|---|---|
| Employment Benefits | 22,475 | 7.6% |
| Support Measures: EAS | 182,872 | 2.0% |
| Total expenditures | 2016-2017 | Year-over-year change (pp) |
|---|---|---|
| Employment Benefits | 10.9% | 0.9 |
| Support Measures: EAS | 89.1% | 0.9 |
| Interventions type | 2016-2017 ($ million) | Year-over-year change |
|---|---|---|
| Employment Benefits | $154.6 | 2.7% |
| Support Measures: EAS | $108.6 | 15.9% |
| LMPs and R&I | $27.1 | 1.1% |
| Total expenditures1 | $290.3 | 3.7% |
| 2015-2016 | 2016-2017 | Year-over-year change |
|---|---|---|
| $125.29 | $152.70 | 21.9% |
- 1 Totals may not add up due to rounding; does not include accounting adjustments.
In a context of strong economic and employment growth, British Columbia's labour market priorities focus on addressing job shortages by ensuring British Columbians take part in training that meets employers' needs, as well as increasing the labour market participation of underrepresented priority client populations, including Indigenous Peoples, persons with disabilities, newcomers, youth, single parents and people with multiple barriers. To help identify in-demand skills requirements, and assist unemployed British Columbians find meaningful employment, the province invested in research projects on labour market issues, through the BC Centre for Employment Excellence. British Columbia also continues to improve the labour market information available on the province's job board website.
Managing for Results
In FY1617, British Columbia undertook extensive consultations with over 100 stakeholder organizations to gather feedback on desired improvements to Labour Market Transfer Agreements. The focus was to improve these agreements' responsiveness to the needs of British Columbia's skilled workforce, and further support a strong economy. The province also provided additional funding to social enterprises by expanding the Community and Employer Partnerships program, to include a Social Innovation stream aimed at supporting innovative projects that address social challenges beyond unemployment.
Clients, interventions and expenditures
British Columbia served 75,078 clients in FY1617, a 2.0% decrease from 76,604 in FY1516. All client types diminished slightly this fiscal:
- Active claimants shrank by 1.7% to 35,272,
- Former claimants shrank by 3.0% to 8,733, and
- Non-insured clients shrank by 2.0% to 31,073.
The share of each client type remained stable year-over-year:
- Active claimants increased by 0.1 percentage points to 47.0%,
- Former claimants decreased by 0.1 percentage points to 11.6%, and
- Non-insured clients remain unchanged at 41.4%.
The number of interventions delivered in British Columbia decreased for the third consecutive year by 1.1% to 205,347 (FY1617). While Employment Benefits accounted for the smallest part of all interventions (10.9%), they generated a higher number of returns to employment. Over 12,200 active and former clients returned to employment following an Employment Benefits intervention, out of a total of 21,050 returns to employment. Unpaid benefits jumped by 21.9% year-over-year to $152.70 million. Of the $292.3 million allocation, British Columbia spent $290.3 million (+3.7%) in EBSM expenditures. This included $13.4 million of the $125 million additional LMDA funding announced in Budget 2016.
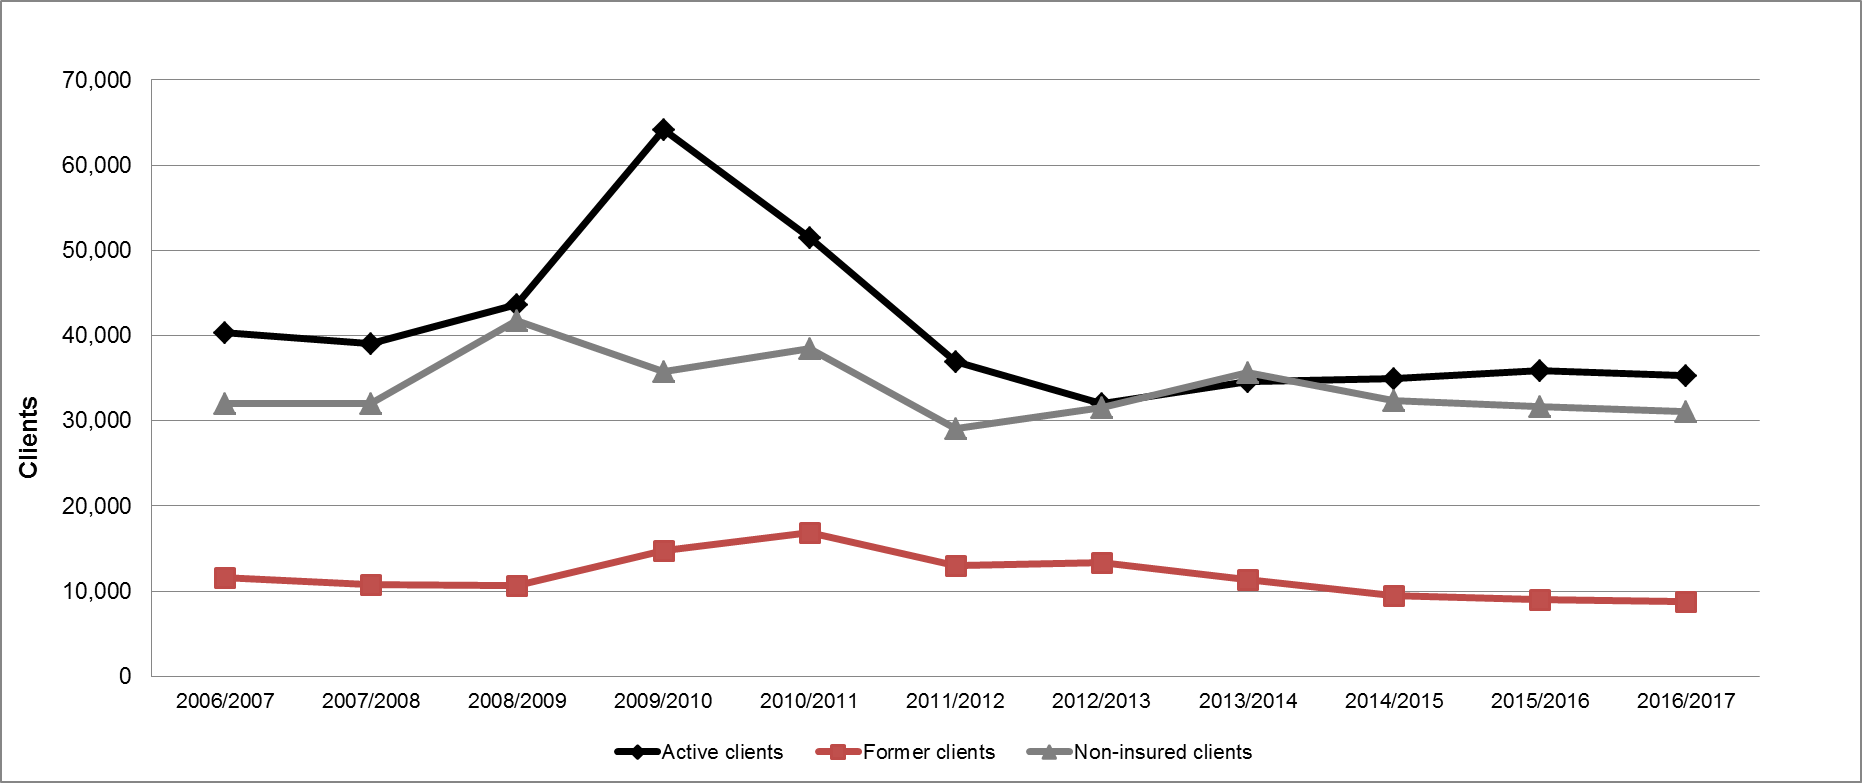
Show Data Table
| Active clients | Former clients | Non-insured clients | |
|---|---|---|---|
| 2006-2007 | 40,326 | 11,552 | 31,991 |
| 2007-2008 | 39,046 | 10,767 | 32,035 |
| 2008-2009 | 43,636 | 10,652 | 41,736 |
| 2009-2010 | 64,197 | 14,720 | 35,795 |
| 2010-2011 | 51,433 | 16,828 | 38,415 |
| 2011-2012 | 36,889 | 12,984 | 29,068 |
| 2012-2013 | 31,953 | 13,303 | 31,522 |
| 2013-2014 | 34,612 | 11,336 | 35,680 |
| 2014/2015 | 34,937 | 9,502 | 32,365 |
| 2015-2016 | 35,891 | 9,007 | 31,706 |
| 2016-2017 | 35,276 | 8,735 | 31,081 |
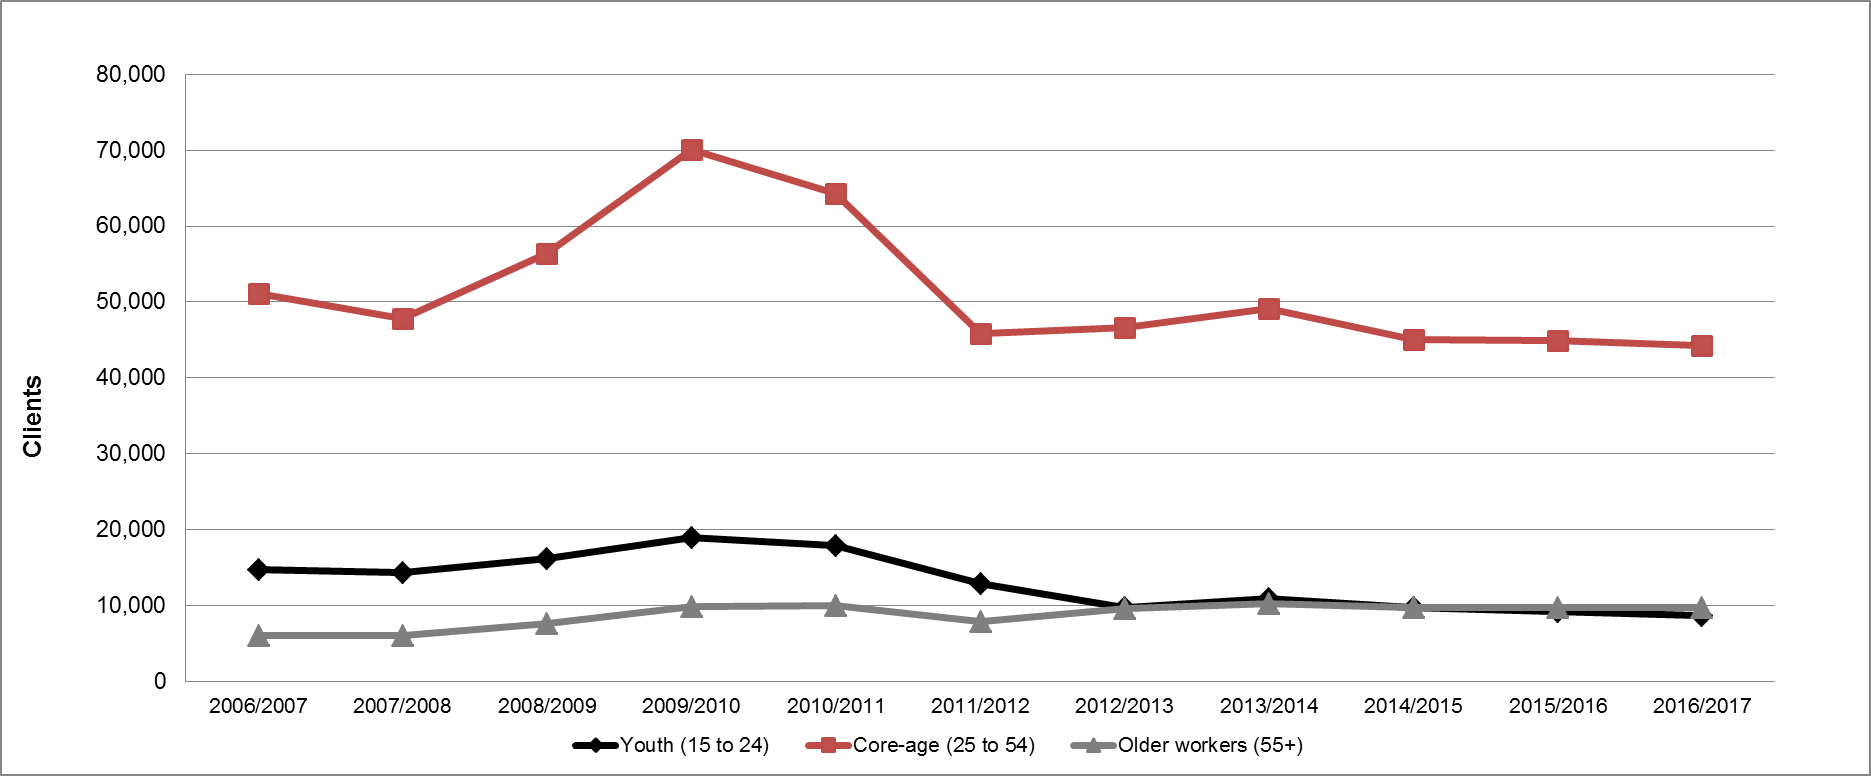
Show Data Table
| Youth (15 to 24) | Core-age (25 to 54) | Older workers (55+) | |
|---|---|---|---|
| 2006-2007 | 14,757 | 51,055 | 6,032 |
| 2007-2008 | 14,269 | 47,750 | 5,971 |
| 2008-2009 | 16,137 | 56,345 | 7,612 |
| 2009-2010 | 18,965 | 70,080 | 9,886 |
| 2010-2011 | 17,929 | 64,350 | 9,934 |
| 2011-2012 | 12,846 | 45,872 | 7,839 |
| 2012-2013 | 9,719 | 46,584 | 9,524 |
| 2013-2014 | 10,935 | 49,179 | 10,295 |
| 2014/2015 | 9,666 | 45,010 | 9,738 |
| 2015-2016 | 9,232 | 44,893 | 9,733 |
| 2016-2017 | 8,688 | 44,208 | 9,703 |
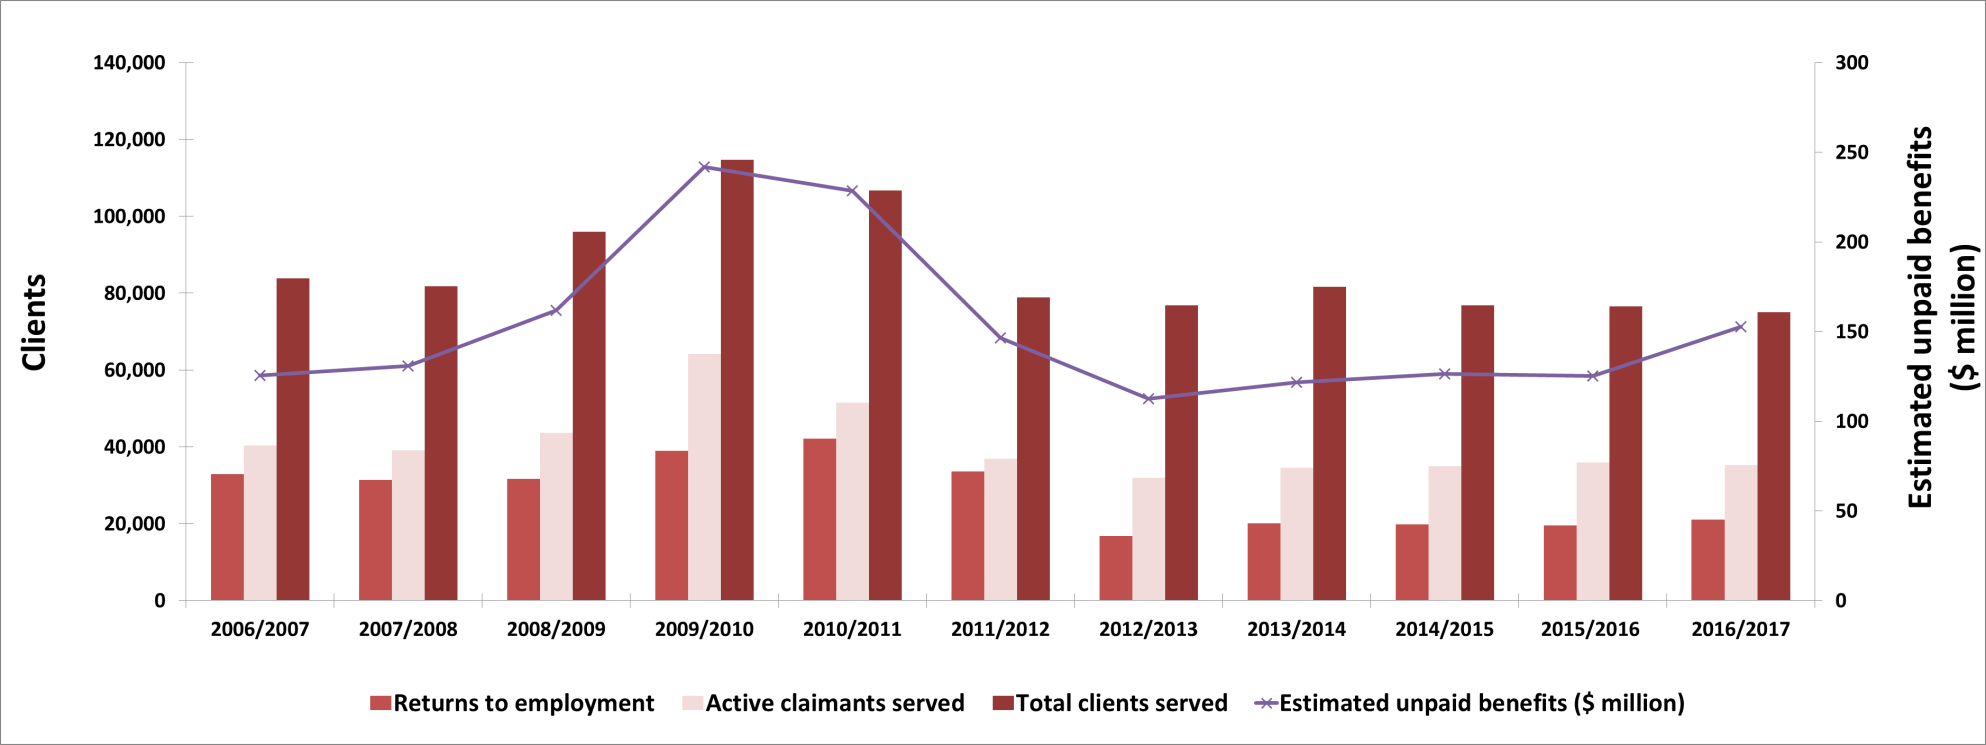
Show Data Table
| Returns to employment | Active claimants served | Total clients served | Estimated unpaid benefits ($ million) | |
|---|---|---|---|---|
| 2006-2007 | 32,884 | 40,326 | 83,869 | $125.50 |
| 2007-2008 | 31,427 | 39,046 | 81,848 | $131.00 |
| 2008-2009 | 31,607 | 43,636 | 96,024 | $161.76 |
| 2009-2010 | 38,931 | 64,197 | 114,712 | $241.66 |
| 2010-2011 | 42,082 | 51,433 | 106,676 | $228.44 |
| 2011-2012 | 33,580 | 36,889 | 78,941 | $146.43 |
| 2012-2013 | 16,777 | 31,953 | 76,778 | $112.51 |
| 2013-2014 | 20,040 | 34,612 | 81,628 | $121.85 |
| 2014/2015 | 19,818 | 34,937 | 76,804 | $126.47 |
| 2015-2016 | 19,552 | 35,891 | 76,604 | $125.29 |
| 2016-2017 | 21,055 | 35,276 | 75,092 | $152.70 |
| Interventions | Year-over-year change | Expenditures ($ 000s) |
||
|---|---|---|---|---|
| Employment Benefits | ||||
| SD-R | Skills Development Employment Benefit | 4,193 | +13.4% | 120,892 |
| SD-A | Skills Development Employment Benefit - Apprenticeship | 13,342 | +1.6% | |
| TWS | Wage Subsidies | 2,073 | +16.8% | 9,049 |
| SE | Self-Employment | 2,569 | +22.5% | 13,574 |
| JCPs | Job Creation Partnerships | 298 | +62.8% | 11,067 |
| Support Measures | ||||
| EAS | Employment Assistance Services | 126,937 | -0.4% | 108,592 |
| LMPs | Labour Market Partnerships Employer-Sponsored Training | n/a | n/a | 11,034 |
| R and I | Research and Innovation | n/a | n/a | 16,095 |
Employment Benefits
British Columbia delivered a growing number of Employment Benefits interventions for a fourth consecutive year, reaching 22,475 (+7.6%) in FY1617. Participation increased for all four types of interventions, including:
- SD-A, increased slightly by 1.6% to 13,342 interventions,
- SD-R increased by 13.4% to 4,193 interventions,
- TWS increased by 16.8% to 2,073 interventions, and
- SE increased by 22.5% to 2,569 interventions.
- Proportionally, the greatest increase was in JCP by 62.8%, to 298 interventions.
A portion of the additional funding received by the province under Budget 2016 was used to fund JCP interventions through Community and Employer Partnerships. These projects are directed at priority clients, including people with disabilities, Aboriginal people, youth and immigrants. Despite the additional $13.4 million in funding to the province under Budget 2016, total expenditures of Employment Benefits declined from $158.8 million in FY1516 to $154.6 million in FY1617, a year-over-year decrease of 2.7%.
Employment Assistance Services
While a total of 182,872 EAS interventions were delivered in FY1617, this represented a 2.0% drop from the previous year. Total EAS expenditures reached $108.6 million, which increased 15.9% from the previous year. Overall, all types of EAS interventions dropped, but at different paces:
- Employment Services continued its three years of decline, falling by 0.4% to 126,937 interventions.
- Individual Counselling decreased moderately, by 4.8% from the previous year to 55,751 interventions.
- Group Services experienced a large drop of 69.9% year-over-year, to 184 interventions.
Other Support Measures: LMPs and R&I
In FY1617, British Columbia spent $11.0 million for LMPs, 21.9% more than FY1516. Meanwhile expenditures for R&I shrank by 12.4% to $16.1 million. In total, LMPs and R&I funding amounted to $27.1 million, a 1.1% decrease year-over-year.
Daniel starts his own business after taking part in the Self-Employment program
Daniel had been working mostly in contract jobs with maintenance companies throughout the East Kootenays, in south-east British Columbia. After he was laid-off, he visited his local WorkBC Employment Services Centre. He was interested in starting his own business. With the assistance of the WorkBC Employment Services Centre, Daniel entered the Self-Employment (SE) program in July of 2016. He attended the required workshops and completed his business plan. He then successfully launched his own business in October, 2016. Dan is now building custom furniture and other household items out of his shop on the outskirts of Cranbrook.
2.12 Northwest TerritoriesFootnote 20
In 2016, real GDP expanded in the Northwest Territories for a fourth consecutive year, increasing by 0.8%. Advances in non-residential construction, diamond mining and air transportation were partially counterbalanced by declines in the energy sector, retail trade and industrial production. The Territory expects real GDP to register strong growth in 2017, thanks to higher diamond mine production.
Labour market outcomes remained stable for the Northwest Territories in FY1617. While the overall employment level was relatively unchanged, the unemployment rate declined to 7.1%, as the number of unemployed decreased by 300 (-15.0%). Labour Force Survey employment estimates by industry are not available for the Territories. However, employment figures from the Survey of Employment, Payrolls and Hours show that employment gains in FY1617 over FY1516 were registered mainly in health care and social assistance; public administration; as well as heavy and civil engineering construction. Notable losses were observed in transportation and warehousing; construction; professional, scientific and technical services; as well as retail trade.
Northwest Territories: EBSM key facts
| EI clients | Non-insured clients |
|---|---|
| 462 |
573 |
| Interventions type | 2016-2017 | Year-over-year change |
|---|---|---|
| Employment Benefits | 298 | 15.1% |
| Support Measures: EAS | 1,521 | 14.9% |
| Interventions type | 2016-2017 | Year-over-year change (pp) |
|---|---|---|
| Employment Benefits | 16.4% | 4.6 |
| Support Measures: EAS | 83.6% | 4.6 |
| Total expenditures | 2016-2017 ($ million) | Year-over-year change |
|---|---|---|
| Employment Benefits | $1.6 | 6.9% |
| Support Measures: EAS | $1.2 | 5.9% |
| LMPs and R&I | $0.3 | 11.6% |
| Total expenditures1 | $3.0 | 0.4% |
| 2015-2016 | 2016-2017 | Year-over-year change |
|---|---|---|
| $1.82 | $2.04 | 12.1% |
- 1 Totals may not add up due to rounding; does not include accounting adjustments.
In response to labour market challenges brought upon by the changing nature of work and growing skills mismatch, the Government of the Northwest Territories launched the Skills 4 Success Initiative in FY1617. The initiative is designed to improve employment outcomes of residents, close skills gaps for in-demand jobs, and more effectively respond to employer and industry needs. An outcome of the Skills 4 Success Initiative is the release of a study by the Conference Board of Canada, titled Northwest Territories Labour Market Forecast and Needs Assessment, on the in-demand jobs in Northwest Territories over the next 15 years. The report highlights the need to develop a skilled workforce to increase the Territory's competitiveness to realize its substantial economic growth potential. According to the report, between 2015 to 2030, about three quarters of job openings will require a post-secondary certificate, diploma, or degree, and/or extensive work experience and seniority. Under the base case scenario, total employment is expected to remain relatively stable over the 15-year period. The Conference Board's more optimistic scenarios, based on improved global outlooks for commodities, and a rise in government investments, forecast employment to expand by 16% to 25% over the forecast period.
Managing for results
In order to better support EI clients earlier in their claim, the Northwest Territories is working to implement the Targeting, Referral and Feedback (TRF) process, to enable clients to return to work sooner and further contribute to EI savings. The Northwest Territories is also engaged in the modernization of their data collection, reporting processes, and overall data integrity.
In addition, the Government of Northwest Territories, through the Department of Education, Culture and Employment, continues to implement its Skills 4 Success Initiative. This program is designed to improve employment outcomes for residents, by closing skill gaps for in-demand jobs, and effectively respond to employer, industry and community needs. It relies on the active participation and engagement of other governments and organizations, education and training partners, industry, business and non-governmental stakeholders. This initiative will ensure that both federal and territorial funding for skills training will be utilized in the most effective way.
Clients, interventions and expenditures
In the Northwest Territories, the total number of clients served declined from 1,369 in FY1516, to 1,035 in FY1617, a drop of 24.4%. All three client-type counts shrank:
- Non-insured clients dropped by 32.5% to 573 claimants;
- Former claimants dropped by 20.0% to 156 claimants; and
- Active clients dropped by 5.8% to 306 claimants.
The shares of each client type change in FY1617:
- Active claimants grew by 5.8 percentage points to 29.6%;
- Former grew by 0.8 percentage points to 15.1% claimants; while
- Non-insured clients shrank by 6.7 percentage points to 55.4%.
In FY1617, there were 1,819 EBMS-similar interventions in the Northwest Territories, a 8.6% year-over-year increase. EAS remains the most used intervention-type, with an 83.6% proportion of all interventions, an increase of 4.6 percentage points from the previous year. The share of Employment Benefits decreased from 21.0% in FY1516 to 16.4% in FY1617. A total of 177 individuals returned to employment following participation in the programs, representing a 2.3% year-over-year increase. Unpaid benefits grew by 12.1%, from $1.82 million in FY1516 to $2.04 million in FY1617. Total expenditures for EBSM-similar programming ($3.0 million) remained stable (-0.4%).
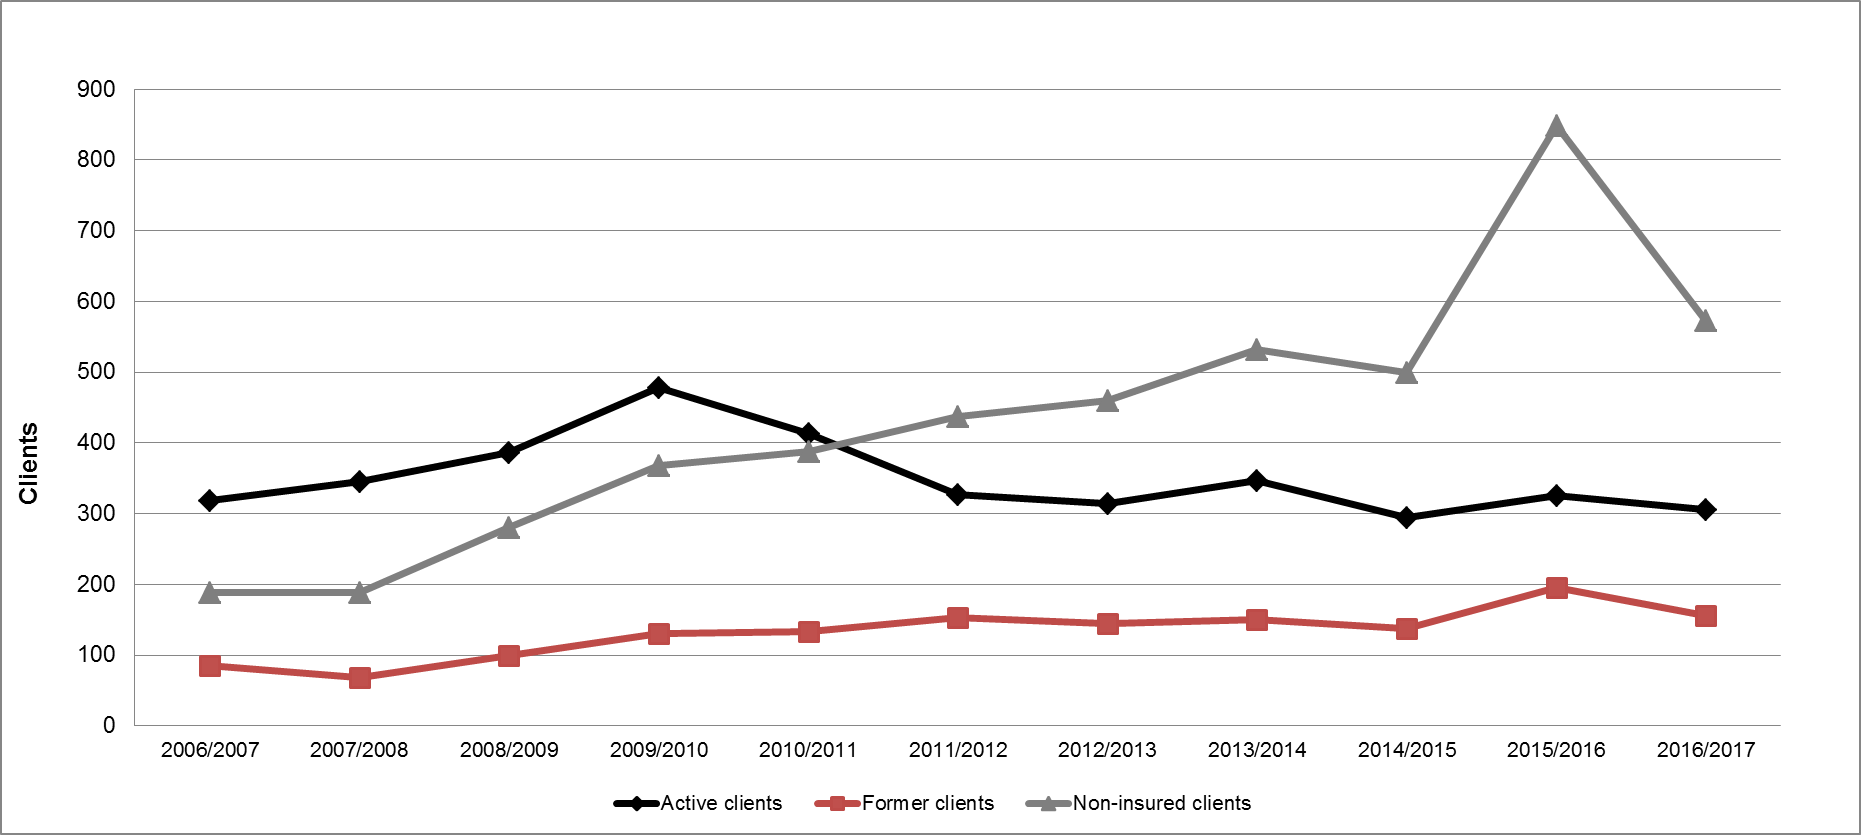
Show Data Table
| Active clients | Former clients | Non-insured clients | |
|---|---|---|---|
| 2006-2007 | 319 | 85 | 188 |
| 2007-2008 | 345 | 68 | 189 |
| 2008-2009 | 386 | 99 | 280 |
| 2009-2010 | 478 | 130 | 368 |
| 2010-2011 | 413 | 134 | 388 |
| 2011-2012 | 327 | 153 | 437 |
| 2012-2013 | 314 | 144 | 460 |
| 2013-2014 | 347 | 151 | 532 |
| 2014/2015 | 294 | 138 | 500 |
| 2015-2016 | 325 | 195 | 849 |
| 2016-2017 | 306 | 156 | 573 |
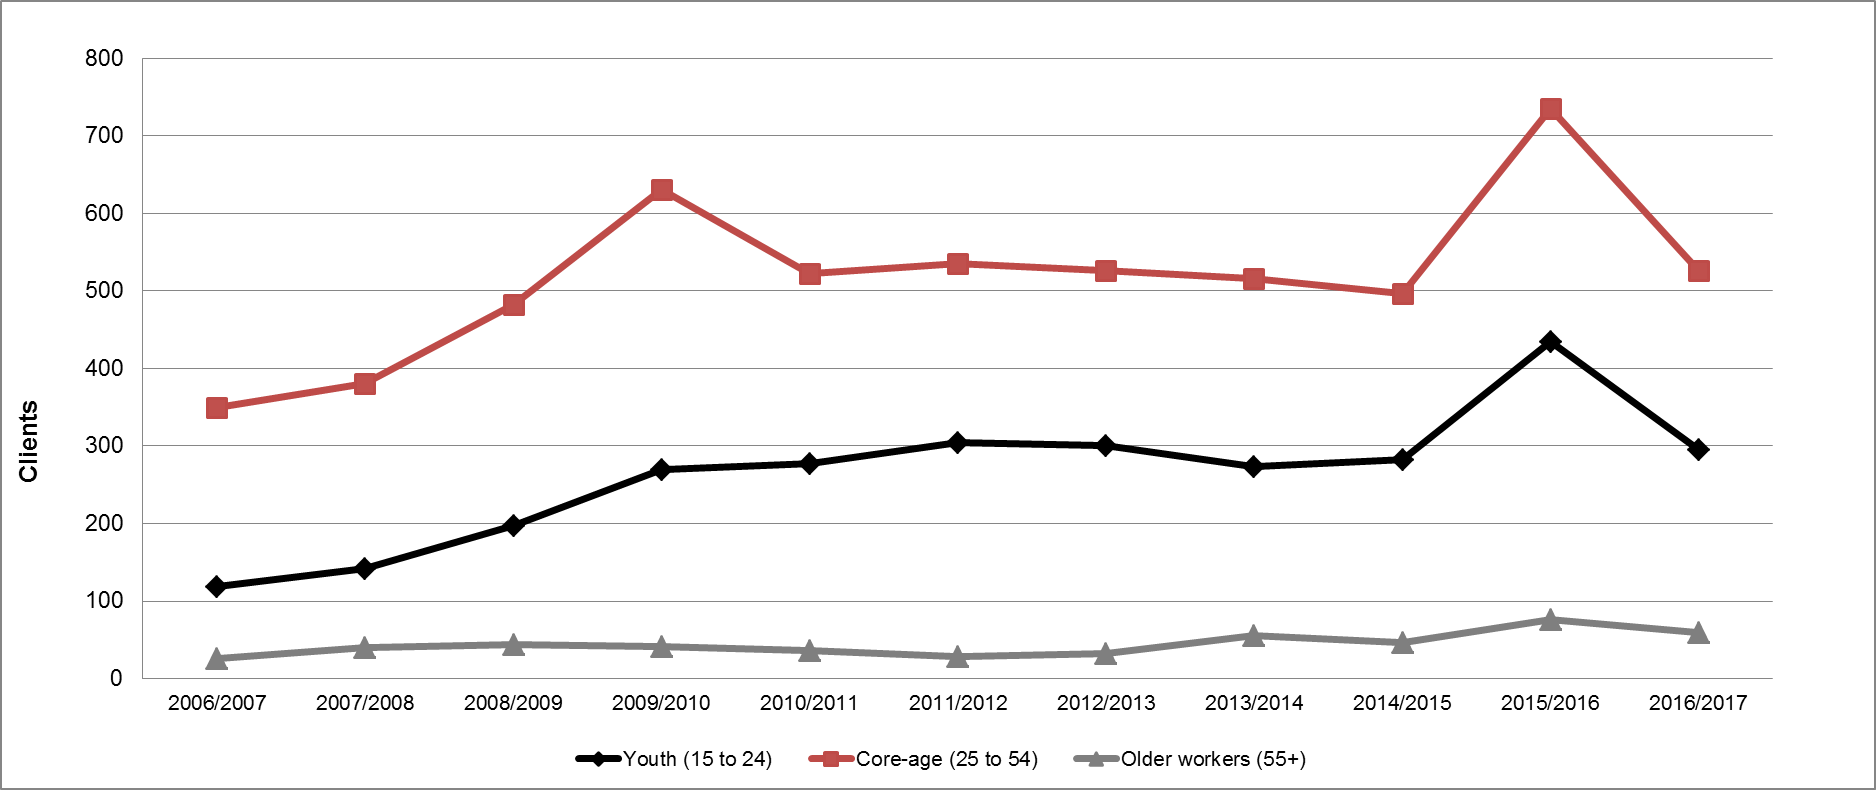
Show Data Table
| Youth (15 to 24) | Core-age (25 to 54) | Older workers (55+) | |
|---|---|---|---|
| 2006-2007 | 119 | 350 | 26 |
| 2007-2008 | 142 | 381 | 40 |
| 2008-2009 | 197 | 482 | 44 |
| 2009-2010 | 270 | 631 | 41 |
| 2010-2011 | 277 | 523 | 36 |
| 2011-2012 | 305 | 535 | 28 |
| 2012-2013 | 300 | 526 | 32 |
| 2013-2014 | 274 | 516 | 56 |
| 2014/2015 | 283 | 496 | 46 |
| 2015-2016 | 435 | 735 | 76 |
| 2016-2017 | 295 | 526 | 59 |
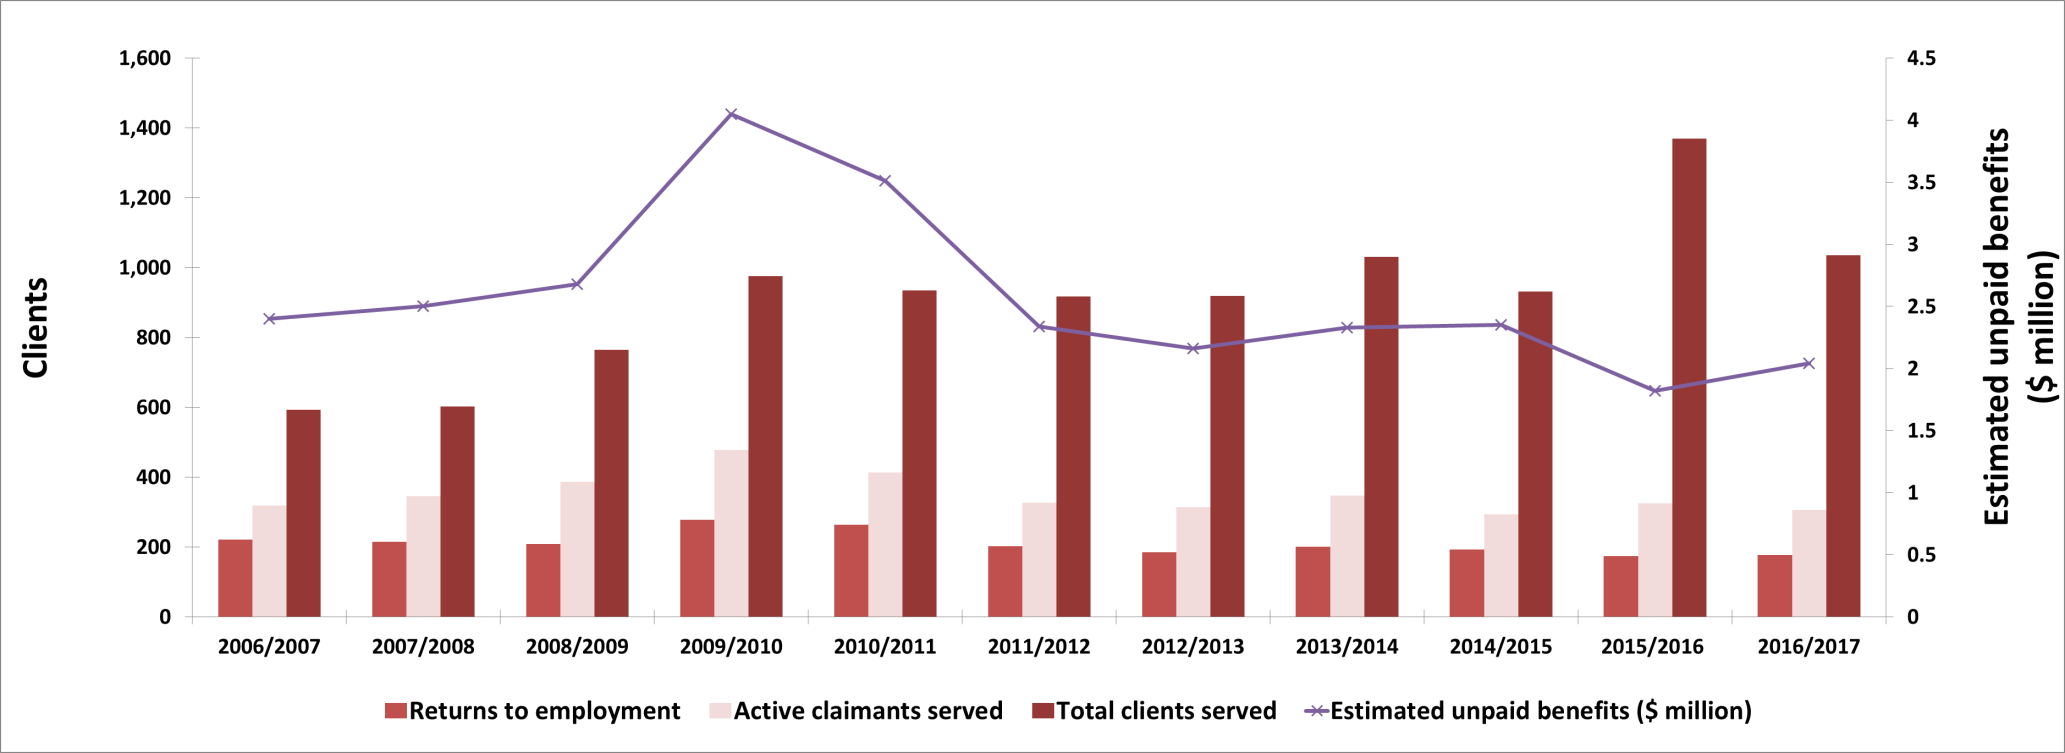
Show Data Table
| Returns to employment | Active claimants served | Total clients served | Estimated unpaid benefits ($ million) | |
|---|---|---|---|---|
| 2006-2007 | 221 | 319 | 592 | $2.40 |
| 2007-2008 | 214 | 345 | 602 | $2.50 |
| 2008-2009 | 208 | 386 | 765 | $2.68 |
| 2009-2010 | 278 | 478 | 976 | $4.05 |
| 2010-2011 | 263 | 413 | 935 | $3.51 |
| 2011-2012 | 202 | 327 | 917 | $2.34 |
| 2012-2013 | 185 | 314 | 918 | $2.16 |
| 2013-2014 | 200 | 347 | 1,030 | $2.33 |
| 2014/2015 | 193 | 294 | 932 | $2.35 |
| 2015-2016 | 173 | 325 | 1,369 | $1.82 |
| 2016-2017 | 177 | 306 | 1,035 | $2.04 |
| Interventions | Year-over-year change | Expenditures ($ 000s) |
||
|---|---|---|---|---|
| Employment Benefits | ||||
| SD-R | Building Essential Skills | 82 | +43.9% | 1,190 |
| SD-A | Building Essential Skills-Apprenticeship | 154 | +21.3% | |
| TWS | Wage Subsidies | 16 | -83.8% | 203 |
| SE | Self-Employment Option | 21 | +5.0% | 160 |
| JCPs | Job Creation Partnerships | 25 | -47.9% | - |
| Support Measures | ||||
| EAS | Northwest Territories Employment Assistance Services | 1,521 | 14.9% | 1,171 |
| LMPs | Northwest TerritoriesLabour Market Partnerships | n/a | n/a | 187 |
| R and I | Research and Innovation | n/a | n/a | 119 |
Employment Benefits
In FY1617, the territory delivered a total of 298 Employment Benefits interventions, compared to 351 in the previous year, a 15.1% decline.
- JCP dropped by 47.9% to 25 interventions;
- TWS dropped by 83.8% to 16 interventions; however,
- SE increased by 5.0% to 21 interventions;
- SD-R increased by 43.9% to 82 interventions; and
- SD-A increased by 21.3% to 154 interventions.
Total expenditures for Employment Benefits grew by 6.9% to $1.6 million, $170,319 of which represents Northwest Territories' share of the additional $125 million in LMDA funding announced in Budget 2016.
Support Measures: EAS
EAS interventions in the Northwest Territories are solely delivered through Individual Counselling. This support measure expanded from 1,324 in FY1516 to 1,521 in FY1617, an increase of 14.9%. A total of $1.2 million was spent for EAS expenditures, a 5.9% decrease from the previous year.
Other Support Measures: LMPs and R&Is
Compared to the previous year, total expenditures for LMPs and R&I fell by 11.6% to $307,000. While LMPs expenditures ($187,000) declined by 25.9%, that of R&I ($119,000) advanced by 27.2%.
Matthew's apprenticeship journey
Matthew started a Plumber/Gasfitter apprenticeship in 2014. Matthew's father was a journeyperson for many years, and Matthew's brother Colin became certified in the trade in 2014. Matthew was further inspired to enter the trade by seeing his brother Colin compete at the 2012 WorldSkills Americas competition in Sao Paolo, Brazil. Mathew is on track to completing his journeyperson certification in the four years it usually takes to complete an apprenticeship, thanks to the NWT Building Essential Skills fund. Matthew is looking forward to becoming the third person in his family certified in the Plumber/Gasfitter B trade in 2018. It seems this has become a family tradition.
2.13 Yukon
After registering the weakest real GDP growth in 2015 (-7.8%) among all provinces and territories, Yukon's real GDP bounced back solidly in 2016 to lead all jurisdictions, with a year-over-year surge of 8.0%. This was primarily a result of an increase in mineral production at the Minto mine.
In line with its strong economic performance, Yukon's labour market strengthened in FY1617 and was one of the most robust in Canada. Compared to the previous year, the territory's employment level increased by 1,300 (+6.8%), pushing the employment rate to 73.0%. This was Yukon's highest rate since Statistics Canada started publishing labour force survey estimates for the Territories in FY9293. The unemployment rate improved to 5.3%, from 6.2% in FY1516, the lowest among all provinces and territories.
Facing an already tight labour market, Yukon's main challenge is to maintain the supply of qualified workers, to meet employers' growing needs. To achieve this, the territory prioritizes lifelong learning, and the increased workforce participation of groups facing multiple barriers to employment; such as Indigenous peoples, persons with disabilities, older workers, youth, women in trades, and newcomers.
Yukon: EBSM key facts
| EI clients | Non-insured clients |
|---|---|
| 235 |
85 |
| Interventions type | 2016-2017 | Year-over-year change |
|---|---|---|
| Employment Benefits | 165 | 10.3% |
| Support Measures: EAS | 219 | 16.5% |
| Interventions type | 2016-2017 | Year-over-year change (pp) |
|---|---|---|
| Employment Benefits | 43.0% | 6.5 |
| Support Measures: EAS | 57.0% | 6.5 |
| Total expenditures | 2016-2017 ($ million) | Year-over-year change |
|---|---|---|
| Employment Benefits | $1.6 | 23.7% |
| Support Measures: EAS | $1.6 | 12.5% |
| LMPs and R&I | $0.3 | — |
| Total expenditures1 | $3.5 | 0.1% |
| 2015-2016 | 2016-2017 | Year-over-year change |
|---|---|---|
| $1.27 | $1.50 | 18.1% |
- 1 Totals may not add up due to rounding; does not include accounting adjustments.
Managing for results
Yukon is engaging employers and training providers on program design and delivery through the Labour Market Framework. These stakeholders meet several times each year, and work with the Yukon Government, to share ideas on how to best support job seekers and employers in the labour market. The Framework has three strategies: Comprehensive Skills and Trades Training, Recruitment and Employee Retention, and Labour Market Information.
To continuously improve program reporting and administration, Yukon has been working to develop a new reporting process that will reduce the administration required to manage these labour market programs, resulting in faster turnaround times for outcome reports.
Clients, interventions and expenditures
The total number of clients served in Yukon in FY1617 remained relatively stable at 320 (+0.9% year-over-year).
- Active claimants declined by 4.7% to 201 interventions;
- Former claimants declined by 17.1% to 34 interventions; while
- Non-insured clients more than offset the declines, by a 30.8% increase to 85 interventions.
Client types' shares shifted in the same direction as their numbers.
- Active claimants decreased by 3.7 percentage points to 62.8%;
- Former claimants dropped by 2.3 percentage points to 10.6%; while
- Non-insured clients increased by 6.1 percentage points to 26.6%.
Yukon delivered a total of 384 interventions in FY1617. The share of Employment Benefits declined by 6.5 percentage points year-over-year, reaching 43.0% of all EBSM-similar interventions, while the proportion of Employment Assistance Services increased to 57.0%. Unpaid benefits increased from $1.27 million in FY1516 to $1.50 million in FY1617, an 18.1% year-over-year increase. A total of 176 clients (-6.4%) returned to employment after participation in an EBSM-similar programming. Total expenditures for EBSM-similar programming ($3.5 million) remained stable (-0.1%), despite Yukon's share ($129,817) of the additional $125 million in LMDA funding announced in Budget 2016.
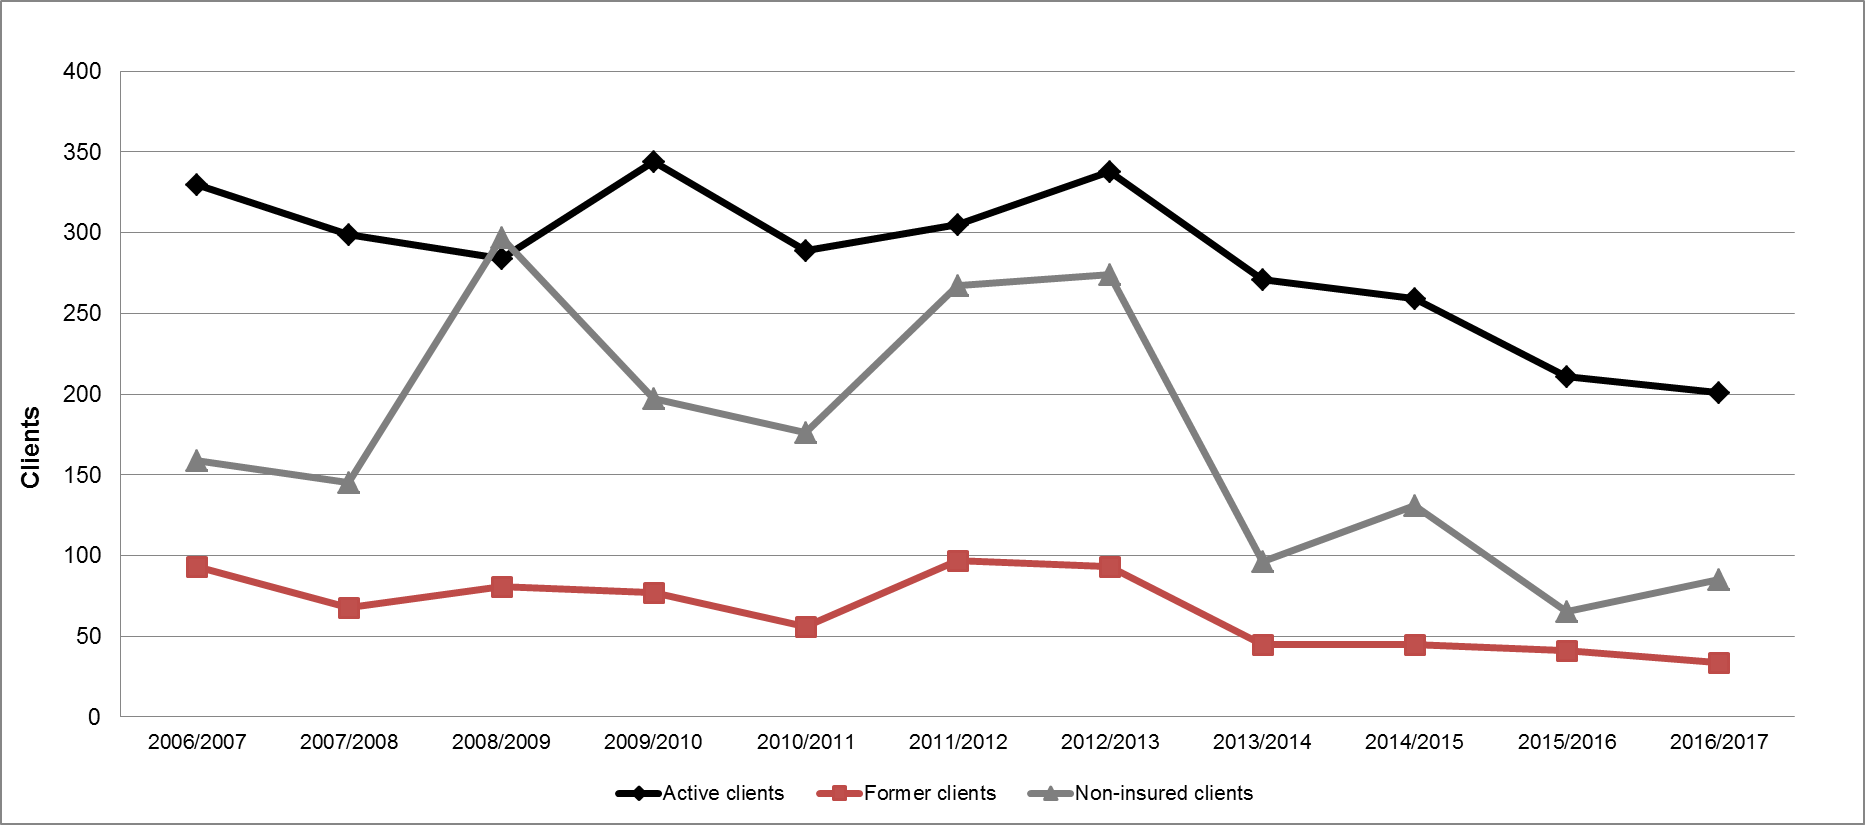
Show Data Table
| Active clients | Former clients | Non-insured clients | |
|---|---|---|---|
| 2006-2007 | 330 | 93 | 159 |
| 2007-2008 | 299 | 68 | 145 |
| 2008-2009 | 284 | 81 | 297 |
| 2009-2010 | 344 | 77 | 197 |
| 2010-2011 | 289 | 56 | 176 |
| 2011-2012 | 305 | 97 | 267 |
| 2012-2013 | 338 | 93 | 274 |
| 2013-2014 | 271 | 45 | 96 |
| 2014/2015 | 259 | 45 | 131 |
| 2015-2016 | 211 | 41 | 65 |
| 2016-2017 | 201 | 34 | 85 |
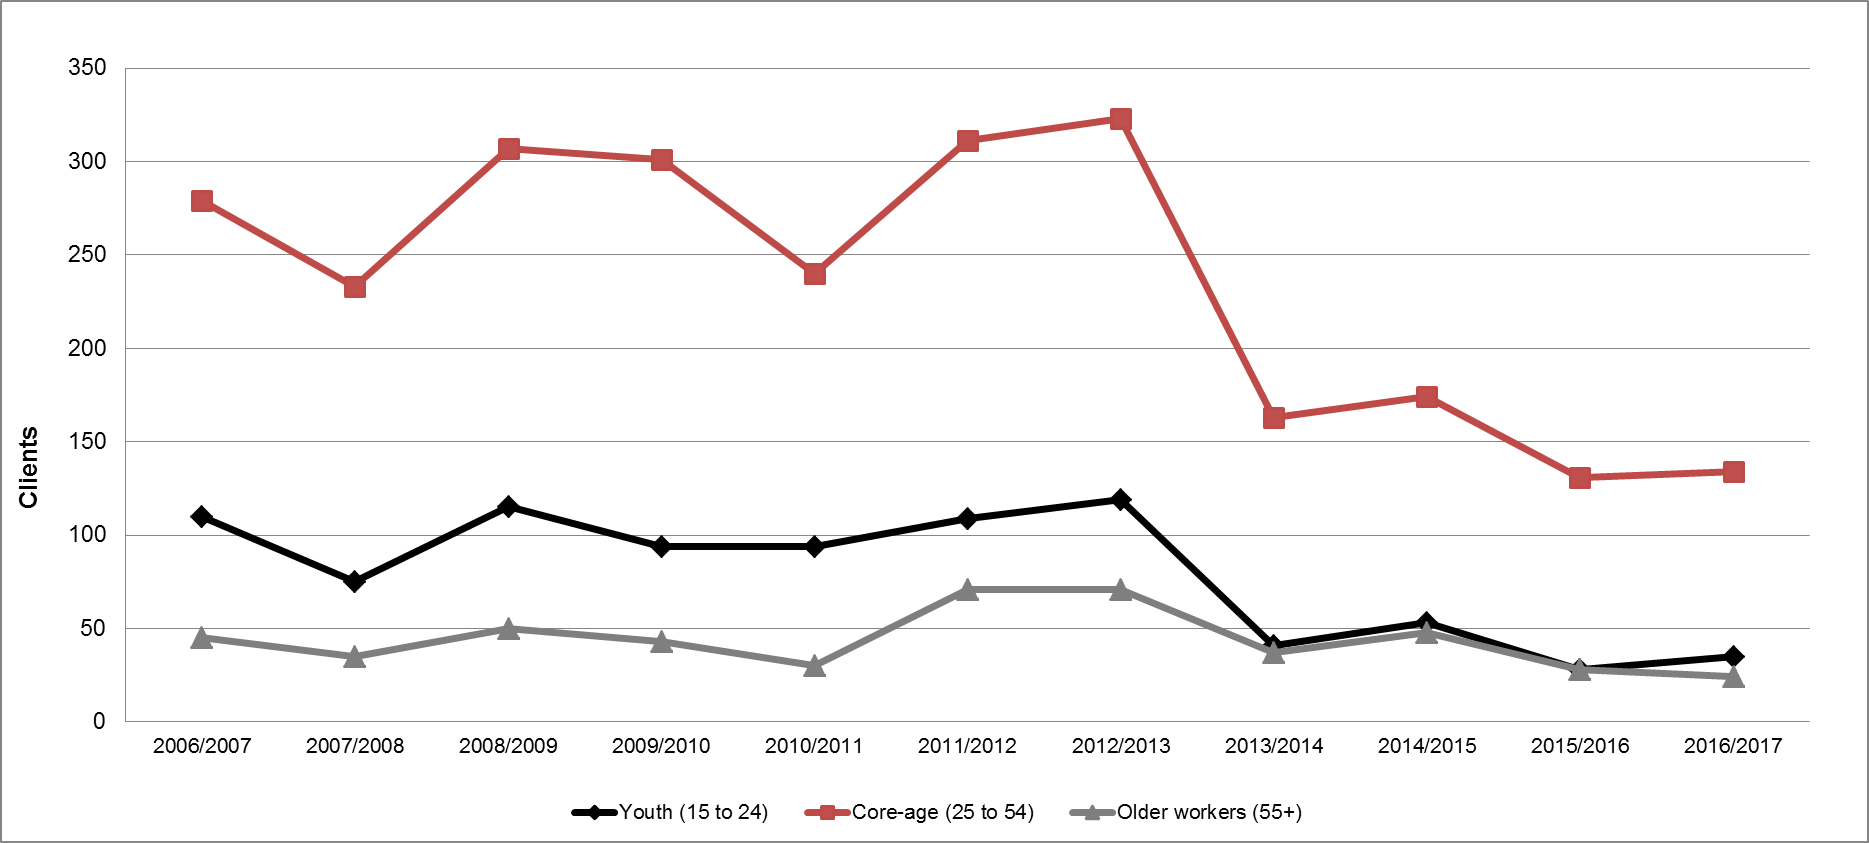
Show Data Table
| Youth (15 to 24) | Core-age (25 to 54) | Older workers (55+) | |
|---|---|---|---|
| 2006-2007 | 110 | 279 | 45 |
| 2007-2008 | 75 | 233 | 35 |
| 2008-2009 | 115 | 307 | 50 |
| 2009-2010 | 94 | 301 | 43 |
| 2010-2011 | 94 | 240 | 30 |
| 2011-2012 | 109 | 311 | 71 |
| 2012-2013 | 119 | 323 | 71 |
| 2013-2014 | 41 | 163 | 37 |
| 2014/2015 | 53 | 174 | 48 |
| 2015-2016 | 28 | 131 | 28 |
| 2016-2017 | 35 | 134 | 24 |
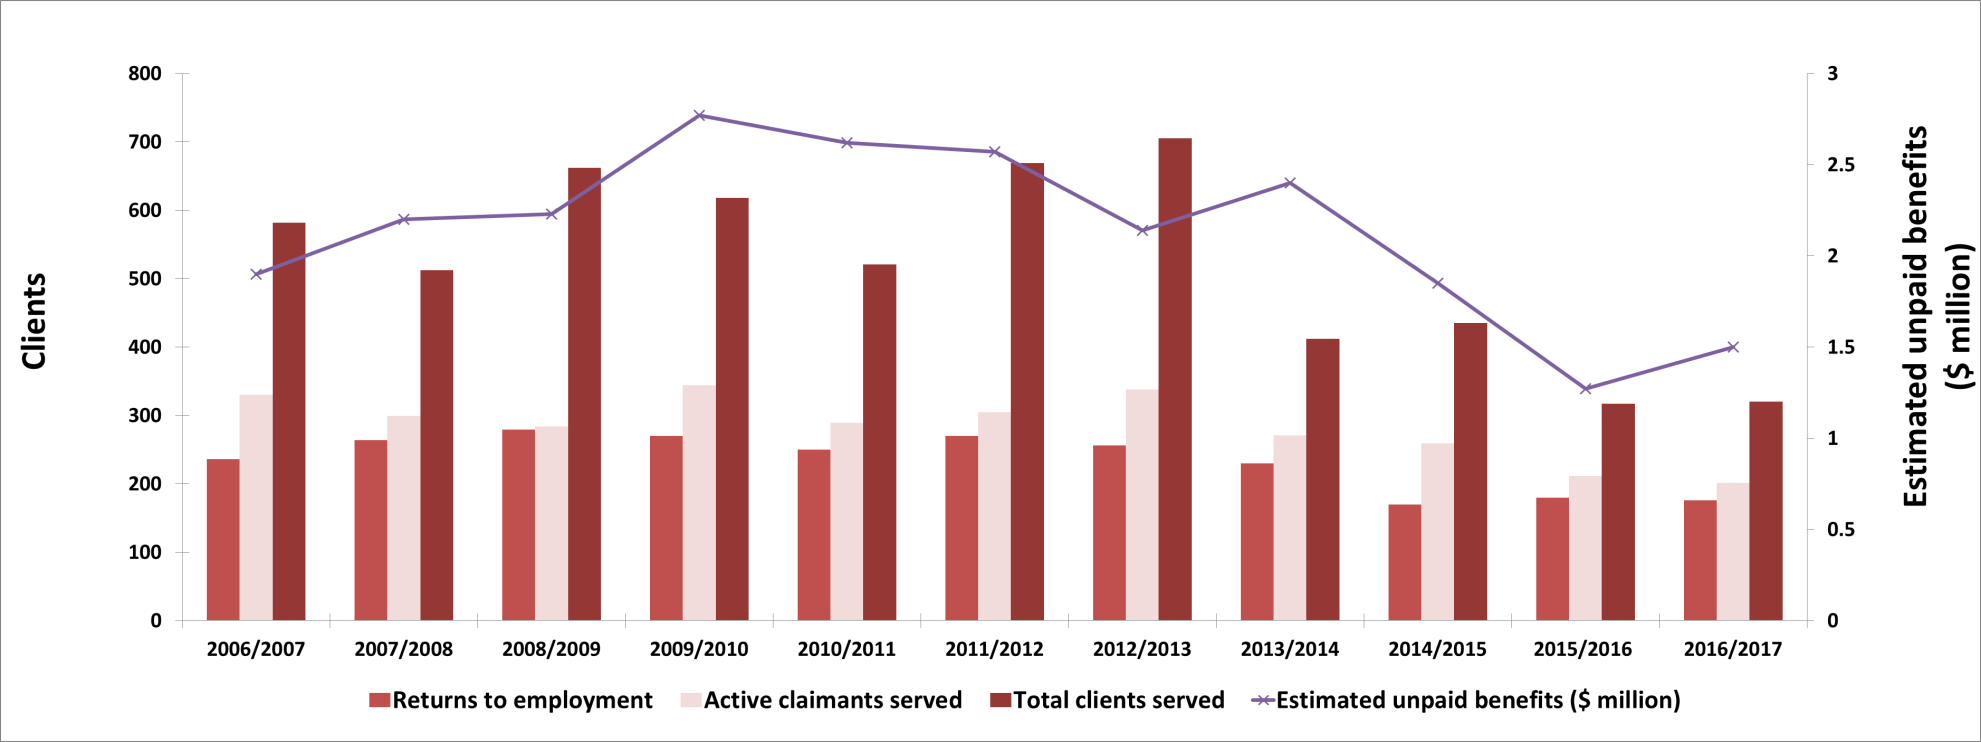
Show Data Table
| Returns to employment | Active claimants served | Total clients served | Estimated unpaid benefits ($ million) | |
|---|---|---|---|---|
| 2006-2007 | 236 | 330 | 582 | $1.90 |
| 2007-2008 | 264 | 299 | 512 | $2.20 |
| 2008-2009 | 279 | 284 | 662 | $2.23 |
| 2009-2010 | 270 | 344 | 618 | $2.77 |
| 2010-2011 | 250 | 289 | 521 | $2.62 |
| 2011-2012 | 270 | 305 | 669 | $2.57 |
| 2012-2013 | 256 | 338 | 705 | $2.14 |
| 2013-2014 | 230 | 271 | 412 | $2.40 |
| 2014/2015 | 170 | 259 | 435 | $1.85 |
| 2015-2016 | 180 | 211 | 317 | $1.27 |
| 2016-2017 | 176 | 201 | 320 | $1.50 |
| Interventions | Year-over-year change | Expenditures ($ 000s) |
||
|---|---|---|---|---|
| Employment Benefits | ||||
| SD-R | Skills Development Employment Benefit | 23 | -34.3% | 1,513 |
| SD-A | Skills Development Employment Benefit - Apprenticeship | 137 | -5.5% | |
| TWS | Targeted Wage Subsidies | 5 | +25.0% | 38 |
| SE | Self‑Employment | 0 | N/A | 0 |
| JCPs | Employment Programs | - | N/A | - |
| Support Measures | ||||
| EAS | Employment Assistance Services | 219 | +16.5% | 1,599 |
| LMPs | Labour Market Partnerships Employer-Sponsored Training | n/a | n/a | 114 |
| R and I | Research and Innovation | n/a | n/a | 187 |
Employment Benefits
For a fourth consecutive year, Employment Benefits interventions in Yukon decreased, reaching 165 in FY1617, a significant drop of 10.3% year-over-year.
- TWS expanded by 25.0% to 5 interventions;
- SD-R fell by 34.3% to 23 interventions; and
- SD-A fell by 5.5% to 137 interventions.
With a share of 83.0%, SD-A remained the most used Employment Benefits type. After rising the previous year, Employment Benefits expenditures declined by 23.7% to $1.6 million, in FY1617.
Support Measures: EAS
In FY1617, the total number of EAS interventions delivered in Yukon grew by 16.5% to 219. For a fourth consecutive year, Employment Services remained the only EAS-type delivered in Yukon. EAS expenditures grew from $1.4 million in FY1516 to $1.6 million (+12.5%) in FY1617, representing a fourth consecutive year of increase.
Sharlene's return to employment facilitated with EAS and SD assistance
Sharlene, a proud woman of Indigenous origins and mother of three, had only been able to secure low-paying, entry-level jobs. This meant that she was always first to experience layoffs due to work shortages. With the help of an EAS case manager, and two years of SD funding she obtained a double certification in Office Administration and Finance Administration at Yukon College. Upon completion and with additional job search assistance and resume development from the EAS service, she successfully obtained a full-time position with the Yukon Government.
Other Support Measures: LMPs and R&I
Following two years with no expenditures, the territory spent $114,000 for LMPs in FY1617.Moreover, R&I was funded for the first time, at $187,000, to support organizations whose applications demonstrated innovative approaches or applied research.
2.14 Nunavut
Nunavut's real GDP expanded by 1.8% in 2016. This growth was mostly supported by an increase in mining activity, particularly in iron ore. To a lesser degree, heightened activity in engineering construction, wholesale and retail trade, and health care and social assistance also contributed to this expansion. The territory's real GDP growth is expected to expand in 2017.
Nunavut: EBSM key facts
| EI clients | Non-insured clients |
|---|---|
| 211 |
628 |
| Interventions type | 2016-2017 | Year-over-year change |
|---|---|---|
| Employment Benefits | 327 | 31.7% |
| Support Measures: EAS | 826 | 13.5% |
| Interventions type | 2016-2017 | Year-over-year change (pp) |
|---|---|---|
| Employment Benefits | 28.4% | 5.0 |
| Support Measures: EAS | 71.6% | 5.0 |
| Total expenditures | 2016-2017 ($ million) | Year-over-year change |
|---|---|---|
| Employment Benefits | $1.9 | 22.8% |
| Support Measures: EAS | $0.2 | - |
| LMPs and R&I | $0.4 | - |
| Total expenditures1 | $2.1 | 15.2% |
| 2015-2016 | 2016-2017 | Year-over-year change |
|---|---|---|
| $0.62 | $1.15 | 85.5% |
- 1 Totals may not add up due to rounding; does not include accounting adjustments.
In FY1617, mirroring its healthy economic situation, labour market conditions continued to improve in Nunavut. Employment growth (+800; +5.9%) strengthened over the previous year, mainly in full-time positions, and has expanded in each but one of the past 12 years. The territory's unemployment rate dropped by 2.9 percentage points to 14.3%, as the number of unemployed declined.
Despite improving economic conditions and growing employment opportunities, Nunavut still faces several labour market challenges. This includes adverse outcomes for residents outside of Iqaluit and Inuit population. As Nunuvut's brighter economic outlook is dampened by persistently high unemployment rates, the territory's main labour market priority will be to offer a steady supply of qualified workers over a mid-term horizon for employers. This will be achieved by ensuring that its current and future labour force acquire skills for in-demand jobs, in particular, increasing the workforce participation of underrepresented groups, such as the Inuit, youth, women, immigrants and persons with disabilities.
Managing for results
To increase client participation in its EBSM-similar programming, Nunavut improves client service by monitoring and adjusting its service delivery model on a regular basis. To ensure all clients receive the best results from EAS, the Territory recently adjusted the intake process employed by field staff, resulting in more comprehensive service for clients. Regular consultations with employers and other partners resulted in program adjustments and improved communications. The first-ever, wide-ranging survey of Nunavut employers was conducted to fill in significant gaps in labour market information. Apprenticeship remains a top priority for the Territory and a recently completed review will result in new opportunities for apprentices and improved services to client and employers.
Clients, interventions and expenditures
Nunavut served 839 clients in FY1617, a decreased of 14.9% from the previous year. All three client-type counts decreased this fiscal:
- Active claimants fell by 7.9% to 116;
- Former claimants fell by 38.3% to 95; and
- Non-insured claimants fell by 11.0% to 628.
The shares of each client type changed slightly from last year,
- Non-insured clients received the largest share of interventions, 74.9%, an increase of 3.2 percentage points;
- Active claimants received 13.8% of the shares of interventions, an increase of 1.0 percentage point; and
- Former claimants received 11.3% of the shares of interventions, a decrease of 4.3 percentage points.
EBSM-similar interventions delivered in Nunavut dropped by 19.6% to 1,153 in FY1617, from 1,434 in the previous year. Employment Benefits accounted for 28.4% of declining shares of all interventions, compared to 33.4% in FY1516. The proportion of EAS interventions grew by 5.0 percentage points to 71.6%. In FY1617, a total of 75 clients were employed after participating in an EBSM-Similar programming. Unpaid benefits increased by 85.5% to $1.15 million. Despite receiving $118,858 of the total $125 million in additional LMDA funding announced in Budget 2016, total expenditures for EBSM-Similar programming fell by 15.2% to $2.1 million.
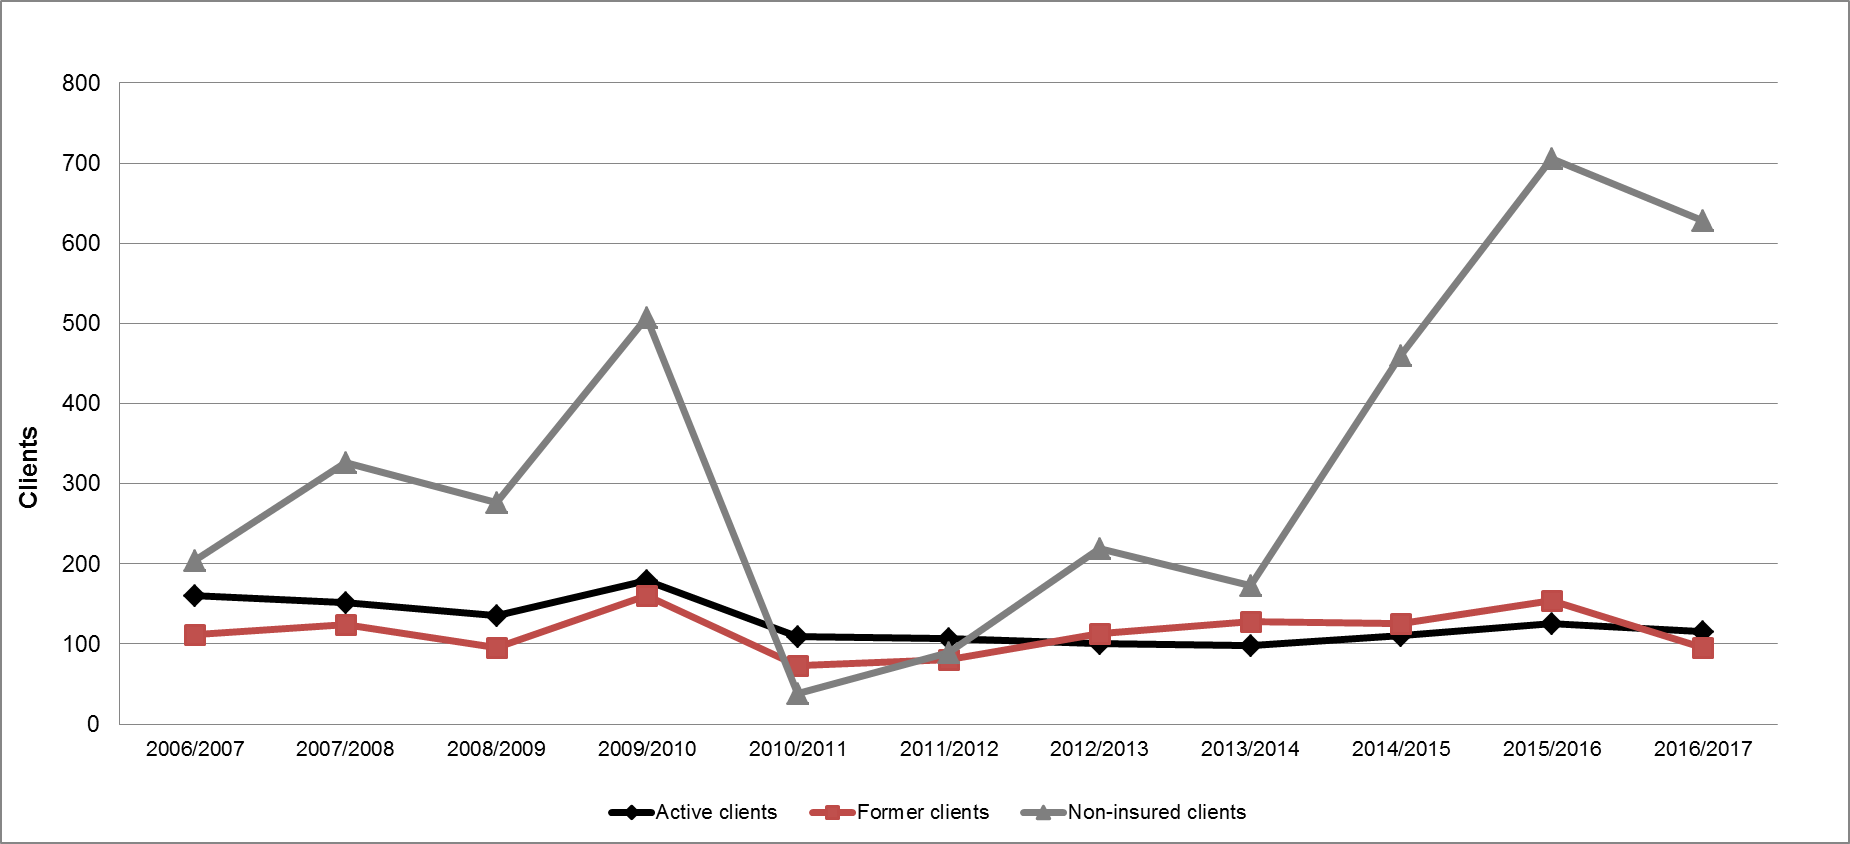
Show Data Table
| Active clients | Former clients | Non-insured clients | |
|---|---|---|---|
| 2006-2007 | 161 | 112 | 204 |
| 2007-2008 | 152 | 124 | 326 |
| 2008-2009 | 136 | 95 | 276 |
| 2009-2010 | 179 | 160 | 507 |
| 2010-2011 | 109 | 73 | 38 |
| 2011-2012 | 107 | 80 | 89 |
| 2012-2013 | 100 | 113 | 219 |
| 2013-2014 | 98 | 128 | 173 |
| 2014/2015 | 110 | 126 | 460 |
| 2015-2016 | 126 | 154 | 706 |
| 2016-2017 | 116 | 95 | 628 |
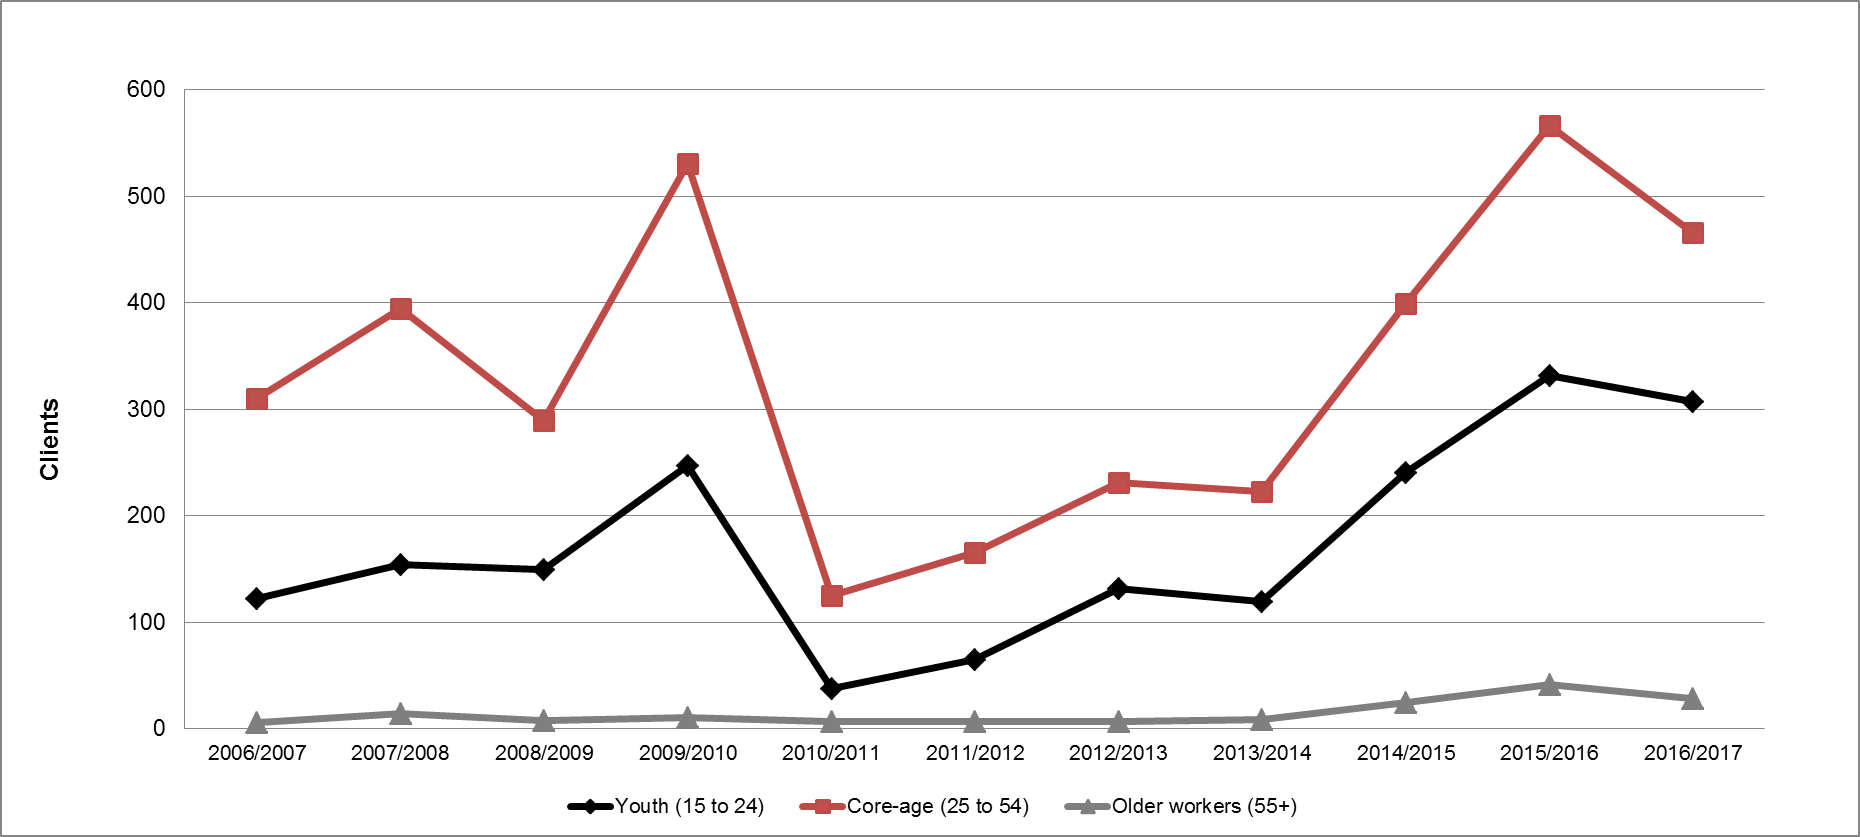
Show Data Table
| Youth (15 to 24) | Core-age (25 to 54) | Older workers (55+) | |
|---|---|---|---|
| 2006-2007 | 122 | 310 | 6 |
| 2007-2008 | 154 | 395 | 14 |
| 2008-2009 | 150 | 290 | 8 |
| 2009-2010 | 247 | 531 | 11 |
| 2010-2011 | 38 | 125 | 7 |
| 2011-2012 | 65 | 166 | 7 |
| 2012-2013 | 132 | 231 | 7 |
| 2013-2014 | 120 | 223 | 9 |
| 2014/2015 | 241 | 399 | 25 |
| 2015-2016 | 332 | 567 | 42 |
| 2016-2017 | 307 | 466 | 28 |
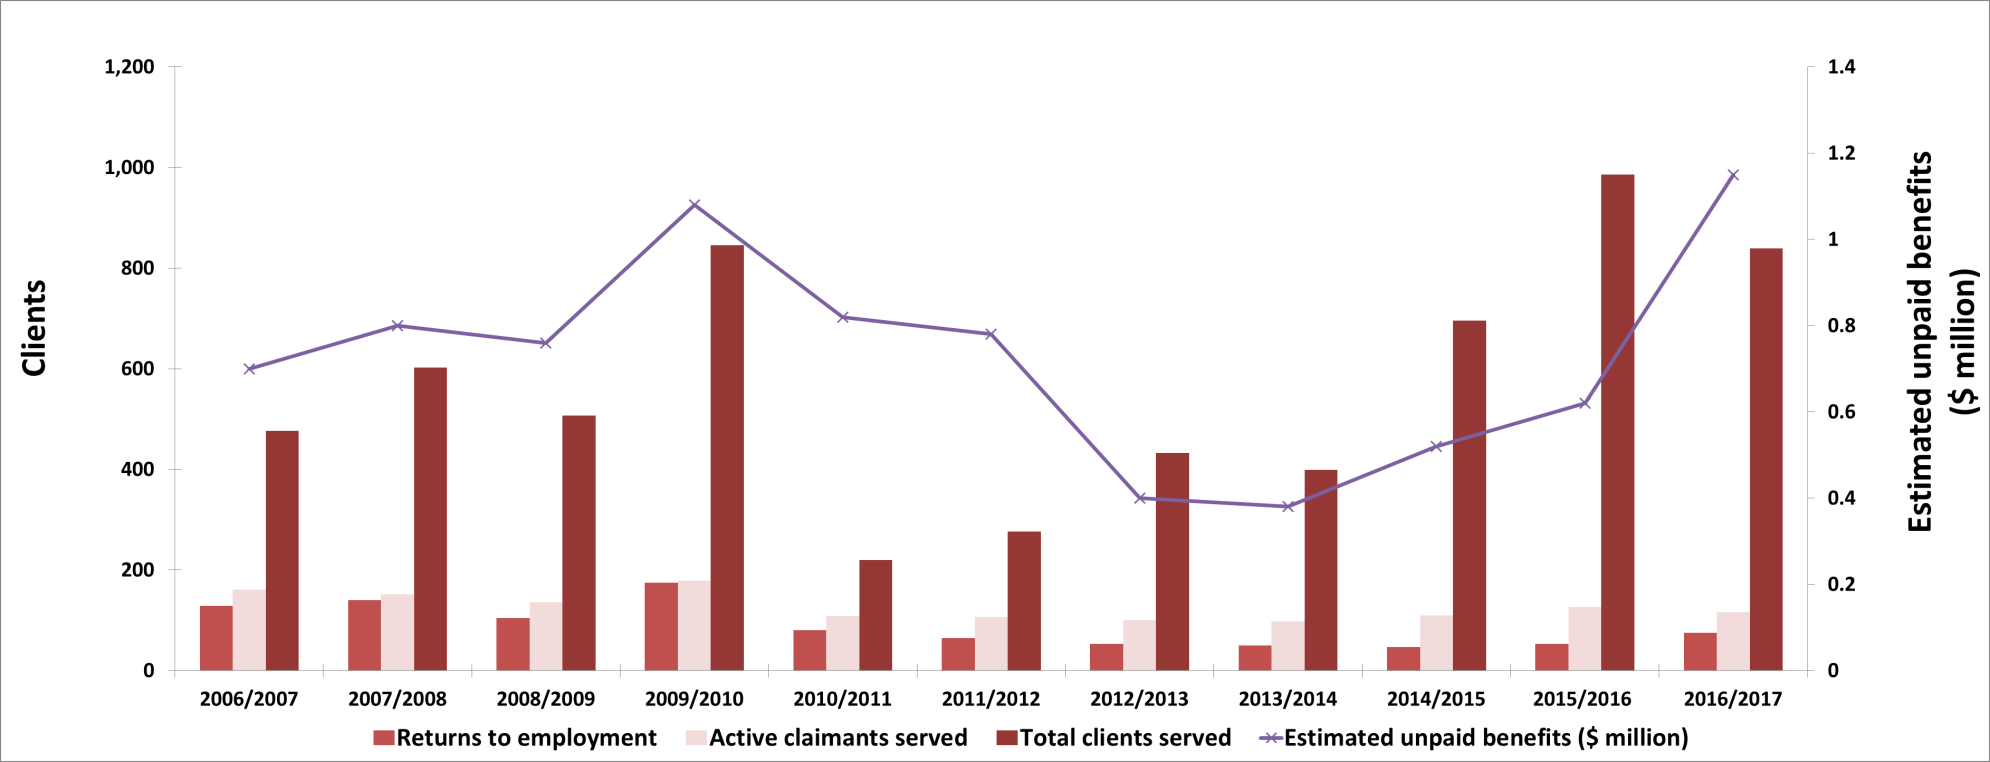
Show Data Table
| Returns to employment | Active claimants served | Total clients served | Estimated unpaid benefits ($ million) | |
|---|---|---|---|---|
| 2006-2007 | 129 | 161 | 477 | $0.70 |
| 2007-2008 | 140 | 152 | 602 | $0.80 |
| 2008-2009 | 104 | 136 | 507 | $0.76 |
| 2009-2010 | 175 | 179 | 846 | $1.08 |
| 2010-2011 | 80 | 109 | 220 | $0.82 |
| 2011-2012 | 65 | 107 | 276 | $0.78 |
| 2012-2013 | 53 | 100 | 432 | $0.40 |
| 2013-2014 | 50 | 98 | 399 | $0.38 |
| 2014/2015 | 47 | 110 | 696 | $0.52 |
| 2015-2016 | 53 | 126 | 986 | $0.62 |
| 2016-2017 | 75 | 116 | 839 | $1.15 |
| Interventions | Year-over-year change | Expenditures ($ 000s) |
||
|---|---|---|---|---|
| Employment Benefits | ||||
| SD-R | Adult Learning and Training Supports | 280 | -33.2% | 1,579 |
| SD-A | Adult Learning and Training Supports - Apprenticeship | 42 | -26.3% | |
| TWS | Training on the Job | 0 | - | 352 |
| SE | Nunavut Entrepreneurship Incentive | 5 | +66.7% | 10 |
| Support Measures | ||||
| EAS | Employment Assistance Services | 826 | -13.5% | 150 |
| LMPs | Target Training Initiatives | n/a | n/a | 43 |
| R and I | Research and Innovation | n/a | n/a | - |
Employment Benefits
The number of Employment Benefits interventions delivered in Nunavut reached 327 in FY1617, a decrease of 31.7% year-over-year.
- SD-R fell by 33.2% to 280 interventions;
- SD-A fell by 26.3% to 42 interventions; while,
- SE rose by 66.7% to 5 interventions.
- For a second consecutive year, TWS was not delivered in the territory.
With regard to their proportions, SD-R represented 85.6% of all Employment Benefits interventions, followed by SD-A at 12.8%. Employment Benefits expenditures went down by 22.8% to $1.9 million.
Support Measures: EAS
There were 826 EAS interventions delivered in Nunavut in FY1617, a 13.5% year-over-year drop. EAS expenditures totalled $150,000.
Other Support Measures: LMPs and R&I
Nunavut spent $43,000 in FY1617 on LMPs, following three years during which the territory did not include these measures as part of its active employment programming.
3. Evaluation of Employment Benefits and Support Measures (EBSM)
This section presents results from recent studies conducted as part of on-going LMDA evaluations and monitoring. The first part of the section summarises the main findings and conclusions from the second cycle of LMDA evaluations, including its recommendations and the corresponding management response. The second part discusses some of the links between LMDA-driven outcomes and a few indicators of well-being.
3.1 Impacts and effectiveness of Employment Benefits and Support Measures (EBSM): Main findings, conclusions, recommendations and management response from the second LMDA evaluation cycle
This sub-section presents consolidated findings and conclusions as well as recommendations from nine separate studies conducted as part of the 2012-2017 second cycle of LMDA evaluations. The LMDAs were evaluated by ESDC in partnership with twelve provinces and territories under the guidance of an Evaluation Steering Committee. As well, bilateral discussions took place as part of twelve bilateral Joint Evaluation Committees. One synthesis report at the national level was completed and publicly released in September 2017. Twelve bilateral evaluation reports are being completed and some are in the approval process. A mix of qualitative and quantitative methods were employed to address issues and questions related to the effectiveness, efficiency as well as design and delivery of various EBSMs delivered under the LMDAs.
Evaluation methodology
All quantitative analyses were based on administrative data from the EI Part I (EI claim data) and Part II (EBSM participation data) linked to the T1 and T4 taxation files from the Canada Revenue Agency. Incremental impact analyses and the cost-benefit analyses were based on up to 100% of participants in the reference period selected. Qualitative data was collected from key informant interviews with managers and service providers, questionnaires completed by provincial and territorial government representatives and a document/literature review.
Incremental impacts analysis
Five studies assessed program effectiveness by estimating incremental impacts from EBSM participation on participants' earnings from employment/self-employment, incidence of employment, use of EI or Social Assistance and dependence on income support after participation. The role of the incremental impact analysis is to isolate the effects of EBSM participation on participants' key labour market indicators from other factors such as the economic cycle. As shown in Chart 46, this is achieved by comparing key labour market indicators (for example, earnings) for participants before and after their participation, with those for non-participants before and after the same period.
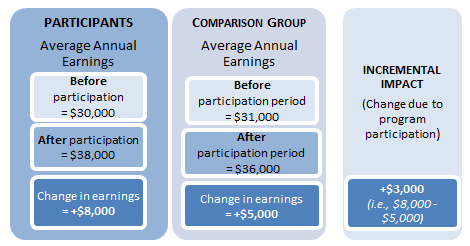
Show Data Table
- Participants
Average annual earnings- Before participation
= $30,000 - After participation
= $38,000 - Change in earnings
= +$8,000
- Before participation
- Comparison group
Average annual earnings- Before participation period
= $31,000 - After participation period
= $36,000 - Change in earnings
= +$5,000
- Before participation period
- Incremental impact
(Change due to program participation)- +$3,000
(i.e., $8,000 - $5,000)
- +$3,000
The matching of participants and comparison group members used up to 75 socio-demographic and labour market variables observed over five years before participation. Two different comparison groups were used to measure impacts for active and former EI claimants. For active claimants, the incremental impacts were measured relative to a comparison group of active claimants who were eligible to, but did not, participate in EBSMs during the reference period.
Former claimants can be underemployed and unable to requalify for EI, out of the labour force for various reasons or on Social Assistance. Based on previous evaluation methodologies, on expert advice and given the difficulty in generating a suitable comparison for former claimants using administrative data alone, the comparison group for former claimants was created using individuals who participated in Employment Assistance Services only during the reference period. This is a conservative approach given the fact that participation in Employment Assistance Services can lead to some positive labour market outcomes. In other words, the experience of former claimants who received Employment Benefits (such as, Skills Development, Targeted Wage Subsidies, Self-Employment and Job Creation Partnerships) was compared to the experience of former claimants who received low intensity employment services (that is, Employment Assistance Services only). Due to this difference in measurement, incremental impacts estimated for active claimant participants should not be directly compared to those of former claimant participants.Footnote 21
Cost-benefit analysis
Program efficiency was assessed through a cost-benefit analysis which compared the cost of participating in the program for the participants and the cost of delivering the program for the government to the benefits generated by the program. Overall, this analysis provided insights on the extent to which the program is efficient for the society (that is, for both the participants and the government). The costs and benefits accounted for in the calculations were as follows:
- Program cost: includes program and administration costs paid by the government.
- Marginal social costs of public funds: represent the loss incurred by society when raising additional revenues such as taxes to fund government programs.
- Employment earnings: consists of incremental impacts on participants' earnings during and after participation. The calculation accounts for the participant's forgone earnings during participation (in other words, opportunity cost). Employment earnings were also increased by 15% to account for fringe benefits such as the employer-paid health, life insurance and pensions contributions.
Qualitative data
Qualitative data were collected from key informant interviews with managers and service providers involved in EBSM planning and delivery, and a document/literature review. As well, questionnaires were completed by provincial/territorial government representatives regarding the Skills Development, Skills Development – Apprentices and Targeted Wage Subsidies studies. Table 17 provides the number of key informants interviewed.
| Studies | ||||
|---|---|---|---|---|
| Skills Development | Skills Development – Apprentices | Targeted Wage Subsidies | Employment Assistance Services | |
| Number of key informant interviews | ||||
| Managers | 25 | 30 | 21 | 33 |
| Service providers | 28 | 23 | 23 | 44 |
| Total | 53 | 53 | 44 | 77 |
| Number of participating provinces and territories in each study | 10 | 10 | 9 | 9 |
Strengths and limitations of the studies
One of the key strengths of the studies is that all quantitative analyses were based on administrative data rather than survey responses. Compared to survey data, administrative data are not subject to recall errors or response bias.
The propensity score models used to match participants and non-participants for the incremental impact analyses are judged to be robust in part because they were based on five years of pre-participation data and on a vast array of variables including socio-demographic characteristics, location, skills level related to last occupation and indicators of labour market attachment. Sensitivity analysis and the use of alternative estimation methods have increased confidence in the incremental impact estimates. However, one limitation with the propensity score matching techniques is that no one can be fully sure the impacts were not influenced by factors not captured in the data.
The cost-benefit analysis accounted for all quantifiable costs and benefits that are directly attributable to the EBSMs and could be estimated with the available administrative data. The analysis did not account for non-quantifiable benefits such as improvements in participant's wellbeing or for the multiplier effect of increased spending on the economy.
In some studies that relied on the use of qualitative data collection methods, the number of key informants interviewed was relatively small in some provinces and territories. Responses provided by key informants reflect their own experience and their own region, and therefore, may not be fully representative of the entire province or territory.
Overview of the studies summarized in this report
As previously indicated, findings presented in this report were drawn from nine separate studies carried out at the national level. These studies examined issues related to program effectiveness, efficiency, and design/delivery by using a mix of qualitative and quantitative methods. Each study examined evaluation issues in relation to active and former EI claimants.
Table 18 presents an overview of these studies, including the type of evidence generated, the methods used, the reference period and the length of the post-program period over which program effects were observed.
| Study | Evidence generated | Methods | Reference period | Observation period |
|---|---|---|---|---|
| Analysis of EBSM profile, Outcomes and medium-term incremental impacts for 2002-2005 participants (completed in 2014) |
|
|
2002-2005 participants | 7 years between 2002 and 2011 (That is, 2 years in program and 5 years post-program) |
| Effects of the timing of participation in Employment Assistance Services (completed in 2014) |
|
|
||
| Cost-benefit analysis of Employment Benefits and Support Measures (completed in 2016) |
|
|
8 years between 2002 and 2013 (That is, 2 years in-program and 6 years post-program) |
|
| Analysis of EBSMs profile, Outcomes and incremental impacts for 2007-2008 participants (completed in 2015) |
|
|
2007-2008 participants | 5 years between 2007 and 2012 (That is, 2 years in-program and 3 years post-program) |
| Analysis of EBSMs profile, outcomes, and incremental impacts for EI claimants category “Long-Tenured Workers” (completed in 2015) |
|
|
2007-2009 participants | 5 years between 2007 and 2013 (That is, 2 years in-program and 3 years post-program) |
| Study on Employment Assistance Services (Completed in 2014) |
|
|
Design and delivery at the time of the data collection in summer 2013 | |
| Study on Targeted Wage Subsidies (completed in 2015) |
|
|
Design and delivery at the time of the data collection in summer 2015 | |
| Study on Skills Development Regular (completed in 2016) |
|
|
||
| Study on Skills Development – Apprenticeship (completed in 2016) |
|
|
||
Key findings
Effectiveness and efficiency of EBSMs
Incremental impacts and cost-benefit analyses addressed EBSM effectiveness and efficiency. The incremental impacts summarized below are for the 2002-2005 cohort of EBSM participants.
Overall, incremental impacts demonstrate that LMDA programs and services are improving the labour market attachment of active and former EI claimant participants, including youth and older workers. As well, social benefits of participation exceeded the cost of investments for most interventions over time. Finally, providing Employment Assistance Services interventions earlier during an EI claim (first four weeks) produced larger impacts on earnings and employment and facilitated earlier return to work. This demonstrates the importance of targeting early participation of EI active claimants.
Program participants have a higher probability of being employed than comparison group members
Chart 47 presents the incremental impacts on the incidence of employment for active and former claimants by type of program. The estimates can be interpreted as a change in the probability of being employed following participation. For example, participation in Skills Development increases the probability of being employed by 4 percentage points for active EI claimants relative to non-participants.
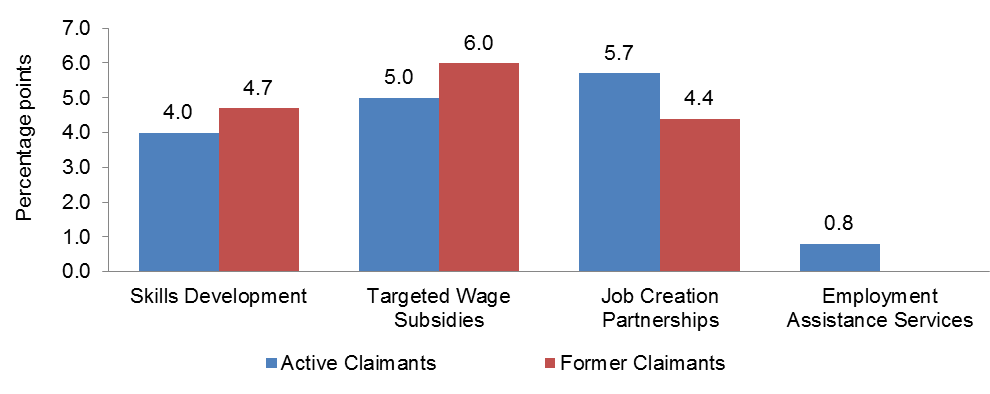
Show Data Table
| Percentage points | ||
|---|---|---|
| Active claimants | Former claimants | |
| Skills Development | 4.0 | 4.7 |
| Targeted Wage Subsidies | 5.0 | 6.0 |
| Job Creation Partnerships | 5.7 | 4.4 |
| Employment Assistance Services | 0.8 | n/a |
Increased earnings for participants compared to comparison group members
Chart 48 presents the cumulative increase in employment earnings for active and former claimants over the 5 years post-participation. It is noted that Employment Assistance Services are relatively modest activities and, by themselves, are not expected to lead to substantial effects on labour market outcomes. In other words, these services aim to support the return to work of unemployed participants and not necessarily to secure a better paying job than pre-participation. However, as demonstrated later in this sub-section, providing Employment Assistance Services earlier during the EI claim (first 4 weeks) produced larger impacts on earnings and employment and facilitated earlier returns to work.
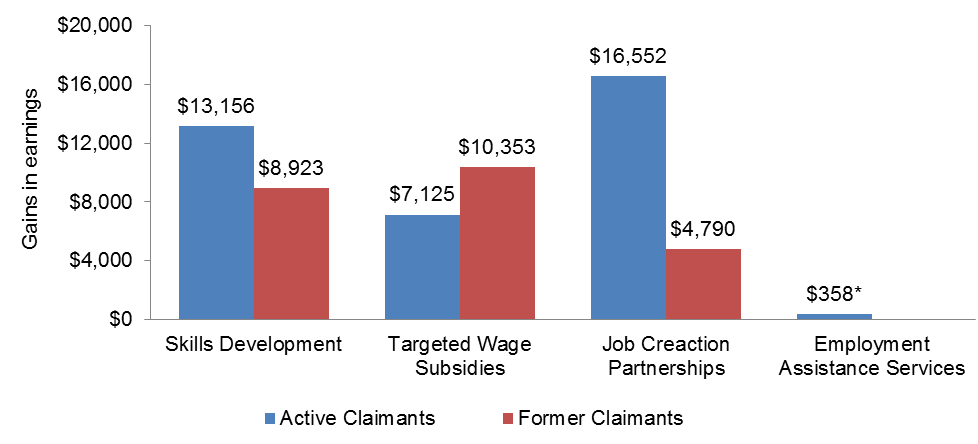
Show Data Table
| Gains in earnings | ||
|---|---|---|
| Active claimants | Former claimants | |
| Skills Development | $13,156 | $8,923 |
| Targeted Wage Subsidies | $7,125 | $10,353 |
| Job Creation Partnerships | $16,552 | $4,790 |
| Employment Assistance Services | $358 | NA |
- * The incremental impact on earnings for Employment Assistance Services participants is not statistically significant at the 95% level.
Earlier in Employment Assistance Services improves participants' labour market outcomes
The study on the effects related to the timing of participation showed that incremental impacts on earnings and employment were larger for individuals who participated exclusively in Employment Assistance Services early during their EI claim compared to non-participants and to individuals who remained longer on EI before receiving these services (see Chart 50 below and Table C in 3.3 Annex 1). Specifically, individuals who started their participation within four weeks following the start of their EI benefit period had a cumulative increase of $10,192 in their earnings over five years post-program and increases in their incidence of employment ranging between 0.9 to 2.6 percentage points per year.
Participants who received Employment Assistance Services between 5 and 8 weeks and those who started between 9 and 12 weeks after the start of their EI claim had cumulative increases in their earnings totalling $3,888 and $2,543 respectively over the post-program period. The increases in earnings for participants who started between 5 and 8 weeks were accompanied by statistically non-significant impacts on incidence of employment. Participants who started between 9 and 12 weeks had decreases in their incidence of employment after participation. The participants who started participation during the second and third quarters of their EI claim generally had decreases in their employment earnings and incidence of employment after participation.
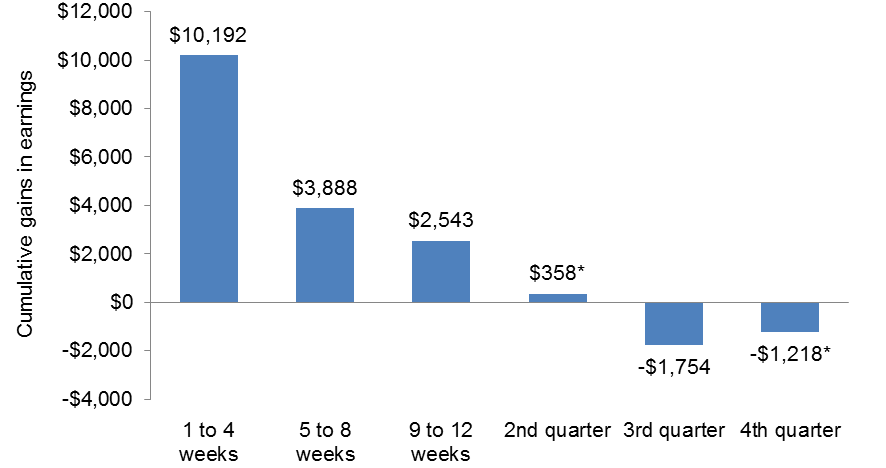
Show Data Table
| Cumulative gains in earnings | |
|---|---|
| 1 to 4 weeks | $10,192 |
| 5 to 8 weeks | $3,888 |
| 9 to 12 weeks | $2,543 |
| 2nd quarter | $358* |
| 3rd quarter | -$1,754 |
| 4th quarter | -$1,218* |
- * The estimates are not statistically significant at the 95% confidence level.
As well, the study looked at the difference between the number of EI weeks unused by participants and the number of EI weeks unused by their comparison group in order to determine the effect of the timing of participation in Employment Assistance Services on the return to employment. It was found that only those who received assistance within the first four weeks of their claim returned to employment faster than the comparison group. Specifically, they returned to employment 3 weeks earlier than the comparison group. Participants who received assistance after the fourth week of their EI claim returned to employment 0.5 to 3.5 weeks later than the comparison group (see Table 3).
| Cohorts | 1–4 Weeks | 5–8 Weeks | 9–12 Weeks | 2nd Quarter | 3rd Quarter | 4th Quarter |
|---|---|---|---|---|---|---|
| Time of return to employment | 2.9wks*** | -0.5wks*** | -1.9wks*** | -3.3wks*** | -3.5wks*** | -3.0wks*** |
- * Significant at 10%;
- ** significant at 5%;
- *** significant at 1%
The use of EI is reduced for most active claimants. While EI use increased for former claimants, it can be argued that this reflects an increase in labour market attachment since the incremental impacts on employment earnings and incidence of employment are positive and given the decrease in the use of social assistance.
As shown in Chart 50, active EI claimants who participated in Skills Development, Job Creation Partnerships and Employment Assistance Services decreased their use of EI compared to similar non-participants. It is not surprising to observe an increase in EI use for active claimants who participated in Targeted Wage Subsidies since participants build entitlement to EI while working. Active claimants decreased their use of social assistance benefits with the exception of participants in Employment Assistance Services. However, as previously stated, the relatively modest activities provided under Employment Assistance Services are not expected to lead to substantial effects on participants' labour market outcomes.
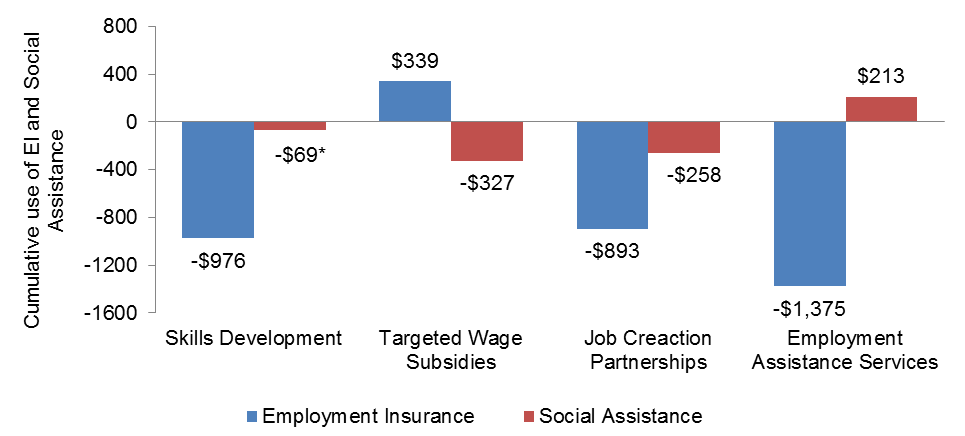
Show Data Table
| Cumulative use of EI and Social Assistance | ||
|---|---|---|
| Employment Insurance | Social Assistance | |
| Skills Development | -$976 | -$69* |
| Targeted Wage Subsidies | $339 | -$327 |
| Job Creation Partnerships | -$893 | -$258 |
| Employment Assistance Services | -$1,375 | $213 |
- * The incremental impact on Social Assistance use for active claimants who participated in Skills Development is not statistically significant at the 95% level.
As shown in Chart 51, former claimants who participated in the program between 2002 and 2005 increased their use of EI following participation. This indicates the inability of some former claimants to maintain the employment secured in the short-term. It can also be argued that the increase in EI use is an indication of increase labour market attachment for this client group since they did experience increases in employment earnings and incidence of employment as well as a decrease in the use of social assistance. As a reminder, former claimants are participants for whom the EI benefit period ended up to three years pre-participation.
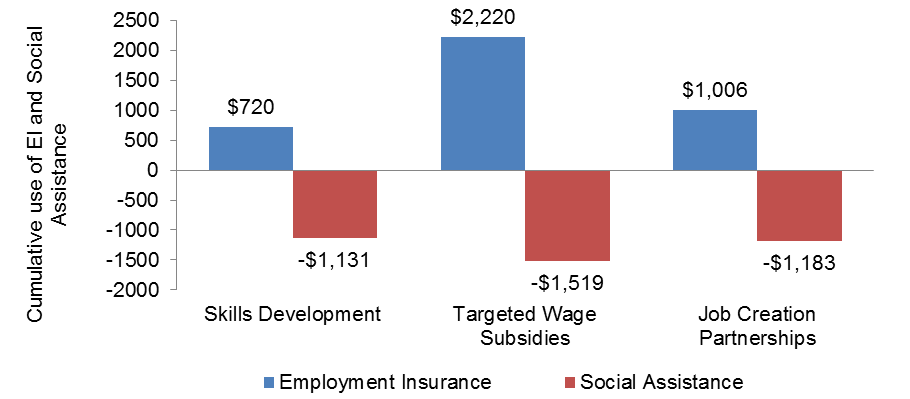
Show Data Table
| Cumulative use of EI and Social Assistance | ||
|---|---|---|
| Employment Insurance | Social Assistance | |
| Skills Development | $720 | -$1,131 |
| Targeted Wage Subsidies | $2,220 | -$1,519 |
| Job Creation Partnerships | $1,006 | -$1,183 |
Social benefits of participation exceeded costs of investments for most interventions.
Table 20 presents the number of years required for the social benefits to exceed program cost. Social benefits to participation exceeded investment costs in a period ranging between the 2nd year of program participation to about 10 years after participation. This excludes former claimants who participated in Job Creation Partnerships for whom the investment costs are not likely to be recouped before 25 years. However, this group represented only 0.3% of new EBSM interventions in 2014-2015.
| Skills Development | Targeted Wage Subsidies | Job Creation Partnerships | Employment Assistance Services | |
|---|---|---|---|---|
| Active claimants | 7.4 | 5.9 | 5.9 | 10.9 |
| Former claimants | 8.6 | 2nd participation year |
Over 25 years | n/a |
Lessons learned about Program Design and Delivery
Key informant interviews with service providers and program managers as well as the documents and literature reviewed, and the questionnaires filled by provincial/territorial representatives also generated a few lessons about program design and delivery:
Skills Development
Key informants confirmed that most provinces and territories take steps to direct Skills Development funding towards training for occupations in demand in the labour market. In particular, as part of the application process, prospective participants have to justify their choice of training program by demonstrating that labour market demand exists. Five provinces/territories may not approve applications for training leading to employment in low demand occupations.
According to key informants, the main challenges related to Skills Development include:
- Lack of capacity to case manage and monitor individuals facing multiple barriers to employment
- Access to the program is limited due to the EI eligibility criteria
- Participant's ability to access and complete training is often limited by a lack of essential skills, learning disabilities, literacy issues and other factors such as living in remote locations and lack of transportation
- Unemployed individuals lack awareness about the program and early engagement of EI claimants is difficult since Service Canada does not refer recent claimants to provincial/territorial offices
Skills Development for Apprentices
Existing Canadian literature showed that there is a fairly high non-completion rate among apprentices (40 to 50%).Footnote 22 Furthermore, subject matter literature revealed that despite the growth in apprenticeship registrations in Canada, there has not been a corresponding increase in completion rates.Footnote 23 While it is not possible with available data to generate a reliable estimation of the completion rate of Skills Development – Apprentices participants, key informants involved in apprenticeship delivery confirmed the stagnation in completion rates.
According to key informants, apprenticeship drop-out is due to factors such as low level of essential skills, financial difficulties (for example, not being able to live on EI benefits while on training) and delays in getting EI benefits (for example, EI eligibility is not confirmed until training is almost complete).
Targeted Wage Subsidies
Key informants confirmed that participation in Targeted Wage Subsidies can be driven by either unemployed individuals or employers looking to fill a new position. Key informants also confirmed that in most provinces and territories covered by the evaluation, the subsidized employers are generally hiring those they would not have otherwise hired without the help of the program.
While evaluation results have demonstrated the effectiveness of Targeted Wage Subsidies, its use has been falling in recent years. According to the EI Monitoring and Assessment Reports, the proportion of new Targeted Wage Subsidies interventions decreased from 3% to 1% of all new interventions between 2002 to 2003 and 2014 to 2015. Reasons identified by key informants to explain this decline include:
- The frequent and time consuming reporting requirements for the employers
- Lack of awareness about the program among employers
- Employers having a negative perception of the quality of the candidates
- Difficulty in matching employers' needs to the skills of available candidates
Employment Assistance Services
According to key informants, challenges with the design and delivery of Employment Assistance Services include:
- Lack of awareness about Employment Assistance Services among potential participants.
- Current budget allocation is not enough to support the delivery of Employment Assistance Services and has led some service providers to eliminate services.
- Service providers cannot provide all the services needed for participants facing multiple barriers to employment. They have to refer these individuals to other organizations.
Recommendations
A total of 9 recommendations emerge from the evaluation findings. They are as follows:
- The study on the timing of Employment Assistance Services participation showed that receiving assistance early after starting an EI claim can lead to better labour market impacts. However, key informants repeatedly reported a lack of awareness about the program.
- Recommendation 1: Consideration should be given to providing provinces and territories with timely access to data on new EI recipients for supporting targeting and increasing awareness.
- Recommendation 2: Since ESDC has access to Records of Employment and EI data, it should explore what active role it could play in raising program awareness among new EI recipients.
Response: This evaluation shows that interventions with EI clients in the first four weeks of an EI Part I claim results in significant positive impacts on earnings and employment. ESDC has been sharing EI client data with Quebec since 1999 to promote early interventions in that province and, with the advent of electronic EI applications, a Targeting, Referral and Feedback system was developed in 2006 for this purpose. Using the Targeting, Referral and Feedback system, P/Ts can strategically target and contact EI applicants, in order to refer them to a job or offer employment programs and services early in their claim.
Pilot projects with British Columbia and Manitoba were ran to test the impact of early interventions in the delivery of active measures on EI claimants. British Columbia then launched the province-wide implementation of its Targeting, Referral and Feedback initiative in the fall of 2016. In this context, ESDC continues to work with interested P/Ts to implement and use the Targeting, Referral and Feedback system, to facilitate the provision of employment supports to EI applicants, and to study the impacts of such measures.
ESDC and Service Canada will continue to work together to raise awareness of the programs and services available to EI applicants. ESDC will also support the sharing of information and best practices from provinces, territories and various stakeholders involved in the delivery of active programming.
- Key informants reported that lack of essential skills, learning disabilities and literacy issues are common barriers to accessing and completing training.
- Recommendation 3: Consideration should be given to remove barriers to accessing and completing training such as literacy/essential skills training and learning disability assessments. The measures would help individuals with multiple barriers to prepare for vocational training and to reintegrate the labour market. The measures should be reported separately from other Skills Development interventions given their unique objectives.
Response: As part of the Government of Canada's commitment to modernize labour market transfers, ESDC is working to provide P/Ts with more flexibility under the LMDAs, in order to better target unemployed Canadians who need access to skills and training programs. ESDC will also explore with P/Ts the possibility of collecting more detailed intervention types under the Skills Development program.
- Incremental impact results show that Targeted Wage Subsidies is improving the earnings and employment of participants. However, its use has been falling over the years. According to key informants, the decline is related to employers not using the program due to the administrative processes, lack of awareness about the program and difficulty in finding suitable candidate.
- Recommendation 4: Provinces and territories should explore ways of removing barriers to employer participation in Targeted Wage Subsidies.
Response: The Skills and Employment Branch will discuss the design and delivery of Targeted.
Wage Subsidy programs with P/Ts in the context of the renewal of the labour market transfer programs.
- Key informants confirmed the necessity of having labour market information to support the delivery of Employment Assistance Services. They, however, pointed to the difficulty of accessing or producing labour market information at the regional/local level.
- Recommendation 5: Consideration should be given to enhance the capacity of service providers to access or produce, when needed, relevant labour market information.
Response: Recognizing that timely, reliable, comprehensive and easily accessible labour market information is critical to determining and continuing to meet labour market needs, in July 2015 labour market ministers from across Canada endorsed the creation of a new labour market information Council and a complementary new National Stakeholder Advisory Panel. Through this approach, governments and stakeholders will work together to ensure all Canadians, including students, businesses, workers and educators, have access to unbiased information they need to make informed decisions.
In addition, ESDC continues to strengthen the labour exchange function through the national Job Bank, and supports the development of new, more granular labour market information that will help P/Ts in their calibration of labour market programming.
- The evaluation was not able to produce a conclusive assessment of Self-Employment effectiveness and efficiency since the data used to assess impacts on earnings may not be the best source of information available to reflect the financial wellbeing of the participants. As well, little is known about the design and delivery of this program. Overall, it is not clear whether participant's success in improving their labour market attachment through self-employment is more closely associated with their business idea and their entrepreneurship skills than the assistance provided under Self-Employment.
- Recommendation 6: Consideration should be given to examine in more detail the design and delivery of Self-Employment and whether the performance indicators for this program are appropriate.
Response: ESDC will work closely with P/Ts, through the LMDA Evaluation Steering Committee, to carry out specific studies on the design and delivery of these two programs.
- Job Creation Partnerships was found to be particularly effective at improving earnings and incidence of employment of active claimants. However, the evaluation has not yet examined the design and delivery of this program. Therefore, a lot remains unknown about how this program operates and the factors that contribute to its effectiveness.
- Recommendation 7: Consideration should be given to examine the design and delivery of Job Creation Partnerships in order to better understand how this program operates.
- Overall, the LMDA evaluation was able to produce a sound assessment of EBSM effectiveness and efficiency because the team had access to rich data on EI claimants and was capable of linking them to EBSM participation data and Canada Revenue Agency taxation files. However, some data gaps limited the evaluation's ability to assess how EBSMs operate.
- Recommendation 8: Improvements in the data collection is recommended to address key program and policy questions of interest to the federal and provincial/territorial governments. Specifically:
- Mandatory reporting of the highest level of education as part of the EI claim application.
- Collect data on whether participants are members of designated groups including Indigenous peoples, persons with disabilities and recent immigrants.
- Collect data on the type of training funded under Skills Development and the type of assistance provided under Employment Assistance Services. ESDC should work with provinces and territories to define common categories for both EBSMs.
- Collect detailed data on the cost of interventions.
- ESDC should consider securing access to provincial/territorial social assistance records in order to enrich the administrative data with patterns of social assistance use for participants and non-participants.
- The data assessment process revealed some gaps regarding data quality and integrity. These documented gaps can be addressed by defining clear roles and responsibilities.
- Recommendation 9: Considerations should be given to assign responsibility for a specific unit within ESDC to manage data integrity, including validating data uploads and documenting changes over time.
Response: ESDC will work with P/Ts, under renewed labour market development agreements, to strengthen performance measurement and update data exchange agreements, including improving data collection. More precisely, efforts will be devoted to improving the integrity and granularity of LMDA administrative data on client characteristics, interventions and costs, as recommended in the evaluation report. Improved LMDA data will lead to better program design, management and delivery of LMDA programming, as well as improved comparability across P/Ts.
3.2 The Impacts of Labour Market Development Agreements on well being
Overview of LMDAs and well-being
Labour Market Development Agreements' (LMDAs) Employment Benefits increase employment and benefit clients and the economy. Using descriptive statistics, this sub-section expands on existing analysis to examine the effects of LMDAs on well-being. In particular, it addresses whether LMDAs provide the tools to enable active EI claimants to catch up to national median wages and earn wages above low income thresholds, thereby improving quality of life. This section is preliminary, exploratory research, to investigate possibilities of further research in this area.
Methodology
General outcomes for active claimants who participated in LMDAs from 2002 to 2005, and 2010 to 2011, were examined with respect to closing the gap with the middle-class, and leaving low income levels.
General outcomes from active claimants who participated in LMDAs between 2010 to 2011, and 2002 to 2005, are examined against national median wages and low income measures, to assess whether or not LMDAs can improve well-being. The 2002 to 2005 cohort is used in Cycle II to evaluate the incremental impacts of LMDAs as presented in Section 3.3.1.
Only cohorts of active clients are selected for this analysis. This decision is based on larger sample sizes and better matches to key individual and labour market characteristics that are currently observed in the Canadian labour market (age, gender, underrepresented labour market group, occupation, and skill level). Cohorts of former clients are excluded.
Analysis of well-being
Three categories of indicators are used in this section to measure well-being, including the Labour Force Survey (LFS), Low income cut-offs (LICO) and Low income measures (LIM). See Definitions box below for more information. National median wages from the LFS are indexed as a reference line to measure the growth rate of earnings pre- and post- LMDA intervention. The decision to use two low income indicators provides a more comprehensive picture of income inequality. While both measures differ, their individual strengths complement each other and, used cumulatively, provide a more in-depth portrait on low income.
To control for inflation, all dollar amounts are adjusted to 2015 constant dollars. To match the program periods, indicators used for the 2010 to 2011 cohort are adjusted to 5 quarter moving averages (January 2010 to April 2011), while those used for the 2002 to 2005 cohort are adjusted to 3 year moving averages (fiscal years starting in April to March of the following calendar years). Indicators are then indexed to inflation in order to examine growth rates. The analysis is based mainly on the 2010 to 2011 cohort, supplemented by the 2002 to 2005 cohort for Job Creation Partnership (JCP) interventions.
The model for wage gap analysis for LMDAs follows gender-pay gap model format generally used in New Zealand, Australia and New Brunswick. The wage gap is the difference between national median earnings and those of LMDA participants (expressed as “LMDA” in the equation below), expressed as a percentage of national earnings.
LMDA wage gap = [(median wage – LMDA)/median wage] * 100.
Caveats
- The program period for claimants who only received EAS interventions are shorter than for claimants who participated in other employment programs. The timeframe for claimants who have EAS is just one period, versus other interventions that require multiple periods.
- When interpreting LICO, community size determines income thresholds. The low income threshold is higher in larger communities, compared to smaller ones, due to lower costs of living in smaller communities. Once indexed, however, community size does not affect the growth rate of LICO over time.
- Outcomes in well-being can be due to many factors. While there could be a correlation between program participation and outcomes, the methodology in Section 3.2 does not allow outcomes to be unequivocally attributed to LMDAs. The analysis in Section 3.1 provides results for which all impacts can be attributed solely to LMDAs.
- As there is no information on family demographics from LMDA participants, this analysis uses LICO based on a one-person family size. This measure may be conservative for some participants who live with dependents.
Definitions
Low income cut-offs (LICO)
LICO are income thresholds where a family will likely spend 20 percentage points more than an average family (43%) on food, shelter, and clothing. This analysis incorporates a one-person family size, after-tax, to match with individuals participating in LMDAs. LICOs estimates are available for 7 family sizes, with 5 different community sizes. This threshold is based on the 1992 Family Expenditures Survey (Statistics Canada), and is calculated with both before-tax cut-offs and after-tax cut-offs, expressed in current dollars, indexed to CPI. Statistics Canada calculates LICO as the natural logarithm of spending on food, shelter, and clothing as a function of the natural logarithm of income, family-size, population size of the area of residence and region.
Low income measures (LIM)
Developed by Statistics Canada as a compliment to LICO, LIM is a comparison of individual income relative to society. As LIM does not depend on country-specific consumption, it is used for international comparisons. The OECD uses a version of a LIM methodology to report on international low income. It is a fixed percentage (50%) of median adjusted householdFootnote 24 income, accounting for household needs. LIMs are calculated annuallyFootnote 25 on the Canadian Income Survey. Therefore they do not require updating with an inflation index. As defined by Statistics Canada (2016), “The concept underlying the LIM is that all persons in a household have low income if their adjusted household income falls below half of the median adjusted income. The household income is adjusted by an equivalence scale to take economies of scale into account. This adjustment for different household sizes reflects the fact that a household's needs increase, but at a decreasing rate, as the number of members increases. The adjustment factor, also known as the equivalence scale, is the square root of the number of persons in the household.”
Employment Benefits improve earnings and well-being
Employment Benefits improve well-being of participants and helps reduce income inequality.
Median wage
Earnings for active EI claimants increased after participation in LMDA programming, and start to narrow the gap with national median wages. The growth rate of earnings for active claimants, who participated in Skills Development (SD) programming from 2010 to 2011, grew faster than national median wages, surpassing the growth of median wages within the first year post-program. By the second year after intervention, SD participants exceeded their highest pre-program earnings by 5.1%, from $22,768 two-years pre-program to $23,919 two-years post-program (3.3 Annex 2, Table 22). Five years prior to program participation, the wage gap between SD participants and median wages was 51.5% ($18,811 for SD earnings from $38,801 median annual wages). Three years after participating in skills development programs, this closed to 41.5% ($24,403 for SD earnings from $41,714 for median annual wages). This pattern appeared to be stronger in the 2002 to 2005 cohort (Table 21) , where disparities in wages decreased within five years after program participation (3.3 Annex 2, Table 23):
- SD decreased by 26.5 percentage points, from 52.3% five-years pre-program to 25.8% five-years post-program;
- Job Creation Partnerships (JCP) decreased by 25.4 percentage points, from 59.1% five-years pre-program to 33.7% five-years post-program; and
- Targeted Wage Subsidies (TWS) decreased by 13.0 percentage points, from 49.6% five-years pre-program to 36.7% five-years post-program.
In general, post participation impacts will be stronger for the 2002 to 2005 cohort, since it covers five years rather than three.
| Pre-program period | Program period | Post-program period (Employment Benefits only) | ||||||||||
|---|---|---|---|---|---|---|---|---|---|---|---|---|
| 5 yrs pre | 4 yrs pre | 3 yrs pre | 2 yrs pre | 1 yr pre | Start year | 1 yr post start year (EAS-only) | 1 yr post start year | 2 yrs post start year | 3 yrs post start year | 4 yrs post start year | 5 yrs post start year | |
| 1997 to 2000 | 1998 to 2001 | 1999 to 2002 | 2000 to 2003 | 2001 to 2004 | 2002 to 2005 | 2003 to 2006 | 2004 to 2007 | 2005 to 2008 | 2006 to 2009 | 2007 to 2010 | 2008 to 2011 | |
| SD | $18,399 | $19,574 | $20,861 | $23,118 | $24,128 | $13,608 | $15,912 | $23,476 | $27,171 | $29,154 | $30,163 | $30,354 |
| TWS | $19,426 | $20,238 | $21,037 | $22,428 | $23,255 | $17,183 | $21,189 | $23,191 | $24,580 | $26,098 | $26,099 | $25,923 |
| JCP | $15,774 | $16,880 | $17,679 | $19,558 | $19,765 | $11,267 | $16,224 | $22,410 | $24,689 | $26,273 | $26,948 | $27,130 |
| EAS-only | $21,938 | $23,330 | $24,718 | $26,773 | $28,059 | $18,221 | $20,812 | $24,282 | $26,064 | $27,250 | $27,189 | - |
| Median annual wages | $38,556 | $38,821 | $38,943 | $38,934 | $38,718 | $38,513 | $38,548 | $38,852 | $39,319 | $39,852 | $40,498 | $40,924 |
| LIM | $16,904 | $17,419 | $17,912 | $18,262 | $18,492 | $18,646 | $18,878 | $19,236 | $19,717 | $20,248 | $20,664 | $20,890 |
| LICO population 500 000 and over | $20,386 | $20,386 | $20,386 | $20,385 | $20,385 | $20,385 | $20,386 | $20,386 | $20,386 | $20,386 | $20,386 | $20,386 |
- Notes:
- Median annual wages, LFS, LICO, and LIM are 3 year moving averages
- Low-income cut-offs (LICO) are income thresholds where a family will likely spend 20 percentage points more than average family (43%) on food shelter and clothing. One-person family size after-tax.
- Low-income measures (LIM) after tax are a fixed percentage (50%) of median adjusted household income where household needs are taken into account.
- EAS-only does not have an extended program period. One year post start period is outside of the program period.
- Sources:
- Analysis of Employment Benefits and Support Measures (EBSM) Profile Outcomes and Medium-Term Incremental Impacts from 2002 to 2011, Employment and Social Development Canada
- Table 326-0021 Consumer Price Index (CPI), Statistics Canada
- Table 282-0071 Labour Force Survey, Statistics Canada
- Table 206-0094 Low income cut-offs (LICOs) before and after tax by community and family size in current dollars, Statistics Canada
- Table 206-0091 Low income measures (LIMs) by income source and household size in 2015 constant dollars, Statistics Canada
Table 21 examines the well-being of active EI claimants, who participated in LMDA programming between the years of 2002 to 2005. Earnings of claimants are assessed against a proxy of well-being, comprised of national median wages, low-income measures (LIM), and low-income cut-offs (LICO). Well-being is observed for three periods of time: the pre-program period (one to five years before starting interventions), the program period (start year, duration of the program / 1 year post-start year for EAS-only clients), and the post-program period (one to five years after intervention). Fiscal years (April 1 to March 31) are included for reference.
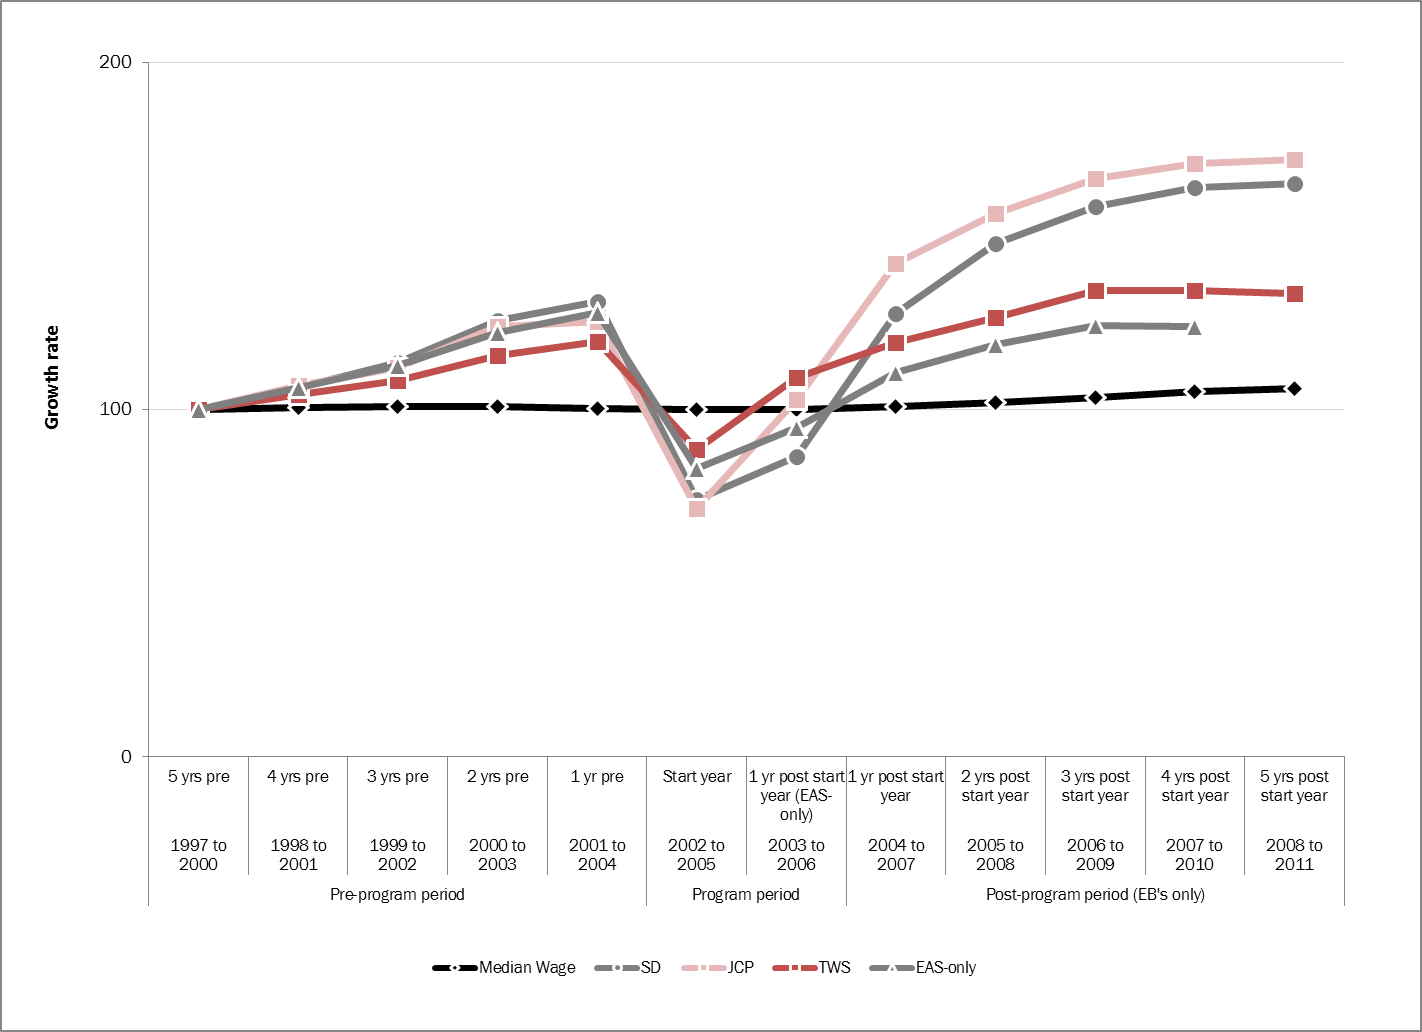
Show Data Table
| Pre-program period | Program period | Post-program period (EB's only) | ||||||||||
|---|---|---|---|---|---|---|---|---|---|---|---|---|
| 1997 to 2000 | 1998 to 2001 | 1999 to 2002 | 2000 to 2003 | 2001 to 2004 | 2002 to 2005 | 2003 to 2006 | 2004 to 2007 | 2005 to 2008 | 2006 to 2009 | 2007 to 2010 | 2008 to 2011 | |
| 5 yrs pre | 4 yrs pre | 3 yrs pre | 2 yrs pre | 1 yr pre | Start year | 1 yr post start year (EAS-only) | 1 yr post start year | 2 yrs post start year | 3 yrs post start year | 4 yrs post start year | 5 yrs post start year | |
| SD | 100 | 106.4 | 113.4 | 125.6 | 131.1 | 74.0 | 86.5 | 127.6 | 147.7 | 158.5 | 163.9 | 165.0 |
| TWS | 100 | 104.2 | 108.3 | 115.5 | 119.7 | 88.5 | 109.1 | 119.4 | 126.5 | 134.3 | 134.4 | 133.4 |
| JCP | 100 | 107.0 | 112.1 | 124.0 | 125.3 | 71.4 | 102.9 | 142.1 | 156.5 | 166.6 | 170.8 | 172.0 |
| EAS-only | 100 | 1063 | 112.7 | 122.0 | 127.9 | 83.1 | 94.9 | 110.7 | 118.8 | 124.2 | 123.9 | |
| Median Wage | 100 | 100.7 | 101.0 | 101.0 | 100.4 | 99.9 | 100.0 | 100.8 | 102.0 | 103.4 | 105.0 | 106.1 |
- Note:
- Median wages are 3 year moving averages, by fiscal year from April 1 to March 31
- Wages and earnings are adjusted to 2015 constant dollars
- EAS-only does not have an extended program period. One year post start period is 2003 to 2006. Second year post-start is 2004 to 2007. Third year post-start is 2005 to 2008. Fourth year post-start is 2006 to 2009. Fifth year post-start is 2007 to 2010.
- Sources:
- Table 282-0071 Labour Force Survey, Statistics Canada
- Table 326-0021 Consumer Price Index (CPI), Statistics Canada
- Analysis of Employment Benefits and Support Measures (EBSM) Profile, Outcomes and Medium-Term Incremental Impacts from 2002 to 2011, Employment and Social Development Canada
The strongest earnings growth rate is seen in the outcomes of those who participated in JCP interventions between 2002 to 2005 (Chart 52). Within the first year after intervention, earnings for JCP participants exceeded their highest pre-program wages by 13.4%, from $19,765 one-year pre-program to $22,410 one-year post-program (3.3 Annex 2, Table 23). The wage gap between earnings from JCP participants and national median wage narrowed from 59.1% five years pre-program ($15,774 for JCP earnings from $38,556 national median wages), to 33.7% five-years post-program ($27,130 for JCP earnings from $40,924 median wages).
Low income indicators
In addition to catching up to median wages, earnings for active EI claimants who participated in EBs grew faster than low income thresholds. Controlling for inflation, the growth rate for earnings increased within five-years post-program for the 2002 to 2005 cohort, surpassing both LIM and LICO. For the 2010 to 2011 cohort, within three years, earnings for SD participants exceeded both low income indicators, while growth in earnings for TWS participants surpassed LICO.
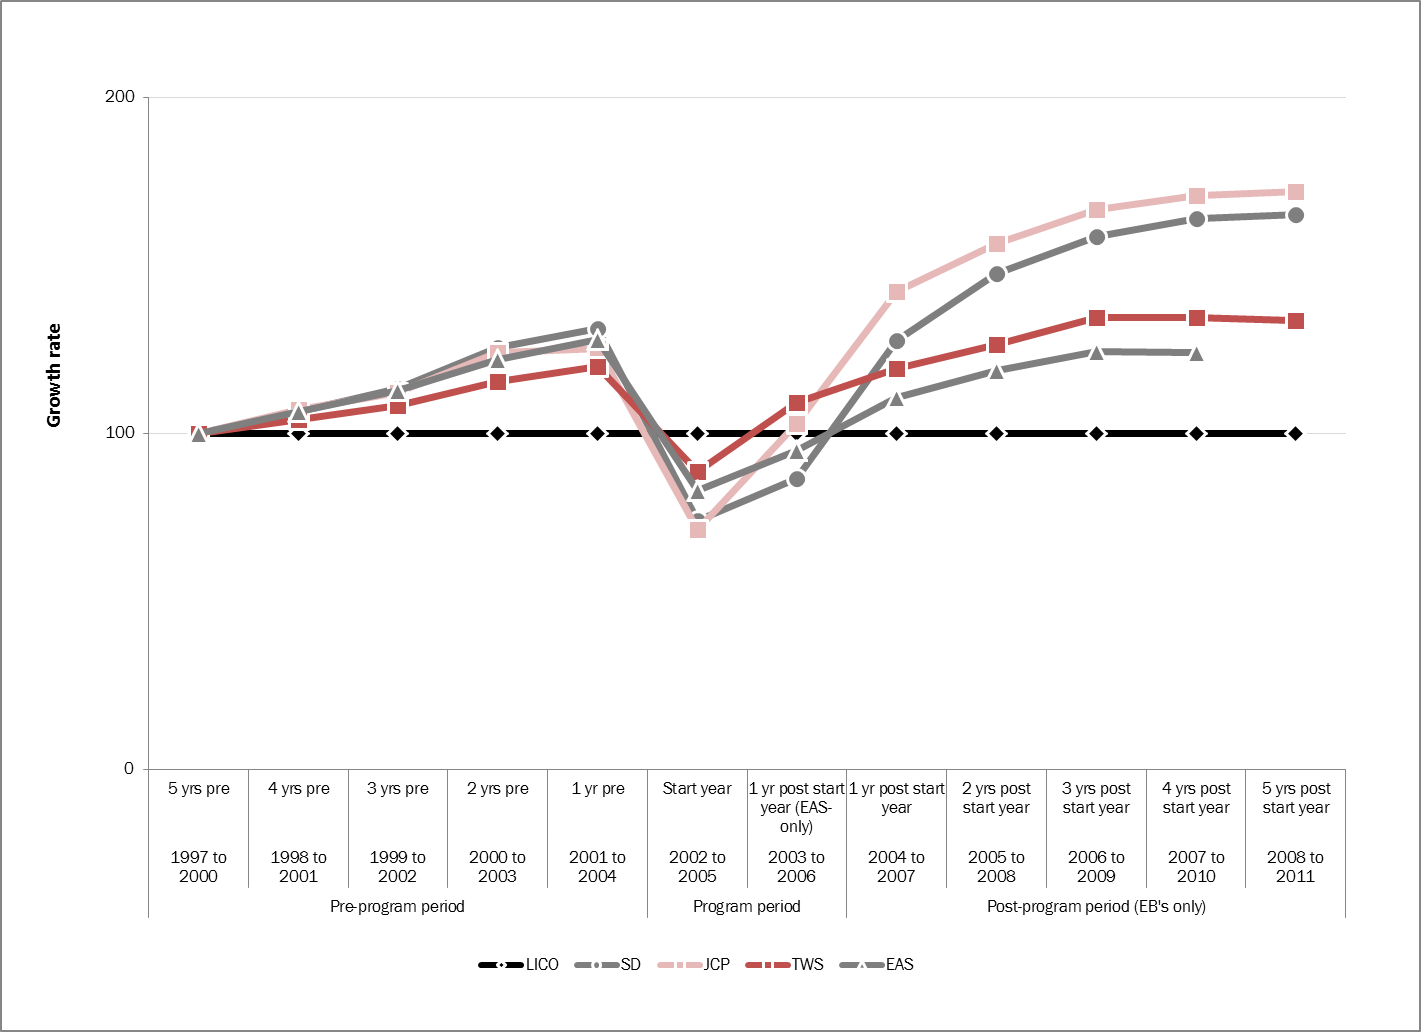
Show Data Table
| Pre-program period | Program period | Post-program period (EB's only) | ||||||||||
|---|---|---|---|---|---|---|---|---|---|---|---|---|
| 1997 to 2000 | 1998 to 2001 | 1999 to 2002 | 2000 to 2003 | 2001 to 2004 | 2002 to 2005 | 2003 to 2006 | 2004 to 2007 | 2005 to 2008 | 2006 to 2009 | 2007 to 2010 | 2008 to 2011 | |
| 5 yrs pre | 4 yrs pre | 3 yrs pre | 2 yrs pre | 1 yr pre | Start year | 1 yr post start year (EAS-only) | 1 yr post start year | 2 yrs post start year | 3 yrs post start year | 4 yrs post start year | 5 yrs post start year | |
| SD | 100 | 106,4 | 113,4 | 125,6 | 131,1 | 74,0 | 86,5 | 127,6 | 147,7 | 158,5 | 163,9 | 165,0 |
| TWS | 100 | 104,2 | 108,3 | 115,5 | 119,7 | 88,5 | 109,1 | 119,4 | 126,5 | 134,3 | 134,4 | 133,4 |
| JCP | 100 | 107,0 | 112,1 | 124,0 | 125,3 | 71,4 | 102,9 | 142,1 | 156,5 | 166,6 | 170,8 | 172,0 |
| EAS | 100 | 106,3 | 112,7 | 122,0 | 127,9 | 83,1 | 94,9 | 110,7 | 118,8 | 124,2 | 123,9 | |
| LICO | 100 | 100,0 | 100,0 | 100,0 | 100,0 | 100,0 | 100,0 | 100,0 | 100,0 | 100,0 | 100,0 | 100,0 |
- Note:
- Low-income cut-offs (LICO) are income thresholds where a family will likely spend 20 percentage points more than an average family (43%) on food, shelter and clothing
- One-person family size, after tax, population size has no effect on LICO index
- Adjusted to 3 year moving averages, by fiscal year from April 1 to March 31
- EAS-only does not have an extended program period. One year post start period is 2003 to 2006. Second year post-start is 2004 to 2007. Third year post-start is 2005 to 2008. Fourth year post-start is 2006 to 2009. Fifth year post-start is 2007 to 2010.
- Sources:
- Table 206-0094 Low-income cut-offs, Statistics Canada
- Table 326-0021 Consumer Price Index (CPI), Statistics Canada
- Analysis of Employment Benefits and Support Measures (EBSM) Profile, Outcomes and Medium-Term Incremental Impacts from 2002 to 2011,Employment and Social Development Canada
Comparing the outcomes of the 2010 to 2011 cohort against LICO, the earnings growth from SD and TWS participants passed low income within the first year post-program participation. The gap in earnings for TWS participants relative to LICO, in communities with a population of 500,000Footnote 26 or greater, moved by 10.0 percentage points, from 8.9% below LICO five years pre-program, to 1.1% above LICO three years post program (3.3 Annex 2, Table 22). For SD participants, in the same sized communities, earnings relative to LICO moved by 27.4 percentage points, from 7.7% below LICO (five years pre-program), to 19.7% above LICO (three years post-program). As LICO is based on consumption of a basket of goods, it increases with inflation. Once indexed, the effects of inflation are removed, and LICO does not change over time since the goods in the basket remained the same since 1992.
Additionally, SD is the only intervention from the 2010 to 2011 cohort to surpass the growth rate of LIM. With a different definition of low income, LIM has a higher growth rate than LICO. Under this definition, SD participation is the only intervention with earnings above low income post-program. The gap between earnings and LIM widened 12.5 percentage points, from 2.0% below LIM, five years pre-program, to 10.5% above LIM, three-years post-program.
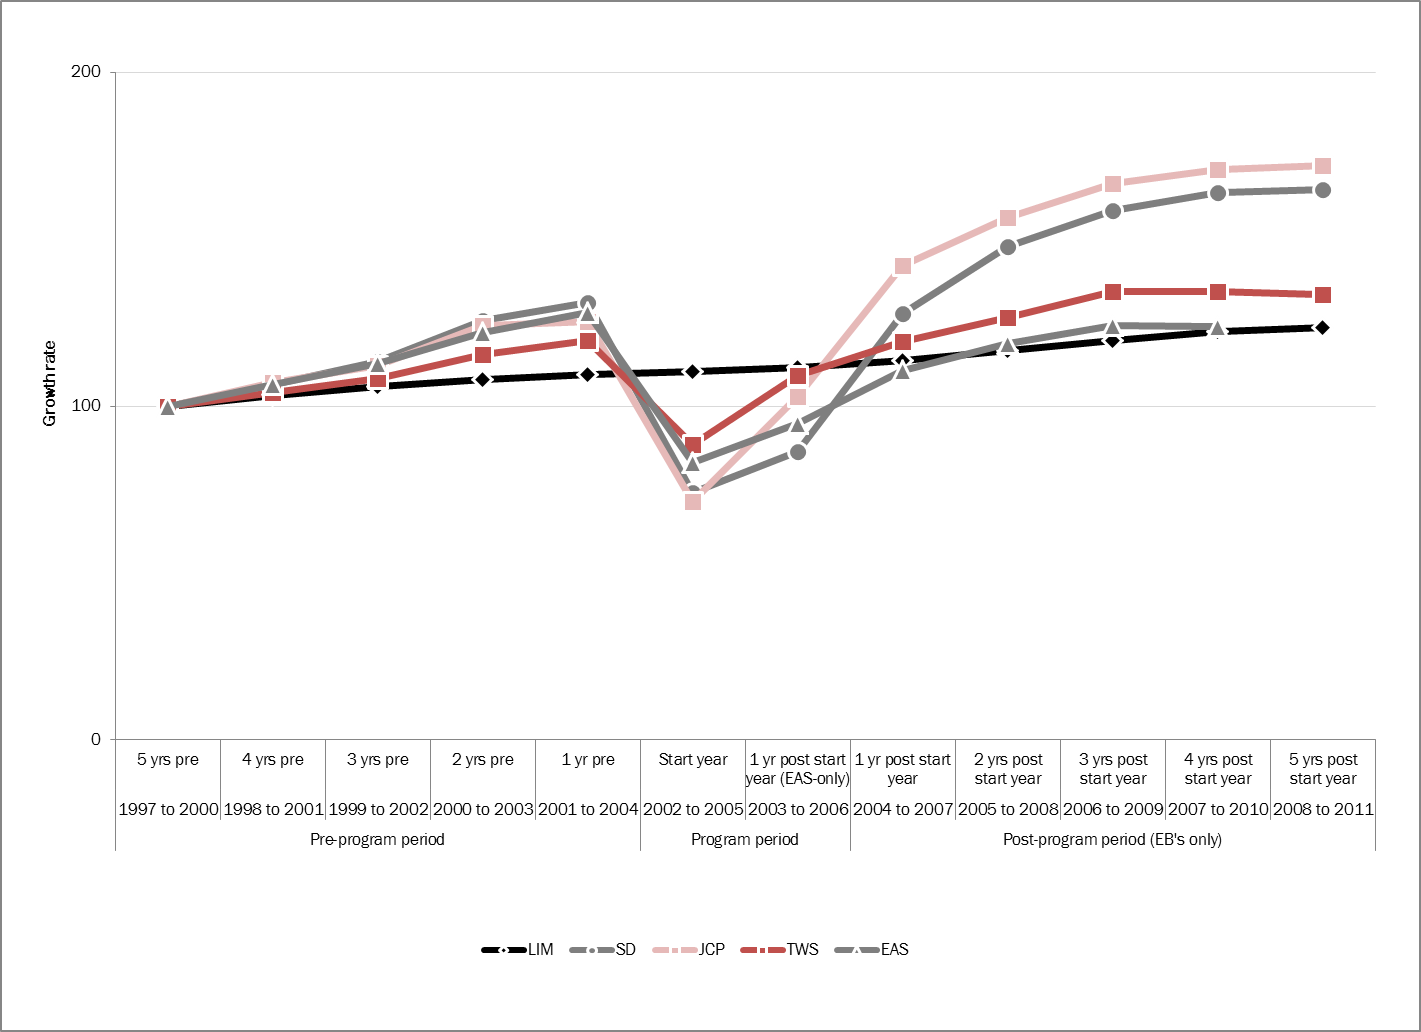
Show Data Table
| Pre-program period | Program period | Post-program period (EB's only) | ||||||||||
|---|---|---|---|---|---|---|---|---|---|---|---|---|
| 1997 to 2000 | 1998 to 2001 | 1999 to 2002 | 2000 to 2003 | 2001 to 2004 | 2002 to 2005 | 2003 to 2006 | 2004 to 2007 | 2005 to 2008 | 2006 to 2009 | 2007 to 2010 | 2008 to 2011 | |
| 5 yrs pre | 4 yrs pre | 3 yrs pre | 2 yrs pre | 1 yr pre | Start year | 1 yr post start year (EAS-only) | 1 yr post start year | 2 yrs post start year | 3 yrs post start year | 4 yrs post start year | 5 yrs post start year | |
| SD | 100 | 106,4 | 113,4 | 125,6 | 131,1 | 74,0 | 86,5 | 127,6 | 147,7 | 158,5 | 163,9 | 165,0 |
| TWS | 100 | 104,2 | 108,3 | 115,5 | 119,7 | 88,5 | 109,1 | 119,4 | 126,5 | 134,3 | 134,4 | 133,4 |
| JCP | 100 | 107,0 | 112,1 | 124,0 | 125,3 | 71,4 | 102,9 | 142,1 | 156,5 | 166,6 | 170,8 | 172,0 |
| EAS | 100 | 106,3 | 112,7 | 122,0 | 127,9 | 83,1 | 94,9 | 110,7 | 118,8 | 124,2 | 123,9 | |
| LIM | 100 | 103,0 | 106,0 | 108,0 | 109,4 | 110,3 | 111,7 | 113,8 | 116,6 | 119,8 | 122,2 | 123,6 |
- Note:
- Low-income measures (LIM), after tax, are a fixed percentage (50%) of median adjusted household income, where household needs are taken into account.
- Adjusted to 3-year moving averages, by fiscal year from April 1 to March 31
- EAS-only does not have an extended program period. One year post start period is 2003 to 2006. Second year post-start is 2004 to 2007. Third year post-start is 2005 to 2008. Fourth year post-start is 2006 to 2009. Fifth year post-start is 2007 to 2010.
- Sources:
- Table 206-0091 Low-income measures, Statistics Canada
- Analysis of Employment Benefits and Support Measures (EBSM) Profile, Outcomes and Medium-Term Incremental Impacts from 2002 to 2011, Employment and Social Development Canada
Unlike the other interventions, Employment Assistance Services (EAS) is a low-cost investment that helps active claimants overcome the friction from job loss. This intervention is not designed to handle structural impediments to job loss. Its focus is on reintegrating workers back to the job market as soon as possible. Unlike claimants who participated in other programs in addition to EAS, claimants who only had EAS intervention between 2010 to 2011 did not recover their earnings and remained at or below low income post-participation. EAS-only interventions are not medium-term investments on human capital, and do not necessarily contribute to improved earnings in the long run. Earnings growth for claimants who participated only in EAS interventions, trailed the growth rate for median wages during the program year and two years post-program. As well, EAS-only claimants in communities with a population of 500,000 or greater, remained at or below LICO throughout the pre- and post- participation periods. Earnings five years pre-program were 2.5% below LICO, moving to 0.1% above LICO three years after intervention. Under LIM, earnings three years prior to EAS were 3.5% above low income, dropping by 9.7 percentage points to 6.2% below LIM three-years after EAS. With EAS-only, the earnings growth rate falls behind the growth rate of low income indicators. While EAS was designed to support job-ready claimants, these results may be due to increased participation from non-insured, or precarious workers, who do not qualify for further Part II Employment Benefits. Detailed analysis of this shift is found in Section 3.1.3 of this chapter.
Active EI claimants, who participated in JCP programs between 2002 to 2005, had the strongest earnings growth compared to both low income indicators (Charts 54 and 55). The gap between earnings and LICO, for communities with populations 500,000 or greater, moved from 22.6% below LICO five years prior to intervention, to 33.1% above LICO five years after intervention, a total of 55.7 percentage points. This effect is amplified in smaller communities, where the gap between earnings and LICO, for communities with populations between 30,000 to 99,999, moved by 66.7 percentage points, from 7.3% below LICO, five years prior to intervention, to 59.45% above LICO five years after intervention. The gap between earnings and LIM also strongly diverged, by 36.6 percentage points, from 6.7% below LIM, five years before intervention, to 29.9% above LIM five years after intervention. JCP seems to be the most successful program to increase well-being, as defined by median wages and low income indicators.
Conclusions
Acknowledging that an outcome based analysis does not allow measured impacts to be unequivocally attributed to LMDAs, it can however be concluded that earnings for EI claimants, under LMDA funded programs, are helping close the gap with national median wages and surpass low income thresholds. It is very likely that LMDA funded programs play a part in achieving these results. The training and experience from interventions, particularly SD and JCP, possibly contribute to increased earnings above low income thresholds, and provide the tools to reduce income inequality.
3.3 Annex 1
| Indicators | In-program period | Post-program period | Total in- and post-program | ||||||
|---|---|---|---|---|---|---|---|---|---|
| Program start year | Additional Year | 1st year | 2nd year | 3rd year | 4th year | 5th year | Total post | ||
| Skills Development (n=64,283 or a random sample of 50% of participants) | |||||||||
| Employment earnings ($) | -4,747*** | -4,211*** | 204*** | 2,052*** | 3,077*** | 3,761*** | 4,059*** | 13,156*** | 4,197*** |
| Incidence of employment (percentage points) |
-4.5*** | -4.7*** | 2.4*** | 3.7*** | 4*** | 4.2*** | 4.4** | n/a | n/a |
| EI benefits ($) | 1,847*** | 222*** | -470*** | -218*** | -128*** | -89*** | -69*** | -976*** | 1,093*** |
| EI weeks (weeks) | 6.3*** | 0.7*** | -1.7*** | -0.8*** | -0.4*** | -0.3*** | -3.7*** | 3.3*** | |
| SA benefits ($) | 21** | 44*** | 36*** | -8 | -30*** | -35*** | -31*** | -69 | -3 |
| Dependence on income support (percentage points) | 16.4** | 7.4*** | -2.2*** | -1.5*** | -1.3*** | -1.2*** | -1*** | n/a | n/a |
| Targeted wage subsidy (n=18,767) | |||||||||
| Employment earnings ($) | -1,404*** | 752*** | 661*** | 971*** | 1,747*** | 1,815*** | 1,930*** | 7,125*** | 6,473*** |
| Incidence of employment (percentage points) |
4.4*** | 7.2*** | 5.0*** | 4.9*** | 5.1*** | 5.0*** | 5.1*** | n/a | n/a |
| EI benefits ($) | 100*** | -208*** | -2 | 52 | 39 | 104*** | 146*** | 339*** | 231 |
| EI weeks (weeks) | 0.3*** | 0 | 0.5*** | 0.4*** | 0.3*** | 0.4*** | 0.5*** | 2.1*** | 2.4*** |
| SA benefits ($) | -24* | -86*** | -79*** | -61*** | -63*** | -58*** | -65*** | -327*** | -436*** |
| Dependence on income support (percentage points) | -0.5* | -2.7*** | 0.7*** | 0.7*** | 0.1 | 0.4 | 0.5* | n/a | n/a |
| Job Creation Partnerships (n=5,055) | |||||||||
| Employment earnings ($) | -4,760*** | -1,548*** | 1,899*** | 2,825*** | 3,450*** | 3,969*** | 4,409*** | 16,552*** | 10,244*** |
| Incidence of employment (percentage points) |
n/a | n/a | 5.5*** | 5.6*** | 6*** | 5.8*** | 6.3*** | n/a | n/a |
| EI benefits ($) | 2,563*** | 286*** | -549*** | -220*** | -55 | -14 | -55 | -893*** | 1,956*** |
| EI weeks (weeks) | 6.1*** | -0.3 | -1.6*** | -0.5*** | -0.1 | 0.1 | 0 | -2.1*** | 3.6*** |
| SA benefits ($) | -59*** | 10 | -36 | -50* | -68*** | -58*** | -47 | -258*** | -308*** |
| Dependence on income support (percentage points) | 16.6*** | 3.1*** | -3.1*** | -1.7*** | -1.2*** | -1.1*** | -0.8 | n/a | n/a |
| Employment Assistance Services (n=38,564 or a random sample of 10% of participants) | |||||||||
| Employment earnings ($) | -2,913*** | -1,097*** | -279*** | 347* | 645*** | 742*** | 358 | -2,555*** | |
| Incidence of employment (percentage points) |
-0.5*** | 0.6* | 0.8*** | 1.7*** | 1.8*** | 1.7*** | n/a | n/a | |
| EI benefits ($) | 697*** | -451*** | -312*** | -251*** | -222*** | -136*** | -1,375*** | -677*** | |
| EI weeks (weeks) | 2.1*** | -1.5*** | -0.9*** | -0.8*** | -0.7*** | -0.4*** | -4.3*** | -2.2*** | |
| SA benefits ($) | 60*** | 94*** | 31*** | 23* | 29*** | 36*** | 213*** | 273*** | |
| Dependence on income support (percentage points) | 5.6*** | -1.2*** | -0.9*** | -0.9*** | -0.6*** | -0.4* | n/a | n/a | |
- Significance level *** 1%; ** 5%; * 10%
| Indicators | In-program period | Post-program period | Total in- and post-program | ||||||
|---|---|---|---|---|---|---|---|---|---|
| Program start year | Additional Year | 1st year | 2nd year | 3rd year | 4th year | 5th year | Total post | ||
| Skills Development (n=42,513 or 100% of participants) | |||||||||
| Employment earnings ($) | -2,405*** | -2,432*** | 496*** | 1,550*** | 2,029*** | 2,326*** | 2,521*** | 8,923*** | 4,085*** |
| Incidence of employment (percentage points) |
-10*** | -4*** | 3*** | 5*** | 5*** | 5*** | 5*** | n/a | n/a |
| EI benefits ($) | 395*** | -70*** | -54*** | 171*** | 217*** | 203*** | 183*** | 720*** | 1,046*** |
| EI weeks (weeks) | 1.4*** | -0.5*** | -0.4*** | 0.5*** | 0.6*** | 0.5*** | 0.4** | 1.5*** | 2.5*** |
| SA benefits ($) | -236*** | -334*** | -195*** | -209*** | -237*** | -241*** | -247*** | -1,131*** | -1,702*** |
| Dependence on income support (percentage points) | 8.3** | -1.6*** | -3.3*** | -2.3*** | -2.4*** | -2.4*** | -2.8*** | n/a | n/a |
| Targeted Wage Subsidy (n=24,523) | |||||||||
| Employment earnings ($) | 3,237*** | 3,564*** | 2,134*** | 1,850*** | 2,017*** | 2,173*** | 2,180*** | 10,353*** | 17,155*** |
| Incidence of employment (percentage points) |
14*** | 11.1*** | 6.9*** | 6.2*** | 5.7*** | 5.5*** | 5.7*** | n/a | n/a |
| EI benefits ($) | 391*** | 855*** | 679*** | 499*** | 397*** | 349*** | 296*** | 2,220*** | 3,466*** |
| EI weeks (weeks) | 1.2*** | 3.4*** | 2.4*** | 1.6*** | 1.2*** | 1*** | 0.7*** | 7.1*** | 11.8*** |
| SA benefits ($) | -481*** | -587*** | -387*** | -306*** | -285*** | -274*** | -266*** | -1,519*** | -2,587*** |
| Dependence on income support (percentage points) | -10.5*** | -2.2*** | -0.5*** | -1.1*** | -1.5*** | -1.7*** | -2.2*** | n/a | n/a |
| Job Creation Partnerships (n=5,013) | |||||||||
| Employment earnings ($) | -2,242*** | -631*** | 869*** | 821*** | 1,151*** | 942*** | 1,008*** | 4,790*** | 1,917*** |
| Incidence of employment (percentage points) |
n/a | n/a | 4.9*** | 4*** | 4.8*** | 4*** | 3.8*** | n/a | n/a |
| EI benefits ($) | 183*** | -240*** | 44 | 284*** | 144*** | 276*** | 258*** | 1,006*** | 949*** |
| EI weeks (weeks) | 0.2 | -1*** | 0.16 | 1*** | 0.5*** | 0.9*** | 0.8*** | 3.3*** | 2.6*** |
| SA benefits ($) | -302*** | -301*** | -277*** | -257*** | -267*** | -223*** | -158*** | -1,183*** | -1,785*** |
| Dependence on income support (percentage points) | 1.9*** | -5.2*** | -3.9*** | -2*** | -2.7*** | -1.3*** | -1.1*** | n/a | n/a |
- Significance level *** 1%; ** 5%; * 10%
| Cohorts | n= | In-program | Post-program period | Total impact post-program |
Total impact in- and post- program | ||||
|---|---|---|---|---|---|---|---|---|---|
| 1 year | 2 years | 3 years | 4 years | 5 years | |||||
| Employment earnings | |||||||||
| 1–4 weeks | 39,354 | -$505*** | $258*** | $1,708*** | $2,343*** | $2,804*** | $3,080*** | $10,192*** | $9,687*** |
| 5–8 weeks | 31,168 | -$2,046*** | -$765*** | $444*** | $1,123*** | $1,511*** | $1,574*** | $3,888*** | $1,842*** |
| 9–12 weeks | 48,648 | -$3,109*** | -$839*** | $124 | $783*** | $1,179*** | $1,296*** | $2,543*** | -$566 |
| 2nd quarter | 38,513 | -$4,566*** | -$1,106*** | -$240** | $327*** | $603*** | $775*** | $358 | -$4,209*** |
| 3rd quarter | 38,495 | -$6,680*** | -$1,139*** | -$703*** | -$178 | $151 | $114 | -$1,754*** | -$8,433*** |
| 4th quarter | 24,456 | -$6,814*** | -$545*** | -$696*** | -$253 | -$11 | $287 | -$1,218 | -$8,032*** |
| Incidence of employment | |||||||||
| 1–4 weeks | 39,354 | 2.6pp*** | 2.1pp*** | 1.6pp*** | 1.6pp*** | 0.9pp*** | 0.3pp | n/a | n/a |
| 5–8 weeks | 31,168 | 1.4pp*** | 0.4pp* | 0.3pp | 0.2pp | -0.3pp | -0.8pp*** | n/a | n/a |
| 9–12 weeks | 48,648 | 0.2pp | -0.6pp*** | -0.6pp*** | -0.4pp** | -0.6pp*** | -1.0pp*** | n/a | n/a |
| 2nd quarter | 38,513 | -1.2pp*** | -0.5pp** | -0.6pp** | -0.4pp | -0.5pp** | -0.7pp*** | n/a | n/a |
| 3rd quarter | 38,495 | -4.1pp*** | -0.5pp** | -0.7pp*** | -0.6pp** | -0.7pp*** | -1.0pp*** | n/a | n/a |
| 4th quarter | 24,456 | -5.8pp*** | -0.4pp | -1.1pp | -0.5pp | -0.8pp | -0.2pp | n/a | n/a |
- * Significant at 10%; ** significant at 5%; *** significant at 1%
- n= refers to the number of participants. It corresponds to 100% of participants. pp= percentage points
- Note: for the estimations we have selected a 50% random sample among comparison group in each cohort due to their large number. We used 100% of participants.
3.4 Annex 2
| Average outcomes | Pre-program period | Program period | Post-program period (EB's only) | |||||||
|---|---|---|---|---|---|---|---|---|---|---|
| 5 yrs pre | 4 yrs pre | 3 yrs pre | 2 yrs pre | 1 yr pre | Start year | 1 yr post start year (EAS-only) | 1 yr post start year | 2 yrs post start year | 3 yrs post start year | |
| 2005 to 2006 | 2006 to 2007 | 2007 to 2008 | 2008 to 2009 | 2009 to 2010 | 2010 to 2011 | 2011 to 2012 | 2012 to 2013 | 2013 to 2014 | 2014 to 2015 | |
| SD | $18,811 | $19,887 | $21,285 | $22,768 | $21,807 | $11,719 | $15,916 | $21,711 | $23,919 | $24,403 |
| TWS | $18,565 | $19,435 | $20,267 | $21,105 | $19,944 | $14,399 | $17,785 | $19,581 | $20,372 | $20,618 |
| EAS-only | $19,877 | $21,041 | $22,263 | $23,593 | $23,164 | $14,242 | $17,687 | $19,926 | $20,397 | - |
| Median annual wages | $38,801 | $39,057 | $39,545 | $40,478 | $41,025 | $40,818 | $40,748 | $41,251 | $41,412 | $41,714 |
| LIM | $19,197 | $19,615 | $20,256 | $20,804 | $20,893 | $20,955 | $21,241 | $21,631 | $21,738 | $22,083 |
| LICO rural areas | $13,336 | $13,335 | $13,336 | $13,336 | $13,335 | $13,335 | $13,335 | $13,335 | $13,335 | $13,335 |
| LICO population under 30,000 | $15,262 | $15,262 | $15,261 | $15,261 | $15,262 | $15,262 | $15,262 | $15,262 | $15,261 | $15,262 |
| LICO population 30,000 to 99,999 | $17,025 | $17,024 | $17,025 | $17,025 | $17,025 | $17,024 | $17,025 | $17,025 | $17,025 | $17,024 |
| LICO population 100,000 to 499,999 | $17,240 | $17,240 | $17,240 | $17,240 | $17,240 | $17,240 | $17,240 | $17,240 | $17,241 | $17,241 |
| LICO population 500,000 and over | $20,386 | $20,386 | $20,386 | $20,386 | $20,385 | $20,385 | $20,386 | $20,386 | $20,386 | $20,386 |
- Notes:
- Median annual wages, LFS, LICO and LIM are 5 quarter moving averages
- Low-income cut-offs (LICO) are income thresholds where a family will likely spend 20 percentage points more than average family (43%) on food, shelter and clothing. One-person family size, after-tax.
- LIM: Low-income measures (after-tax) are a fixed percentage (50%) of median adjusted household income, where household needs are taken into account.
- EAS-only does not have an extended program period. One year post start period is 2011 to 2012. Second year post-start is 2012 to 2013. Third year post-start is 2014 to 2015.
- Sources:
- Socio-Demographic and Labour Market Characteristics of 2010 to 2011 (January 2010 to April 2011) LMDA Participants, Internal Analysis performed by Employment and Social Development Canada
- Table 326-0021 Consumer Price Index (CPI), Statistics Canada
- Table 282-0071 Labour Force Survey, Statistics Canada
- Table 206-0094 Low income cut-offs (LICOs) before and after tax by community and family size in current dollars, Statistics Canada
- Table 206-0091 Low income measures (LIMs) by income source and household size in 2015 constant dollars, Statistics Canada
| Pre-program period | Program period | Post-program period (EB's only) | ||||||||||
|---|---|---|---|---|---|---|---|---|---|---|---|---|
| 5 yrs pre | 4 yrs pre | 3 yrs pre | 2 yrs pre | 1 yr pre | Start year | 1 yr post start year (EAS-only) | 1 yr post start year | 2 yrs post start year | 3 yrs post start year | 4 yrs post start year | 5 yrs post start year | |
| 1997 to 2000 | 1998 to 2001 | 1999 to 2002 | 2000 to 2003 | 2001 to 2004 | 2002 to 2005 | 2003 to 2006 | 2004 to 2007 | 2005 to 2008 | 2006 to 2009 | 2007 to 2010 | 2008 to 2011 | |
| SD | $18,399 | $19,574 | $20,861 | $23,118 | $24,128 | $13,608 | $15,912 | $23,476 | $27,171 | $29,154 | $30,163 | $30,354 |
| TWS | $19,426 | $20,238 | $21,037 | $22,428 | $23,255 | $17,183 | $21,189 | $23,191 | $24,580 | $26,098 | $26,099 | $25,923 |
| JCP | $15,774 | $16,880 | $17,679 | $19,558 | $19,765 | $11,267 | $16,224 | $22,410 | $24,689 | $26,273 | $26,948 | $27,130 |
| EAS-only | $21,938 | $23,330 | $24,718 | $26,773 | $28,059 | $18,221 | $20,812 | $24,282 | $26,064 | $27,250 | $27,189 | - |
| Median annual wages | $38,556 | $38,821 | $38,943 | $38,934 | $38,718 | $38,513 | $38,548 | $38,852 | $39,319 | $39,852 | $40,498 | $40,924 |
| LIM | $16,904 | $17,419 | $17,912 | $18,262 | $18,492 | $18,646 | $18,878 | $19,236 | $19,717 | $20,248 | $20,664 | $20,890 |
| LICO rural areas | $13,335 | $13,335 | $13,335 | $13,335 | $13,335 | $13,335 | $13,335 | $13,335 | $13,336 | $13,336 | $13,335 | $13,335 |
| LICO population under 30,000 | $15,262 | $15,261 | $15,261 | $15,262 | $15,261 | $15,261 | $15,261 | $15,261 | $15,261 | $15,261 | $15,261 | $15,261 |
| LICO population 30,000 to 99,999 | $17,025 | $17,025 | $17,025 | $17,025 | $17,025 | $17,025 | $17,025 | $17,025 | $17,025 | $17,025 | $17,025 | $17,025 |
| LICO population 100,000 to 499,999 | $17,240 | $17,240 | $17,240 | $17,240 | $17,240 | $17,240 | $17,240 | $17,240 | $17,240 | $17,240 | $17,240 | $17,240 |
| LICO population 500,000 and over | $20,386 | $20,386 | $20,386 | $20,385 | $20,385 | $20,385 | $20,386 | $20,386 | $20,386 | $20,386 | $20,386 | $20,386 |
- Notes:
- Median annual wages LFS, LICO and LIM are 3 year moving averages
- Low-income cut-offs (LICO) are income thresholds where a family will likely spend 20 percentage points more than average family (43%) on food, shelter and clothing. One-person family size, after-tax.
- Low-income measures (LIM), after tax, are a fixed percentage (50%) of median adjusted household income, where household needs are taken into account
- EAS-only does not have an extended program period. One year post start period is outside of the program period.
- Sources:
- Analysis of Employment Benefits and Support Measures (EBSM) Profile, Outcomes and Medium-Term Incremental Impacts from 2002 to 2011, Employment and Social Development Canada
- Table 326-0021 Consumer Price Index (CPI), Statistics Canada
- Table 282-0071 Labour Force Survey, Statistics Canada
- Table 206-0094 Low income cut-offs (LICOs) before and after tax by community and family size in current dollars, Statistics Canada
- Table 206-0091 Low income measures (LIMs) by income source and household size in 2015 constant dollars, Statistics Canada
3.5 Sources
Chen, Wen-Hao, Income Statistics Division (2008). Comparing Low Income of Canada's Regions: A Stochastic Dominance Approach, Statistics Canada
Davidson, Russell, Sciences de l'Homme et de la Société (2010). Inference on Income Distributions
Davidson, R. and Duclos, J.-Y. (2000), Statistical Inference for Stochastic Dominance and for the Measurement of Poverty and Inequality. Econometrica, 68: 1435–1464. doi:10.1111/1468-0262.00167
Government of New Brunswick (2009). Calculating Your Wage Gap
Government Report by Evaluation Directorate, Employment and Social Development Canada (2014). Analysis of Employment Benefits and Support Measures (EBSM) Profile, Outcomes and Medium-Term Incremental Impacts from 2002 to 2011.
Government Report by Evaluation Directorate, Employment and Social Development Canada (2015). Analysis of National Employment Benefits and Support Measures (EBSM) Profile, Outcomes and Incremental Impacts for 2007 to 2008 Participants.
Government Report by Evaluation Directorate, Employment and Social Development Canada (2017). Evaluation of the Labour Market Development Agreements, Synthesis Report (SP-1151-09-17).
Hatfield, Michael, Wendy Pyper and Burton Gustajtis, Government of Canada (2010). First Comprehensive Review of the Market Basket Measure of Low Income, Human Resources and Skills Development Canada (Catalogue no.: HS28-178/2010E-PDF).
Income Statistics Division, Statistics Canada (2015). Low Income Lines, 2013 to 2014: Update (Catalogue no. 75F0002M – No. 002), pp. 6-8.
Income Statistics Division, Statistics Canada (2010). Revising Statistic's Canada Low Income Measure (LIM) (Catalogue no. 75F0002M — No. 004), pp. 6.
Income Statistics Division, Statistics Canada (2017). Table 4.1 Summary of low income lines in the 2016 Census of Population Program.
Murphy, Brian, Xuelin Zhang and Claude Dionne (2012). Low Income in Canada: a Multi-line and Multi-index Perspective. Statistics Canada
Statistics Canada. (2017) CANSIM Table 282-0071, Labour Force Survey estimates (LFS), wages of employees by type of work, North American Industry Classification System (NAICS), sex and age group, unadjusted for seasonality, monthly (current dollars).
Statistics Canada. (2017) CANSIM Table 326-0021, Consumer Price Index (CPI)
Statistics Canada (2016). Canadian Income Survey: Population rebasing, 2006 to 2013 (Catalogue no. 75F0002M – No. 003).
Statistics New Zealand (2014). Measuring the gender pay gap
Victorian Women Lawyers (2016). Calculating the Gender Pay Gap
4. Pan-Canadian activities and the national employment service
This section analyzes pan-Canadian activities that ESDC supports and delivers using EI Part II funds.
4.1 Context
The Government of Canada plays a leadership role in EI Part II by establishing objectives with provinces and territories through the LMDAs that ensure accountability and evaluation of LMDA programming and develop active labour market policies. In addition, the federal government plays a primary role in responding to challenges that extend beyond local and regional labour markets by delivering pan-Canadian activities.
Pan-Canadian activities fulfill three primary objectives:
- Promoting an efficient and integrated national labour market, while preserving and enhancing the Canadian economic union;
- Helping to address common labour market challenges and priorities of international or national scope that transcend provincial borders; and
- Promoting equal opportunity for all Canadians, with emphasis on helping underrepresented groups reach their full potential, in the Canadian labour market.
Pan-Canadian funding is focused on three streams of investment:
- Indigenous Programming;
- Enhancing Investments in Workplace Skills and Labour Market Information; and
- Supporting Agreements with Provinces, Territories and Indigenous Organizations.
For FY1617, the expenditures of the pan-Canadian program amounted to $114,063, a year-over-year increase of 1.4%. Pan-Canadian programming delivered through ASETS remained stable, totalling $93,062. While LMPs' expenditures drop by 16.5% to $14,982, those of R&I (+318%) rose from $1,440 to $6,019.
4.2 Indigenous programmingFootnote 27
Pan-Canadian funding is delivered through the Aboriginal Skills and Employment Training Strategy (ASETS) and its objective is to improve Indigenous peoples' participation in the Canadian workforce, ensuring that First Nations, Inuit and Métis have the skills and training for sustainable, meaningful employment. It also supports the development of a skilled Indigenous labour force, which is one of the objectives of the Federal Framework for Aboriginal Economic Development.
Pan-Canadian programming in action: Rupertsland Institute – Métis Centre of Excellence
The Métis Training to Employment (MTE) Program is the most well known Service Delivery Arm of the Rupertsland Institute. The MTE Program provides high quality employment services through a province wide network of 10 Métis Training to Employment Services (MTES) offices and two Mobile Métis Employment Services units. Various types of training are offered, including:
- Employment assessment and action planning to help clients meet their employment goals;
- Employment counselling to help clients resolve individual labour market issues;
- Services for persons with disabilities;
- Assistance with entrance to, and funding for, post-secondary and other training options;
- Information and access to custom designed training projects specially designed for Alberta Métis;
- Information on scholarships and bursaries;
- Assistance to develop high quality resumes and interview skills;
- Referrals to jobs and employers;
- Career planning, educational and other labour market information; and
- Access to computers, photocopiers and other resources.
MTE also maintains partnerships with the Northern Alberta Institute of Technology to assist Métis clients in entering a career in the health field. They provide academic upgrades required for entry into health technology programs, and work exposure with Capital Health.
To date, MTE's success rate is over 77%. Among the 6,597 clients served, 4,317 of them obtained a job and 794 returned to school.
ASETS was introduced in 2010 and is funded at $292 million annually, including $94.2 million from EI Part II funds. The program was extended to March 31, 2018, while the government prepares for a renewed and expanded Indigenous labour market programming. ASETS supports a network of over 80 Indigenous service delivery organizations (agreement holders), with over 600 points of service across Canada. ASETS assists Indigenous peoples prepare for, find, and retain high-demand jobs. This network of Indigenous organizations designs and delivers labour market programming to meet needs identified in their communities, in large part by working with employers and Indigenous individuals to ensure skills development and job training adequately respond to local labour demand.
ASETS, which is delivered by Indigenous service organizations, focusses on demand-driven skills development, fostering partnerships with Indigenous service delivery organizations, provinces and territories and the private sector. ASETS emphasizes increased accountability and improved results for its related activities. ASETS also assist Indigenous youth in making a successful transition from school to work or to support their return to school.
ASETS also supports obligations in Modern Treaties that fall within ESDC's mandate.
A studyFootnote 28, examining the labour market outcomes of ASETS clients (for cohorts spanning from 2006 to 2012), before and after their program participation, including EI-funded participants, suggests that programming under ASETS remains relevant. Overall, post-program incidence of employment and earnings were higher than pre-program levels. Although the results from this study cannot be solely attributed to the interventions delivered under ASETS, these favourable outcomes may suggest that, after participation in the program, a higher proportion of ASETS participants had employment in the post-program period, and those who had a job were able to improve their earnings, either by working more hours or having a better paying job. The outcome analyses also show that the proportion of participants receiving EI benefits and the average number of weeks on EI also increased in the post-participation period, suggesting improved job attachment after program participation.
In FY1617, ASETS served 51,818 clients, including 17,563 EI clients. Out of the total number of clients served, 20,241 found a job, including 8,642 EI clients, and a total of 10,286 clients served returned to school.
4.3 Enhancing investments in workplace skills and labour market information
This investment stream helps the federal government ensure that Canada's labour market functions as an integrated national system by:
- Removing barriers and impediments to labour mobility;
- Building capacity among workplace partners to improve skills development as a key factor in increasing productivity;
- Leveraging investment in, and ownership of, skills issues, especially in addressing skills and labour shortages; as well as
- Supporting efforts to ensure Canada's learning system responds to employers' skills requirements.
Sectoral Initiatives Program (SIP)
Launched in April 2013, the Sectoral Initiatives Program (SIP) aims at addressing current and future skills shortages, by supporting the development and dissemination of sector-specific labour market intelligence (LMI), national occupational standards (NOS) and skills certification and/or accreditation systems. The SIP is the department's primary, demand-focused program instrument for producing complementary, relevant and timely sectoral labour market intelligence to help employers, unions, job seekers, students, workers and educational institutions respond to labour market conditions, and to be proactive in preventing as well as addressing skills shortages so that Canadians fill available jobs.
SIP products 2015 to 2016
- The Mining Industry Human Resources Council (MiHR) created new tools to assess workforce diversity and to analyze diversity data for three target groups: women, Indigenous peoples, and immigrants. Job-seeker LMI tools and a career pathway map were created for 55 occupations.
- The Food Processing HR Council created a new suite of NOS for food and beverage manufacturing occupations, ranging from finance occupations in food processing, to industrial meat-cutting. Fifty-six NOS were developed for making better-informed decisions about employment options, skills requirements, and career advancement in the sector.
- The Canadian Manufacturers and Exporters (CME) developed six certification programs through its National Occupational Standards in Manufacturing project. The CME partnered with the Canadian Labour Congress to develop the CertWorx+ program, which provides certification for six key manufacturing positions, including: production manager, supervisor, lead hand, machine operator, assembler, and material handler.
- The Information Technology Association of Canada (ITAC) developed a new accreditation system through SIP funding, which has increased its number of accredited facilities from 10 to 12 through the addition of the University of Calgary and Athabasca University.
SIP supports an efficient, inclusive labour market, where supply and demand is balanced, and Canadians have access to information, skills training and employment opportunities. More specifically, demand driven LMI equips Canadians to access job opportunities by providing them with access to industry specific information, including occupational and skills requirements, employment, as well as career development opportunities. SIP supported sectoral intelligence is also critical in helping ensure that Canadian workers get good quality jobs through better alignment of post secondary education and training offerings, with employer needs.
Some SIP projects are funded through the Labour Market Partnerships (LMP) Support Measure of EI Part II. These enable contribution recipients to document much in-demand labour market supply and demand data, allowing key industry sectors in Canada to address their needs for workforce development.
As SIP partners are representative organizations, including employer and employee organizations, training institutions and various levels of government, there is significant investment (for example, cash and in-kind contributions from employers), and buy in from key stakeholders, into whole industry solutions that help prevent skills shortages and mismatches, and enable employers to adopt better workforce development strategies. As such, demand-driven LMI serves as a preventive tool to unemployment or under employment, as it communicates real workforce needs to current and future employees.
Accordingly, SIP is uniquely positioned to provide a cohesive, comprehensive and consensual employer perspective on labour market and skills issues, and constitutes an essential part of the Pan Canadian framework for labour market information.
In FY1617, the SIP was funding 29 multi-year agreements for projects related to the development and dissemination of labour market intelligence, national occupational standards and certification and/or accreditation programs in high-demand sectors. These agreements were being implemented with various stakeholders representing different industry sectors, for the development of the following products: labour market information and/or forecasting systems (49%); NOS (46%); and certification and accreditation (5% combined). Among them, in FY1617, the SIP was funding several cross-sectoral projects, as well as projects for the construction, environment, tourism, mining, transportation, oil and gas, manufacturing, agriculture, forestry, aerospace, supply chain, and information technology sectors. The dialogue box above provides an example of products that were developed and disseminated using SIP funding in FY1516.
While FY1617 survey data are not yet available, in FY1516, a total of 97 new labour market research reports and 43 forecasting systems were developed or updated, and released through SIP agreements, in sectors such as construction, environment, oil and gas, as well as mining. One hundred thirty-four (134) NOS were created or updated, and the SIP contributed to the development or the update of 12 certification programs, as well as one accreditation program, that were completed and made available in FY1516.
According to program survey data, more than 162,000 people used these SIP products. However, some recipients reported only users to whom they directly distributed LMI products, and they did not report referrals to others or use of the products by other organizations' members. For example, the Canadian Chamber of Commerce using Buildforce's LMI forecasts would have been counted as one user but, in turn, many employers also benefited from them and were not counted. Furthermore, of the recipients who developed NOS in FY1516, only half of them tracked and reported numbers of users. Thus, in several cases, the number of users could be underestimated.
Furthermore, in FY1516, the program recipients succeeded in leveraging $13.8M from the private sector and other stakeholders. Some of the projects had not yet achieved their ultimate objectives as they are multi-year projects.
As for work completed toward priorities articulated in the EI Expenditure plan for FY1617:
- SIP continued to develop sectoral expertise to inform future investments, building intelligence on existing and additional strategic sectors experiencing labour market tightness;
- SIP continued to engage industry on emerging skills gaps. Networking and partnership development continued in order to exchange information. As many approved projects are three years in duration, SIP provided LMI related advice and monitored results throughout project implementation;
- SIP monitored program expenditures, solicited some targeted proposals which began in FY1718, and prepared to launch a call for proposals;
- SIP increased its focus on disseminating sectoral labour market intelligence to improve awareness and use among external and internal stakeholders, and increase application as well as the integration of labour market intelligence into programs and activities. As contribution agreements ended and as deliverables became available, SIP collaborated with recipients to ensure that project outputs were disseminated, via the Job Bank platform and other appropriate media to employers and stakeholders; and
- SIP continued to collect and validate data on available outputs and outcomes from FY1516, and supported a program evaluation.
National Essential Skills Initiative
The National Essential Skills Initiative (NESI) supports Canadians to improve their essential skills (ES) in order to better prepare for, get and keep a job, as well as to adapt and succeed at work. This is aligned with the Government of Canada's commitment to learning, skills development and employment.
In FY1415, the program was reoriented to focus efforts on the integration of literacy and essential skills into employment and training supports, in order to scale up broader public access to quality employment and training services. Accordingly, the Office of Literacy and Essential Skills (OLES) works closely with other government departments and agencies, including provincial and territorial governments and other key stakeholders, such as post-secondary institutions, employers and labour organisations.
The program reorientation led to an open call to test and evaluate innovative training models that will support Canadians to improve their literacy and essential skills to get and keep a job, as well as to adapt and succeed at work. The call closed February 2015 and remained under review with the department until FY1718. This resulted in no projects receiving funding, under NESI, in FY1617.
Projects are underway in FY1718 and will receive funding from NESI over the next three fiscal years. Projects will focus on replicating and scaling up proven-approaches to skills upgrading, as well as improving the quality of employment and training supports that are responsive to job seekers', workers' and employers' needs. In alignment with government priorities, particular emphasis is being placed on individuals with low skills and facing multiple barriers to employment, such as Indigenous peoples, youth, and women.
2016 Red Seal program fast facts:
- More than 28,000 Red Seal endorsements were issued to apprenticeship completers and trade qualifiers
- Top 5 Red Seal trades by number of endorsements issued include: Construction Electrician, Automotive Service Technician, Welder, Truck and Transport Mechanic, and Plumber.
- In the last decade, there has been a 50% increase in Red Seals issued
- More than 250 industry representatives have participated in ESDC organized workshops to develop Red Seal products
- Approximately 500 industry representatives and training providers have participated in national webinars to harmonize apprenticeship training
- 46,582 Red Seal examinations were written
- The Red Seal Program's website counted 512,535 visitors
- Source: Canadian Council of Directors of Apprenticeship, 2016. Statistics are compiled on a calendar year basis.
In addition, ESDC is enhancing the availability of essential skills supports for those most in need through programs such as the Aboriginal Skills and Employment Training Strategy, the Skills and Partnership Fund and the Youth Employment Strategy. To date, for example, 82 out of 85 Aboriginal Skills and Employment Training Strategy holders deliver literacy and essential skills training to clients. As well, over 230,000 essential skills tools and resources were accessed or downloaded, including through partners such as Service Canada, Red Seal and the Canada Business Network.
Skilled Trades and Apprenticeship and Red Seal Program
Apprenticeships are essential to building a highly skilled trades workforce that supports Canadian competitiveness. The Interprovincial Standards Red Seal Program sets common standards to assess the skills of tradespeople across Canada and provides a vehicle to promote harmonization across the country.
The program is well-established at developing common interprovincial standards used to harmonize apprenticeship training in provinces and territories, to provide the public with up-to-date descriptions of trades in Canada, and to serve as the basis for assessment. Under this program, experienced tradespeople and apprentices who have completed their training may take the interprovincial Red Seal examination. If successful, they receive a Red Seal endorsement on their provincial or territorial certificate of qualification, indicating they have met both the provincial/territorial requirements and have demonstrated the knowledge required for the national standard in that trade. In most provinces and territories, the Red Seal examination has been adopted as the final examination for certification for Red Seal trades.
The Red Seal endorsement is a nationally recognized standard for skilled trades workers in Canada. In 2016, 46,582 Red Seal examinations were written by completing apprentices and experienced tradespeople from across Canada and over 28,000 Red Seals were issued.
The Canadian Council of Directors of Apprenticeship (CCDA), comprised of the apprenticeship authorities from each province and territory and representatives from ESDC, administers the Red Seal Program. In addition to functioning as the national secretariat—providing strategic, administrative and operational support—ESDC funds the Red Seal Program.
The Red Seal Program currently covers 56 skilled trades, which encompass 79% of registered apprentices.Footnote 29 ESDC works closely with industry experts and apprenticeship authorities to coordinate the development of high-quality Red Seal products, including occupational standards and interprovincial examinations. These products are updated regularly to reflect evolving labour market needs. Because each province and territory needs standards and examinations to certify thousands of apprentices and experienced tradespersons each year, the collaboration involved in developing interprovincial Red Seal standards and examinations results in significant economies of scale for governments.
The core of the Red Seal Program lies in quality interprovincial standards for industry, against which tradespeople can be trained and assessed. With ESDC support, the CCDA collaborates to build these standards with industry from across Canada. The program also encourages the harmonization of apprenticeship training outcomes through common standards, which provinces and territories use to develop their respective in-school portion of apprenticeship training.
The Red Seal Program continuously evolves to reflect the needs of the Canadian labour market and shifting Government of Canada priorities. In recent years, the national occupational standard and its associated development process have undergone significant enhancements. The standards are now being developed as Red Seal Occupational Standards (RSOS), with broader input from stakeholders (including tradespeople, instructors and employers) and include industry-defined performance expectations, evidence of skills attainment, learning objectives and outcomes, as well as essential skills to encourage greater harmonized training and certification across the country. The RSOS has the capacity to generate several products that are geared to users' needs such as assessment, training and career information.
Because of the additional stakeholder engagement and enhanced content, fewer trades undergo a complete revision of their standards each year. However, the ability to make revisions and corrections based on input is also possible between cycles. In FY1617, six new occupational standards were published on the Red Seal website, along with 51 standards-based products. In this period, there were 78 Red Seal examinations released for 15 trades.
To further reduce barriers to certification in the skilled trades in Canada and increase opportunities for apprentices, the Government of Canada continues to work closely with provinces and territories and industry through the CCDA to facilitate the harmonization of apprenticeship training requirements in targeted Red Seal trades. Harmonization will facilitate greater labour mobility across the country and help more apprentices complete their training. In October 2016, the Forum of Labour Market Ministers (FLMM) reaffirmed its commitment to harmonize 30 Red Seal trades by 2020 in most jurisdictions, with an effort to harmonize training for two-thirds of Red Seal apprentices by 2017 (outside of QuebecFootnote 30) Footnote 31.Footnote 32
As of September 2016, harmonized training was implemented for nine trades (Phase 1) in most jurisdictions. In FY1617, the CCDA completed industry consultations and implemented harmonized training for nine of the Phase 2 trades, in keeping with the target of implementation by September 2017. The CCDA has also made progress towards harmonizing Phases 3, 4 and 5 and is on target to meet the FLMM goal of harmonizing apprenticeship training in most jurisdictions for 30 Red Seal trades representing 90% of apprentices by 2020.
The effectiveness of achieving consensus between industry stakeholders across Canada has been greatly enhanced by aligning the process with development of the RSOS. Since the standards development process brings together the same key stakeholders that are involved in apprenticeship training development, they are able to share best practices, and provide a rationale for creating the best possible training for apprentices across Canada. This aligned process also ensures long term sustainability of harmonized training, while keeping training content as up-to-date as the standard.
With ESDC's support, CCDA representatives meet annually with national apprenticeship stakeholder groups to provide updates and seek input on key initiatives. At the CCDA's 2016 meeting, approximately 30 national stakeholders confirmed their support for the work underway on the CCDA's strategic priorities such as continuing progress on harmonization.
ESDC also continues to work with provinces and territories to increase employer engagement in apprenticeship. In October 2016, the FLMM agreed to explore innovative approaches to increase employer engagement for improved job opportunities and outcomes for apprentices. In FY1617, ESDC worked with interested provinces and territories to identify best practices and areas for investment to address the barriers employers face to participating in apprenticeship.
The Red Seal website (red-seal.ca) is the communications portal for the Red Seal Program. In 2016, the Red Seal website received approximately 512,000 visitors, for a total of more than 2.7 million page views. The Red Seal kiosk and promotional materials informed Canadians about the value of the Program and apprenticeships at various public events across Canada.
Flexibility and Innovation in Apprenticeship Technical Training
The Government of Canada is also investing to expand the use of innovative approaches for apprentice technical training through the Flexibility and Innovation in Apprenticeship Technical Training (FIATT) Pilot. The Pilot consists of ten training institutions located across Canada that are testing alternative delivery approaches to apprenticeship technical training such as e-learning, blended learning, in-class simulation and technical learning in workplaces and other locations apart from the traditional classroom. The Pilot's research objective is to gather evidence whether these projects can improve access to apprenticeship training, raise the level of employer engagement in apprenticeship training, improve apprenticeship completion rates and increase the overall efficiency of apprenticeship training systems. A final report that will include Pilot findings and recommendations for alternate delivery will be shared with apprenticeship stakeholders and policy-makers. The Pilot is scheduled to end in FY1819.
Research project “The Registered Apprenticeship Information System (RIAS)”
The Registered Apprenticeship Information System (RAIS) is an annual survey conducted by Statistics Canada with ESDC funding support. The RAIS obtains information from provinces and territories on individuals who receive training or certification within a trade where apprenticeship training is being offered by at least one province or territory. According to Statistics CanadaFootnote 33, there were 336,252 continuing apprentices in 2015. Of the 79,713 new registrations, 62,979 (79%) were in Red Seal trades. New registrations in the top Red Seal trades were led by construction electricians (9,855); carpenters (7,167); automotive service technicians (4,563); plumbers (3,693); and welders (3,384).
In November 2015, Statistics Canada and ESDC launched a two year project aimed at enhancing the RAIS data quality to support a more accurate, comparable and representative database of apprentices across Canada. Jurisdictional representatives have been very supportive of the process. Results and recommendations informing an action plan were completed in March 2017.
ESDC and Statistics Canada successfully completed the RAIS Longitudinal Pilot project in March 2017. The purpose of the study was to explore the potential to expand the utility of the RAIS data through linkages with other data sources (e.g. taxation). The pilot involving Alberta, New Brunswick and Nova Scotia (combined) was designed to follow apprentices as they progress through their apprenticeship programs, in order to produce statistics on completion of apprenticeship programs, earnings and mobility.
Funded by ESDC with an investment of $6.8M, the 2015 National Apprenticeship Survey (NAS) was released in March 2017. The NAS collected information from 28,469 apprentices and will help address knowledge gaps that exist around the experiences of apprentices after the last recession, and how various initiatives (for example, Apprenticeship Grants) may have influenced enrolment and completion. The survey presents an overall positive picture of apprenticeship. For example, apprentices who complete their programs have better outcomes: they are more likely to be employed, to hold a permanent job and to have higher earnings. About 9 in 10 apprentices see apprenticeship as the best way to learn a trade.
Approximately 60% of apprentices were aware of the Apprenticeship Grants, and more than half of apprentices applied for Employment Insurance benefits while on technical training.
National Occupation Classification (NOC)
The National Occupational Classification (NOC) provides a standard taxonomy for dialogue on the world of work and a national Canadian framework for collecting, analyzing and disseminating occupational data for Labour Market Information (LMI) and employment-related program administration. It describes job titles, functions, tasks and duties, employment requirements, responsibilities and qualifications.
The NOC is revised every five years, to reflect changes in Canadian workplaces and occupational dynamics. The current version (NOC 2016) was released in October 2016, and replaces the NOC 2011, released in January 2012. Research continues with a view to releasing regular updates starting in late 2017. Work is also underway on a structural revision of the NOC for 2021. The NOC 2016 gathers more than 30,000 job titles into 500 Unit Groups (groups of occupations that have similar employment requirements and duties, skill level and skill type).
Labour market surveys, research, analysis and reports are usually based on the NOC. Employment-based programming, such as EI, the Temporary Foreign Workers Program, as well as programming for the integration of injured workers and persons with disabilities, relies on the NOC to analyze labour market conditions for strategic considerations, policy development, program design and service delivery.
The NOC enables job seekers to connect with employers seeking workers, students to make informed educational and career choices and governments and other organizations to design and deliver programming in support of an efficient labour market.
Official Language Minority Communities signature projects
Launched in 2005, the Enabling Fund (EF) for Official Language Minority Communities (OLMCs) represents a sustained effort to enable community-wide economic development and to grow the economic advantages of linguistic duality. The EF is an important part of a broad horizontal Government of Canada strategy for linguistic duality, as described in the Action Plan for Official Languages 2018 to 2023: Investing in Our FutureFootnote 34.
Signature Projects are aligned with the ESDC vision “to build a stronger and more competitive Canada, to support Canadians in making choices that help them live productive and rewarding lives, and to improve Canadians' quality of life.” They also enable a number of partnering federal departments, agencies and external stakeholders (for example, employers, learning institutions) to provide a coordinated response to existing and emerging OLMCs economic development issues and opportunities.
Specifically, Signature Projects:
- Expand on an existing well established project (for example, best practices) or bridge a gap between existing projects;
- Have national, regional or multiregional scope and/or impact;
- Support the development and/or deepening of co-operation and partnership across sectors;
- Help identify and test better ways of helping persons prepare for, return to or keep employment and be productive participants in the labour force;
- Have significant learning implications for multiple stakeholders;
- Respond to a demonstrated priority or are a solution to a problem identified by community that is not being addressed through normal programming; and
- Support an OLMCs thematic/sectoral priority area (for example, sector studies).
The Government of Canada has prioritized a number of mechanisms to overcome mismatches between skills supply and demand, while reducing unemployment by using national levers to support labour mobility (for example, Labour Market Information). For OLMCs however, the migration of skilled people out of their communities can negatively impact their overall competitiveness and exacerbate challenges in attracting new opportunities and strengthening their community's vitality. Signature Projects help implement commitments made by the Government of Canada as they relate to Canada's linguistic duality, and help the department develop meaningful collaborative relationships, while engaging in dialogue and active outreach with new partners in the implementation of Signature Projects.
Signature projects also provide ESDC with a clear response to the 2014 House of Commons Standing Committee on Official Languages study on the economic situation of Canada's OLMCs. The study underscored the importance of planning and leadership for OLMCs economic development and recommended that ESDC, in collaboration with Innovation, Science and Economic Development (ISED), work to better align their programming. ISED and the Regional Development Agencies are key partners in the Economic Action Network (EAN) for OLMCs.
The EAN is the governance structure of Signature Projects. It is a cross governmental and multi-stakeholders platform that oversees the coordination, design, monitoring and assessment of projects. The delivery of Signature Projects is undertaken by well-established OLMCs economic and human resources development organizations across the country (including the Réseau de développement économique et d'employabilité (RDÉE Canada), in collaboration with 12 Francophone provincial and territorial organizations outside Quebec, as well as the Community Economic Development and Employability Corporation (CEDEC) for the English-speaking minority in Quebec).
ESDC investments, funded through the Research and Innovation Support Measure of EI Part II, contribute to advancing priority areas as identified in the 2015 to 2020 Canadian Plan for Economic Development of Official Language Minority Communities (CEPEC), including the development of sectoral studies, pursuing synergies, developing tools and supports for employers in addition to collaboratively resolving concrete challenges and problems in communities. The funding provided opportunities for government, private sector, OLMCs, as well as other stakeholders, to collaborate on economic development and employment priorities, an important determinant for the vitality of OLMCs.
Signature Projects were community-driven initiatives that built on existing good practices and designed to test innovative approaches with the potential for scaling-up in OLMCs across the country (for example,from local to multiregional).
In FY1617, Signatures Projects focused on:
- Improving local level labour market information, deepening understanding of Canada's labour markets and skills needs;
- Helping businesses access the skills needed to meet changing demands;
- Supporting labour market integration and improving workforce adaptability; as well as
- Fostering engagement, collaboration and innovation.
In addition to responding to objectives of OLMCs, Signature Projects were designed to:
- Test innovative collaborative approaches; and
- Generate lessons on outcomes related to the scalability of those projects which, once tested, can be integrated to activities delivered through the Enabling Fund program.
In FY1617, a total of eight projects received support through pan-Canadian funds. All supported government priorities related to enhancing engagement and innovation in improving skills and training, contributing to opportunities for Canadians in addition to the vitality of OLMCs.
The following describes examples of Signature Projects that were implemented in FY1617 and how they aligned with the Government of Canada priorities:
- Expansion of the successful Eco West initiative, an Enabling Fund project, to small official language communities in Ontario (less than 20,000) to support them in making the shift to more sustainable initiatives, through the development of a skilled workforce;
- Development of the Salon Virtuel (on-line) to give access to OLMCs businesses to tools and information on the recruitment and integration of skilled workers locally, nationally and internationally;
- Creation of a Canadian Francophonie Economic Observatory in cooperation with the Organisation internationale de la Francophonie;
- Elaboration of a model to identify, develop and deliver training courses for workers in the tourism sector that embed literacy and essential skills development;
- Design of curricula and partnerships to train workers in the early learning sector, including entrepreneurship-related training and literacy and essential skills development.
These projects met objectives related to the advancement of new partnerships, leveraging of resources, as well as expertise and delivery of practical initiatives in communities. Initiatives have supported OLMCs job seekers, businesses and communities. The projects contributed to enhancing OLMCs capacity and expand client reach in addition to visibility of services. Moreover, this led to the sharing of best practices across the country, which had benefited other jurisdictions. Given the positive impacts, a number of the small-scale tested projects are now being replicated in other regions and lessons learned are being applied. There is significant demand and interest from community stakeholders to expand this initiative.
Work Integration Social Enterprises research
The Work Integration Social Enterprises (WISEs) research program comprises a five year longitudinal study, composed of six main projects recommended for funding to measure the impact of social enterprises on labour market outcomes for vulnerable populations, including people with disabilities, youth, recent immigrants, homeless or individuals at risk of homelessness and Indigenous peoples. Together this series of research projects will help determine:
- WISEs' effectiveness in promoting the social and labour market integration of vulnerable individuals;
- Optimal WISE models and type of training programs; as well as
- The return on investment for government.
These six research projects recommended for funding include one project based on a quasi-experimental design and five projects based on multi-sites case studies. The projects are located in Ontario (three projects), Quebec (one project) and British Columbia (one project). They focus on different at risk groups, WISE modes of labour market integration and training programs. Some of these projects build on previous case study research. Almost all projects include cost benefit analysis and/or Social Return on Investment (SROI) of WISE interventions.
ESDC will monitor the implementation and progress of all six research projects recommended for funding through the R&I Support Measure of EI Part II.
Contingent on continued funding, the WISE research projects will recruit additional participants during the subsequent fiscal year and monitor the experience of these WISE participants for three full years. Interim research reports, as well as an annual webinar, will occur in each upcoming fiscal year and final research reports are expected in March 31, 2022.
The results of this series of projects will be integrated into a coherent outcomes database on WISEs in Canada. The database program will work directly with the six WISE research projects to gather data on participants' immediate and longer-term labour market, relevant social outcomes, characteristics of the participants themselves, the social enterprises involved and the nature of the interventions.
To complement the longitudinal WISE research program proposed here, ESDC will be undertaking an internal research agenda focused on the analysis of its Grants and Contributions database to estimate how many of these social enterprises are being funded via ESDC's programs. ESDC will also explore the feasibility of using its program administration data to estimate the relative short term effectiveness of WISEs in promoting the labour market integration of vulnerable individuals, compared to the effects achieved by other types of interventions.
This five year research program will provide valuable evidence to support the achievement of the Government of Canada and of ESDC's objectives to create a skilled, adaptable and inclusive workforce, as well as an efficient labour market. This evidence will guide policy and program funding decisions for Government of Canada investments in these areas. These objectives are partially facilitated through the emphasis on the collaboration with the not for profit sector and private business on the implementation of innovative ideas, social partnerships and social finance approaches. As such, the approach undertaken for the research program itself is an example of this type of collaboration.
This research strategy directly aligns with the Government's Social Innovation and Social Finance Strategy. It also aligns with long standing initiatives by various governments to support social enterprise as a key business model. Social enterprises are primary examples of community organizations developing innovative solutions for our society's most difficult problems, as well as adopting new sources of revenue and financing to become more sustainable and achieve greater impact. Thus, social enterprises can help stimulate inclusive economic growth since they “create jobs and develop the human capital of groups that are under represented in the labour market.”
WISEs may have the capacity to (re)integrate vulnerable populations into existing labour markets, or to create long term new jobs and, more broadly, to increase the employability of disadvantaged populations. However, the lack of empirical data on the direct labour market impact, as well as other relevant social outcomes of social enterprises for different vulnerable populations in Canada, presents a barrier to evidence based policy and program development aimed at supporting the growth of labour force participation for individuals facing multiple complex challenges.
The WISE research program has the potential to advance the Government of Canada's understanding on innovative approaches to support the training, skills development, labour market integration and job retention for individuals facing multiple complex barriers to labour market integration in Canada. The results will inform policy and program development to support vulnerable populations, by generating knowledge to fill significant information gaps. The results will also be helpful for the policy and program thinking of ESDC's suite of integrated labour market programs and initiatives and the Department's overall support for social enterprises, under the Social Innovation and Social Finance Strategy.
Achievements for WISE Research Projects in FY1617:
- Completion of the feasibility study and presentation of recommendations to senior management - May 2016;
- Intake process to obtain concept notes for WISE research projects – August to September 2016;
- Assessment of concept notes received - October 2016;
- Launch of a targeted Call-for-Proposals – November 2016; and
- Assessment of project proposals and recommendation for funding for 6 contribution agreements – January to February 2017
The conceptualization of the WISE Outcomes Database is planned for late FY1718 and its implementation, in FY1819. The estimated notional budget for the entire research program over five years is $2,200,000, dependent on annual allocation through the EI Expenditure Plan for Pan-Canadian Projects.
Labour market information
ESDC implements a National Work Plan for labour market information (LMI) services in support of the National Employment Service and to ensure consistency in the delivery of LMI across Canada. In doing so, ESDC delivers accurate and reliable labour market information to individuals and employers to help them make informed labour market decisions.
LMI helps workers manage their careers and search for jobs by providing occupational and skills information. It assists employers in recruiting, training and retaining workers. It also supports business and investment decisions by providing information on wages, labour supply and demand, as well as influencing educational programs.
LMI also strengthens Canada's economic and social union by helping the labour market function as an integrated national system. In addition, it contributes to:
- Aligning human capital investments with the needs of the economy;
- Facilitating job searches and improving job fit for individuals;
- Helping employers find or train required staff; and,
- Improving the effectiveness of public policies at all levels of government.
ESDC assesses the employment outlooks and wages for detailed occupations at the NOC 4-digit level (520 occupations for NOC 2006), at the provincial, territorial and economic region level, where data permits. ESDC disseminated outlooks on the Job Bank website in May 2015, and updated wages in November 2015. The transition to the NOC 2011 was planned and implementation efforts began including the transition of the EI application system that was converted to NOC 2011 in January 2016.
Weekly Labour Market News, monthly, quarterly and annual Labour Market Bulletins, as well as annual and/or semi-annual Environmental Scans, were also made available on the Job Bank website for all regions of the country. Additional LMI products, such as Sectoral Outlooks and Client Segment Profiles (2014 editions), were made available for some regions on Job Bank. In addition, work was undertaken to develop new tools and mobile applications to present LMI in new ways such as the use of an interactive mapping tool. The aim is that all Canadians can easily access high quality LMI about all areas of the country.
Furthermore, ESDC continued work with the provinces and territories to establish the LMI Council, which will complement existing LMI activities across Canada by identifying and implementing pan-Canadian priorities for the collection, analysis and distribution of Labour Market Information.
National employment service initiatives
Departmental operating funds also support online national employment services administered by ESDC, to help Canadians find suitable employment and help employers find suitable workers. These free, bilingual online services connect job seekers with employers, and help individuals prepare and carry out their return-to-work action plans. Job Bank is designed to improve the way information about jobs and the labour market is disseminated by reducing duplication, improving the quality of information, as well as making online labour information more accessible and easier to use.
In partnership with provinces and territories, ESDC maintains the Job Bank website, which offers an electronic labour exchange service to connect job seekers and employers as part of the National Employment Service. Job Bank provides workers with a listing of employment opportunities across Canada, to assist them with their job search. Employers can also use Job Bank to post their job vacancies online in order to find qualified candidates.
By providing information on job vacancies locally, regionally and nationally, as well as information on the education and skill requirements for in-demand occupations, Job Bank is supporting a more informed, skilled, competitive and mobile Canadian labour force.
Job Bank completed a number of online service enhancements in FY1617, including the launch of a redesigned user interface and a new Resume Builder tool. Improvements to the employer and job posting validation processes were made to better meet service standards. In Job Match, the algorithm was further optimized to provide more relevant matches and new features were introduced to help job seekers from underrepresented groups connect with suitable employment. Job Alerts was improved to provide more customizability for job seekers and better integration with Job Search. Lastly, Job Bank implemented an administrative toolset for provincial/territorial partners to access data reports and training manuals, as well as to create provincial/territorial specific content to be displayed on Job Bank based on the user's location.
As of March 31, 2017, approximately 130,000 employers had created an account on the new employer module and more than 201,000 job postings had been matched to job seekers through Job Match. Workers can also subscribe to Job Alerts to receive daily email notifications when new job opportunities become available. More than 433 million alerts were sent to over 690,000 subscribers throughout the fiscal year. In FY1617, Job Bank received more than 65 million visits and displayed more than 1.2 million job postings from over 209,000 employers, including those from provincial, territorial and private job boards.
Job Bank also offers a labour market information tools to help users understand the job market, as well as to make informed decisions related to their education and career. The tool allows users to search for labour market information including trends, wages, outlooks and education, in addition to skill requirements for a given occupation at the local, regional and national levels.
Job Bank was the focus of two different evaluations in FY1617. The Learning and Labour Market Information Evaluation found that consolidating employment and job market information on Job Bank was beneficial for Canadians. Moreover, users are generally satisfied with the services available and the information displayed on the site.
4.4 IT systems supporting agreements with provinces, territories and Indigenous organizations
The secure electronic exchange of program data between Canada and provinces and territories sustains the delivery of EBSM-Similar programming under the LMDAs. Provinces and territories exchange data with ESDC to verify EI eligibility; understand the characteristics of EI claimants; identify applicants who can benefit from EBSM-Similar programming; report on service delivery; and, refer claimants to benefit programming while on claim. ESDC uses the data received from provinces and territories to monitor, assess and evaluate their programs. The systems and applications involved in these data exchanges require ongoing maintenance and improvements to maintain high quality service delivery standards. Some of the systems also support programming to Indigenous communities through the ASETS and a Federal/Provincial data exchange called the Assignment of Benefits that helps to coordinate social assistance payments while EI claims are adjudicated.
In FY1617, ESDC continued to modernize many components of the systems and applications that enable secure electronic exchange of program data. ESDC also expanded to the province of Alberta, the use of the Targeting, Referral and Feedback application, a tool that promotes proactive engagement and complements existing processes for identifying and engaging clients. Thirdly, ESDC continued improvements to systems that process and store data for program monitoring, assessment and improvement.